
Abstract
Background:
Hyperuricemia leads to insulin resistance, whereas insulin resistance decreases renal excretion of uric acid. The aim of this study was to evaluate whether there is a correlation between serum uric acid levels with homeostatic model assessment (HOMA) 1 in nondiabetic patients.
Methods:
We evaluated 88 nondiabetic patients, in whom uric acid levels were measured, in all of them HOMA of β-cell function (HOMA 1B) and HOMA of insulin resistance (HOMA 1IR) scores were performed. Uric acid and the HOMA 1 values were correlated using the Pearson coefficient.
Results:
We did not find any correlation between uric acid levels with both HOMA 1B (r = 0.102, p = 0.343), nor with HOMA 1IR (r = 0.158, p = 0.117). When patients were analyzed by sex, we found a significant correlation with HOMA 1IR (0.278, p = 0.01), but not with HOMA 1B (0.138, p = 0.257) in women. We found a correlation with HOMA 1B in men (r = 0.37, p = 0.044), but not with HOMA 1IR: 0.203, p = 0.283. The analysis performed based on body mass index did not show correlation in the patients with normal weight, (HOMA 1B r = 0.08, p = 0.5, HOMA 1IR = 0.034, p = 0.793), nor in the patients who were overweight (HOMA 1B: r = 0.05, p = 0.76, HOMA 1IR r = 0.145, p = 0.43). However, a significant correlation between uricemia with both HOMA 1B (0.559, p < 0.001), and HOMA 1IR (0.326, p < 0.05), was observed in obese patients.
Conclusion:
Our results suggest that serum uric acid levels seem to be associated with insulin resistance in women, and in obese patients, but not in nonobese men. Uric acid also modifies β-cell function in men and in obese patients.
Introduction
Uric acid is the end-product of purine metabolism in humans; hyperuricemia has been associated with hyperinsulinemia and insulin resistance. In fact, high uric acid levels induce insulin resistance and augments circulating insulin levels through several pathways, such as activation of the renin–angiotensin system and reduction of adiponectin circulating levels. 1
Hyperinsulinemia decreases uric acid clearance by the kidneys; the mechanism is an increased proximal tubular urate transport from the glomerular filtrate to the renal interstitium by stimulation of GLUT 9, one of its major transporters, which leads to hyperuricemia. 2
In several epidemiological studies hyperuricemia has been associated with diseases related with insulin resistance, such as hypertension, 3 obesity, 1 diabetes mellitus and dyslipidemia, 4 and with cardiovascular disease and metabolic syndrome.1,3 However, it is still controversial whether high uric acid levels are a risk factor for metabolic syndrome or a consequence of lifestyle habits that favors hyperuricemia and metabolic syndrome too; indeed, some habits, as the intake of soft drinks and fructose are associated with hyperuricemia and with insulin resistance and metabolic syndrome. 5
Uric acid reduction with allopurinol improves insulin resistance in animals with metabolic syndrome and in humans. 6
Homeostatic model assessment (HOMA) of β-cell function and insulin resistance (IR) was first described in 1985 by Matthews and colleagues; 7 and has been widely used in clinical research to assess both IR, and β-cell function.8,9
To the best of the authors’ knowledge, there are no studies that evaluate the association between serum uric acid concentrations with IR, assessed with HOMA 1IR, nor with β-cell function (assessed with HOMA 1B) in nondiabetic patients, especially in a Hispanic population.
The aim of this study was to correlate serum uric acid concentrations with IR and β-cell function assessed by the HOMA 2 model in nondiabetic patients.
Methods
We evaluated 88 nondiabetic patients without history of cardiovascular disease, in whom fasting serum uric acid concentrations were measured (enzymatic method), serum glucose (glucose oxidase), creatinine (JAFFE), lipid profile (CHODPAP) and triglycerides (Triglyceride-pap) were performed too. All venous samples were collected in the morning, after a 12-h overnight fast. The determinations were performed by personnel blinded to the study. Insulin levels were measured by enzyme-linked immunosorbent assay (DiagMex, USA), also by personnel blinded to the study. In all participants IR and β-cell function were estimated by the HOMA index and this was calculated from concentrations of fasting plasma glucose (FPG) and fasting plasma insulin (FPI) according to the report by Matthews and colleagues7,8 with the formula HOMA IR = FPI in mU/l × FPG in mg/dl/405.

Body mass index (BMI) was calculated with the formula:

Normal weight was defined as BMI < 25 kg/m2, overweight as BMI between 25 kg/m² and 29.9 kg/m², and obesity as BMI > 30 kg/m².
Hyperuricemia was defined as serum uric acid values >6.5 mg/dl (386.62 mmol/l) in men and >5.1 mg/dl (303.35 mmol/l) in women.
Patients with any of the following diagnoses were excluded from the study: diabetes mellitus; heart, hepatic, or renal failure; evidence of valvular heart disease; heart block or cardiac arrhythmia; hypertension; acute coronary syndrome or cerebrovascular disease 6 months before the study’s initiation; autoimmune disease, cancer or chemotherapy, fever, history of diuretic use, alcohol abuse or psychotropic drugs.
The study was conducted with the approval of the Research and Medical Ethics Committee of our hospitals, in accordance with the Helsinki Declaration. Participants gave informed, written consent before their inclusion in the study protocol.
Statistical analysis
Data are presented as the mean ± standard deviation.
The correlation of uric acid concentrations with HOMA 2 indices was assessed with the Pearson’s coefficient.
Comparison of variables between groups of patients was performed using student’s t tests or analysis of variance (ANOVA) tests, in which a p < 0.05 was considered to be significant.
Results
Basal characteristics of patients are shown in Table 1. We did not find any correlation between uric acid levels with both HOMA 1B (r = 0.102, p = 0.343), nor with HOMA 1IR. (r = 0.158, p =0.117) in our patients.
Basal characteristics of patients.

B, β-cell; F, female; HOMA, homeostatic model assessment; IR, insulin resistance; M, male.
When patients were analyzed by sex, we found a significant correlation with HOMA 1IR (0.278, p = 0.01, Figure 1), but not with HOMA 1B (0.138, p = 0.257) in women. We found a significant correlation with HOMA 1B in men (r = 0.37, p = 0.044), but not with HOMA 1IR (0.203, p = 0.283 Figure 2). Table 2 shows the clinical differences between sexes.

Correlation between HOMA 1IR and uric acid in women.

Correlation between HOMA 1B and uric acid in men.
Clinical differences between sexes.
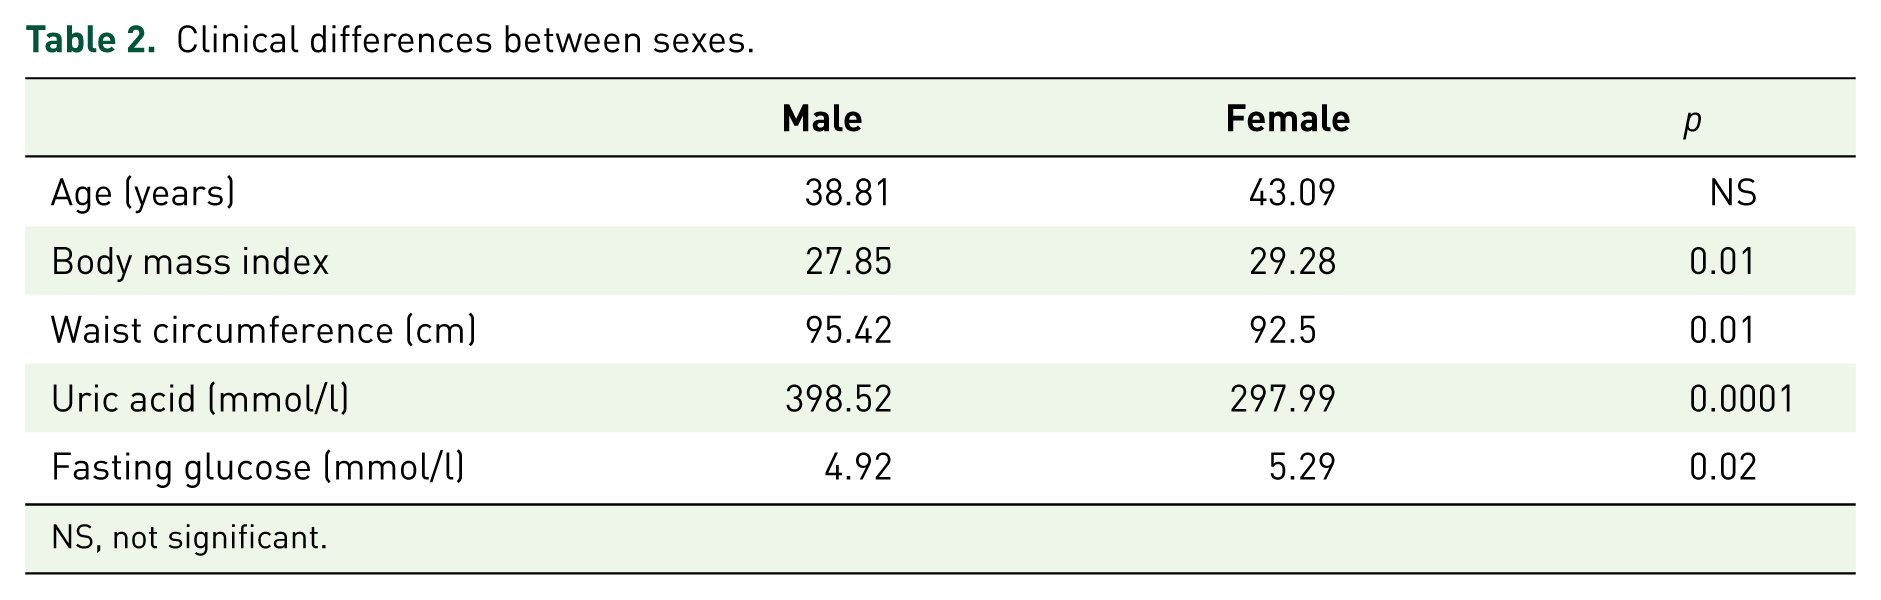
NS, not significant.
The analysis performed based on BMI did not show correlation in the 24 patients with normal weight, (HOMA 1B r = 0.08, p = 0.5, HOMA 1IR = 0.034, p = 0.793), nor in the 31 patients who were overweight (HOMA 1B: r = 0.05, p = 0.76, HOMA 1IR r = 0.145, p = 0.43). However, a significant correlation between uricemia with both HOMA 1B (0.559, p < 0.001), and HOMA 1IR (0.326, p < 0.05), was observed in the 33 obese patients (Figure 3). Table 3 shows clinical characteristics of patients according to their weight.

Correlation between HOMA 1IR and uric acid in obese.
Clinical differences by weight.

ANOVA, analysis of variance; F, female; M, male; NS, not significant.
We did not find a significant correlation between uric acid and insulin concentrations (r = 0.128, p = 0.184)
Discussion
In this study we evaluated the association between uric acid concentrations and insulin resistance (measured as HOMA 1IR); we found that hyperuricemia correlates with HOMA 1IR in obese patients and in women.
It is expected that there is an association between serum uric acid concentrations and IR, since hyperuricemia leads to IR, and hyperinsulinemia provokes increased serum uric acid concentrations. 1 Also, a chronic rise in uricemia reduces nitric oxide levels in endothelial cells, leading to endothelial dysfunction, IR and a rise in cardiovascular risk.10,11 In addition, Zhu and colleagues showed that high uric acid concentrations inhibit insulin signaling by interfering with the Insulin receptor 1 (IRS1) and Akt (a metabolic pathway stimulated by insulin) pathways, through phosphorylation of IRS1, which impairs Akt phosphorylation. 12
Sluijs and colleagues found that circulating levels of uric acid do not have a causal effect on type 2 diabetes risk, 13 and we found that uric acid does not correlate with HOMA 1IR in the 88 patients; both results are consistent with the fact that in the general population, uric acid may not have a role in the genesis of carbohydrate disorder.
Our results agree with those of Kivity and colleagues 14 who found that high serum uric acid concentrations are associated with diabetes in women, but not in men, and with those from Nagahama and colleagues, 15 who found that although hyperuricemia is a strong predictor of metabolic syndrome in both, male and female patients, the risk was higher in women. No explanation is available for this sex difference, but the distinct fat distribution between sexes, the different levels of uric acid in men and women, and the effects of estrogens on renal clearance of urate may explain it.16,17
The relationship between uric acid and insulin resistance 1 explains the correlation between uricemia and HOMA 1IR in obese patients, which suffer a greater rate of insulin resistance, that we observed in this work, besides, Tsushima and colleagues reported that adipose tissue releases uric acid; this production is enhanced in obesity, 18 both facts contribute to the explanation of why we found a greater correlation between HOMA 1IR and serum uric acid concentrations in patients with BMI > 30 kg/m². It is also important to note that in these individuals both, serum uric acid and insulin concentrations were higher. Interestingly, Norvik and colleagues found that uricemia predicted new onset impaired fasting glucose and elevated blood pressure in obese patients, but not in normal weight individuals, 19 and Simental and colleagues reported that in nonobese patients with normal glucose tolerance, hyperuricemia is associated with the increase of early and late phases of insulin release. 20
We also found a correlation between HOMA 1B and uric acid concentrations in men but not in women, and in obese patients. High uric acid concentrations decreased insulin secretion by pancreatic islets,21,22 and contributed to the metabolic alterations induced by uric acid. Although a negative correlation would be expected because it would be compatible with β-cell failure due to elevated uric acid concentrations, we do not have an explanation for our results; perhaps the increased β-cell function in patients with high uric acid concentration could be compensatory in nature.
Our results may have therapeutic implications, since the use of allopurinol improves IR in patients with asymptomatic hyperuricemia, 6 and leads to a reduction in blood pressure and weigh loss in overweigh prehypertensive patients, 23 then the use of xanthine-oxidase inhibitors may prevent the development of some components of the metabolic syndrome, this fact requires further research.
Our study has some limitations, as a transversal study, it is difficult to establish a causal relationship between hyperuricemia and IR, we only describe an association. Besides, there are few men in the obese group.
Conclusion
Our results suggest that serum uric acid concentrations seem to be more strongly associated with IR in women, and in obese patients, but not in nonobese men.
Hyperuricemia also seems to affect beta cell function, especially in men and in obese patients.
Further research will tell us if treating asymptomatic hyperuricemia is going to be beneficial in reducing the complications of hyperinsulinemia and IR, such as type 2 diabetes and hypertension, and in which patients.