
Abstract
Objective
To use a mathematical model to simulate an influenza outbreak in a school in order to assess the effectiveness of isolation (Iso), antiviral therapeutics, antiviral prophylactics (P), vaccination prior to the outbreak, and school closure (for 1 [S1w], 2 or 3 weeks).
Methods
This study developed a susceptible–exposed–infectious/asymptomatic–recovered model to estimate the effectiveness of commonly used interventions for seasonal influenza outbreaks in school.
Results
The most effective single-intervention strategy was isolation with a total attack rate of 1.99% and an outbreak duration of 30 days. The additional effectiveness of antiviral therapeutics and prophylactics and vaccination (prior to the outbreak) strategies were not obvious. Although Iso+P, P+Iso+S1w, four-, and five-combined intervention strategies had commendable effectiveness, total attack rate decreased only slightly, and outbreak duration was shortened by 9 days maximum, compared with the single-intervention isolation strategy. School closure for 1, 2 or 3 weeks was futile or even counterproductive.
Conclusion
Isolation, as a single intervention, was the most effective in terms of reducing the total attack rate and the duration of the outbreak.
Introduction
As a result of the high population density and contact frequency, school has become a high-risk locus for influenza outbreaks. In China, hundreds of outbreaks are reported in schools every year. Commonly, influenza viruses are categorized as pandemic influenza virus such as H1N1pdm, and seasonal influenza viruses including H3N2, seasonal H1N1, and B. 1 There were 2768 influenza/influenza-like illness (ILI) outbreaks between April 2005 and November 2013, of which most were seasonal influenza viruses. 1 These outbreaks do not threaten the health of large numbers of students, but they do seriously disrupt teaching and impact on the family of affected students. 2 Therefore, it is of great importance to better understand how to control and prevent influenza outbreaks in schools.
It is difficult and unethical to get a dataset from an outbreak without intervention as a comparison group, which makes it is impossible to assess the effectiveness of an intervention using field epidemiological methods. At present, mathematical modelling has become the most important and economical method for assessing potential interventions.3–6 However, there is limited mathematical modelling research that has assessed the effectiveness of controlling influenza outbreaks in schools in China. The following three key points would need to be understood in order to enable control of an influenza outbreak in a school: (i) how high the rate of transmissibility would be; (ii) how high the proportion of asymptomatic cases would be; and (iii) how to quantify the effectiveness of the intervention. In a previous study, the current authors used a mathematical model to determine the first two points 1 and also employed several statistical models to calculate the transmissibility of outbreaks in schools. 2 By using a mathematical model, the current authors also estimated the effectiveness of interventions for controlling influenza A (H1N1), also known as H1N1pdm, which has a high proportion of asymptomatic cases. 7 However, in China, the effectiveness of each countermeasure (e.g. isolation, antiviral therapeutics, vaccination and school closure) to control seasonal influenza outbreaks with a low proportion of asymptomatic cases in schools remains unclear.
In the present study, the authors built an ordinary differential equation model based on the natural history of influenza, their previously published papers1,7 and other models built previously.8,9 The parameters of the model were estimated by observing influenza outbreak data from 2011 to 2013. The model was then used to simulate an influenza outbreak in a secondary school without intervention in order to assess the effectiveness of isolation, antiviral therapeutics, antiviral prophylactics, vaccination (prior to the outbreak), and school closure.
Materials and methods
Data collection
In China, the criteria for an influenza outbreak, categorized as outbreak level A, was defined as ≥ 10 ILI cases occurring in the same school, preschool, or other collective organization within 1 week, with laboratory-confirmed influenza viruses through virus isolation or real-time reverse transcriptase–polymerase chain reaction (RT–PCR) analysis. 1 Data was also collected from subjects included in public health incidents (categorized as outbreak level B) that were defined as ≥ 30 ILI cases within 1 week. ILI refers to a fever (axillary temperature ≥ 38°C) accompanied by coughing or a sore throat. 1
A dataset (dataset A) of seasonal influenza outbreaks was constructed by collecting information on all school public health incidents (outbreak level B) reported between 1 January 2005 and 31 December 2013 in Changsha, China. Data included the type of school (such as primary school and secondary school), the school population, the date when the outbreaks were reported, the date of symptoms onset, and the subtype of influenza virus. In this present study, data from 15 seasonal influenza outbreaks in schools were collected (Figure 1 and Table 1).
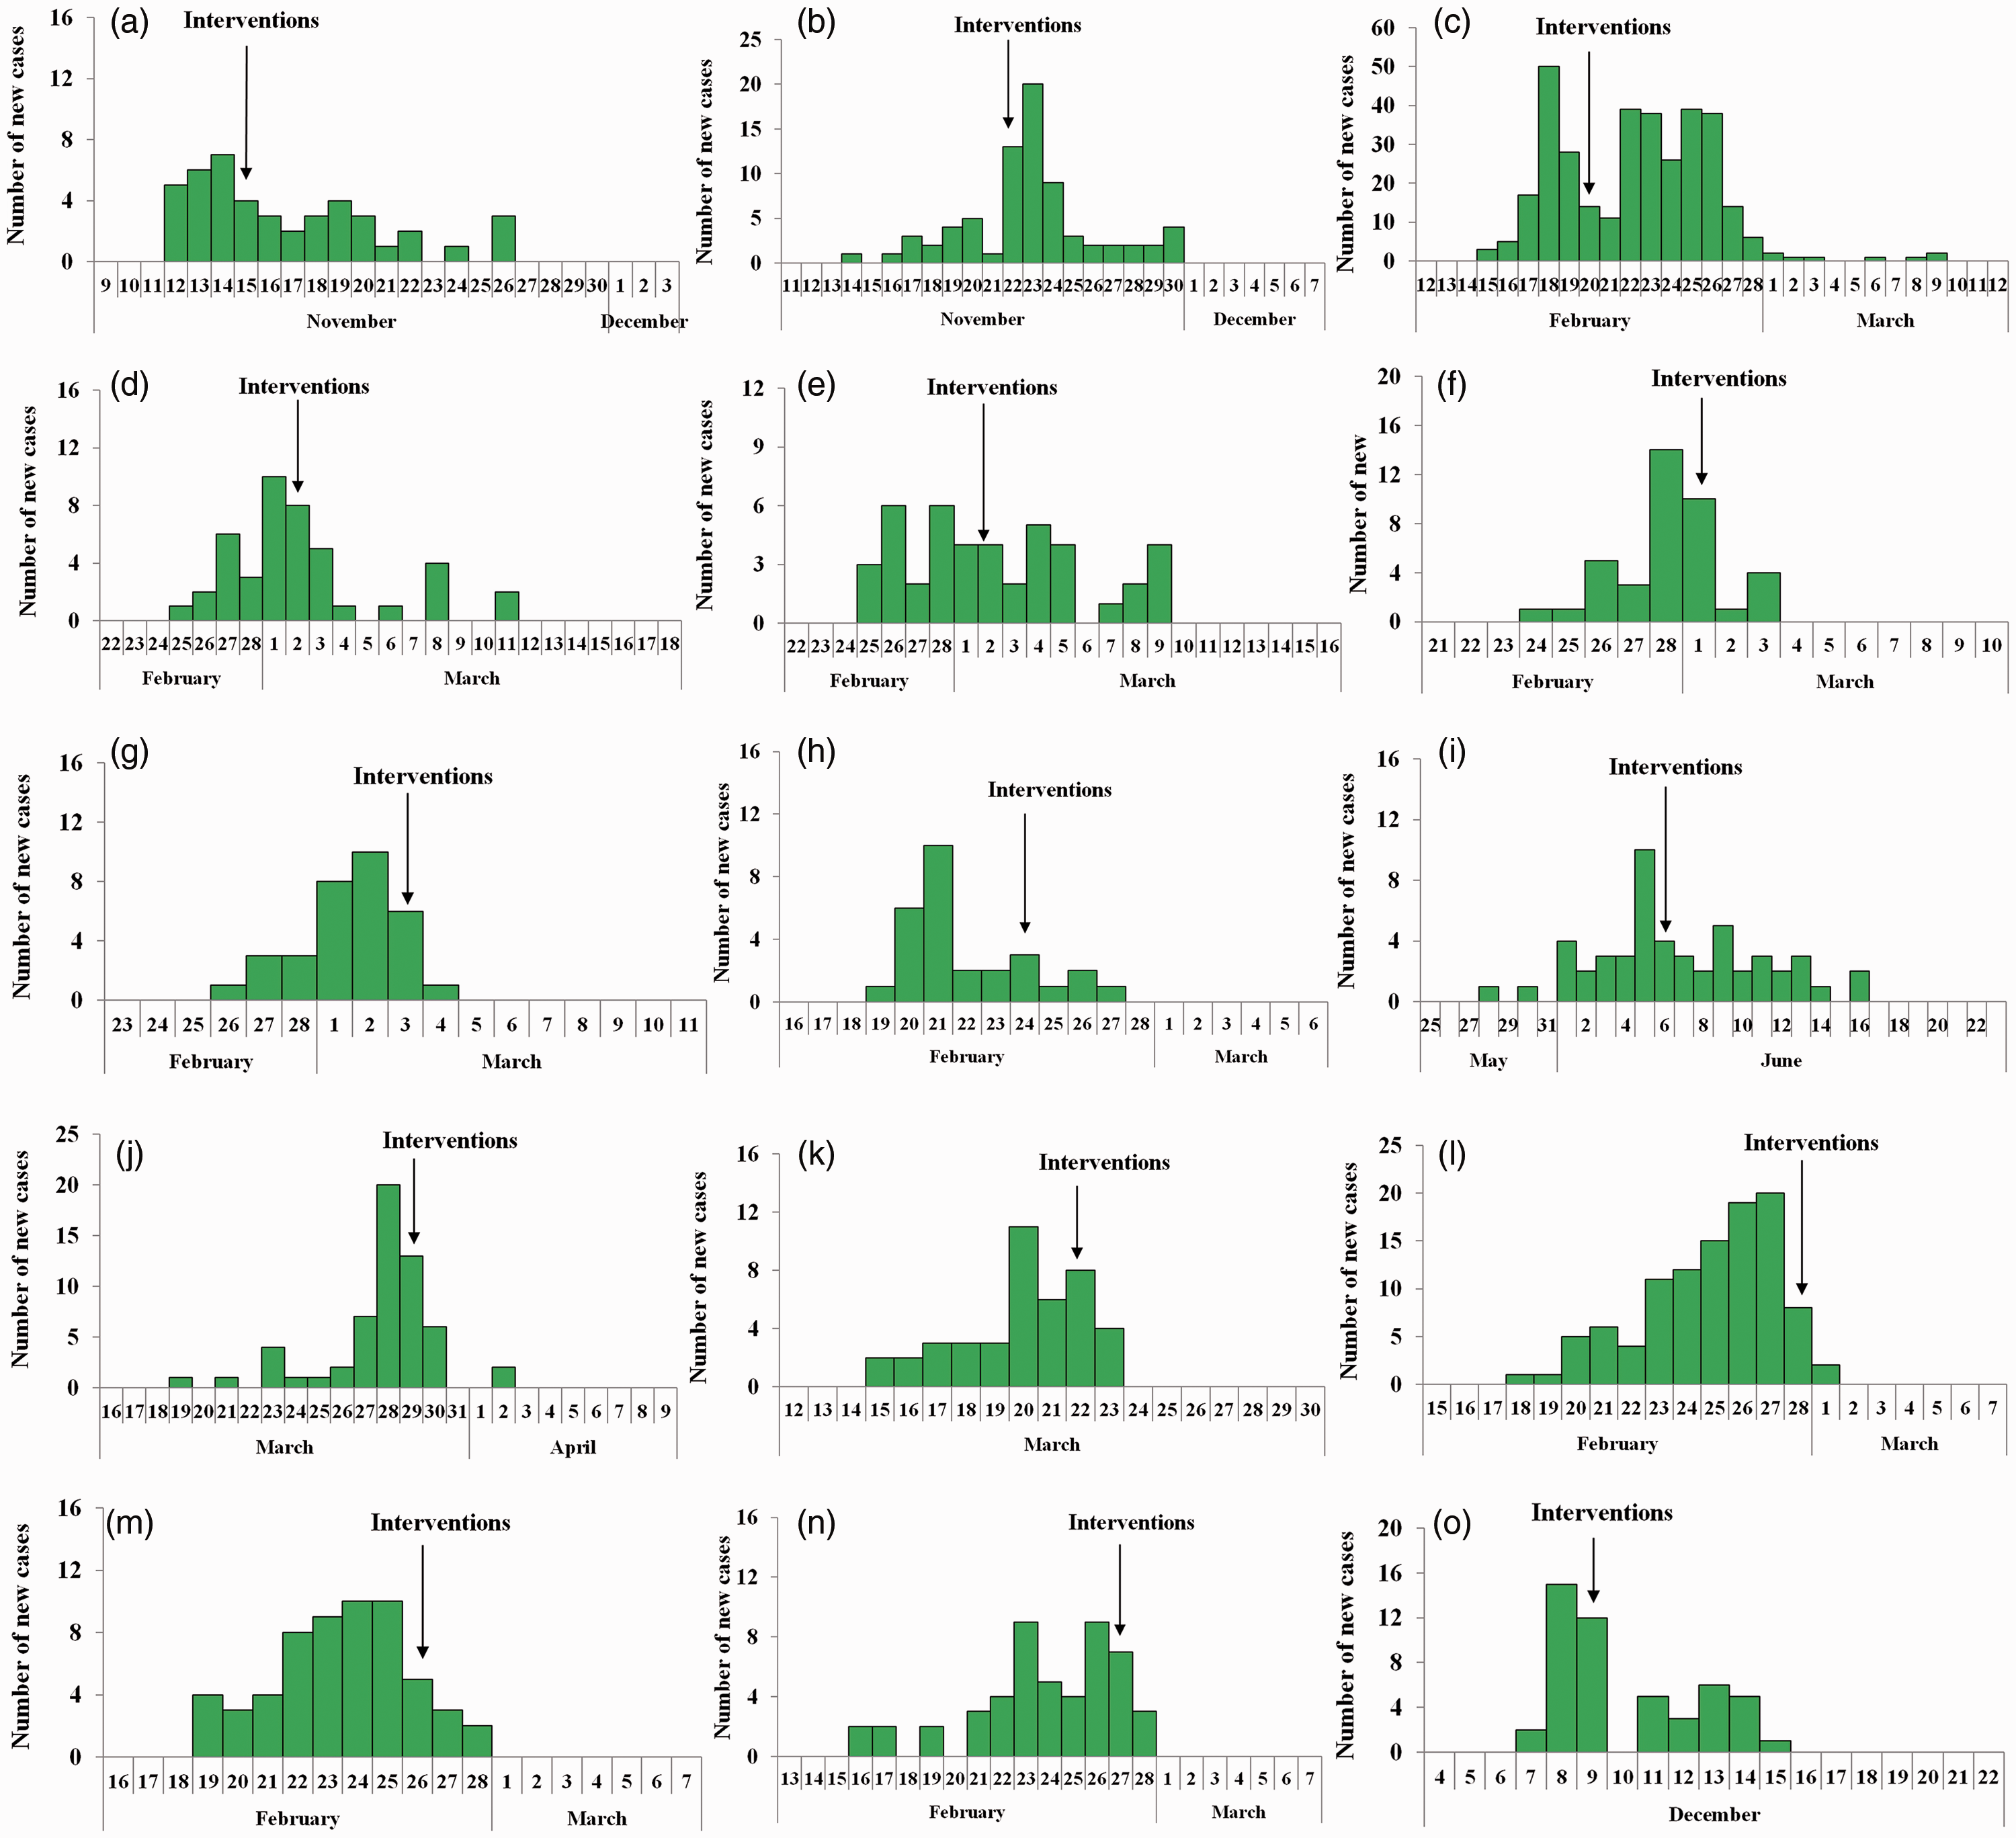
Temporal distribution of new influenza cases from 15 seasonal influenza outbreaks (a–o) in schools. Dataset A was built by collecting information on all school public health incidents (outbreak level B) reported between 1 January 2005 and 31 December 2013 in Changsha, China. Data included type of school (such as primary school and secondary school), the school population, the date when the outbreaks were reported, the date of symptoms onset, and subtype of influenza virus.
General information from 15 seasonal influenza outbreaks in schools reported between 1 January 2005 and 31 December 2013 in Changsha, China

DI, duration from illness onset date of the first case to that of the last case in an outbreak; TAR, total attack rate.
A second dataset (dataset B) was constructed from eight outbreaks including outbreak levels A and B from January 2011 to December 2013. For each outbreak, the subtype of influenza virus and duration from illness onset date to recovery date of each case was collected.
An outbreak in a secondary school was selected randomly from dataset A as a typical event from the outbreak data. On 19 November 2013, a local branch of the Changsha Centre for Disease Control and Prevention (CDC) reported an influenza outbreak in a secondary school. After investigation, there were 4872 students and 266 faculty and staff in the school. The first case developed symptoms on 12 November 2013, after which new cases increased gradually. On 19 November 2013, the local CDC implemented an investigation according to the ‘Guidelines for Dispose of Influenza-like Illness Outbreak (2012 edition)’ and ‘Influenza surveillance programme of China (2010 edition)’ announced by the National Health and Family Planning Commission of the People’s Republic of China. 1 Throat swabs for nine cases were collected on the same day, of which five were H3N2 positive and two were B (Yamagata) positive according the RT–PCR test conducted by the Changsha CDC. On 20 November 2013, interventions, including case isolation and supplementary measures (environmental disinfection, ventilation, health education, and hand hygiene), were implemented according to strategies outlined by the local CDC. The number of cases peaked on 21 November 2013, and then decreased, with the last case occurring on 29 November 2013; this permitted data collection for 74 cases with a total attack rate (TAR) of 1.52% (Figure 1b and Table 1). This typical event was used to fit the model that was built and to calculate the main parameters of the model. Based on these parameters, models with interventions including isolation, antiviral therapies, vaccination, and school closure were built to evaluate the effectiveness of these interventions alone and in combination.
Ethical Approval Statement
Notification of each influenza case was required for epidemiological surveillance. These surveillance data were used in this study, without the need for the collection of additional information (e.g. demographics) for the research. This study was approved by Medical Ethics Committee of Changsha CDC. Consent requirement, either verbal or written, was waived by the Medical Ethics Committee of Changsha CDC on the following grounds: (i) only anonymized records were used without the need for direct involvement nor active participation of patients; (ii) neither medical intervention nor biological samples were involved; and (iii) study procedures and results would not affect the clinical management of patients in any way.
Model with no intervention
According to the natural history of influenza A (H1N1), a susceptible–exposed–infectious/asymptomatic–recovered (SEIAR) model1,7,10,11 was employed for the simulation of an influenza A (H1N1) transmission. The model is expressed by differential equations as follows:

In these equations, S, E, I, A, and R refer to susceptible, exposed, symptomatic, asymptomatic, and removed individuals, respectively. dS/dt, dE/dt, dI/dt, dA/dt, and dR/dt refer to time t and the changing rates of the S, E, I, A, and R populations, respectively. β, ω, ω′, γ, γ′, κ, and p refer to transmission relative rate, incubation period relative rate, latent period relative rate, removal rate parameter of symptomatic individuals, removal rate parameter of asymptomatic individuals, parameter for the transmission rate of asymptomatic compared with symptomatic individuals, and proportion of asymptomatic infections, respectively (Table 2).1,3,4,7,10–14

E, exposed; I, symptomatic; A, asymptomatic; T, therapeutics; P, prophylactics; VP , vaccination prior to the outbreak.
Model with interventions
In this study, isolation (Iso), vaccination, antivirus therapy, school closure and combined strategies were employed for optimizing countermeasures in the typical outbreak selected from dataset A. Isolation aimed at the I population was implemented from 20 November 2013. For case isolation, infected individuals were isolated in the hospital if they reported severe symptoms like pneumonia or they were isolated at home for mild cases until all the symptoms disappeared after 2 days.2,7 The model simulated the vaccination strategy that is vaccination prior to the outbreak (VP) and δ′ was set as the proportion of VP. Considering that the vaccination rate is < 1% in China, and that it could be raised greatly through public health policies such as 47.6% among students in Beijing, 12 δ′ was set to 0.01, 0.1, 0.3, 0.476, 0.5, and 0.7. The therapeutic (T) and prophylactic (P) effectiveness of oseltamivir was evaluated. For therapeutic use, the transmissibility of the individual using oseltamivir would multiply by m (m = 0.38), and duration from illness onset to recovery would multiply by η (η = 0.7658). 13 For prophylactic use, susceptibility of S to infection would multiply by c (c = 0.7), transmissibility of A would multiply by θ (θ = 0.38), and the probability of E to infection would multiply by h (h = 0.4). 13 During a school closure, all individuals in a school returned home, and a teacher in charge of a class was required to monitor all the students in the class every day. Symptomatic-susceptible and asymptomatic-susceptible contacts are severed, causing β to have no effect in the school closure model. The model simulated school closures of 1, 2, or 3 weeks. The simulating process of these interventions were the same as our previous study. 7
A total of 25 combinations of interventions were simulated to examine their impact, in which Iso, T, P, VP70, and S1w refer to isolation, therapeutics, prophylactics, 70% of individuals vaccinated prior to the outbreak, and school closure of 1 week, respectively. For simplicity, combined strategies with two, three, four, and five interventions are referred to as two-, three-, four-, and five-combined intervention strategies, respectively.
Indicators for assessing the effectiveness of interventions
The TAR and duration of outbreak (DO) were adopted to assess the effectiveness of interventions. The two indicators were determined using the following equations:


In the equation (3), t1 and t2 refer to illness onset date of the first case and recovered date of the last case.
Estimation of parameters
According to previous studies,3,4,10,13,14 ω = 0.5263, ω′ = 0.8333, γ′ = 0.2439, and k = 0.5. Parameter γ was calculated by collecting duration from illness onset date to recovered date of each case in the selected outbreak. Parameters β and p were determined using curve fitting with the selected outbreak shown in Figure 1b.
Statistical analyses
Berkeley Madonna version 8.3.18 (University of California at Berkeley, Berkeley, CA, USA) software was employed for model simulation. Simulation methods were as described previously.1,7,10,15,16 The SPSS® statistical package, version 13.0 (SPSS Inc., Chicago, IL, USA) for Windows® and Microsoft Office Excel 2010 (Microsoft, Redmond, WA, USA) were employed for figure development and to run the data analysis by using analysis of variance (ANOVA), least significant difference test and χ2-test. Before the ANOVA test, Student–Newman–Keuls test was adopted to test the homogeneity of variances.
Results
For data analysis and curve fitting, two datasets were collected. In dataset A, data were collected from 15 influenza outbreaks in schools in Changsha, China; among which one occurred in 2005, three in 2006, two in 2007, two in 2008, five in 2009, and two in 2013 (Figure 1 and Table 1). A total of 11 of 15 outbreaks (73.33%) occurred from February to March. Seven outbreaks occurred in primary schools and eight in secondary schools. The median TAR of the 15 outbreaks was 6.10% (range 1.52–40.80%; Table 1).
In dataset B, 283 influenza cases were collected from eight outbreaks among which one outbreak was caused by influenza B, three were H1N1pdm, three were H3N2, and one was a mixed infection (H3N2 + B). The number of cases and mean ± SD infectious period of each subtype are shown in Figure 2. The infectious periods of subtypes B, H3N2, and a mixed infection of the two viruses were homogenous by using Student–Newman–Keuls test. The infectious periods were significantly different between the seasonal influenza viruses (H3N2, B or H3N2 + B mixed infection) and H1N1pdm (P < 0.001) by ANOVA. The differences between any two of the seasonal influenza viruses were not significant. However, the differences between H1N1pdm and any subtype of seasonal influenza virus (H3N2, B or H3N2 + B mixed infection) were significant (P < 0.001 for all comparisons). Considering the heterogeneous nature of the infectious periods between the seasonal and H1N1pdm influenza outbreaks, data from the 74 cases involved in the H3N2 + B mixed infection outbreak were used to calculate the mean infectious period and γ. Analysis of all data collected from this outbreak demonstrated that the mean ± SD infectious period of the mixed infection cases (H3N2 + B) was 3.65 ± 0.83 days (range 2–6 days), thus γ = 0.2740 (Figure 2d).

The number of cases and mean infectious periods for dataset B that included data from 283 seasonal influenza cases from eight outbreaks among which one outbreak was caused by influenza B (a), three were H1N1pdm (b), three were H3N2 (c), and one was mixed infection (H3N2 + B) (d).
Curve fitting analysis revealed that the daily prevalence of the outbreak fit the data to the greatest extent (χ2-test = 25.364, P = 0.188) when β = 3.0348 × 10⁻⁴ and p = 0.016 (Figure 3). The model thus reproduced the typical epidemic curve observed for a seasonal influenza outbreak in a school population.

Curve fitting of data from the baseline of the outbreak simulation from 12 November to 9 December 2013. Since a local branch of the Changsha Centre for Disease Control and Prevention investigated and implemented the actual combined strategies at day 8 in this outbreak, a susceptible–exposed–infectious/asymptomatic–recovered (SEIAR) model with no intervention was employed for curve fitting during days 0–8 (red line), and the SEIAR model with isolation was employed for curve fitting for the days thereafter (green line). Prevalence = I/N, where I is the number of infectious individuals and N is the total number of individuals. The colour version of this figure is available at: http://imr.sagepub.com.
Modelling was then undertaken to determine the effectiveness of various interventions. With no intervention, the simulated influenza outbreak spread rapidly in the school, lasting 54 days, and the TAR would reach a peak of up to 99.51%. The most effective single-intervention strategy was isolation with a TAR of 1.99% and a DO of 30 days. The next most effective single-intervention strategy was VP70. However, the effectiveness of 1-, 2-, or 3-week school closure was unsatisfactory. The TARs of these three strategies were similar to no intervention and the DOs were prolonged (Figure 4a).
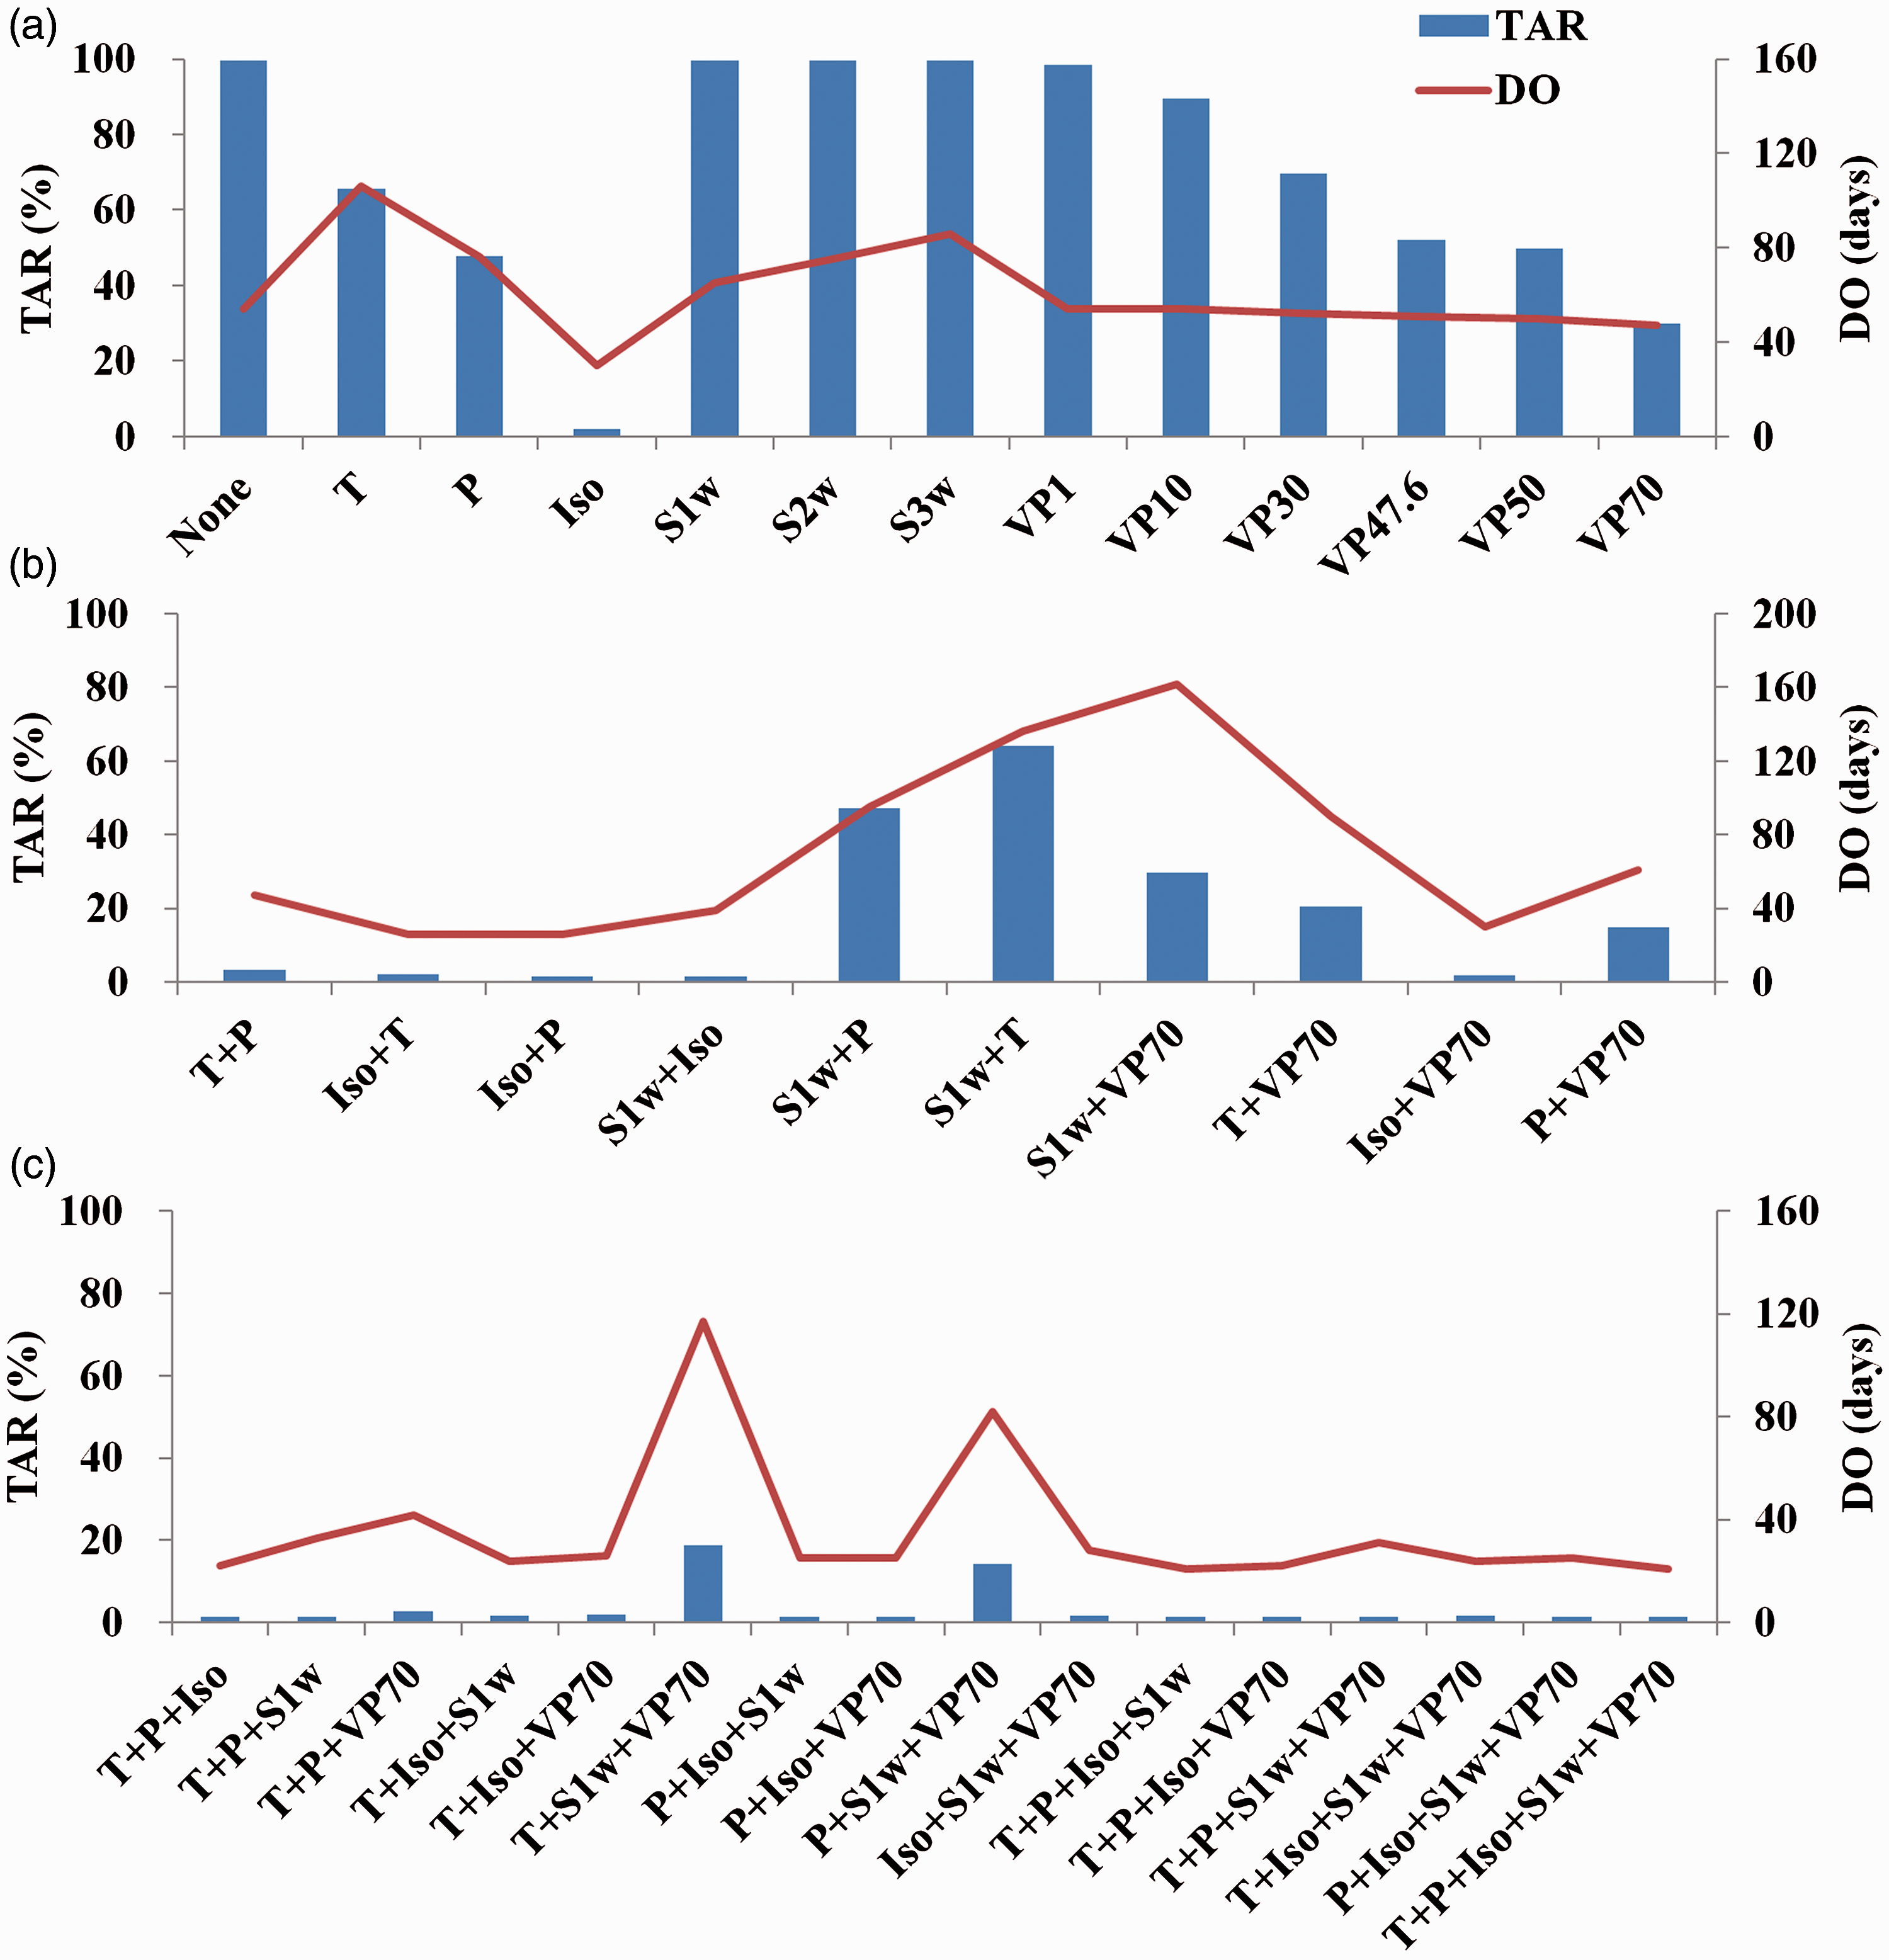
Simulated effectiveness of single and combined intervention strategies implemented on 20 November 2013: (a) effectiveness of single-intervention strategies; (b) effectiveness of two-combined intervention strategies; (c) effectiveness of three- to five-combined intervention strategies. TAR, total attack rate; DO, duration of outbreak; Iso, isolation; T, therapeutics; P, prophylactics; VP70, 70% of individuals vaccinated prior to the outbreak; S1w, school closure for 1 week; S2w, school closure for 2 weeks; S3w, school closure for 3 weeks. The colour version of this figure is available at: http://imr.sagepub.com.
The two-combined intervention strategies, including all strategies with isolation, were effective. The most effective strategy was Iso+P, for which TAR was 1.50% and DO was 26 days. Although S1w+Iso decreased TAR to 1.62%, its DO was 39 days. The next most effective two-combined intervention strategies were Iso+T and Iso+VP70. The least effective was S1w+T, with a TAR of 64.02% and a DO of 136 days, which was longer than no intervention (Figure 4b).
Most of the three-combined intervention strategies were highly effective. The most effective was P+Iso+S1w, for which TAR was 1.31% and DO was 25 days. The next most successful strategies were P+Iso+VP70, T+P+S1w, and T+P+Iso; the TARs for these three-combined strategies were similar to that of P+Iso+S1w, but the DO of T+P+S1w was much longer than the other three three-combined strategies. The least effective three-combined intervention was T+S1w+VP70, for which TAR was 18.84% and DO was 117 days, which was more than twice as much as no intervention (Figure 4c).
The four- and five-combined intervention strategies were highly effective, with DOs ranging from 21–31 days and TARs ranging from 1.29–1.56%. All strategies including isolation were similarly effective. It is noteworthy that two four-combined intervention strategies (T+P+Iso+S1w and P+Iso+S1w+VP70) had the most similar effectiveness as the five-combined intervention strategy (Figure 4c).
Discussion
There are both pharmaceutical and nonpharmaceutical interventions for containing an influenza outbreak. Pharmaceutical interventions include antiviral drugs and vaccination, and nonpharmaceutical interventions include activities such as isolation and school closure. However, because of the lack of evidence supporting the effectiveness of individual countermeasures for controlling influenza outbreaks in schools, primary public health departments in China customarily implement several interventions at the same time, which might not be the best strategy for optimizing the use of health resources.
The results of the χ2-test showed high goodness-of-fitness of the current model with the reported data, suggesting that the SEIAR model was suitable for this study and can be used to assess the effectiveness of the countermeasures to control seasonal influenza outbreaks in schools. The simulated results of this current model showed that isolation was a single-intervention strategy that had similar TAR and DO compared with a five-combined intervention strategy, while the other single-intervention strategies had negligible effects on outbreak prevention. Although Iso+P, P+Iso+S1w, and four-, and five-combined intervention strategies had commendable effectiveness, TAR decreased only slightly, and DO was shortened by 9 days maximum, compared with the single-intervention isolation strategy. Furthermore, the disadvantages of antiviral therapeutics and prophylactics exceeded their advantages. 7 Thus, if isolation can be implemented in a timely manner, therapeutic and prophylactic use of oseltamivir is not recommended for a seasonal influenza outbreaks in schools. Drugs to relieve symptoms can be used as therapeutic agents.
With timely implementation of isolation, the additional effect of vaccination was inconspicuous in the current model. Although there was no obvious positive effect of adding VP to the model, increasing the immunological barrier by adding VP could lessen the burden of isolation during an outbreak. Thus, in practice, vaccination rates in schools need to be improved before the beginning of each influenza season.
After the influenza A H1N1 pandemic of 2009, school closure has become a common strategy of the local CDC offices to control influenza outbreaks in China. Nevertheless, the results of this current study revealed that it is not necessary to implement school closure in an influenza outbreak. The effectiveness of school closure for 1, 2, or 3 weeks was worse than no intervention, with similar TARs but longer DOs. Moreover, the school curriculum would be disrupted by the prolonged closure, and families would be burdened with the care of their children and any resultant educational problems.
This current study was limited by the fact that it did not consider the interaction between school and community in the model. Although the incidence of influenza in the community is normally significantly lower than that in school, there might be a potential transmission between the students and their family members or neighbours during the school closure period. It was also limited by the fact that the efficacy of vaccination was assumed to be 100%, as stated in our previous study. 7
In conclusion, isolation, as a single intervention, was the most effective in terms of reducing the total attack rate and the duration of the influenza outbreak in schools. These findings are totally different to the results of our previous study. 7 The differences between the results of the two modelling studies are due to the different proportion of asymptomatic individuals during pandemic and seasonal influenza outbreaks. 7 Consequently, in future influenza outbreaks in schools, differences should be made between H1N1pdm and seasonal influenza viruses, and mathematical simulation results could be used as a reference to improve the efficiency of prevention and control measures. In addition, the models should be run again including more scenarios for the intervention dynamics if the rate of transmissibility changes due to a mutation of the virus during a long-term outbreak.
Footnotes
Declaration of conflicting interests
The authors declare that there are no conflicts of interest.
Funding
This study was support by the Scientific Research Programme of Health and Family Planning Commission of Hunan Province (no. B2016224).