
Abstract
Objective:
MicroRNAs (miRNAs) regulate gene expression and are involved in diabetic kidney disease (DKD) pathogenesis. We investigated circulating miRNA-194 levels as a biomarker of DKD prevalence and incidence, and the relationship between miRNA-194 and CCAAT/enhancer binding protein (C/EBP) homologous protein (CHOP).
Methods:
We recruited 136 type-2 diabetes mellitus (T2DM) patients at the First People’s Hospital of Lianyungang and 127 healthy individuals. Circulating miRNA-194 and CHOP levels were measured using quantitative reverse transcription qRT-PCR and enzyme-linked immunosorbent assay (ELISA), respectively. Anthropometric and biochemistry measurements were also made.
Results:
T2DM patients showed higher circulating miRNA-194 (p = 0.029) and lower circulating CHOP (p < 0.001) levels than controls. Circulating miRNA-194 levels were significantly higher in T2DM patients with a microalbumin/creatinine ratio (UmALB/Cr) ⩾ 300 mg/g (p < 0.001). In addition, there were significant intergroup differences in the circulating CHOP concentrations (p = 0.005). Bivariate analysis revealed that circulating miR-194 levels were negatively correlated with alpha-fetoprotein and CHOP levels (r = −0.222, −0.301; p = 0.018, 0.001, respectively), but positively correlated with fasting glucose, UmALB/Cr, Cr, Cystatin C, quantitative insulin check index (QUICKI) (r = 0.193, 0.446, 0.260, 0.339, and 0.250, respectively; p = 0.036, <0.001, 0.005, <0.001, and 0.006, respectively), particularly UmALB/Cr and Cystatin C (p < 0.001). Logistic regression analysis after adjusting for covariates associated with UmALB/Cr identified duration of T2DM, systolic blood pressure, Cr, estimated glomerular filtration rate, and waist circumference as independent factors associated with T2DM patients with UmALB/Cr > 300 (p = 0.030, 0.013, <0.001, <0.001, and 0.031, respectively).
Conclusion:
Circulating miRNA-194 levels could be a novel biomarker for DKD.
Keywords
Introduction
As a microvascular complication of diabetes, diabetic kidney disease (DKD) is the principal cause for end-stage renal disorder (ESRD). 1 Millions of people worldwide are affected by DKD, which is an important public health problem. Under normal conditions, microalbuminuria is used for diagnosing DKD early and for its monitoring; however, microalbuminuria is also affected by other factors and often does not accurately reflect DKD. Renal biopsy can be used to diagnose and monitor disease progression, but its use in clinical practice is limited as it is highly invasive and is associated with risk of complications. Therefore, it is necessary to identify novel markers for DKD diagnosis with greater specificity and sensitivity. MicroRNAs (miRNAs) are regulatory RNAs that are 19–25 nucleotides long and reduce the translation as well as the stability of mRNA targets via defective base pairing in their 3′ untranslated region. 2 Accumulating evidence shows that miRNAs play important roles in regulating gene expression during DKD pathogenesis 3 and can be possible biomarkers or therapeutic targets.4–6 Circulating miRNAs in the blood are considered as biomarker discovery using screening approaches.7,8 Jaeger et al. 9 reported that circulating miRNA-194 is related to the occurrence of diabetes mellitus (DM). A meta-analysis conducted in 2018 showed that miR-194, miR-192, miR-215, miR-342, miR-30, and miR-133b were significantly correlated with urinary albumin excretion rates, suggesting that miRNAs potentially take part in DKD pathogenesis. 10 Another meta-analysis conducted by the same authors did not identify miR-194;11–13 however, this was likely due to insufficient evidence for this miRNA.
Several studies reported endoplasmic reticulum (ER) stress as an important player in the DKD pathogenesis, which could be useful as a therapeutic target for the clinical management of kidney disease. 14 Megacluster miRNAs are known to target multiple genes with diverse functions and roles in protein synthesis, ER stress, RNA binding, and DKD. 15 The presence of ER stress has been detected in patients with progressive DKD. 16 CCAAT/enhancer binding protein (C/EBP) homologous protein (CHOP) is known to play a critical role in apoptosis induced by ER stress. 17 CHOP contains a transcriptional activation threshold at its N-terminus and an alkaline zinc finger domain at its C-terminus. CHOP expression can significantly affect cell survival. Each of the three ER stress pathways can induce the expression of the C/EBP source protein, CHOP, which is also known to be induced by growth arrest and DNA damage 153, 18 is a translocation factor unique to ER stress. 18 In basal conditions, expression of CHOP, a predominantly cytosolic protein, is maintained at a lower level. ER stress substantially increases the expression of CHOP, which migrates to the nucleus upon activation. 19
Overexpression of CHOP stimulates apoptosis or cell cycle arrest 20 and protects cells from apoptosis. 21 CHOP is an important regulator of the miRNA cluster transcription 15 that controls the expression of other genes involved in diabetic nephropathy (DN), with a cell-specific effect in the kidney. 22 Aged diabetic mice were reported to have increased renal CHOP expression, ER stress, and albuminuria. Albuminuria was attenuated in diabetic CHOP knockout mice compared with wild-type mice. 23 It has been reported that the ER stress response (including elevated expression of CHOP and XBP-1) is activated in patients with progressive DN and diabetic animals.16,23,24 Even though the transcriptional regulatory role of CHOP, the ER stress marker that induces apoptosis in kidney injury, is controversial, 25 it has been shown that CHOP-deficient mice are resistant to DN and to ER stress-induced apoptosis. 23 Consistent with this, CHOP expression was markedly elevated in diabetic mice compared with controls. However, few studies have been reported in Chinese patients with DKD due to type-2 DM (T2DM). Therefore, the underlying pathophysiological mechanisms are not understood, hindering the development of methods for DKD diagnosis and measurement of disease progression.
We here describe the results from an initial observational study with the focus to provide initial evidence for miRNA-194 as a useful early biomarker for the complications of T2DM and DKD. We also report the relationship between miRNA-194 and CHOP in Chinese patients with T2DM, particularly those with different severity levels of microalbuminuria.
Materials and methods
Study design
Study area and setting
This study enrolled 136 T2DM patients hospitalized at First People’s Hospital of Lianyungang, China and 127 healthy controls from a medical examination center. All patients were treated at the Department of Endocrinology and Metabolism of this hospital during the period of July 2019 to December 2019. Diagnosis of T2DM was confirmed in accordance with the 2014 American Diabetes Association diagnostic criteria. 26 Diabetes was defined fasting glucose ⩾7.0 mmol/L, glycated hemoglobin (HbA1c) ⩾6.5%, or 2 h post-load oral glucose tolerance test (OGTT) plasma glucose levels ⩾11.1 mmol/L. Patients were distributed into two groups on the basis of their microalbumin levels: group A, UmALB/Cr <300 mg/g and group B, UmALB/Cr ⩾ 300 mg/g. Healthy controls were confirmed as having normal glucose tolerance (NGT) using a 75-g OGTT. NGT was defined as fasting glucose levels <6.1 mM, 2-h post-OGTT blood glucose <7.8 mM, and HbA1c <5.7%.
Selection criteria
A detailed questionnaire was completed by each participant to collect data on disease and smoking history, drug use, and alcohol consumption. Exclusion criteria included secondary diabetes; type-1 DM (T1DM); thyroid disorders or Cushing’s syndrome; treatment with systemic corticosteroids; infection or inflammation; acute or chronic viral hepatitis; heart, liver, or renal failure; pregnancy; and malignant tumor. Approval for the study protocol was obtained from the Ethics Committee of the First People’s Hospital of Lianyungang and all participating patients gave written informed consent to take part in the study (ethical approval ID: 20180523002). Study details were clarified to the participating patients and who provided their informed consent. The study was conducted in keeping with the guidelines set out in the Declaration of Helsinki.
Anthropometric and biochemical measurements
Anthropometric data collection
Anthropometric and clinical characteristics were collected from hospital case files. Weight, height, hip circumference (HC), and waist circumference (WC) were obtained by trained nurses. Body mass index (BMI) was calculated as weight (kg) divided by height squared (m2). Waist-to-hip ratio was determined as WC divided by HC. Prior to measuring blood pressure, patients were maintained in a sitting position and allowed to rest for a minimum of 10 min. Blood pressure measurement was taken three times daily using an electronic sphygmomanometer (Omron).
Biochemical measurements
The average of three values was calculated for all biochemical measurements. Venous blood samples were taken after an overnight fast for at least 12 h. Blood samples were taken at 07:00–08:00 AM and were centrifuged to separate the serum. Fasting glucose, C-peptide, insulin, Cr, blood urea nitrogen (BUN), neuron-specific enolase, serum uric acid, cystatin C (Cys-C), alpha-fetoprotein (AFP), carcinoembryonic antigen (CEA), carbohydrate antigen 19–9, D-dimer, and serum lipids (triglycerides, total cholesterol, high-density lipoprotein cholesterol, and low-density lipoprotein cholesterol) levels were measured using a Beckman Coulter AU5800 Clinical Chemistry analyzer (Beckman Coulter, Inc, Brea, CA, USA). HbA1c was assessed using a high-performance liquid chromatography system (Beckman Coulter, Inc.).
Measurements of insulin secretion and insulin sensitivity/resistance
Homeostatic model assessment of insulin resistance (HOMA-IR) was used to assess insulin resistance as follows: HOMA-IR = (fasting glucose (mmol/L) × fasting insulin (mIU/L))/22.5. 27 Homeostasis model assessment of β-cell function (HOMA-β) was calculated as insulin secretion measurements using the formula: HOMA-β = fasting insulin (mIU/L) × 20/(fasting glucose (mmol/L) − 3.5).27,28 QUICKI, an index of insulin sensitivity, was calculated with the formula: QUICKI = 1/(log10 fasting glucose (mg/dL) + log10 fasting insulin (mIU/L)). 29
Categories of renal function severity
UmALB/Cr, Cys-C, BUN, and Cr were measured using a Beckman Coulter AU5800 analyzer (Beckman Coulter, Inc, USA). Estimated glomerular filtration rate (eGFR) was employed to assess kidney function using the Chronic Kidney Disease Epidemiology Collaboration (CKD-EPI) formula. 30 The eGFR used in area under the curve (AUC) receiver operating characteristic (ROC) for miRNA-194, cystatin c, and other covariables was calculated using creatinine measured on the same day as miRNA194.
Measurement of circulating miRNA-194 levels
Serum was collected by centrifuging the blood samples, and sera were kept at −80°C until used for laboratory analyses. Extraction of total RNA was performed using the MagMAX mirVana RNA Isolation Kit (Applied Biosystems, USA, catalog number: A27828) as described in the manufacturer’s brochure. Total RNA was used for cDNA synthesis employing oligo (dT) primers and reverse transcriptase. Amplification of the target cDNA was conducted using the following forward and reverse primer sequences: cel-miR-39, UCACCGGGUGUAAAUCAGCUUG; Mature miRNA Sequence, Applied Biosystems). Cel-miR-39 was used as internal control. Samples were screened for miRNA-194 expression using quantitative reverse transcription polymerase chain reaction (RT-PCR) analysis (TaqMan Universal MasterMix II, Applied Biosystems, USA, catalog number: 4440038) on a 7500HT Fast quantitative RT-PCR System (Applied Biosystems, Foster City, California, USA) as suggested by the manufacturer. Amplification curves were assessed using SDS 2.4 software (Applied Biosystems, USA) using the 2−ΔΔCt method, where ΔΔCt refers to the difference between the cycle threshold of the target cDNA and an endogenous reference.
Measurements of circulating CHOP
Serum samples obtained from the centrifugation of blood samples were kept at −80°C until further analyses. Circulating CHOP levels were measured using commercially available enzyme-linked immunosorbent assay (ELISA) kits (Cloud-Clone Corp, Wuhan, CN) in accordance with the manufacturer’s instructions. The detection range of the CHOP assay was 0.156–10 ng/mL. The lower detectable level of CHOP was usually <0.065 ng/mL. The coefficients of variation for inter-assay and intra-assay were <12% and 10%, respectively.
Statistical analysis
All statistical analyses were performed using SPSS version 22.0 (SPSS Inc., Chicago, IL, USA), and graphs were created using GraphPad Prism 8 (GraphPad Software, La Jolla, California). Chi-square test was performed when categorical data comparisons were made. Mann–Whitney U-test of variance was conducted to compare differences of continuous variables between two groups. Data distribution was assessed using Kolmogorov–Smirnov test. Normally distributed data were shown as mean ± SD, and median (25th–75th interquartile range) showed results with skewed distribution. For multiple testing among groups, Mann–Whitney U-test was performed using Bonferroni correction. Bivariate correlations analysis was conducted between circulating miRNA-194, CHOP, and other variables. Multiple stepwise regression analysis was done to control the covariates for identifying independent factors related to circulating miRNA-194 and CHOP. Data that did not follow normal distribution were log-transformed (e.g. log-miRNA-194, CHOP) before conducting correlation analysis and multiple stepwise regression analysis. A logistic regression model was constricted to control for confounders and assess whether there was an independent relationship between the circulating miRNA of interest and DKD. ROC curves were created to ascertain whether circulating miRNA-194 and CHOP levels could be a viable biomarker of DKD and assess the AUC and cutoff value. All statistical analyses were two-sided and p values < 0.05 were considered statistically significant.
Results
Clinical and laboratory parameters of study participants
The clinical parameters of the 136 T2DM patients and 127 health controls are presented in Table 1. There were no sex- and age-based differences between the two groups. Circulating miRNA-194 levels were significantly higher in T2DM patients as compared with the control group (p = 0.029). Circulating CHOP levels were significantly lower in T2DM patients as compared with the control group (p < 0.001).
General clinical and laboratory parameters of study participants.
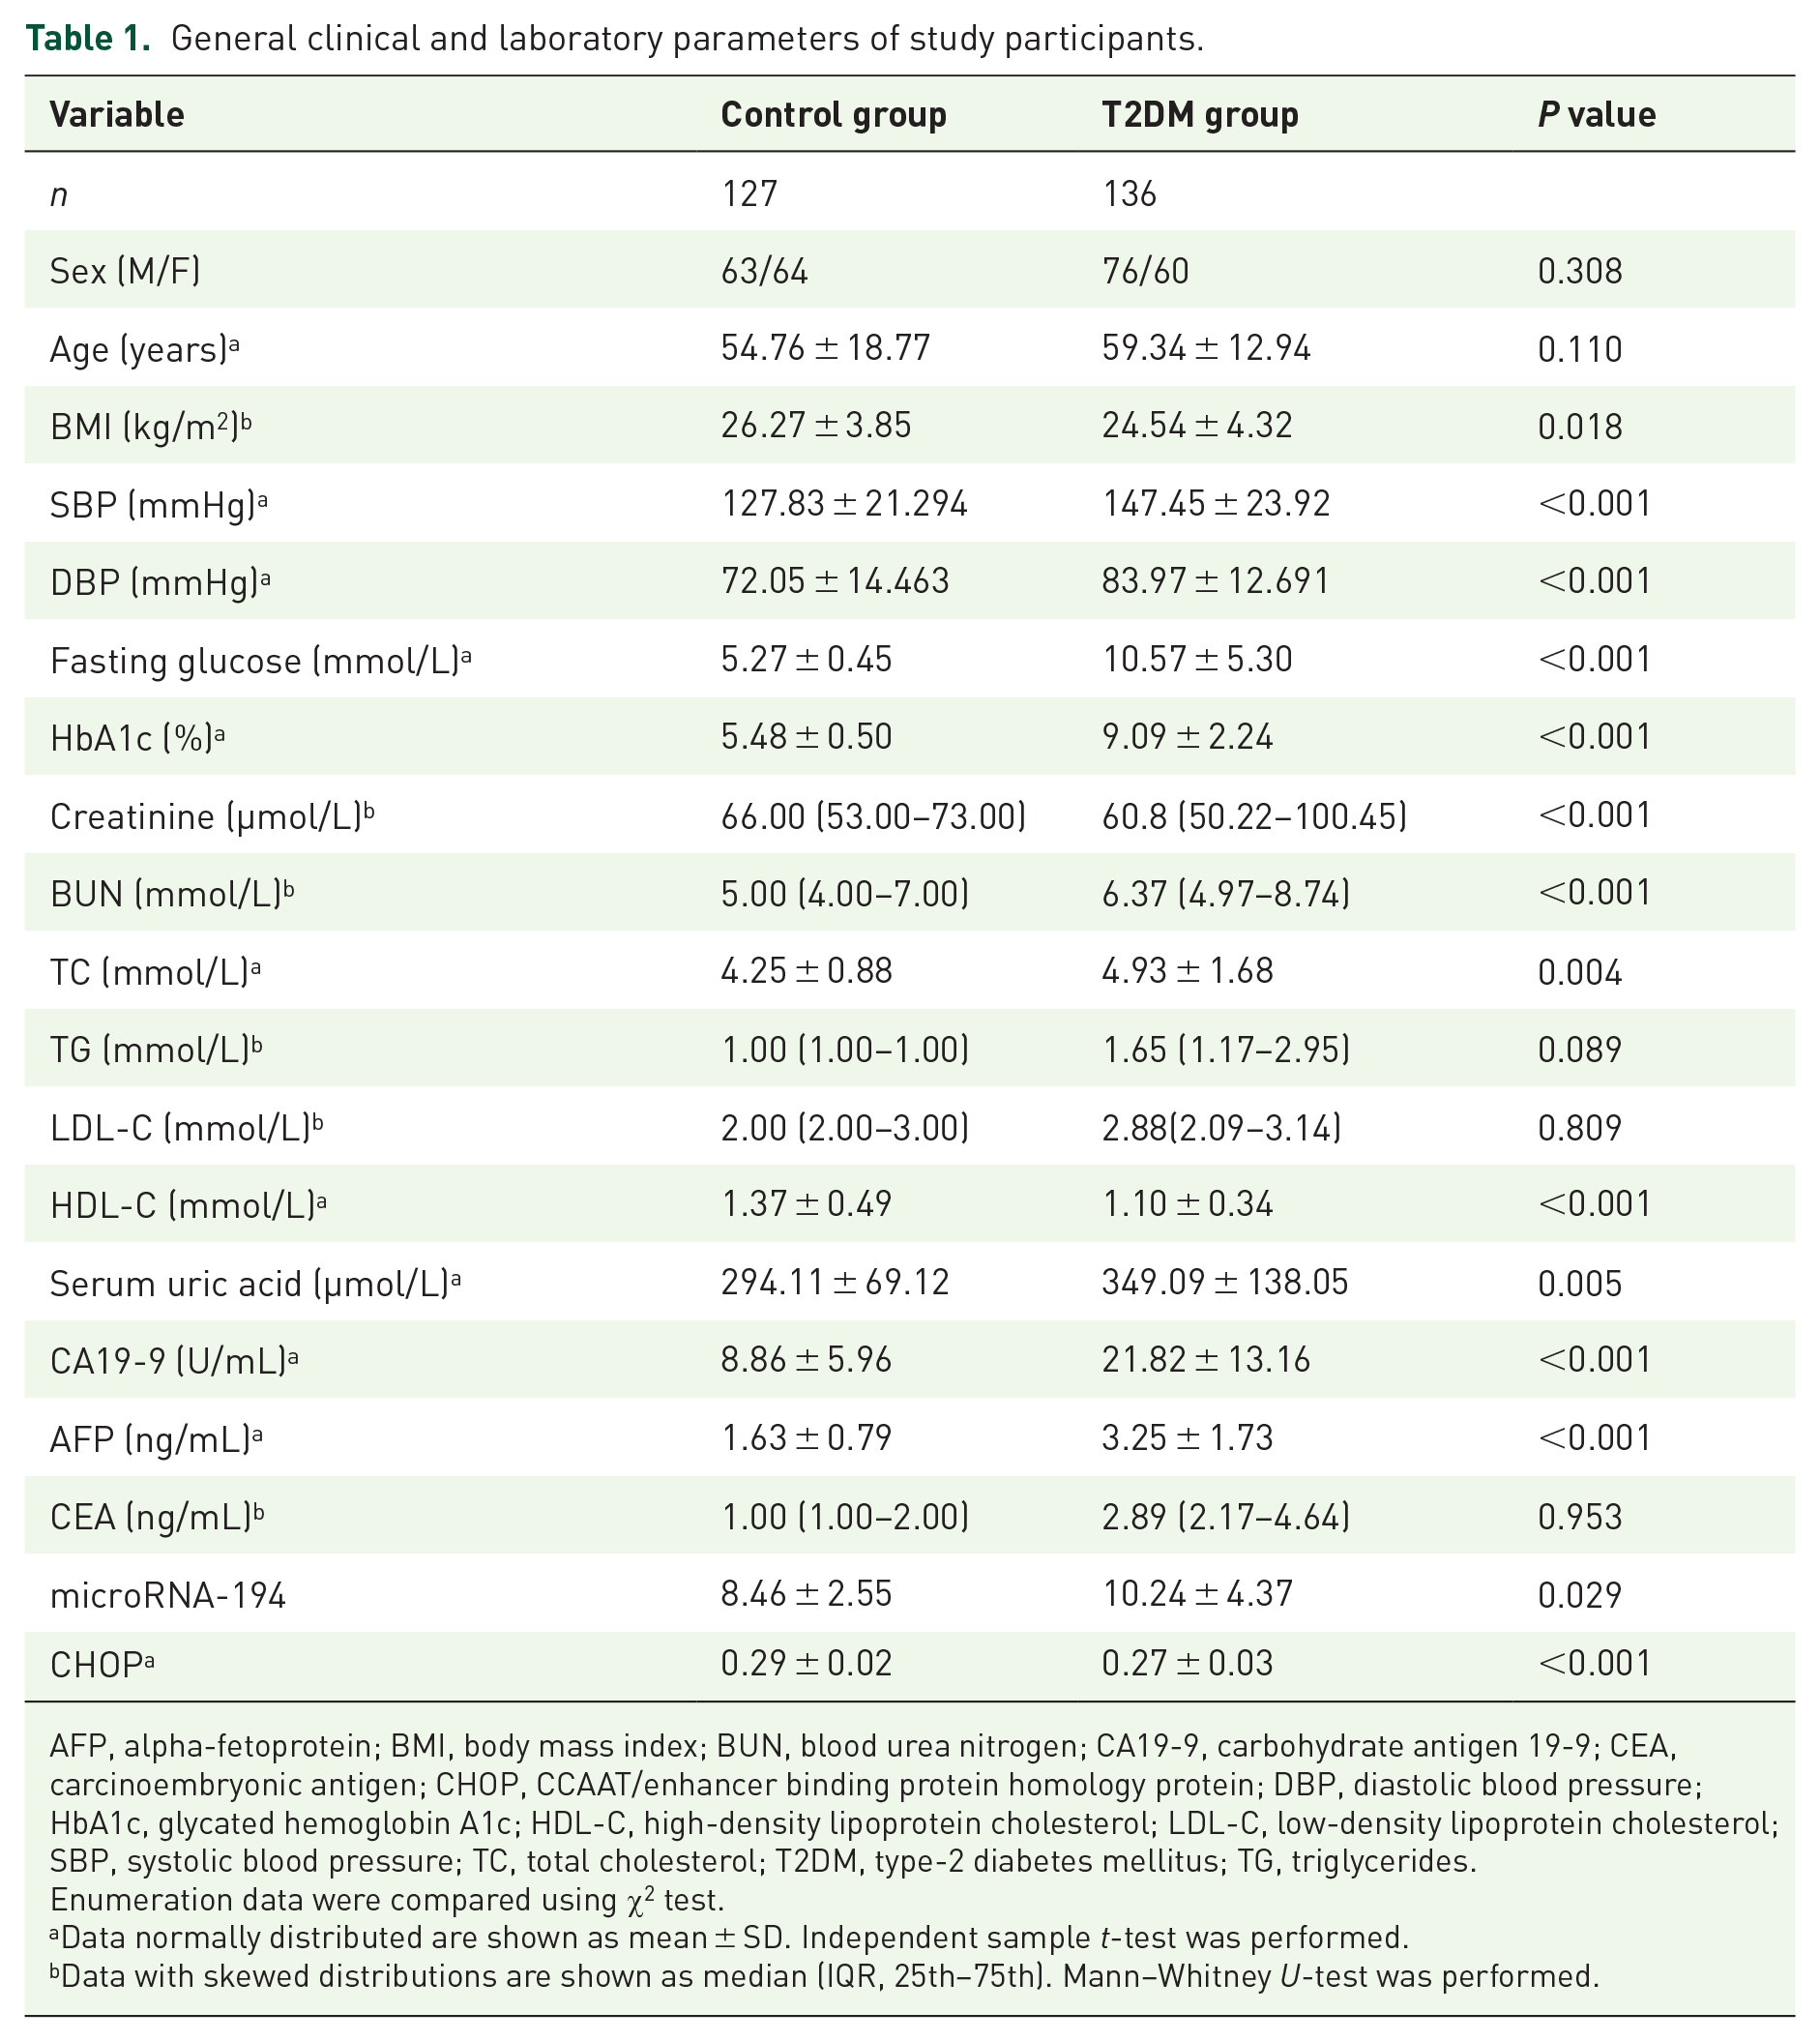
AFP, alpha-fetoprotein; BMI, body mass index; BUN, blood urea nitrogen; CA19-9, carbohydrate antigen 19-9; CEA, carcinoembryonic antigen; CHOP, CCAAT/enhancer binding protein homology protein; DBP, diastolic blood pressure; HbA1c, glycated hemoglobin A1c; HDL-C, high-density lipoprotein cholesterol; LDL-C, low-density lipoprotein cholesterol; SBP, systolic blood pressure; TC, total cholesterol; T2DM, type-2 diabetes mellitus; TG, triglycerides.
Enumeration data were compared using χ2 test.
Data normally distributed are shown as mean ± SD. Independent sample t-test was performed.
Data with skewed distributions are shown as median (IQR, 25th–75th). Mann–Whitney U-test was performed.
Clinical and laboratory measurements in patients with DKD
As shown in Table 2, circulating miRNA-194 concentrations were significantly increased in patients with DKD according to UmALB/Cr level (P < 0.001). Significant differences were observed in circulating CHOP concentrations (p = 0.013; Figure 1(b)). Table 2 shows the clinical and biochemical measurements of patients with DKD.
General clinical and laboratory parameters in patients with DKD.
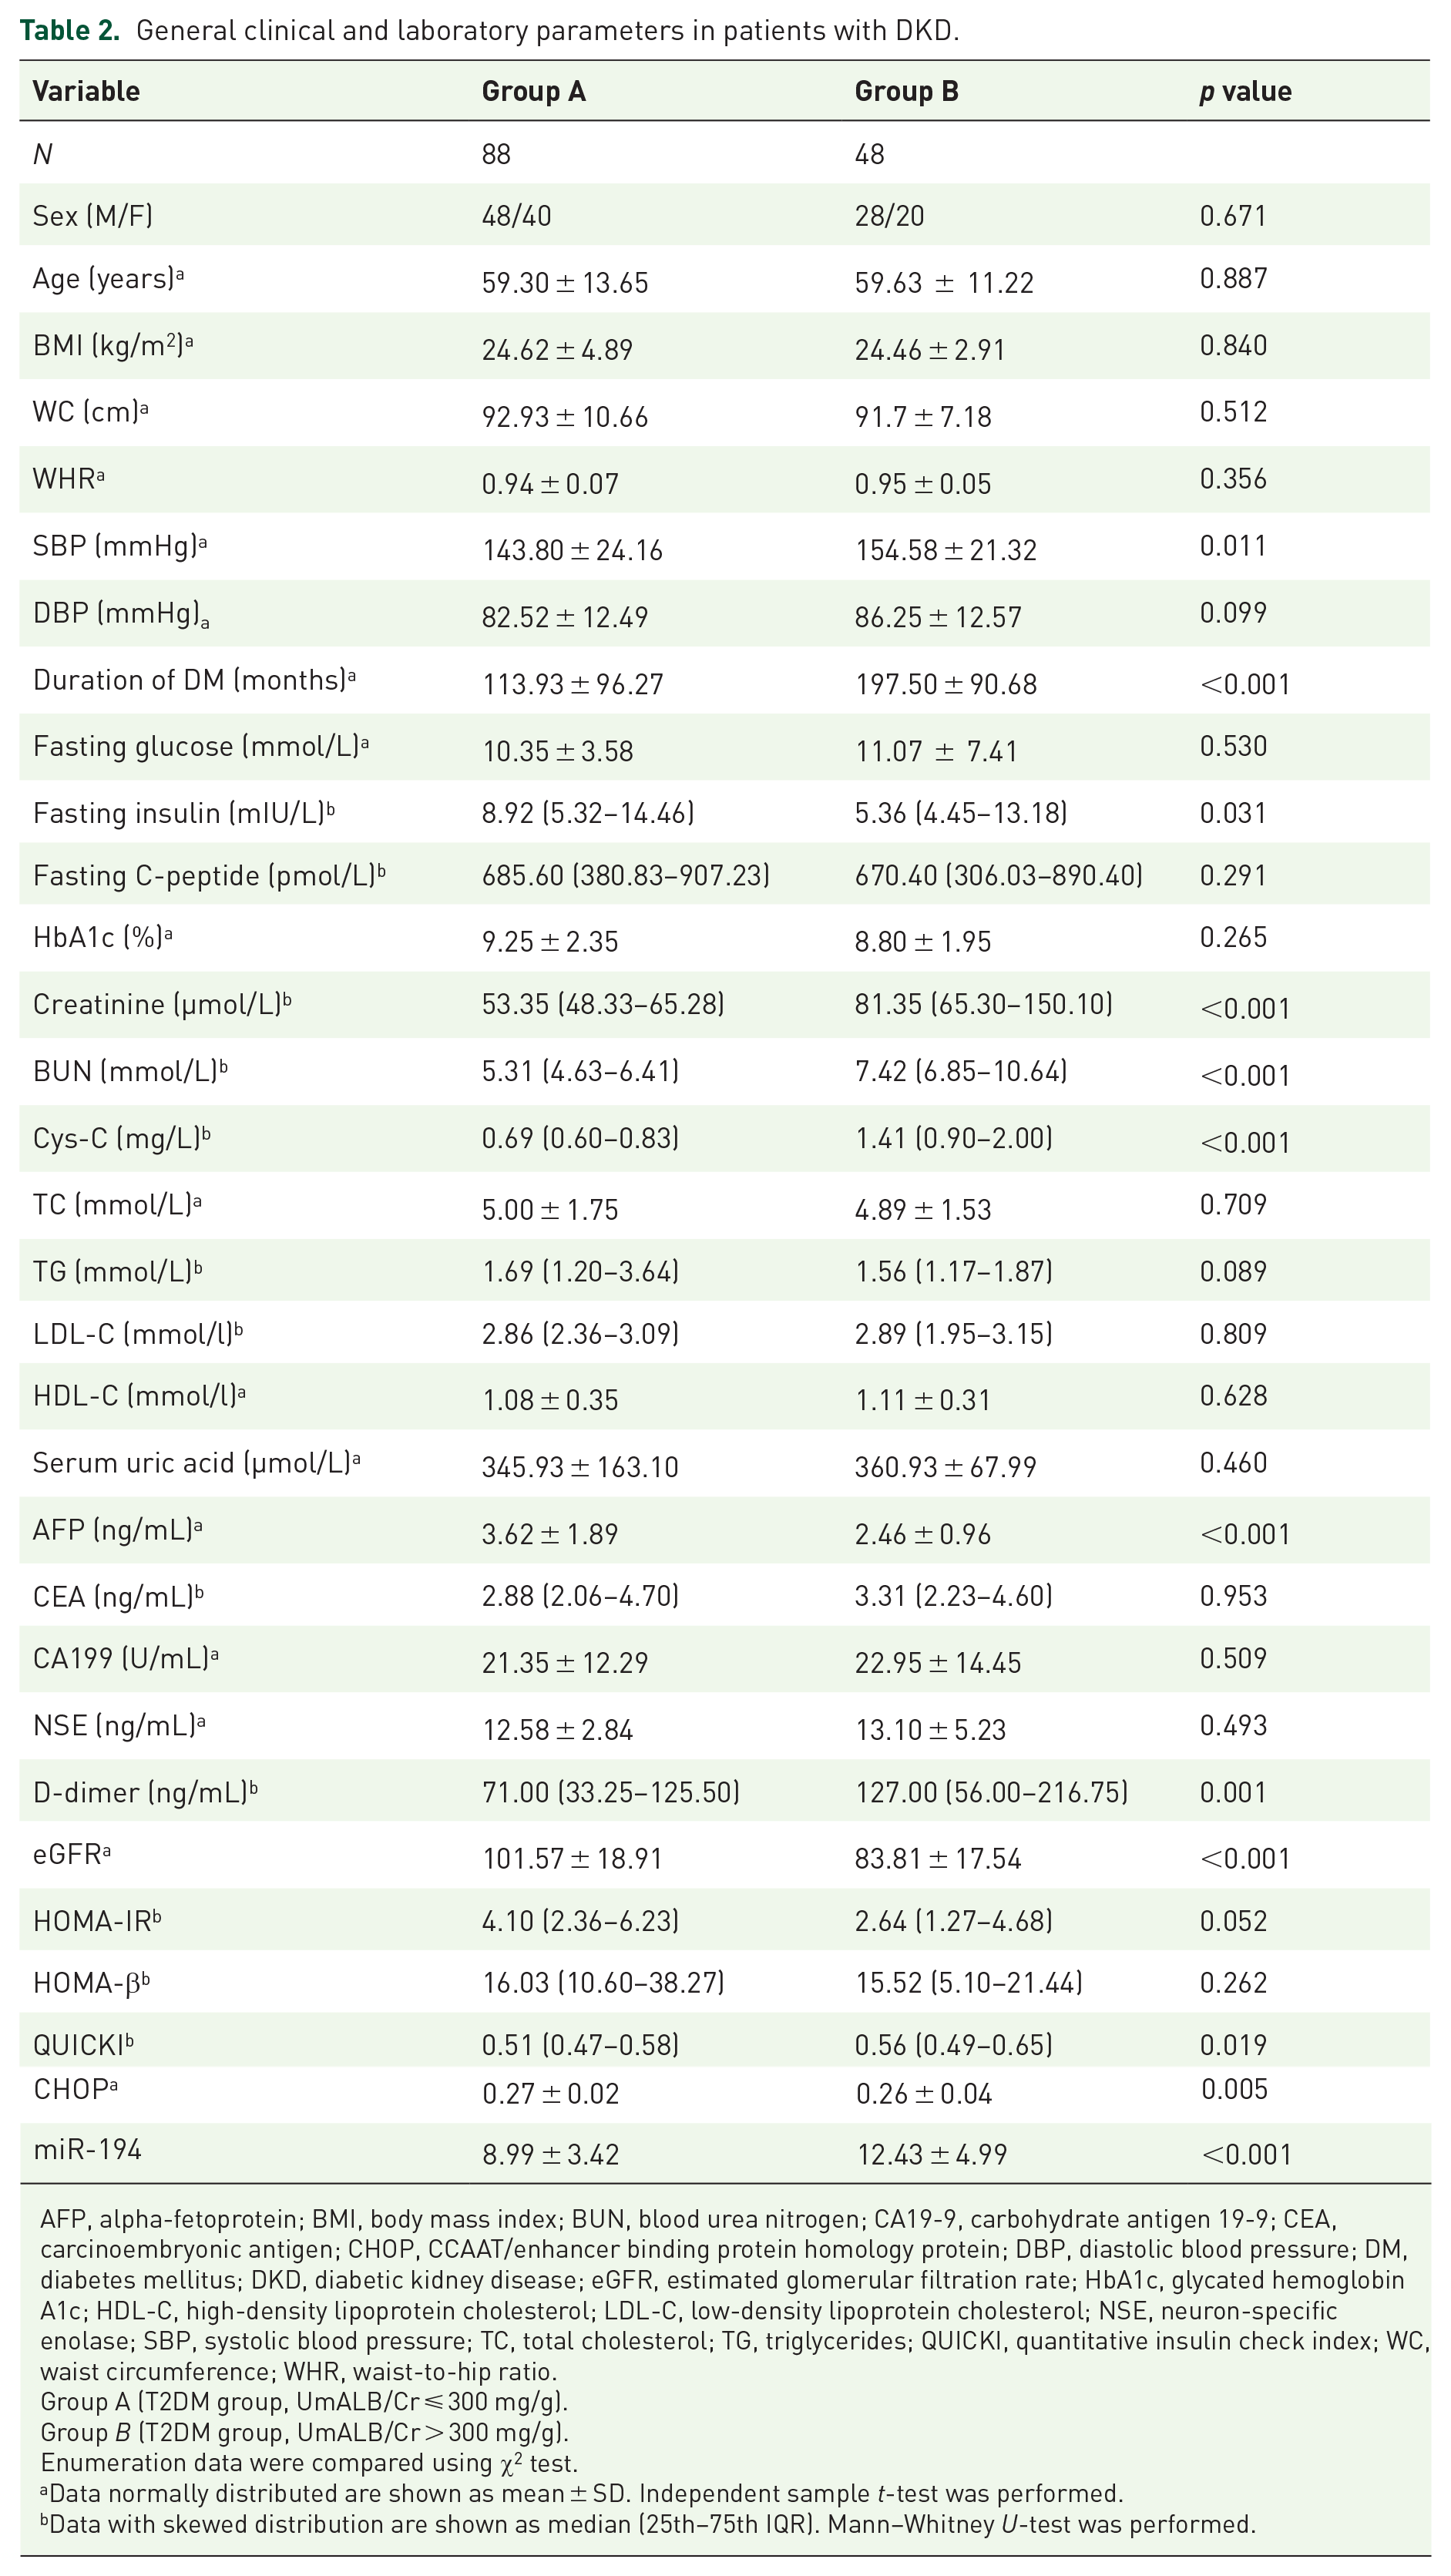
AFP, alpha-fetoprotein; BMI, body mass index; BUN, blood urea nitrogen; CA19-9, carbohydrate antigen 19-9; CEA, carcinoembryonic antigen; CHOP, CCAAT/enhancer binding protein homology protein; DBP, diastolic blood pressure; DM, diabetes mellitus; DKD, diabetic kidney disease; eGFR, estimated glomerular filtration rate; HbA1c, glycated hemoglobin A1c; HDL-C, high-density lipoprotein cholesterol; LDL-C, low-density lipoprotein cholesterol; NSE, neuron-specific enolase; SBP, systolic blood pressure; TC, total cholesterol; TG, triglycerides; QUICKI, quantitative insulin check index; WC, waist circumference; WHR, waist-to-hip ratio.
Group A (T2DM group, UmALB/Cr ⩽ 300 mg/g).
Group B (T2DM group, UmALB/Cr > 300 mg/g).
Enumeration data were compared using χ2 test.
Data normally distributed are shown as mean ± SD. Independent sample t-test was performed.
Data with skewed distribution are shown as median (25th–75th IQR). Mann–Whitney U-test was performed.

(a) Median (IQR) circulating miRNA-194 levels and (b) median (IQR) circulating CHOP levels in Chinese patients with T2DM: (a) Group A (UmALB/Cr < 300 mg/g) and (b) group B (UmALB/Cr ⩾ 300 mg/g).
Circulating miRNA-194 and CHOP levels
Circulating miRNA-194 levels were significantly increased in T2DM patients with UmALB/Cr ⩾ 300 mg/g (p < 0.001; Figure 1(a)). However, circulating CHOP levels in T2DM patients with UmALB/Cr ⩾ 300 mg/g were significantly reduced as compared with those seen in the controls (p = 0.005; Figure 1(b)).
Bivariate correlation between circulating miRNA-194 levels and other variables
In all study participants, negative correlation was observed among circulating miRNA-194 levels, alpha-fetoprotein (AFP; r = −0.222, p = 0.018), and CHOP (r = −0.301, P = 0.001). However, circulating miRNA-194 levels showed positive correlation with fasting glucose (r = 0.193, P = 0.036), UmALB/Cr (r = 0.446, p < 0.001), Cr (r = 0.260, p = 0.005), Cys-C (r = 0.339, P < 0.001), and QUICKI (r = 0.250, P = 0.006), particularly with UmALB/Cr and Cys-C (p < 0.001; Table 3).
Bivariate correlation between microRNA-194 levels and other variables.

AFP, alpha-fetoprotein; CHOP, CCAAT/enhancer binding protein homology protein; eGFR, estimated glomerular filtration rate; QUICKI, quantitative insulin check index; UmALB/Cr, microalbumin/creatinine ratio.
Pearson correlation analysis was used. P values <0.05 and <0.01 were considered significant. * p < 0.05; ** p < 0.01.
Independent factors associated with UmALB/Cr levels in T2DM patients
After adjusting for covariates associated with UmALB/Cr, duration of T2DM, SBP, Cr, eGFR, WC, and microRNA-194 were omitted from the logistic regression model (Table 4). Duration of T2DM, SBP, Cr, eGFR, WC, and microRNA-194 were identified as independent factors associated with T2DM patients with UmALB/Cr ⩾ 300 mg/g (p = 0.030, 0.013, <0.001, <0.001, 0.031, and 0.051, respectively).
Logistic regression analysis: independent factors associated with UmALB/Cr levels in T2DM patients have UmALB/Cr > 300.

DM, diabetes mellitus; eGFR, estimated glomerular filtration rate; SBP, systolic blood pressure; SE, standard error; T2DM, type 2 diabetes mellitus; WC, waist circumference; UmALB/Cr, microalbumin/creatinine ratio.
Crude area under the receiver operating characteristic curve of circulating miRNA-194 levels in Chinese patients with T2DM for predicting DKD
The crude area under the ROC curve of circulating microRNA-194 to predict the occurrence of DKD was 0.780 (95% confidence interval (CI) = 0.683–0.877), suggesting that circulating microRNA-194 is a potential biomarker of DKD (Figure 2). Circulating microRNA-194 levels could represent a novel biomarker for distinguishing DKD according to ROC curve in this study (AUC, 0.780; 95% CI, 0.683–0.877; p < 0.01).

Crude area under the ROC curve of circulating miRNA-194 levels in Chinese patients with T2DM for predicting the presence of DKD (AUC, 0.780; 95% CI, 0.683–0.877; p < 0.01).
Discussion
DKD is considered the most common cause of mortality in patients with diabetes, accounting for 30%–47% of cases of ESRD. 31 According to a nationwide retrospective study of inpatients in China from 1991 to 2000, 33.6% of patients with diabetes had complication of DKD (including early renal disease, clinical renal disease, uremia, and renal failure). Among these, 22.5% had T1DM and 34.7% had T2DM. 32 The prevalence of DKD in the United States is estimated to be 20%–40%. 33 By 2045, it is estimated that the number of DM cases worldwide will reach 429 million in adults aged 20–79 years and 629 million in adults aged 18–99 years. 34 Circulating expression of specific miRNAs differs among pathological conditions, and for many diseases, miRNAs are increasingly being explored as potential biomarkers. 35 Circulating miRNAs are now being recognized as potential prognostic biomarkers for T2DM development, 3 as these molecules control diverse biological functions at cellular level, such as cellular proliferation, differentiation, apoptosis, and metabolic homeostasis. 36 Intracellular miRNAs in different tissues can passively enter into the circulation because of cellular injury and death or actively enter into extracellular space and circulation for intercellular communication. 37 In the circulation, miRNAs are packaged into microparticles, exosomes, apoptotic bodies, or associated with lipoproteins and RNA-binding proteins, thereby avoiding RNase-mediated degradation. 38 MiRNAs are also implicated in the complications of impaired glucose metabolism and endothelial cell function. 39 Identifying new biomarkers with better sensitivity and selectivity is necessary for proper DKD diagnosis.
Consistent with previous reports, this study revealed that circulating miRNA-194 levels in T2DM patients were significantly increased as compared with the controls (p = 0.029),40–42 indicating its potential use as a biomarker in the pathogenesis of T2DM. 9 Jia et al. 43 showed that miR-194-5p was highly expressed in urine exosomes of DN patients with microalbuminuria, while its expression was reduced in DN patients with high levels of albuminuria; however, expression levels were higher still in DN patients without albuminuria and healthy controls, suggesting that urine exosomes miR-194-5p could be used as an auxiliary marker for early DN diagnosis. In this study, circulating miRNA-194 concentrations were significantly increased in DKD patients according to UmALB/Cr levels (p < 0.001). A previous smaller, non-prospective miRNA profiling study found associations between miR-194 serum levels and glycemic stage. Another study that followed patients with metabolic syndrome for more than 1 year described that miR-194 was expressed differentially in patients with varying fasting blood glucose levels, unlike those with stable fasting glucose levels. 40 In the Framingham Heart Study (a large community-based human cohort), a greater abundance of miR-192, miR-194, and miR122 was shown to be associated with higher insulin resistance in 2317 non-diabetic people. 44 Elevated miR-194 levels may be triggered by comorbidities of diabetes and prediabetes rather than diabetes directly. Findings from previous studies as well as our findings suggest that miR-194 levels could be used as a biomarker of risk of DKD. Increased levels of circulating miR-194 could indicate increased risk of T2DM.
This study found that circulating CHOP levels in T2DM patients were significantly lower than that in the control subjects (p < 0.001) and levels of CHOP were negatively correlated (r = −0.301, p = 0.001) with miRNA-194 levels. As shown in Figure 1(b), circulating CHOP concentrations did not significantly differ according to UmALB/Cr levels (p = 0.013) in DKD patients, indicating that ER stress exists in DKD. CHOP plays an important role as a classical marker of ER stress. ER stress has been a principal link in the pathogenesis of various systemic chronic metabolic diseases, such as T2DM, and has also been associated with oxidative stress, inflammation, autophagy, apoptosis, and other signaling pathways. 45 Studies have shown that ER stress is present in DN, inflammation or renal injury due to osmolarity differences, renal fibrosis, proteinuria, genetic mutations of renal proteins, cyclosporine A treatment, and ischemia–reperfusion. Even though the ER stress response is a protective mechanism against certain kidney diseases, the ER stress response–related PERK/ATF4/CHOP pathway is proapoptotic in other kidney diseases and contributes to the pathogenesis. 46 The expression of certain key ER stress-related genes, including XBP1, CHOP, and cleaved caspase 3, was reported to be significantly increased in a high glucose (HG) model. 47 Moreover, ER stress increases GRP78 expression and activates the CHOP and caspases-12 pathways, promoting podocyte apoptosis in mice, which is likely related to the development of DKD. 48 HG has been shown to induce cell death in differentiated mouse podocytes, partly via ER stress, thereby potentially contributing to the pathogenesis of DN. 48
In contrast, an animal study showed increased expression of the nuclear transcription factors rBp65, CHOP, and GRP78. 49 The long noncoding RNA, TUG1, induced podocyte cell death by facilitating the ER stress/CHOP/peroxisome proliferator-activated receptor gamma coactivator-1 alpha signaling pathway in HG-induced DN. 50
In this study, UmALB/Cr, Cys-C, and eGFR were also found to be other predictors of DKD. UmALB/Cr is frequently used as an evaluation index of DKD, and study 23 showed that as one of the criteria for the diagnosis and clinical grading of DKD the urinary albumin excretion rate is widely accepted, while microalbuminuria has been recommended as the primary clinical symptom of DKD. 51 Albuminuria measures the effects of several factors, such as fever, infection, hypertension, hyperglycemia, heart failure, vigorous exercise within 24 h, and menstruation, and these factors should be considered when analyzing the results. However, there are some limitations in the use of albuminuria in predicting DKD progression. Long-term observational studies found that only 30%–45% of patients with microalbuminuria develop albuminuria within 10 years (30% of urine albumin is negative), and this phenomenon is more pronounced in patients with T2DM.52,53 In recent years, clinical studies have shown that DKD patients with severe kidney damage and microalbuminuria have changed to normal albuminuria. However, the use of microalbuminuria as a biomarker for DKD progression has recently been questioned.54,55
Early DKD is frequently associated with eGFR, a phenomenon known as high glomerular hyperfiltration. Around 25%–75% of patients with T1DM and 0%–40% of patients with T2DM have glomerular hyperfiltration. However, glomerular hyperfiltration in patients with T1DM is closely related to blood glucose control. When blood glucose <13.5 mmol/L, the eGFR increases with the increase of blood glucose level, until it reaches its highest level. The eGFR is considered as a key functional index on the basis of chronic renal disease (CKD) diagnosis and staging. 56 When blood glucose levels reach >13.5 mmol/L, GFR began to decrease. In addition, acceptable hypoglycemic control can effectively control GFR, even if patients with DM have developed hyperfiltration. 57 At present, GFR cannot fully represent the extent of renal disease. Direct measurement of GFR requires specialist equipment and has little value in clinical practice; therefore, eGFR is generally substituted. It is important to recognize that not all patients with diabetes show abnormal albuminuria. A cross-sectional study indicated that some patients whose urinary albumin excretion is normal showed lowered eGFR.58,59 The parameters used to determine eGFR commonly include sex, age, and serum creatinine levels.
The CKD-EPI formula (http://www.nkdep.nih.gov) or Modification of Diet in Renal Disease formula is suggested. A reduction in eGFR can be diagnosed when the patient’s eGFR levels reach <60 mL/min/1.73 m2. However, as the eGFR values are known to fluctuate, these must be reviewed when a decline appears to ascertain the stage of DKD. A reduction in eGFR is closely related to increased risk of cardiovascular disease and death. Recently, it has been shown that mild eGFR reduction can enhance risk of cardiovascular disease. 60 A recent study showed that early DKD was associated with Cys-C, which is not glycosylated. Low-molecular-weight protein is synthesized in all nucleated cells in the animals, and the rate of its production is stable and not influenced by factors such as sex or age. Serum Cys-C levels mostly depend on the glomerular filtration rate, which, together with urinary α-microglobulin, IgM, IgG, and type-IV collagen, are considered to be sensitive markers for the early diagnosis of DKD. 61 In this study, the crude area under the ROC curve of circulating microRNA-194 to predict the occurrence of DKD was 0.780 (95% CI = 0.683–0.877, p < 0.01), suggesting that circulating microRNA-194 is a potential biomarker of DKD (Figure 2). Our current hospital-based observational study is the first to provide clinical evidence and relevance for the association of circulating microRNA-194 levels with DKD development.
This study revealed three crucial findings. First, we reported for the first time that circulating miR-194 and CHOP levels in all participants were correlated. Circulating miRNA-194 levels were increased in patients with T2DM as compared with the controls (p = 0.029). Circulating CHOP levels were significantly lower in patients with T2DM as compared with the control subjects (p < 0.001). Furthermore, circulating miRNA-194 and CHOP levels were significantly increased in T2DM patients with UmALB/Cr ⩾ 300 mg/g (p < 0.001 and p = 0.005, respectively). Second, bivariate correlation analysis between circulating miR-194 levels and other variables showed that AFP and CHOP were negatively correlated (r = −0.222, p = 0.018 and r = −0.301 and p = 0.001, respectively) but were positively correlated with fasting glucose (r = 0.193, p = 0.036), UmALB/Cr (r = 0.446, p < 0.001), Cr (r = 0.260, P = 0.005), Cys-C (r = 0.339, p < 0.001), and QUICKI (r = 0.250, p = 0.006, respectively), particularly UmALB/Cr and Cys-C (p < 0.001).
Logistic regression analysis after adjusting for covariates associated with UmALB/Cr identified duration of DM, SBP, Cr, eGFR, and WC as independent factors associated with T2DM patients with UmALB/Cr ⩾ 300 mg/g (p = 0.030, 0.013, <0.001, <0.001, and 0.031, respectively). Therefore, circulating microRNA-194 levels could be a novel biomarker for distinguishing DKD according to ROC curve (AUC, 0.780; 95% CI, 0.683–0.877; P < 0.01; Figure 1).
However, this study has some limitations. First, this was an observational study with a cross-sectional design, and the cohort was relatively small. The observational design of our study did not enable us to determine the origin of circulating miR-194 or the pathogenic relationship between miR-194 serum levels with both established and incident diabetes. As diabetes and its complications are systemic, several organs may release miRNAs into circulation in response to cellular injury, stress, or death. miR-194 is expressed by many organs (pancreatic β-cells or liver) or may be affected by complications of DM (e.g. in the liver or kidney) even before the onset of T2DM.40–42 miRNAs and their shuttles are presently being studied to understand the complex pathophysiological traits or multifactorial diseases, including the T2DM complications. 62 As the regulation of miRNAs can be finetuned by a wide variety of T2DM-relevant factors, miRNAs provide a perfect interface between the environmental stimuli and genetic background, thereby offering additional information, unlike the established risk factors. 63
Thus, the association between T2DM and DKD and miR-194 may signify causality, consequence, or an indirect connection. However, a cause-and-effect relationship could not be confirmed between circulating microRNA-194 and physiopathological DKD mechanisms. Even though this study consisted of relatively small patient groups compared with non-miRNA biomarker studies, the present results warrant further studies to validate the findings in a larger and population-based prospective cohort study. It is possible that our initial study on miRNA profiling did not notice miRNAs that are potential biomarkers of diabetes, and thus validation studies could not be performed on them. Thus, we only recognized one miRNA that was previously associated with T2DM and DKD. It is necessary to conduct both in vivo and in vitro studies to deduce the involved molecular mechanisms. Due to the limitations of the study design and availability of funds, we could only measure circulating microRNA-194 and CHOP levels in DKD. Other measurements of ER stress were not conducted and thus not available.
Considering the role of CHOP and the involvement of ER stress in other microvascular complications of diabetes, future studies are needed to elaborate the role of ER stress and the unfolded protein response in diabetes-associated microvascular dysfunction. Interactions between ER stress and other biochemical events that are involved in DKD pathogenesis also need to be investigated. We and others have shown that certain circulating miRNA signatures likely help to predict or detect the development and progression of T2DM and DKD at an early stage. 64 Non-cytotoxic vehicles, such as aptamers and nanoparticles for delivering miRNA-based drugs, have been described. These methodologies could prove to be innovative for selectively targeting and modulating miRNAs implicated in diabetes and its complications. 65
miRNA levels are not routinely measured in clinical practice, mostly due to the length of time needed for their analysis and the lack of standard operating procedures that are internationally accepted. Thus, there is a need for implementing such standards so that miRNAs can be used as an additional authentic diagnostic tool. Our findings provide rationale for ascertaining the variables of ER stress in readily accessible biological materials (serum) as novel potential biomarkers of DKD with diagnostic and prognostic value.
Footnotes
Acknowledgements
The authors express their sincere thanks to all the volunteers and nurses who offered help in the study.
Author contributions
NM: conceptualization; methodology; software; validation; visualization; writing—original draft; and writing—review and editing. NX: conceptualization; software; writing—original draft; and writing—review and editing. DY: conceptualization; investigation; and writing—original draft. PZ: data curation; formal analysis; methodology; validation; visualization; and writing—original draft. WL: data curation; formal analysis; methodology; validation; visualization; and writing—original draft. GW: formal analysis; investigation; and writing—review and editing. YH: formal analysis; software; and writing—review and editing. JZ: formal analysis; investigation; supervision; and writing—review and editing. GH: formal analysis; investigation; supervision; and writing—review and editing. CY: formal analysis; investigation; supervision; and writing—review and editing. YC: investigation and software. MC: conceptualization; data curation; methodology; and writing—review and editing. XC: conceptualization; project administration; writing—original draft; and writing—review and editing.
Conflict of interest statement
The authors declared no potential conflicts of interest with respect to the research, authorship, and/or publication of this article.
Funding
The authors disclosed receipt of the following financial support for the research, authorship, and/or publication of this article: This research was funded by Jiangsu Provincial Commission of Health and Family Planning (grant no. Z2018021) and Lianyungang Commission Health Foundation (grant no. zd1802). The funding body played no role in the design of the study and collection, analysis, and interpretation of data or in writing the manuscript.
Data availability statement
The circulating expression data of miRNA-194 and CHOP of Chinese patients with type-2 diabetic kidney disease used to support the findings of this study are restricted by the Ethics Committee of the First People’s Hospital of Lianyungang in order to protect patient privacy. Data are available from Ning Ma,