
Abstract
Background:
A prolonged QT interval plays a causal role in fatal arrhythmia and is known to be a risk factor for sudden cardiac death. Although diabetic patients with microvascular complications tend to have a longer QT interval, the therapeutic effect of diabetes on the QT interval remains unclear. Here, we assessed the changes in QT interval in patients with type 2 diabetes (T2D) who received multiple daily insulin injections.
Materials and methods:
Patients with T2D (n = 34) who were admitted to our hospital and initiated multiple daily insulin injections for glycemic control were enrolled in this study. Clinical measurements, including electrocardiogram, were taken on admission and discharge. The QT interval was measured manually in lead II on the electrocardiogram, and corrected QT interval (QTc) was calculated using Bazett’s formula. The change in QTc (ΔQTc) during hospitalization (median, 15 days) and clinical parameters affecting ΔQTc were investigated.
Results:
QTc was shortened from 439 ± 24 to 427 ± 26 ms during hospitalization (p < 0.0001). ΔQTc was positively correlated with the changes in fasting plasma glucose (ΔFPG, r = 0.55, p = 0.0008) and glycated albumin (r = 0.38, p = 0.026) following insulin therapy, but not with the final dose of insulin (r = −0.20, p = 0.26). The multiple regression analyses revealed that ΔFPG was independently associated with ΔQTc.
Conclusions:
Multiple daily insulin injections can ameliorate QT interval by lowering the blood glucose levels in T2D, suggesting that glycemic control is important for preventing patients with T2D from sudden cardiac death.
Introduction
The QT interval on electrocardiogram is the beginning of the QRS complex to the end of the T wave, meaning the duration between ventricular depolarization and repolarization. Prolonged QT interval is a risk factor for sudden cardiac death because it causes fatal arrhythmias such as torsade-de-pointes-type ventricular tachycardia.1–3 In patients with type 2 diabetes (T2D), prolonged QT interval has been reported as an independent predictor of all-cause mortality and cardiovascular death.4,5 We recently reported that the severity and multiplicity of diabetic microvascular complications are associated with QT interval prolongation in patients with T2D. 6 Therefore, it is of great importance to manage the QT interval in patients with T2D. However, the effects of diabetic therapy, specifically, insulin, on the QT interval are still controversial. For instance, Takebayashi et al. 7 reported that patients with T2D who were initiated on insulin therapy showed significantly increased QT interval in parallel with glycated hemoglobin (HbA1c) reduction after 3 months. In contrast, Schnell et al. 8 reported that 4 months of insulin therapy could shorten QT intervals in patients with T2D.
In the present study, we assessed the changes in QT interval in Japanese patients with T2D who received insulin therapy during a 2-week hospitalization period. We showed here that multiple daily insulin injections succeeded in shortening the QT interval. Furthermore, the change in QT interval was independently associated with changes in fasting plasma glucose (FPG). These findings indicate that glycemic control is important for managing prolonged QT interval in patients with T2D.
Materials and methods
Participants
Patients with T2D who were admitted to our hospital and initiated insulin therapy for glycemic control during January 2014–December 2014 (n = 34) were enrolled in this study. The exclusion criteria were: receiving insulin therapy before admission; atrial fibrillation; uncontrolled endocrine disease; steroid therapy; hemodialysis; infection; malignant tumor under treatment; and ketoacidosis. We also excluded patients with medications which could affect QTc, such as antiarrhythmic agents, antipsychotic agents, tricyclic antidepressants, tetracyclic antidepressants, α-blockers, β-blockers, probucol, digoxin, antifungal agents, and antibacterial agents. The study protocol was registered with the University Hospital Medical Information Network (UMIN; no. UMIN000037360), approved by the Nippon Medical School Hospital Ethics Committee (30-06-938), and conformed to the provisions of the Declaration of Helsinki in 1995 (as revised in Edinburgh 2000). Written informed consent was obtained from all participants.
Clinical measurements
All participants underwent physical examinations, including height, body weight, and blood pressure on the first morning after admission and on the morning of discharge. Blood samples were taken after an overnight fast on the second day of admission and 2 or 3 days before discharge. The FPG levels were measured using the glucose oxidase method (ADAMS Glucose GA-1170; ARKRAY, Kyoto, Japan). HbA1c was measured using high-performance liquid chromatography (ADAMS A1c HA-8160, ARKRAY) and expressed as the percentage value of the National Glycohemoglobin Standardization Program according to the Japan Diabetes Society guideline. 9 Serum glycated albumin (GA) was measured by an enzymatic method using albumin-specific proteinase and ketoamine oxidase (Lucica GA-L; Asahi Kasei Pharma, Tokyo, Japan) and expressed as a percentage of total serum albumin. Serum C peptide was measured using a chemiluminescent enzyme immunoassay (Fujirebio Inc., Tokyo, Japan). The serum calcium level was corrected for the concentration of albumin using the following formula if the serum albumin level was <4.0 g/dl: corrected serum calcium (Ca; mg/dl) = Ca (mg/dl) − [4.0 − albumin (g/dl)]. 10 The estimated glomerular filtration rate (eGFR) was calculated using the following formula: eGFR (ml/min/1.73 m2) = 194 × Cr−1.094 × age−0.287 (× 0.742, if female). 11
Medication and insulin therapy
If the participants had been treated with oral hypoglycemic agents on admission, the agents were withdrawn on the second day of admission. Insulin therapy was initiated for all participants, and the initial dose of insulin (U/day) was fixed by the following formula: FPG (mg/dl) × 0.08. The dose of insulin was divided into three or four daily insulin injections (2–6 U each): three injections of ultrarapid insulin analog (aspart, glulisine, or lispro) before meals and one bedtime injection of long-acting insulin (glargine, detemir, or degludec). The dose of insulin injection was adjusted by the attending physicians.
Diet therapy
During hospitalization, dietary energy intake (kcal/day) was restricted to 27.5 kcal/kg of ideal body weight (IBW) based on the recommendation of the Japan Diabetes Society. 12 IBW was calculated using the following formula because a body mass index (BMI) of 22 is regarded as ideal for adult Japanese individuals: IBW (kg) = [height (m)]2 × 22 (BMI, kg/m2). The daily dietary energy intake was divided approximately equally for breakfast (0800 h), lunch (1200 h), and dinner (1800 h). Each diet contained approximately 20–25% of energy as fat, 15–20% as protein, and 55–60% as carbohydrate. Physical activity was maintained within the patient’s usual intensity without a specific exercise program.
Corrected QT interval
A 12-lead electrocardiogram (ECG) was recorded on the day of admission and discharge using an electrocardiograph (ECG-1550; Nihon Kohden Co., Ltd., Tokyo, Japan). We printed the recorded ECGs and removed the patient information from the ECGs for blinding. The QT and RR intervals of three consecutive beats were measured manually on lead II using a divider. The QT intervals were defined as the length from the beginning of the QRS complex to the end of the downslope of the T wave. A corrected QT interval (QTc) was calculated according to Bazett’s formula: QTc = QT/(RR)1/2. 13
Assessment of diabetic microvascular complications
Neuropathy was screened using the criteria for typical diabetic peripheral neuropathy proposed by the American Diabetes Association in 2010. 14 The presence of typical diabetic peripheral neuropathic symptoms [decreased sensation, positive neuropathic sensory symptoms (e.g. numbness, prickling or stabbing, burning, or aching pain) in the lower legs] or abnormal (decreased or absent) Achilles tendon reflex was diagnosed as neuropathy (including possible neuropathy). Retinopathy was diagnosed using ophthalmoscopy by an ophthalmologist. 15 Nephropathy was diagnosed based on the presence of albuminuria [urinary albumin exertion ⩾30 mg/g·creatinine (spot)]. 16
Statistical analysis
Continuous variables were described as mean ± standard deviation or median and interquartile range. Categorical variables were expressed as numbers and percentages. Differences in variables at admission and discharge were analyzed using a paired t test or the Wilcoxon signed-rank test. Correlations between QTc and other continuous variables were examined using Pearson’s correlation test. Multivariate regression analysis was used to determine statistically significant predictive factors for the change in QTc (ΔQTc). A p value < 0.05 was considered statistically significant. All analyses were performed using JMP 14.1 pro software (SAS Institute Inc., Cary, NC, USA).
Results
Clinical characteristics of the participants
Table 1 shows the clinical characteristics of the participants at admission and discharge. Antidiabetic medications that patients received before hospitalization were dipeptidyl peptidase-4 inhibitors in 16, metformin in 10, sulfonylurea in 6, α-glucosidase inhibitor in 6, thiazolidine in 2, and glinide in two cases. QTc decreased significantly from 439 ± 24 to 427 ± 26 ms (p < 0.0001) during 15 days of hospitalization [median (interquartile range), 13.75–16]. The glycemic parameters, that is, FPG, GA, and HbA1c, also decreased significantly following multiple daily insulin injections, where the total daily dose of insulin at discharge was 25.6 ± 12.6 U/day. Among the serum electrolytes, while the serum sodium (Na) and chlorine (Cl) levels were slightly increased, significant changes were not observed in the serum potassium (K) and Ca levels, which can affect QTc.
Clinical characteristics of the participants.

Continuous variables are expressed as mean ± standard deviation or median (interquartile range). Differences in admission and discharge were analyzed using paired t-tests.
BMI, body mass index; Cr, creatinine; eGFR, estimated glomerular filtration rate; GA, glycated albumin; HbA1c, glycated hemoglobin; QTc, corrected QT interval.
The change in QTc is associated with the changes in glycemic parameters
Table 2 shows the association between ΔQTc and the other clinical parameters. ΔQTc was positively correlated with ΔFPG and ΔGA [Figure 1(a) and (b)]. While ΔQTc was not correlated with ΔK and ΔCa, ΔQTc was negatively correlated with ΔNa and ΔCl. ΔQTc was not affected by the presence of microvascular complications (neuropathy, retinopathy, and nephropathy) or the total daily dose of insulin at discharge. The multiple regression analysis revealed that ΔFPG was independently associated with ΔQTc after adjustment for age, sex, and ΔNa (Table 3).
Associations between the change in QTc and changes in clinical parameters during hospitalization.
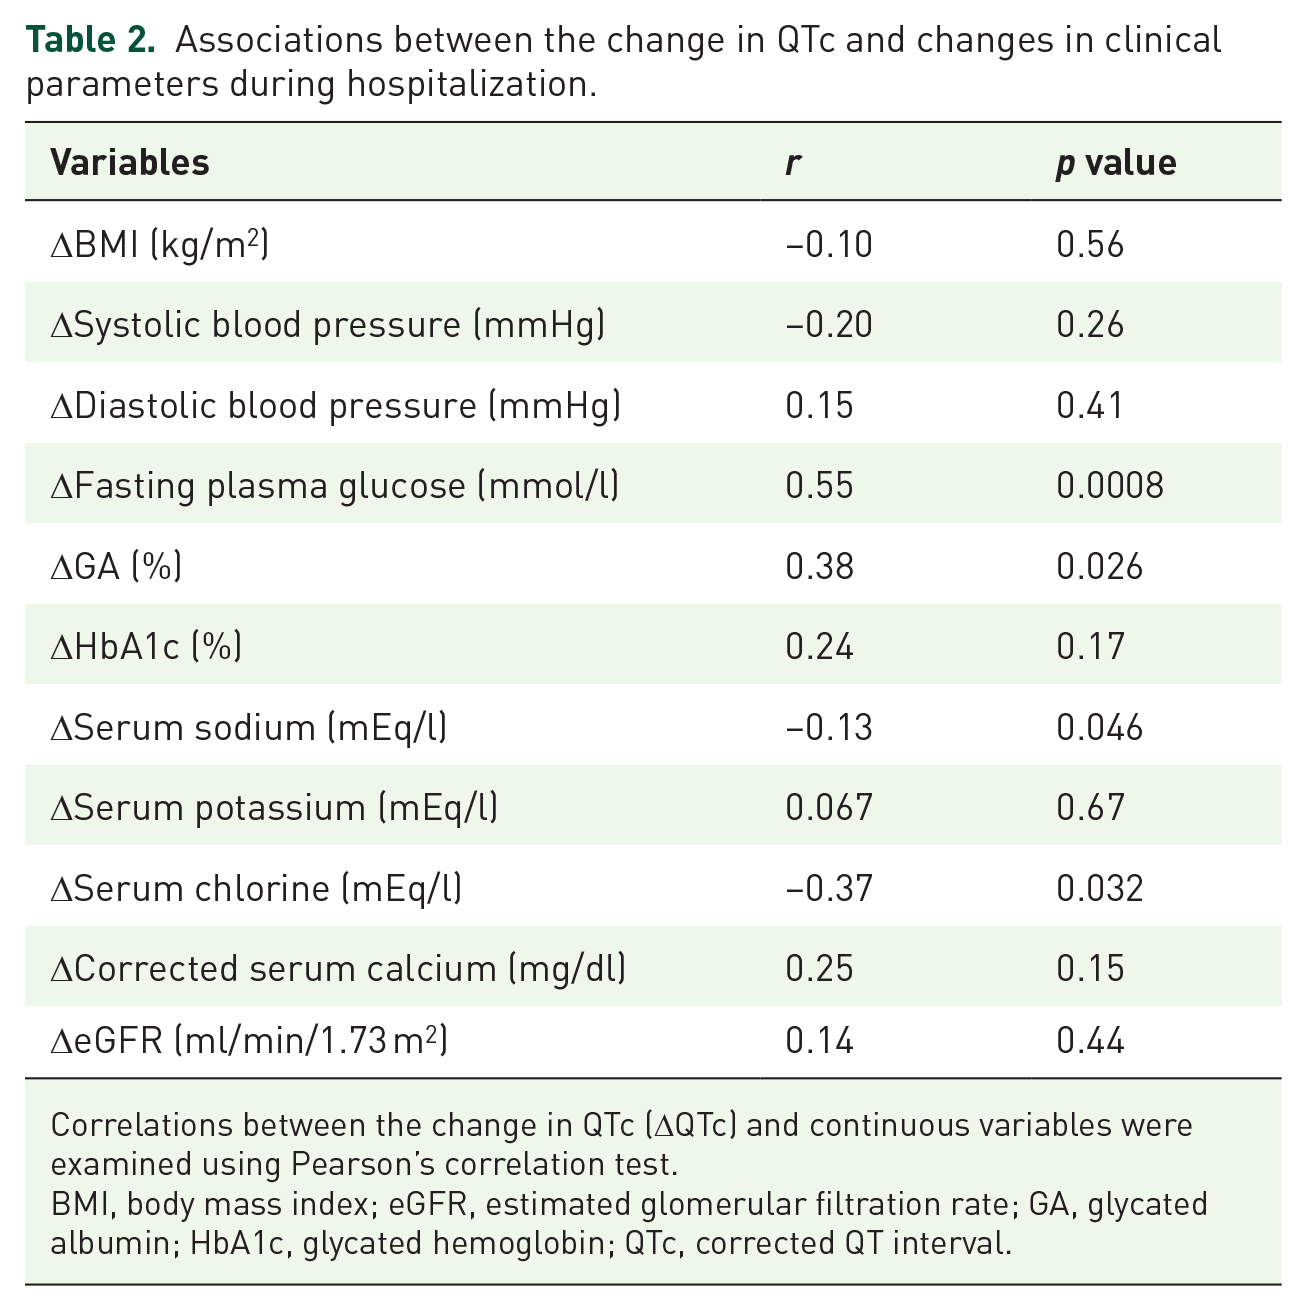
Correlations between the change in QTc (ΔQTc) and continuous variables were examined using Pearson’s correlation test.
BMI, body mass index; eGFR, estimated glomerular filtration rate; GA, glycated albumin; HbA1c, glycated hemoglobin; QTc, corrected QT interval.

Relationship between the change in QTc and changes in fasting plasma glucose and glycated albumin.
Multiple linear regression model for the change in QTc.

Data are expressed as β coefficient (estimated partial regression coefficient) and t and p values for the association between the change in QTc and other clinical variables (age, sex, Δfasting plasma glucose, and Δserum sodium).
QTc, corrected QT interval.
Discussion
In the present study, we assessed the effect of multiple daily insulin injections on the change in QT interval in patients with T2D. We demonstrated here that the improvement of glycemic control by multiple daily insulin injections can decrease QTc in patients with T2D. To the best of our knowledge, this is the first report showing a positive relationship between ΔQTc and changes in glycemic parameters, including FPG and GA.
Two previous studies have evaluated changes in QTc in patients with T2D receiving insulin therapy, but these studies have not examined the correlation between the change in QTc and glycemic parameters. Schnell et al. 8 have reported that 4 months’ insulin therapy significantly shortened QTc in parallel with decreased HbA1c. The results are consistent with the finding of the present study that QTc was shortened following multiple daily insulin injections. In contrast, Takebayashi et al. 7 have reported that 3-month insulin therapy prolonged QTc in spite of a decreased HbA1c. There are several possible reasons for the inconsistencies between the studies. First, participants in Takebayashi’s study had a longer T2D duration than those in our study. Indeed, longer T2D duration causes diabetic neuropathy, including cardiac autonomic neuropathy (CAN), which prolongs QTc. 17 Therefore, the effect of glycemic control on QTc may be attenuated in patients with T2D with CAN. Second, Takebayashi’s study was performed in an outpatient clinic with less opportunity to detect insulin-induced hypoglycemia, which causes QTc prolongation.18,19 We monitored the blood glucose levels at least four times in a day, and no hypoglycemia (<3.9 mmol/l) was documented for all participants in the present study.
Animal studies have indicated that reduced density of transient outward K+ current and slow, delayed rectifier K+ current, which prolonged ventricular repolarization, were observed in cardiomyocytes of alloxan-induced diabetic dogs. 20 The reduced expression of K+ channels, especially Kv4.2 and Kv4.3, was also documented in cardiomyocytes of diabetic dogs and rats.20,21 Furthermore, cardiomyocyte-specific insulin receptor knockout mice showed reduced expression of Kv4.2 and prolonged QTc. 22 According to these findings, insufficient insulin action in cardiomyocytes could alter the expression of ion channels and prolong QTc. Insulin therapy ameliorates QTc prolongation in diabetic animal models.20,23 Of note, hyperglycemia associates with a decrease of serum sodium, so called translocational hyponatremia. An increase in plasma glucose level of 5.6 mmol/l lowers serum sodium by 1.7 mEq/l. 24 Indeed, ΔFPG was significantly correlated with ΔNa (r = −0.55, p = 0.0006) and ΔCl (r = −0.50, p = 0.0024) in Pearson’s correlation test. This can be a reason why ΔNa and ΔCl were significantly correlated with ΔQTc under multiple daily insulin injections. Multiple regression analysis revealed that ΔFPG, but not ΔNa, was independently associated with ΔQTc, indicating that glycemic control directly affects QT interval.
The present study had several limitations. First, since this is a single-arm study without a control group, we could not exclude the possibility that QTc was affected by factors other than the multiple daily insulin injections. All the patients in this study were hospitalized due to the poor glycemic control and indicated for insulin therapy according to the guideline for the Japan Diabetes Society. 12 We therefore could not set control group without insulin therapy for ethical reasons. Second, since we recruited hospitalized patients with poor glycemic control, the findings may not represent patients with T2D in general. Third, there was a sex disproportion in the present study. This simply happened because consecutive patients were enrolled, and a larger proportion of males were admitted for glycemic control than that of females during the study period. Due to the disproportion, the present study could not clarify the sex difference in QTc change following the insulin therapy. Fourth, we evaluated the effects of multiple daily insulin injections on QTc for a relatively short treatment period. Further long-term, two-arm interventional studies on patients with T2D with a wider HbA1c range are needed to clarify the effect of glycemic control on QTc.
In conclusion, the present study demonstrated that glycemic control by multiple daily insulin injections can ameliorate the QT interval in patients with T2D. The improvement of glycemic control was independently associated with the change in QTc. These findings strongly suggest that not only hypoglycemia, but also hyperglycemia, should be considered to prevent cardiac arrhythmia associated with QT prolongation during the treatment of T2D.
Footnotes
Acknowledgements
All authors thank all team members of Department of Endocrinology, Diabetes and Metabolism, Graduate School of Medicine, Nippon Medical School.
Author contribution(s)
Shunsuke Kobayashi: formal analysis; investigation; methodology; writing: original draft.
Mototsugu Nagao: investigation; methodology; project administration; writing: review and editing.
Izumi Fukuda: investigation; methodology; writing: review and editing.
Shinichi Oikawa: conceptualization; investigation; methodology; writing: review and editing.
Hitoshi Sugihara: conceptualization; investigation; methodology; writing: review and editing.
Conflict of interest statement
The authors declare that there is no conflict of interest.
Funding
The authors received no financial support for the research, authorship, and/or publication of this article.