
Abstract
Objective
This study aimed to decipher the temporal and spatial signaling code for clinical cartilage and bone regeneration. We investigated the effects of continuous equal dosages of a single, dual, or triplicate growth factor combination of bone morphogenetic protein (BMP)-2, transforming growth factor (TGF)-β3, and/or BMP-7 on muscle tissue over a culturing period. The hypothesis was that specific growth factor combinations at specific time points direct tissue transformation toward endochondral bone or cartilage formation.
Design
The harvested muscle tissues from F-344 adult male rats were cultured in 96-well plates maintained in a specific medium and cultured at specific conditions. And the multidimensional and multi–time point analyses were performed at both the genetic and protein levels.
Results
The results insinuate that the application of growth factor stimulates a chaotic tissue response that does not follow a chronological signaling cascade. Both osteogenic and chondrogenic genes showed upregulation after induction, a similar result was also observed in the semiquantitative analysis after immunohistochemical staining against different antigens.
Conclusions
The study showed that multiple TGF-β superfamily proteins applied to tissue stimulate developmental tissue processes that do not follow current tissue formation rules. The findings contribute to the understanding of the chronological order of signals and expression patterns needed to achieve chondrogenesis, articular chondrogenesis, or osteogenesis, which is crucial for the development of treatments that can regrow bone and articular cartilage clinically.
Keywords
Introduction
Embryogenesis, a tightly regulated process, can yield unusual results when disrupted. 1 Alterations to key stem cells, genes, or ligands can lead to anomalies such as two-headed sheep or wingless flies.2,3 Various stimuli, including cellular, physical, chemical, biomechanical, and biochemical signals, influence the development of cells, tissues, and organs.4,5 However, it has been shown that when certain organisms have reached a specific age, the recapitulation of embryonic events becomes problematic. With age, the coding material for most biological life, DNA degrades,6,7 and certain inhibitory processes are established in adult cells, that unless bypassed correctly with the correct sequence of growth factors, prevent the proper reformation of specific tissue or organs.8,9
The transforming growth factor beta (TGF-β) supergene family, comprising over 40 known members, is responsible for most of the tissue/organ development. Especially members belonging to the bone morphogenetic protein (BMP) and the TGF-β/activin subfamily10 -12 are known to induce various cells, especially mesenchymal stem cells (MSCs), to undergo osteogenic or chondrogenic differentiation.13 -15 This has made the use of these morphogens widely popular for use in diverse tissue engineering studies. 9 However, information regarding the TGF-β superfamily inducing tissue morphogenesis within specific in vitro culture systems has generated varying outcomes. For example, BMP-2 has been revealed in several studies to possess the potential to induce chondrogenesis,16,17 while other research teams demonstrated that BMP-2 also induces osteogenesis.18,19 Similarly, BMP-2 and TGF-β3 have synergistic interactions during bone formation in the research performed by Simmons et al., 20 while Shen et al. 21 concluded that BMP-2 enhanced TGF-β3-mediated chondrogenic differentiation of MSCs. These contradictory results are difficult to consociate, due to the limited number of studies analyzing both osteogenic and chondrogenic differentiation pathways induced by these growth factors. Indeed, as was previously investigated in one of our morphogen combinations study, results concluded that while chondrogenesis was initiated in vitro, whether the chondrogenic potential was maintained remained questionable as additional genes, both osteogenic and articular chondrogenic lineages were not analyzed. 22 Similarly, as in other research, temporal regulation does exist when certain morphogens are applied at specific time points as solo or in conjunction with each other, promoting or inhibiting tissue morphogenesis.22 -27 These contradictory results highlight the need for more comprehensive studies that analyze both osteogenic and chondrogenic differentiation pathways induced by these growth factors. Previous research has often focused on specific tissue morphogenic events, assessing only certain markers. However, this approach may not fully capture the complexity of tissue development and reactions.
As such, the presented study aimed to expose muscle tissue, ex vivo, to rBMP-2, and/or rTGF-β3 and/or rBMP-7, and to explore whether osteogenesis or chondrogenesis was being induced. We hypothesized that, the development follows a chronological order in which genetic expression markers showed first chondrogenesis followed by osteogenesis, as stipulated by developmental science.28,29 If this does not occur, then what do the results tell us about the intricacy and complexities of the inner biochemical signaling milieu that modulates what is defined as tissue morphogenesis. We hope that through these and similar studies, to cartograph the what the signaling codex is that ensures the correct chronological order of signals and expression patterns needed to achieve chondrogenesis, articular chondrogenesis or osteogenesis because this would provide clarity through which treatments can be developed that do regrow bone and articular cartilage, clinically.
Materials and Methods
Tissue Harvest
We used the same animal model as the previous experiment. 22 Two F-344 adult male rats (Charles River Laboratories, Wilmington, MA) with a mean weight of ±300 g and a mean age of ±8 weeks were sacrificed by an overdose of isoflurane (Abbott, Chicago). 22 The experimental and surgical protocols complied with the rules and regulations of the Animal Protection Laboratory Animal Regulations (2013), European Directive 2010/63/EU, and were approved by the animal ethics research committee (AESC) of the Ludwig-Maximilians University of Munich (LMU), Bavaria, Germany Tierschutzgesetz §1/§4/§17 (https://www.gesetze-im-internet.de/tierschg/TierSchG.pdf) in regard to pure tissue harvest from animals. 22
Briefly, after animals had been killed, abdominal muscles were harvested from fresh rat cadavers under sterile conditions and washed with phosphate-buffered saline-Dulbecco (PBS; Biochrom GmbH, Berlin, Germany) twice. To reduce the potential contamination possibility, tissues were immersed in the minimum essential medium (MEM, Biochrom GmbH) containing penicillin and streptomycin (P/S, Biochrom GmbH) for less than 30 minutes, and then cleaned with PBS again. The entire abdominal muscles were immersed in MEM with 1% P/S and divided into a total of n = 288 biopsies that were 4 mm in diameter utilizing the corresponding biopsy punches (PFM medical, Cologne, Germany).
Tissue Culture
The harvested muscle tissues were put in 96-well plates (Thermo Fisher Scientific, Waltham, MA) maintained in MEM supplemented with 15% fetal bovine serum (FBS, Biochrom GmbH), 0.02-mM/mL
MEM supplemented with 15% FBS, 0.02-mM/mL
Tissues were fed every 2 days with fresh medium with these growth factors, alone or in combinations. The subsequent culture period lengths were 7, 14, and 30 days. Each modality was divided up into quantitative gene as well as histological assessment groups. There were always six muscle fragments for a given culture length and assessment method. 22
Histological and Histomorphometrical Analyses
A total of 144 tissue fragments were analyzed through histological processes (n = 144). Six samples in the same modality were collected on day 7, 14, and 30 and fixed in 30% formalin (Microcos GmbH, Germany) for 24 hours. Specimens were dehydrated in a Tissue Processor STP 120 unit (Thomas-medical e.U., Maishofen, Austria) and processed for paraffin wax embedding. Paraffin wax sections (thickness: 2 μm) of specimens were mounted on Superfrost glass slides (Menzel, Braunschweig, Germany). For chondrogenesis evaluation, sections were stained with Alcian blue (pH 2.5, Morphisto GmbH, Frankfurt, Germany), and counterstained with hematoxylin (Morphisto GmbH) for histological and histomorphometric analyses.30,31 For osteogenesis evaluation, alizarin red S staining was used to confirm the mineralized matrix for calcium precipitation.32,33 Histological section images were captured at 40x magnification and digitalized using a PreciPoint M8 research microscope (PreciPoint, Freising, Germany) and Viewpoint software (PreciPoint). 22
Image J (https://imagej.nih.gov/ij/) software was used to perform the histomorphometric analysis. The ratio of positive area to total area of each section was calculated as a semiquantitative analysis result.34,35 We used the specific RGB ranges to select the target color in histogram-based mode in Image J to reduce the variance in the selection of the positive area of the different figures. 22 The RGB ranges of our Alcian blue staining positive area were R: 113-233, G: 156-244, and B: 195-245; The RGB ranges of our alizarin red S staining positive area were R: 196-255, G: 6-152, and B: 0-126. 22
Immunohistochemical Analyses
The immunohistochemical analysis method refers to the previous practice of our team. 22 To evaluate new chondrogenesis and osteogenesis within the muscle tissue fragments (n = 144), 2-μm-thick paraffin wax sections were incubated with primary antibody to detect the presence of aggrecan or osteocalcin. The concentration of these two primary antibodies was optimized in a previous test, and then diluted in antibody diluent (Zytomed Systems GmbH, Berlin, Germany) at the concentration of 1:150 for aggrecan antibody (Biorbyt, Eching, Germany) and of 1:150 for osteocalcin (Biorbyt). The antigen-antibody interactions were detected by using Vina Green Chromogen Kit (Biocare Medical), in which a positive reaction generated a green signal. The negative controls were established by using the antibody diluent without any primary antibody.
Immunohistochemically stained sections were captured at 40x magnification using Viewpoint software and digitalized using a PreciPoint M8 research microscope. Image J was used to perform the histomorphometrical analysis. First, the absorbance value of the incident light in the blank surrounding area of the tissue piece was calibrated after which the area of total tissue and the integrated optical density (IOD) value of positive area were measured. The mean optical density (MOD) value of the positive area was then calculated (MOD = IOD/area), which quantified the density of immunostaining and values were expressed, as a mean percentage of six samples.22,36
Real-Time Quantitative Reverse Transcription Polymerase Chain Reaction
The real-time quantitative reverse transcription polymerase chain reaction (qRT-PCR) technology and qRT-PCR analysis method refer to the previous practice of our team. 22 The whole qRT-PCR process was compliant with the Minimum Information for Publication of Quantitative Real-Time PCR Experiments (MIQE) guidelines. 37 Six samples in each group were harvested at day 7, 14, and 30 and immediately frozen in the liquid nitrogen immediately after which they were stored at −80°C. Under RNase-free conditions, frozen samples were ground to powders using a mortar and pestle in liquid nitrogen, and total mRNA was extracted from the muscle tissue fragments using a modified protocol based on the RNeasy Fibrous Tissue Mini Kit (Qiagen, Hilden, Germany). The concentration and quality of RNA were measured spectrophotometrically using a NanoDrop Lite (Thermo Fisher Scientific) and then stored at −80°C until used. Complementary DNA (cDNA) was then reverse transcribed using a QuantiTect Reverse Transcription cDNA Synthesis Kit (Qiagen) and then stored at −20°C until use. 22
Quantitative RT-PCR was performed on a qRT-PCR LightCycler 96 Instrument (Roche, Basel, Switzerland) in duplicate using 2x FastStart Essential DNA Green Master (Roche). The total volume of each reaction was 10 μL containing 5-μL SYBR Green Master, 0.6-μL forward primer (10 μmol/L), 0.6-μL reverse primer (10 μmol/L), 2-μL cDNA (5 ng/μL), and 1.8-μL RNase-free water. The process of thermocycling included a 2-minute denaturation step at 94°C; 40 cycles containing a denaturation, annealing, and extension step set at 95°C for 10 seconds, 60°C for 15 seconds, and 72°C for 30 seconds, respectively; and a final extension at 72°C for 5 minutes. Primer sequences for qRT-PCR were designed utilizing Integrated DNA Technologies (https://eu.idtdna.com/site). Here, PrimeQuest in conjunction with OligoAnalyzer 3.1 was utilized on the Integrated DNA Technologies website (https://eu.idtdna.com/site) and optimized according to the MIQE guidelines ( Table 1 ).22,38,39 GeNorm (https://www.researchgate.net/publication/343548360_GeNorm_v35_xl) assessment determined that TATA-binding protein (Tbp), glyceraldehyde 3-phosphate dehydrogenase (Gapdh), RNA polymerase II subunit e (Polr2e), ribosomal protein lateral stalk subunit P0 (Rplp0), succinate dehydrogenase complex flavoprotein sub-unit A (Sdha), and ribosomal protein L13α (Rpl13α) were the appropriate reference genes to use in this experiment. The angiogenic marker genes of interests included collagen type IV alpha 1 (Col4α1) and vascular endothelial growth factor α (Vegf-α). Transcription factor genes we detected in our study were sex-determining region Y (Sry)-box 9 (Sox9) and runt-related transcription factor 2 (Runx2). Gene expression levels of fundamental makers implicated in chondrogenesis were also assessed specifically aggrecan (Acan) and collagen type II alpha 1 (Col2α1). The expressions of bone morphogenetic protein 2 (Bmp-2), osteocalcin (Ocn), alkaline phosphates (Alp) and collagen type I alpha 1 (Col1α1) were detected to prove the osteogenesis.
Gene Primers for Rattus norvegicus With Accession Number and Sequence.
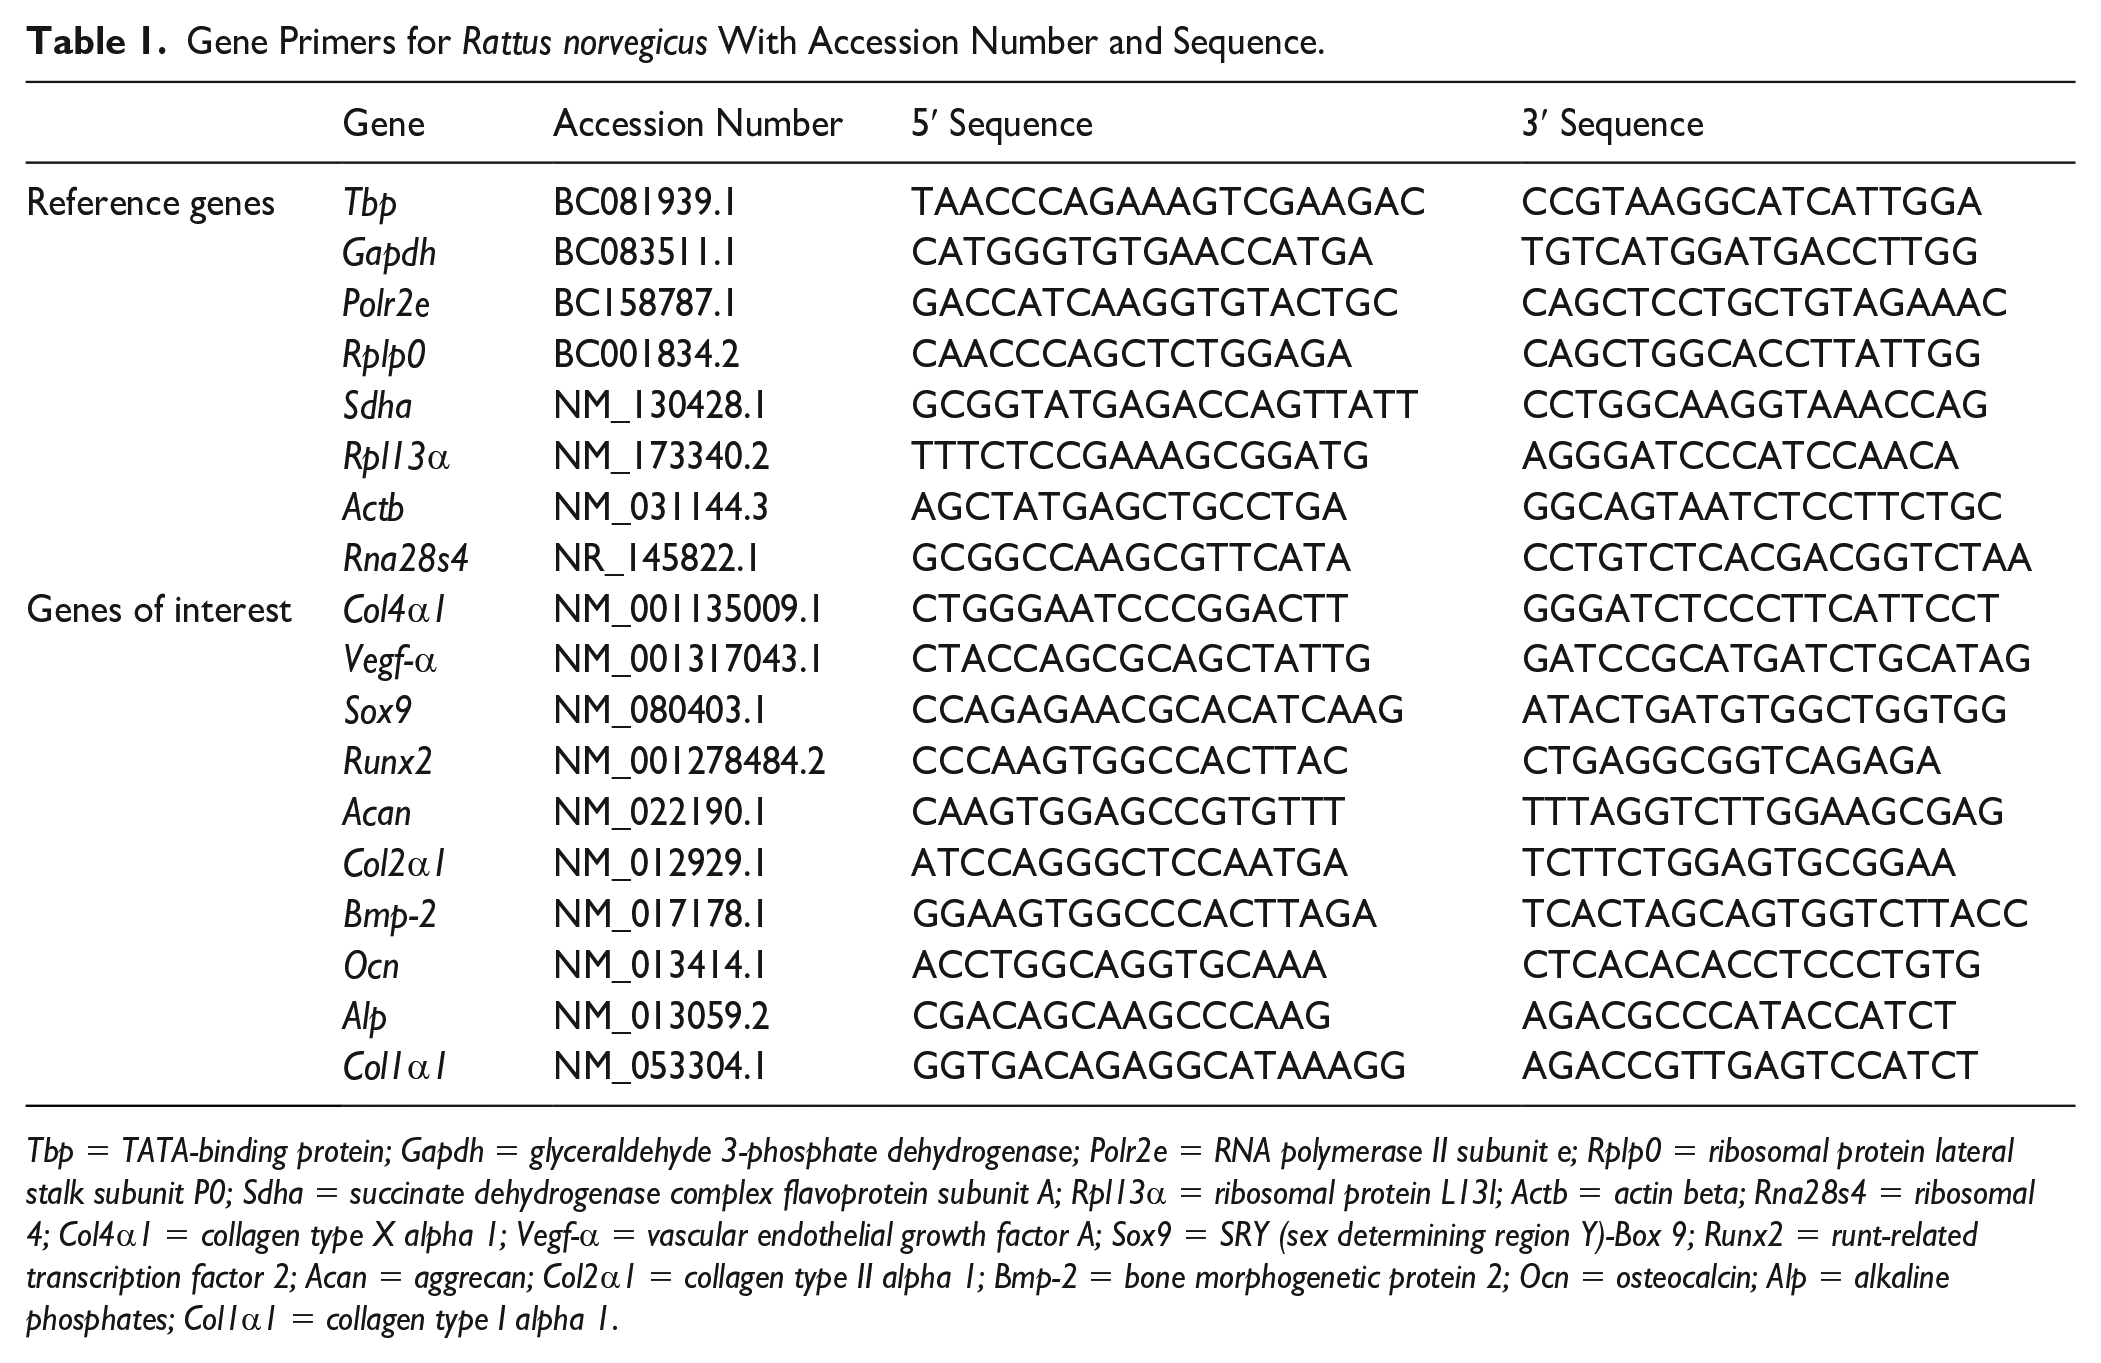
Tbp = TATA-binding protein; Gapdh = glyceraldehyde 3-phosphate dehydrogenase; Polr2e = RNA polymerase II subunit e; Rplp0 = ribosomal protein lateral stalk subunit P0; Sdha = succinate dehydrogenase complex flavoprotein subunit A; Rpl13α = ribosomal protein L13l; Actb = actin beta; Rna28s4 = ribosomal 4; Col4α1 = collagen type X alpha 1; Vegf-α = vascular endothelial growth factor A; Sox9 = SRY (sex determining region Y)-Box 9; Runx2 = runt-related transcription factor 2; Acan = aggrecan; Col2α1 = collagen type II alpha 1; Bmp-2 = bone morphogenetic protein 2; Ocn = osteocalcin; Alp = alkaline phosphates; Col1α1 = collagen type I alpha 1.
Sequence amplification specificity of all genes was confirmed through Sanger sequencing (Eurofins GATC Biotech, Luxembourg, Belgium) in conjunction with nucleotide mega-blast analysis (https://blast.ncbi.nlm.nih.gov/Blast.cgi?PAGE_TYPE=BlastSearch).34,35 The qBase analysis software (http://www.biogazelle.com) was used to calculate the relative gene expressions and the results were represented as calibrated normalized relative quantities (CNRQ). Fresh muscle tissue was also harvested and acted as the normalization control in qRT-PCR to which all specimens were compared to, which means its CNRQ value was scaled as the basic level. 22
Statistical Analysis
GraphPad Prism (version 7.0; GraphPad Software, San Diego) was used to perform the statistical analysis on qRT-PCR and histomorphometric data of both histological and immunohistochemistry material and draw the charts. 22 A one-way analysis of variance (ANOVA) with Dunnett’s multiple comparison test was used to determine the statistical differences between different experimental groups and corresponding control groups. A one-way ANOVA with Tukey’s multiple comparison test was used to determine the statistical differences between each experimental group at each test time point and their previous time point. Statistical significance was defined at P < 0.05. 22 Data were compiled from the various treatment modalities for each of the culturing time point. Hierarchical clustering and the generated heatmaps were created using Rstudio (RStudio, Boston, MA, http://www.rstudio.com). The distance measure used in the clustering rows and the column was Euclidean, whereas the agglomeration method used to create the clusters was based on the average. The heatmap was divided into two final clusters. 22
Results
QRT-PCR
Expression of angiogenic marker genes in response to different combinations of TGF-β superfamily protein treatments
Overall assessment of Vegf-α and Col4α1 expression, which are associated with the progression of vasculogenesis and angiogenesis, respectively, in the groups with continuously applied morphogen(s) showed that most treatment groups (except rBMP-2 + rOP-1 group) were upregulated except expression of Col4α1 in the control group at day 30. At day 7, the expressions of Vegf-α in all experimental groups were significantly higher than the corresponding control group except the rBMP-2 only group, while the only significantly higher expression of Col4α1 was only found in rBMP-2 + rTGF-β3 + rOP-1 group ( Fig. 1 ).
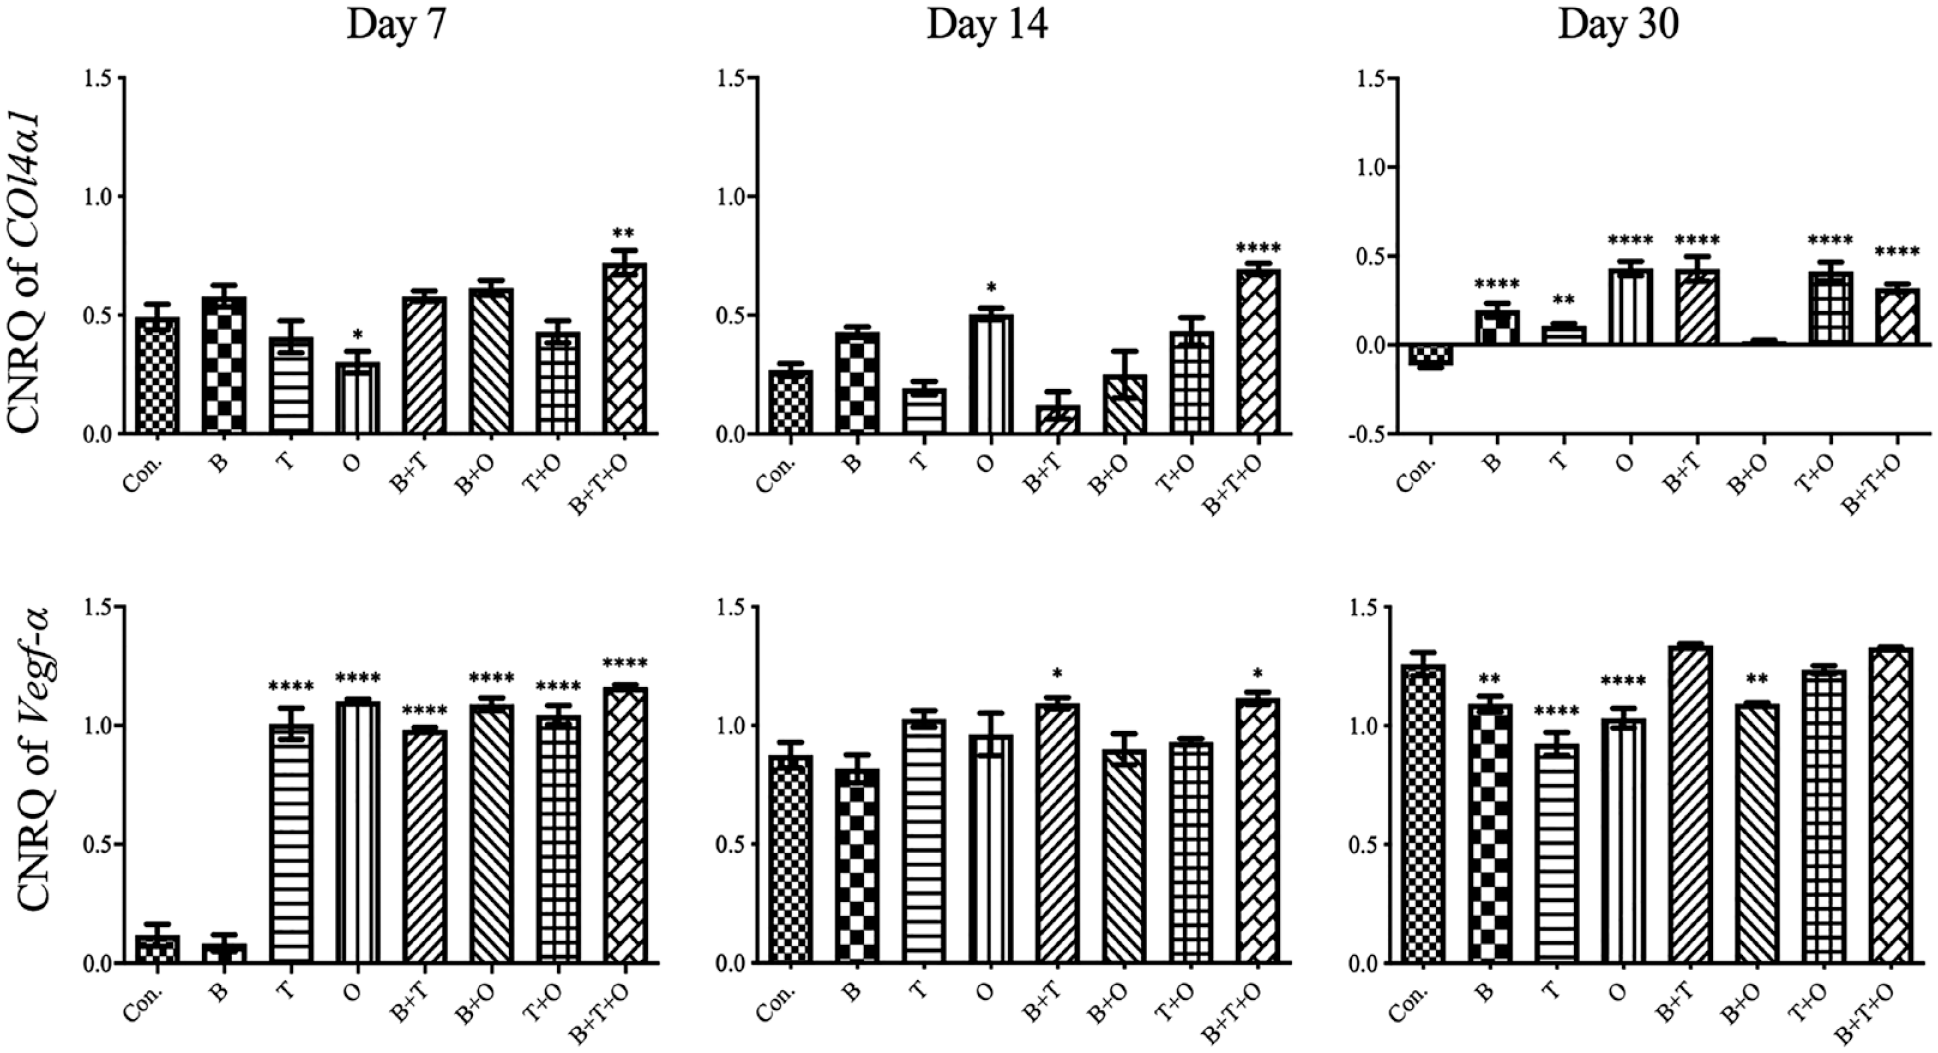
The analyses of the relative gene expression levels of collagen type IV alpha 1 (Col4α1) and vascular endothelial growth factor α (Vegf-α). The results were presented as calibrated normalized relative quantity (CNRQ). Comparisons between each experimental group under different stimulation modes and the corresponding control group at day 7, 14, and 30 using analysis of variance (ANOVA). Con. = control group; BMP = bone morphogenetic protein; TGF = transforming growth factor; B = rBMP-2 treated group; T = rTGF-β3 treated group; O = rOP-1 treated group; B+T = rBMP-2 + rTGF-β3 treated group; B+O = rBMP-2 + rOP-1 treated group; T+O = rTGF-β3 + rOP-1 treated group; B+T+O = rBMP-2 + rTGF-β3 + rOP-1 treated group. We defined P < 0.05 as a statistically significant difference. *P < 0.05, **P < 0.01, ****P < 0.0001.
Analyzing the gene expression patterns over time for Col4α1, although most of the experimental groups showed a decreasing expression pattern, most of them were significantly upregulated compared with the control group at day 30 (Suppl. Fig. S1, Fig. 1 ). The Col4α1 expression in the control group decreased continuously and even become negative at day 30 (Suppl. Fig. S1, Fig. 1 ). The expression of Vegf-α showed an upward trend over time, but all experimental groups either showed the relative downregulated expression level or no difference when comparing with the control group at day 30 (Suppl. Fig. S2, Fig. 1 ).
Transcription factor expression patterns in response to different combinations of TGF-β superfamily protein treatments
Overall evaluation of Sox9 expression in all treatment groups was significantly upregulated compared with the corresponding culturing control at all the three time points. At day 7, the Sox9 expression in the rBMP-2 group was significantly upregulated over all other groups. When muscle tissue was exposed to rTGF-β3 + rOP-1 and rBMP-2 + rTGF-β3 + rOP-1, the expression of Sox9 was upregulated significantly compared with other groups at day 14 and day 30, respectively ( Fig. 2 ). The relative expression of Runx2 was significantly upregulated in all experimental groups than in the corresponding control groups. Similar to the expression pattern of Sox9, the greatest upregulation of Runx2 occurred in rBMP-2 and rBMP-2 + rTGF-β3 + rOP-1 groups at day 7 and 30, respectively, while rBMP-2 + rTGF-β3 + rOP-1 group also showed significantly higher expression from all the other experimental groups at day 14 ( Fig. 2 ).
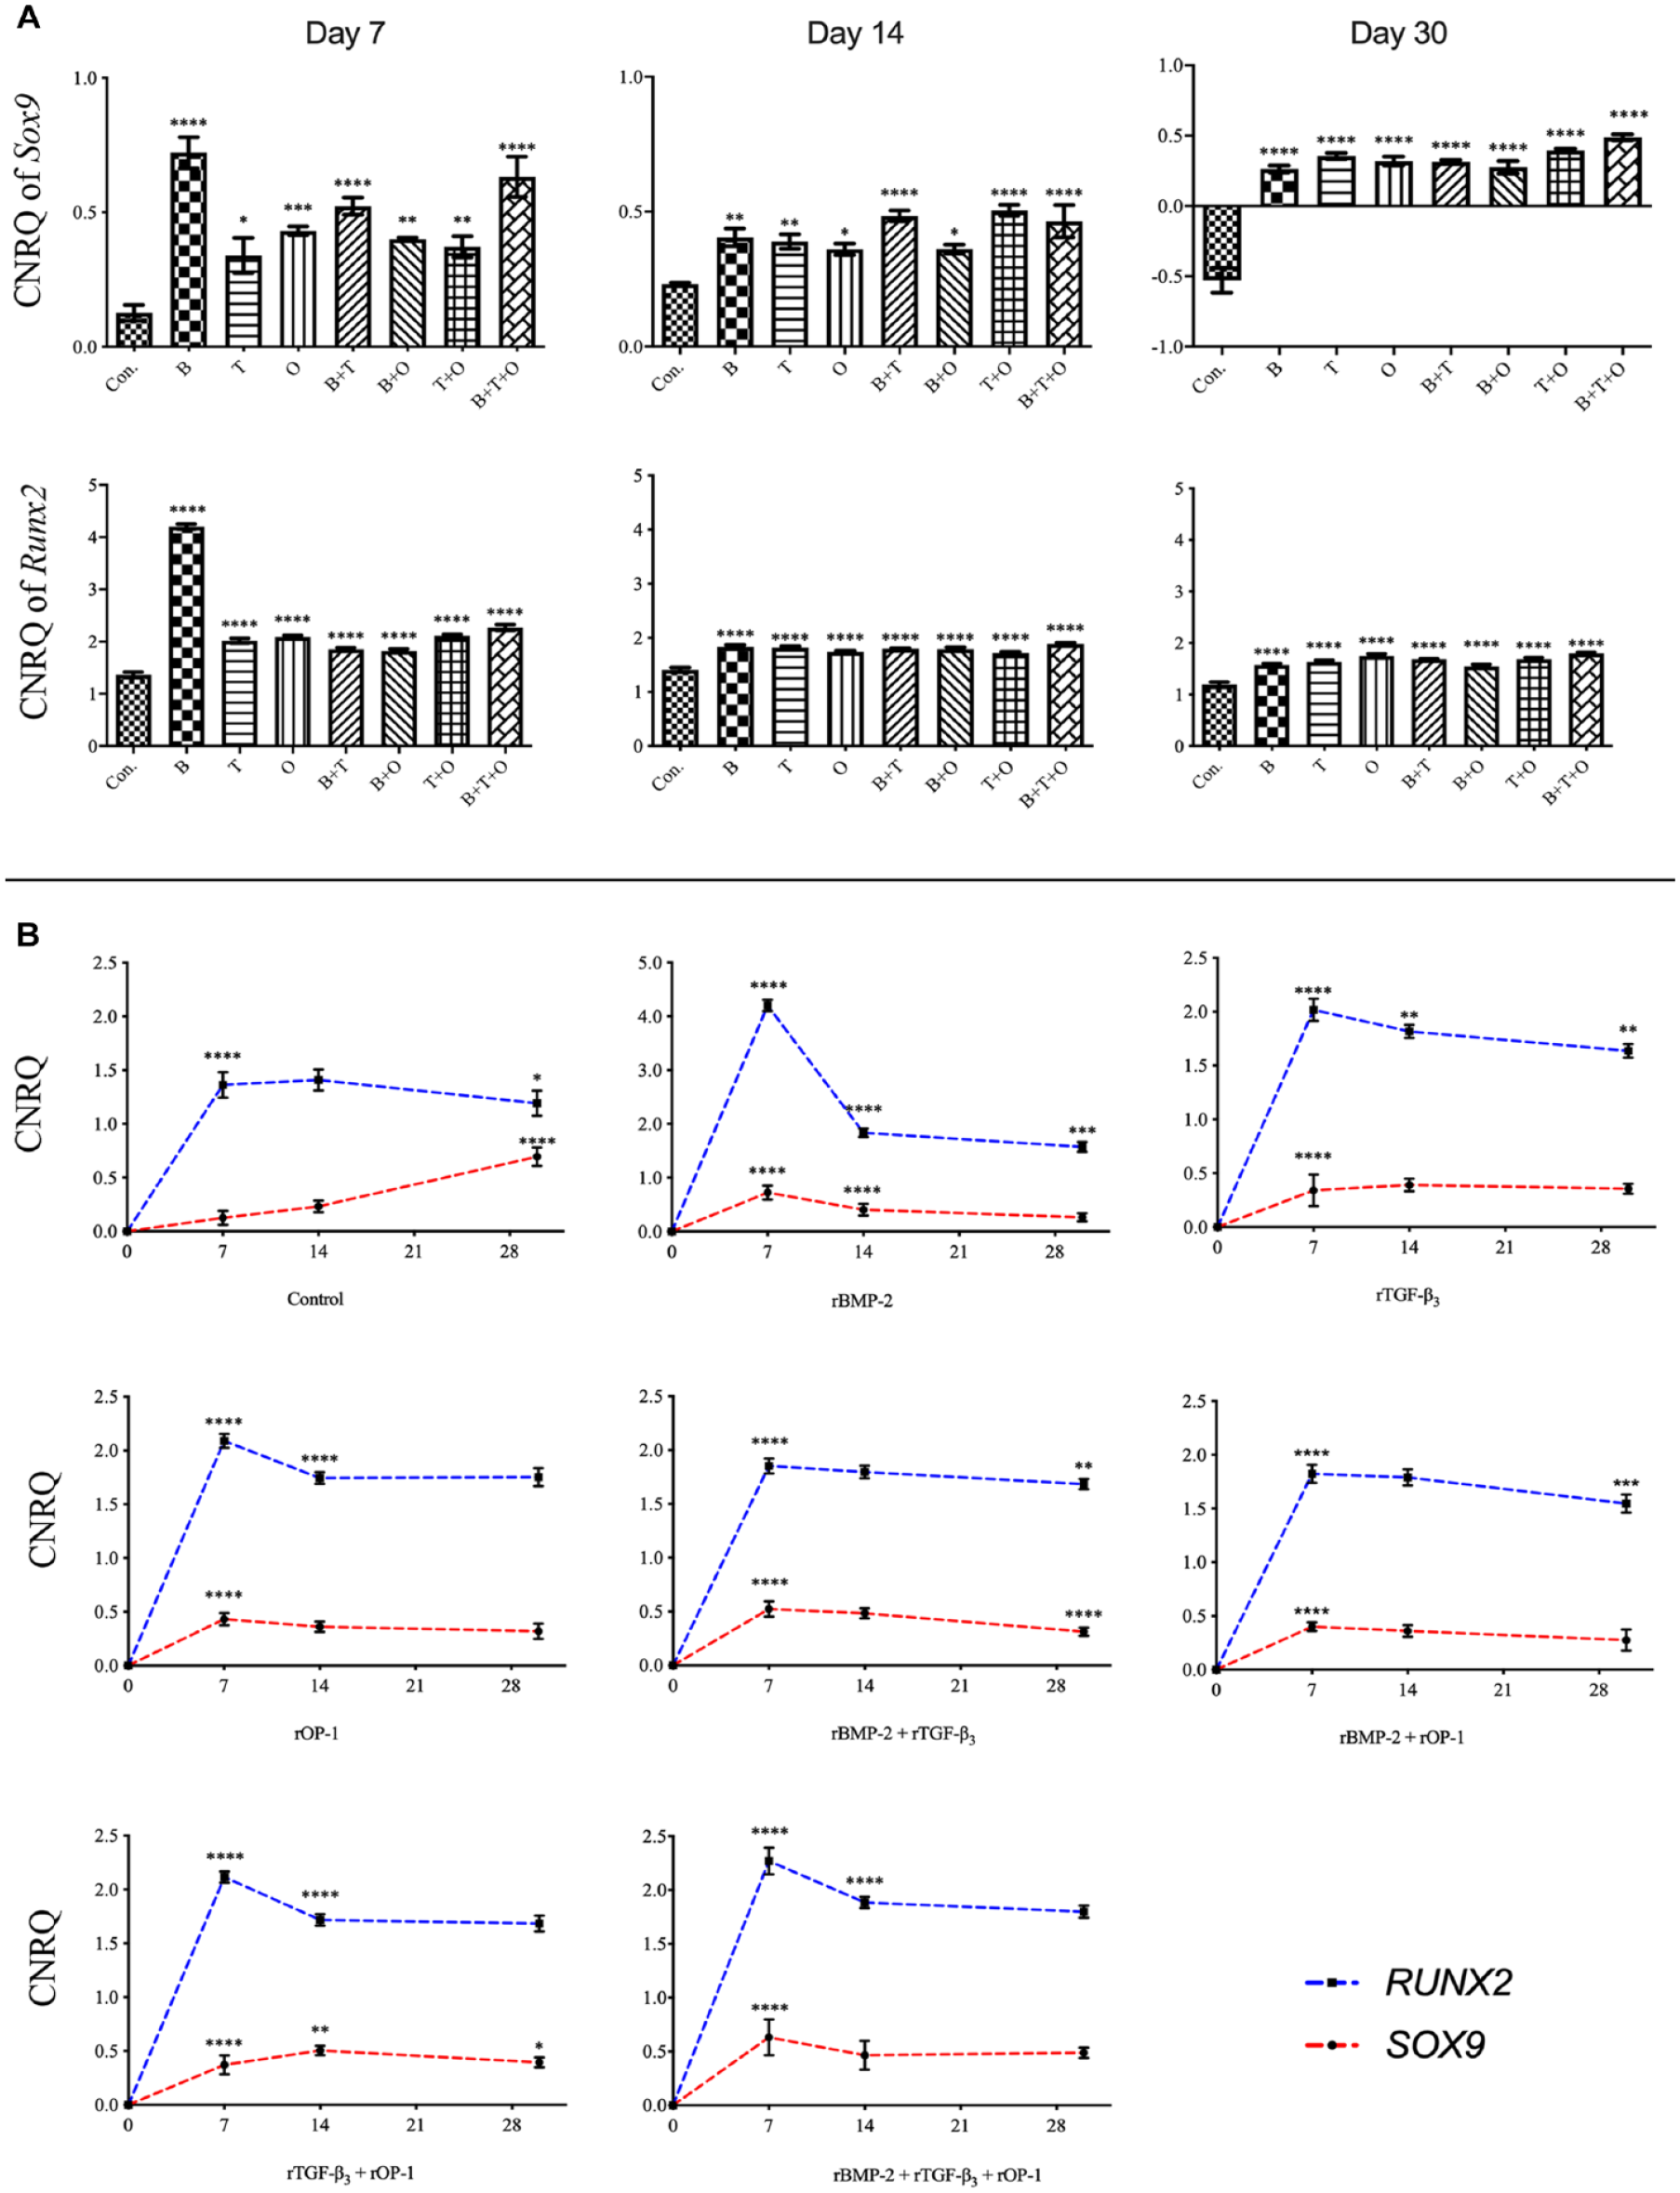
The analyses of the relative gene expression levels of sex-determining region Y (SRY)-box 9 (Sox9) and runt-related transcription factor 2 (Runx2). The results were presented as calibrated normalized relative quantity (CNRQ).
Evaluating the patterns of gene expression over time for Sox9 or Runx, the relative expression of these two transcription factors in most experimental groups reached their peak at day 7 and then decreased. However, the expression of Sox9 in the control group showed a continuously increasing pattern ( Fig. 2 ).
Expression pattern of chondrogenic marker genes in response to different combinations of TGF-β superfamily protein treatments
Overall assessment of Acan in all treatment groups was significantly upregulated compared with the control at all three culturing time points. The Acan expression in the rBMP-2 group only was significantly upregulated over all other groups at day 7, while the expression was upregulated significantly in rTGF-β3 + rOP-1 at day 14 compared with any other groups except for the rOP-1 group. The greatest upregulation of Acan occurred in rBMP-2 + rTGF-β3 + rOP-1 group at day 30 ( Fig. 3 ).
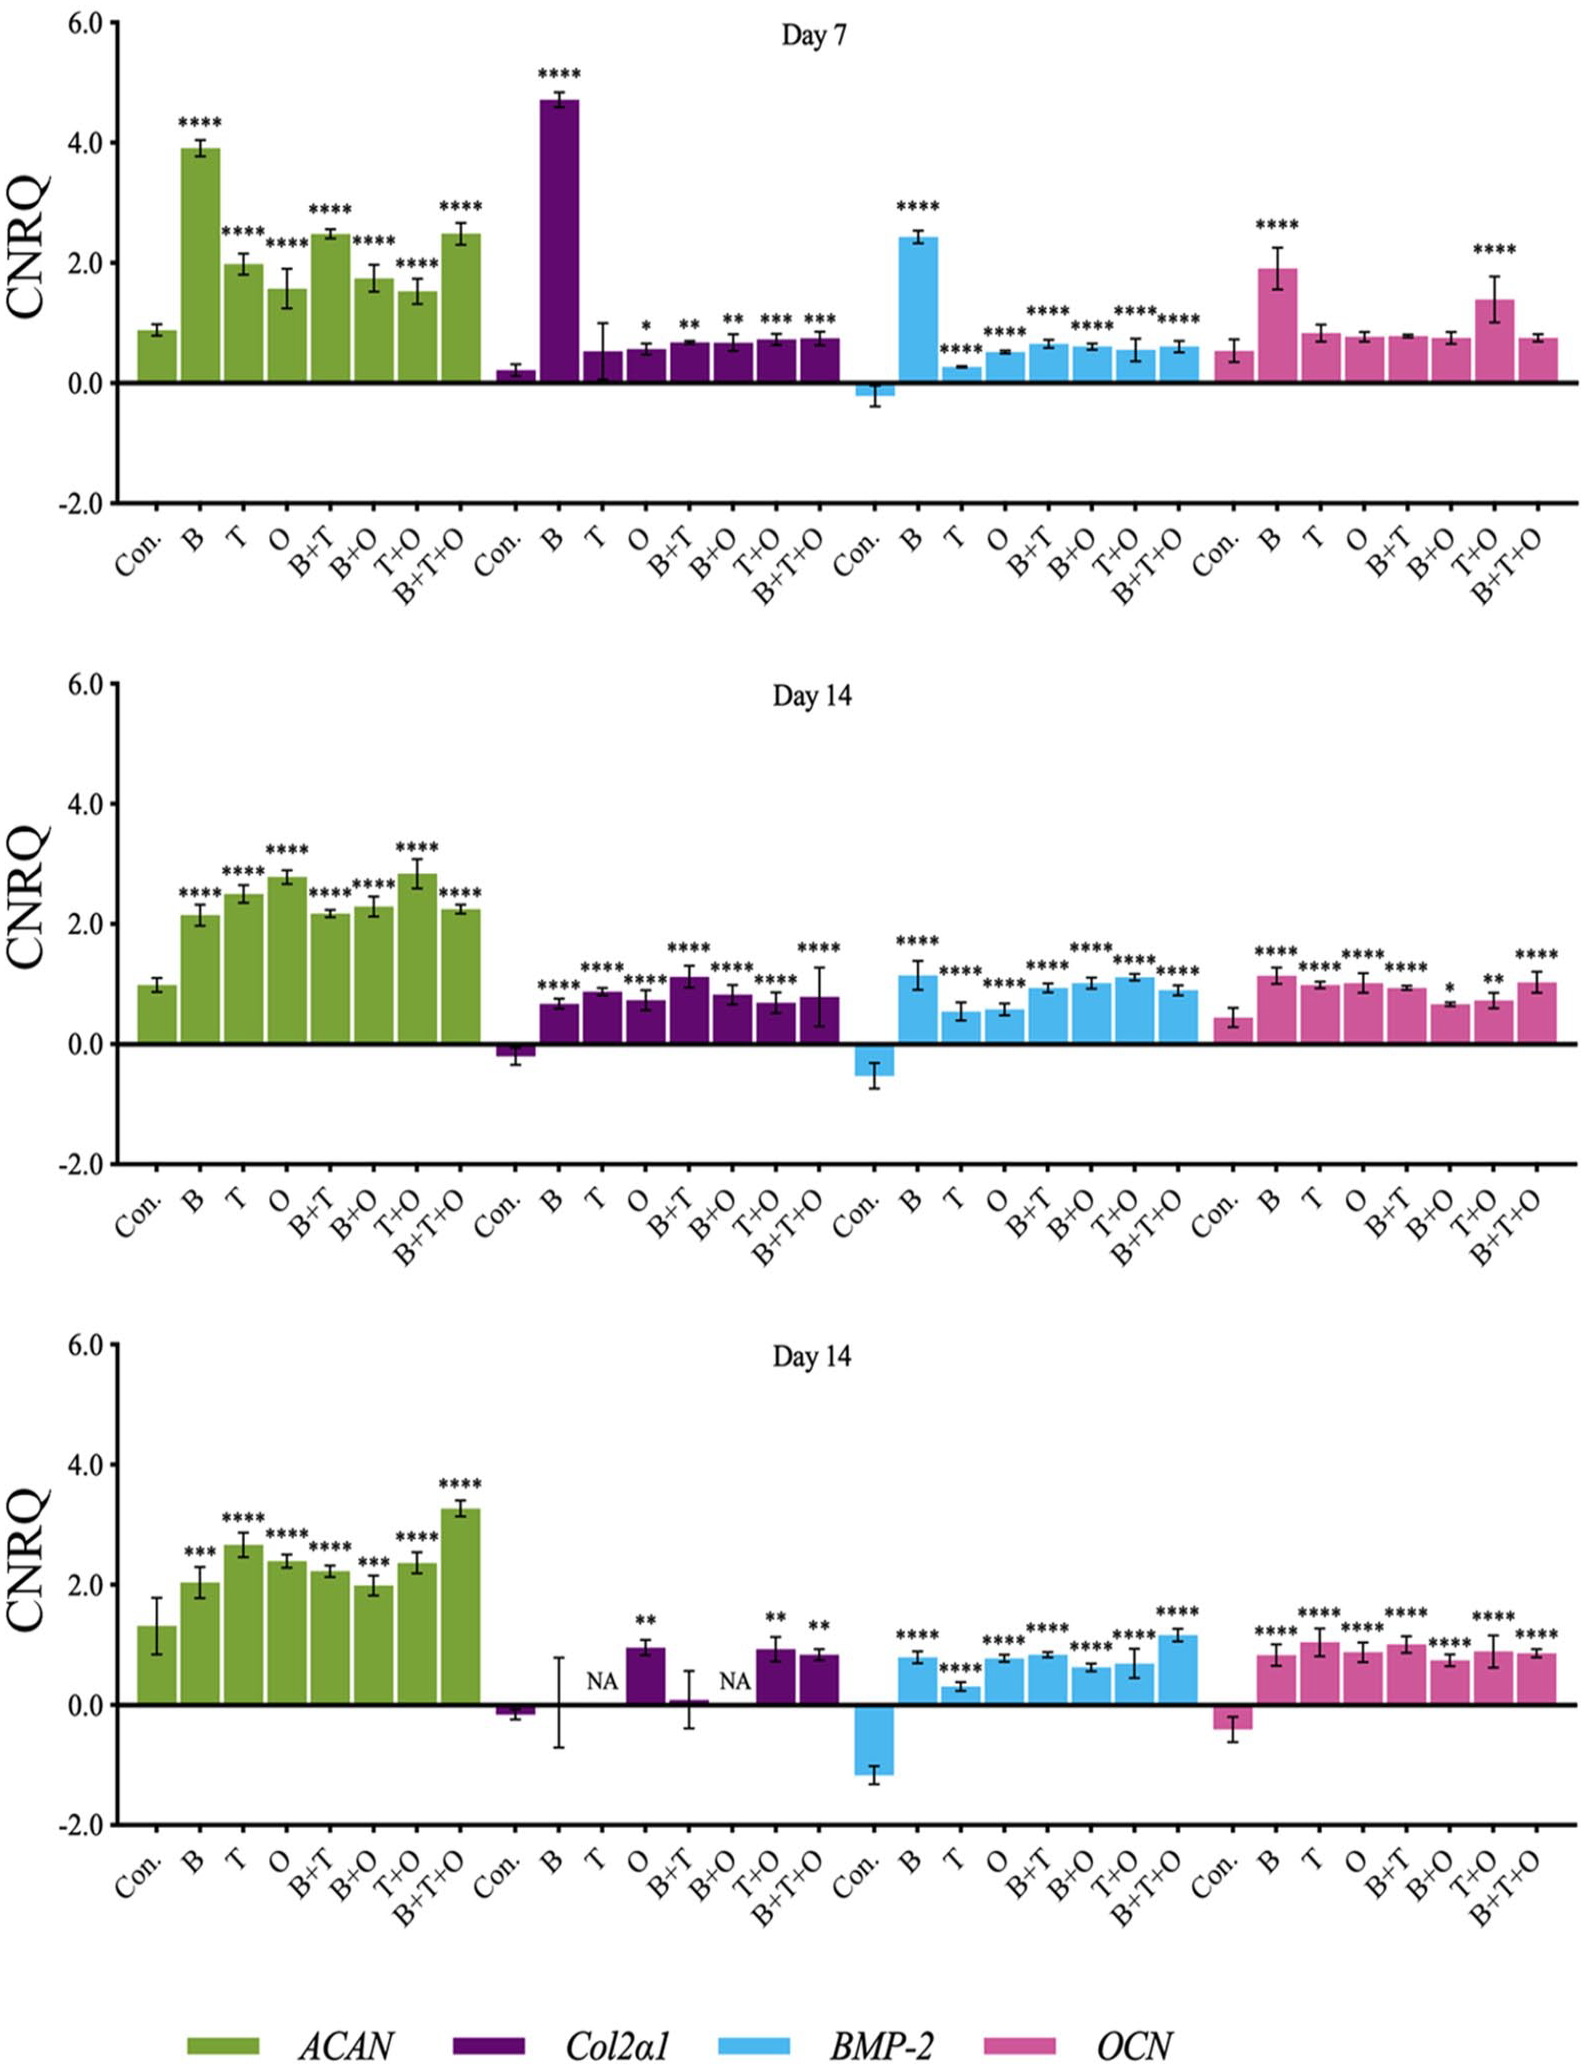
The analyses of the relative gene expression levels of aggrecan (Acan), collagen type II alpha 1 (Col2α1), bone morphogenetic protein 2 (Bmp-2), and osteocalcin (Ocn). The results were presented as calibrated normalized relative quantity (CNRQ). Comparisons between each experimental group under different stimulation modes and the corresponding control group at day 7, 14, and 30 using analysis of variance (ANOVA). Con. = control group; BMP = bone morphogenetic protein; B = rBMP-2 treated group; TGF = transforming growth factor; T = rTGF-β3 treated group; O = rOP-1 treated group; B+T = rBMP-2 + rTGF-β3 treated group; B+O = rBMP-2 + rOP-1 treated group; T+O = rTGF-β3 + rOP-1 treated group; B+T+O = rBMP-2 + rTGF-β3 + rOP-1 treated group. We defined P < 0.05 as a statistically significant difference. *P < 0.05, **P < 0.01, ***P < 0.001, ****P < 0.0001.
Analyzing the temporal gene expression patterns for Acan, the expression of Acan in the group with rBMP-2 and rBMP-2 + rTGF-β3 peaked at day 7 and then severely decreased. The Acan expressions in rTGF-β3, rOP-1, rBMP-2 + rOP-1, and rTGF-β3 + rOP-1 groups peaked on day 14 and then maintained stable or decreased slightly. The relative expression of Acan in rBMP-2 + rTGF-β3 + rOP-1 group upregulated significantly from day 14 and then greater than all other treatment groups at day 30 (Suppl. Fig. S3).
The Col2α1 expression cannot be detected in some samples at day 30 resulting in the data volume gap for rTGF-β3 and rBMP-2 + rOP-1 so that the statistical analysis was limited. At day 7 and 14, the Col2α1 expressions in most groups showed significantly upregulated compared with the corresponding control group except for the rTGF-β3 group at day 7. The relative expressions in rBMP-2 and rBMP-2 + rTGF-β3 groups were highest compared with other groups at day 7 and 14, respectively ( Fig. 3 ).
Similar to the temporal expression pattern of Acan, rBMP-2 group showed a sharply significant decrease after day 7, and rBMP-2 + rTGF-β3 group also decreased significantly from day 14. The other groups showed a decreasing or stable state from day 7 (Suppl. Fig. S4).
Expression pattern of osteogenic marker genes in response to different combinations of TGF-β superfamily protein treatments
The relative expression of Bmp-2 in the culturing control group was significantly downregulated at all three time points and showed a continuously decreasing pattern. Similar to Acan, overall analyzing of Bmp-2 expression in all treatment groups was significantly upregulated compared with the control at all three time points. The expression of Bmp-2 in the rBMP-2 group was significantly upregulated over all other groups at day 7 and 14, although it decreased continuously over time. The greatest upregulation of Bmp-2 occurred in rBMP-2 + rTGF-β3 + rOP-1 group at day 30 (Fig. 3).
Analyzing the patterns of Bmp-2 expression over time, the control group showed a significantly downregulated pattern. Among all the treatment groups, the Bmp-2 expression in rBMP-2 group peaked at day 7 and then severely decreased to a stable lower upregulated pattern. The expressions of Bmp-2 in rTGF-β3, rBMP-2 + rTGF-β3, rBMP-2 + rOP-1, and rTGF-β3 + rOP-1 groups peaked on day 14 and then maintained stable or decreased slightly. The relative expression of Bmp-2 in rOP-1 and rBMP-2 + rTGF-β3 + rOP-1 groups showed a continuous increasing trend from day 7 (Suppl. Fig. S5).
The relative Ocn expression in the control group was continuously decreasing over time and showed significantly downregulated at day 30. The Ocn expressions in all experimental groups were significantly higher than the corresponding control groups at day 14 and 30. Similar to Bmp-2, the greatest upregulation of Ocn occurred in the rBMP-2 group showed the highest relative expression level both on day 7 and 14, while Ocn was upregulated most significantly in the rTGF-β3 group at day 30 ( Fig. 3 ).
Analyzing the temporal gene expression patterns for Ocn, the Ocn expression in the rBMP-2 and rTGF-β3 + rOP-1 groups decreased significantly, while the other three experimental groups reached their peak at day 14 and then decreased or kept stable from day 7 (Suppl. Fig. S6).
The relative expression of Alp was only upregulated in the rBMP-2 group at day 7 followed by a significant decrease in the expression pattern over time. All the other groups were significantly downregulated over the entire culturing period and showed a decreasing pattern (Suppl. Figs. S7 and S8).
The relative Col1α1 expression in the control group showed a continuously increasing pattern. On overall assessment of Col1α1 expression, the expression levels in most treatment groups were significantly downregulated at all time points versus the corresponding cultured control group, except the rTGF-β3 + rOP-1 and rBMP-2 + rTGF-β3 + rOP-1 groups that showed no difference at day 30 and the rTGF-β3 group was upregulated at day 30 (Suppl. Fig. S7). The relative expression levels in most experimental groups were highly downregulated at day 7 followed by a significant gradual increase in the expression pattern over time with Col1α1 being slightly upregulated by day 30, while in the rBMP-2 + rOP-1 group, Col1α1 remained downregulated (Suppl. Fig. S9).
The hierarchical clustering analysis of chondrogenic and osteogenic marker genes in response to different combinations of TGF-β superfamily protein treatments
All the groups (containing six replicate samples in each group) were analyzed using hierarchical clustering for all three time points. At day 7 (
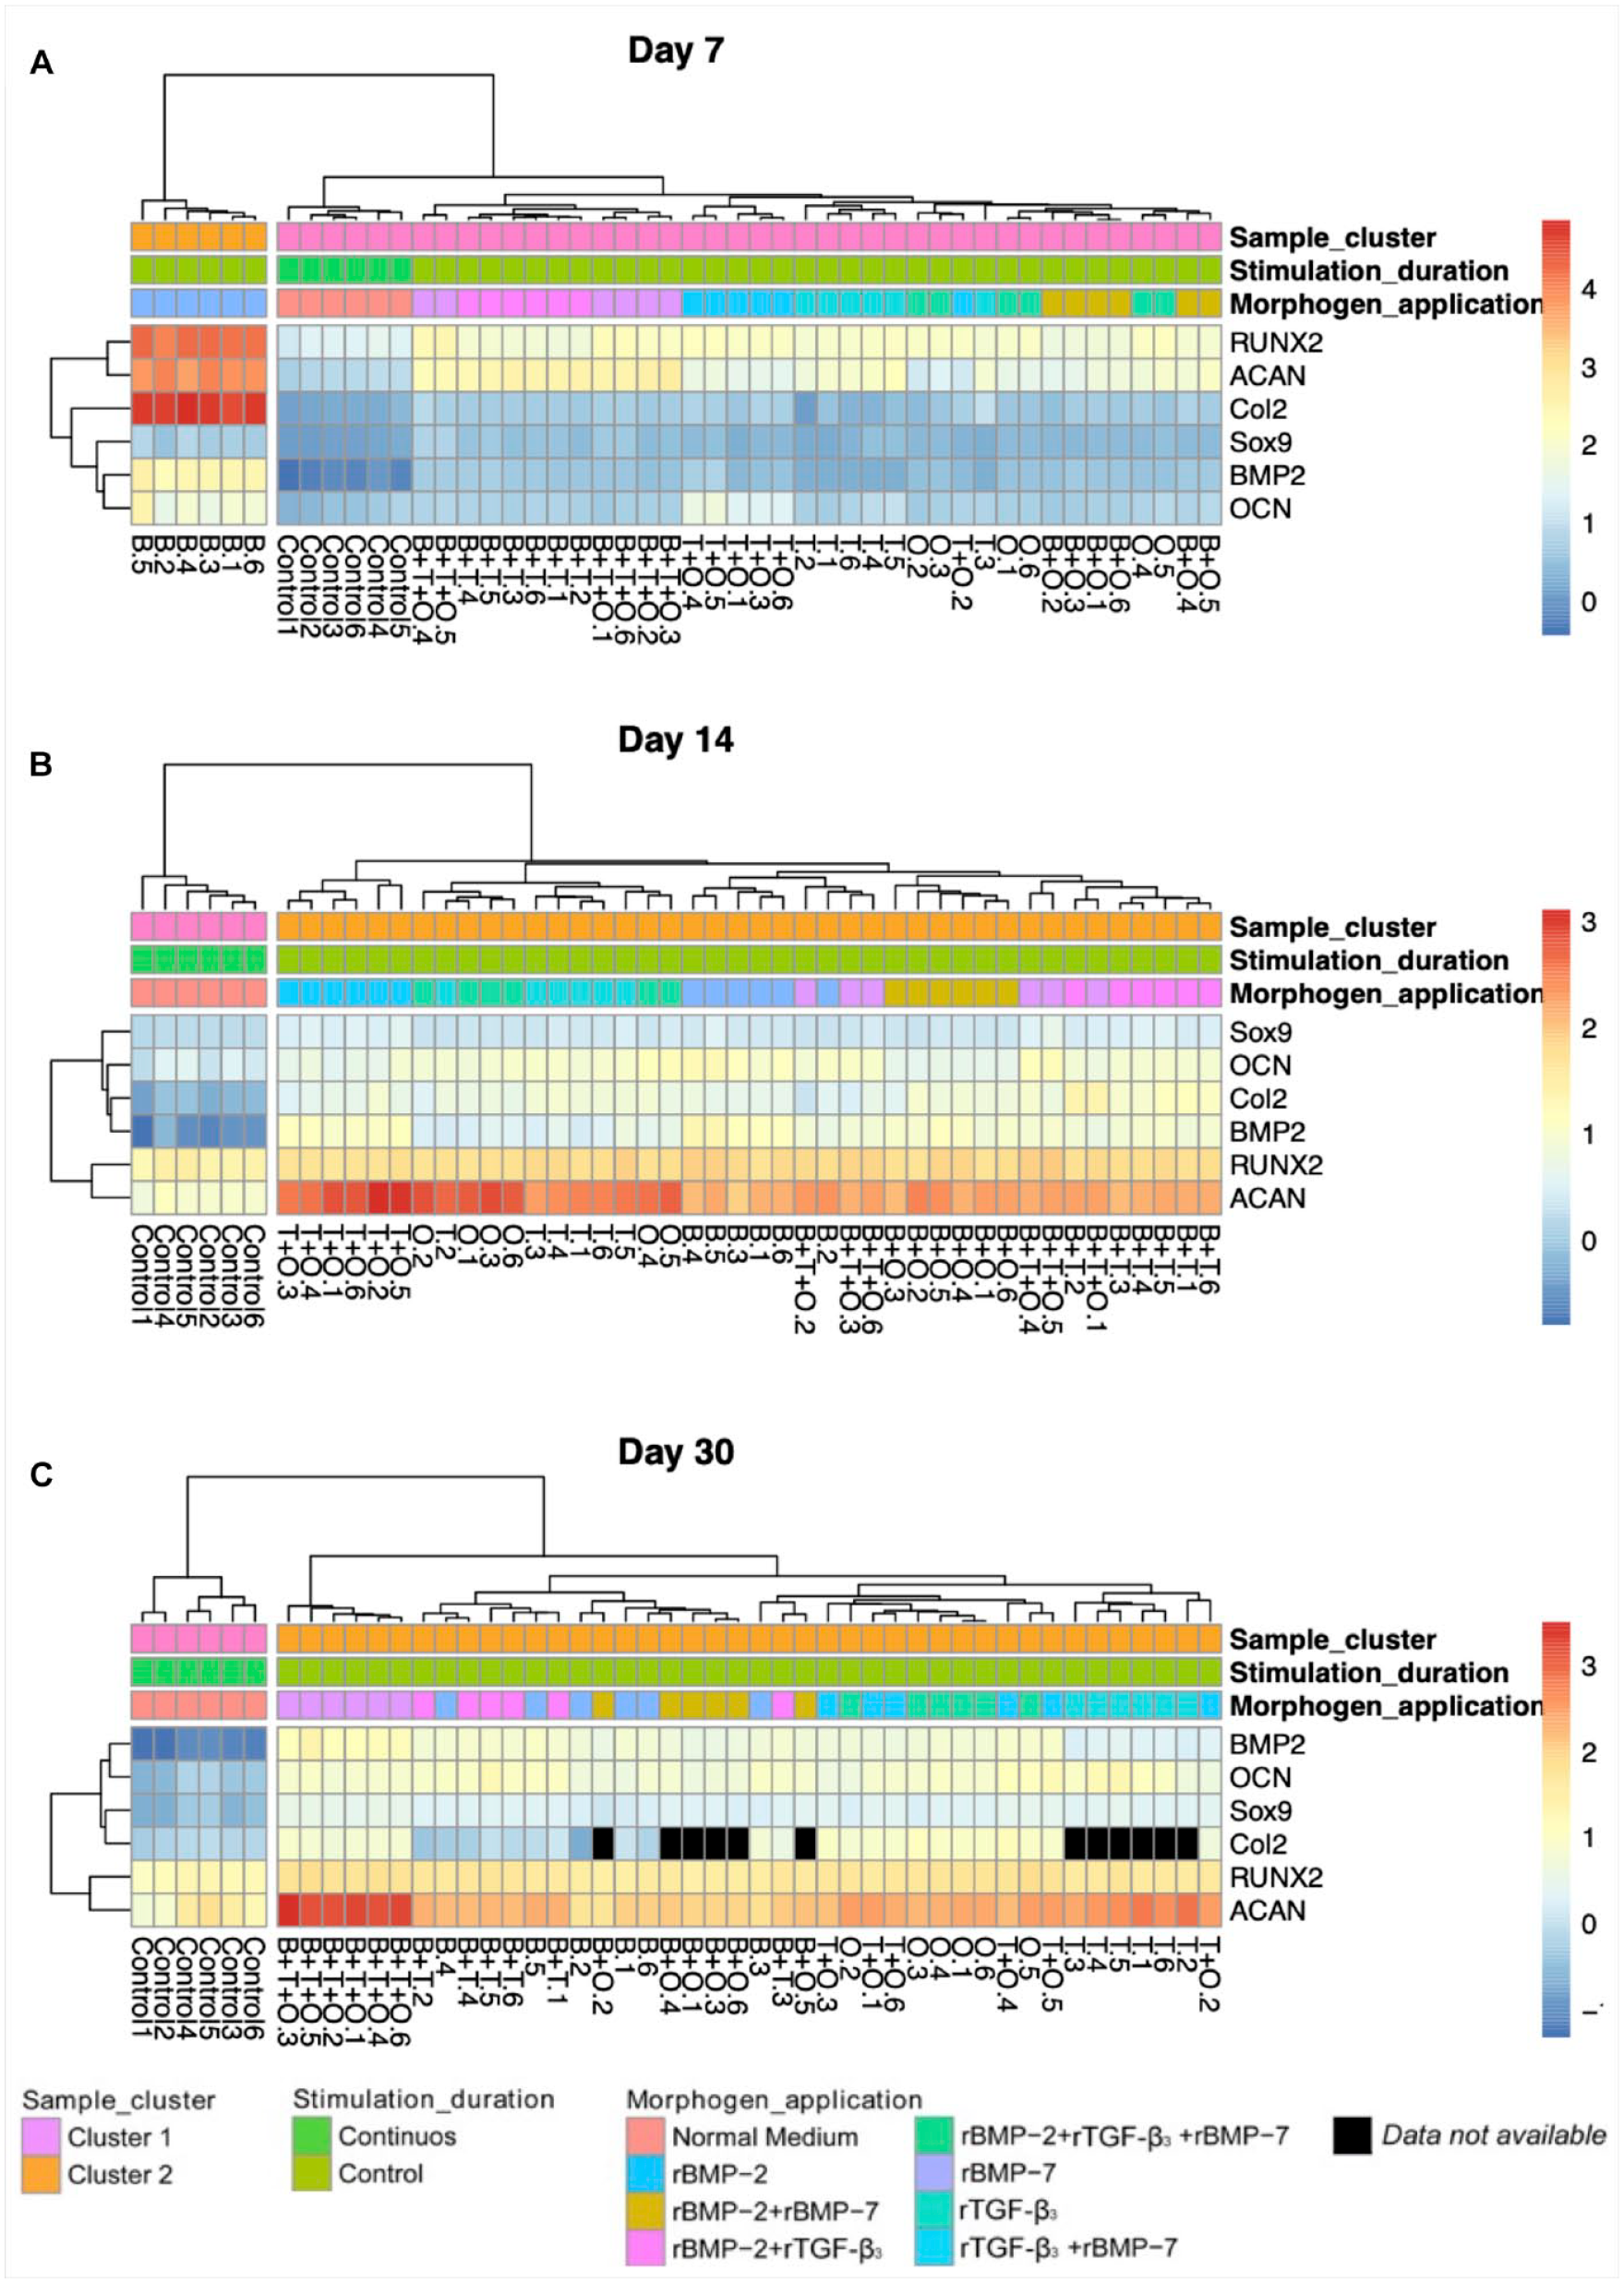
Hierarchical clustering of gene expression of all the samples at day 7
Histology and Immunohistochemistry
Samples were stained by alizarin red S and Alcian blue, and immunohistochemistry was performed with two target antigens (aggrecan and osteocalcin). Subsequently, we performed a semiquantitative analysis, including the percentage of positive areas for histology and the MOD for immunohistochemistry.
Alizarin red S and Alcian blue staining
Alizarin red S staining confirmed osteogenic morphogenesis under our experimental conditions. Alizarin red S staining showed the presence of calcium deposits in osteogenic culture and the positive area was stained in red. The positive areas were mainly presented in the intercellular space and the staining at the edge of the section was deeper than that of the central area ( Fig. 5 ). Semiquantitative analysis revealed that the application of growth factors did not cause a difference between the experimental group and the control group in osteogenic staining at the initial stage. The highest ratio was found in the rBMP-2 + rTGF-β3 + rOP-1, rBMP-2 + rTGF-β3, and rBMP-2 groups at day 7, 14, and 30, respectively ( Fig. 6 , Suppl. Fig. S10).
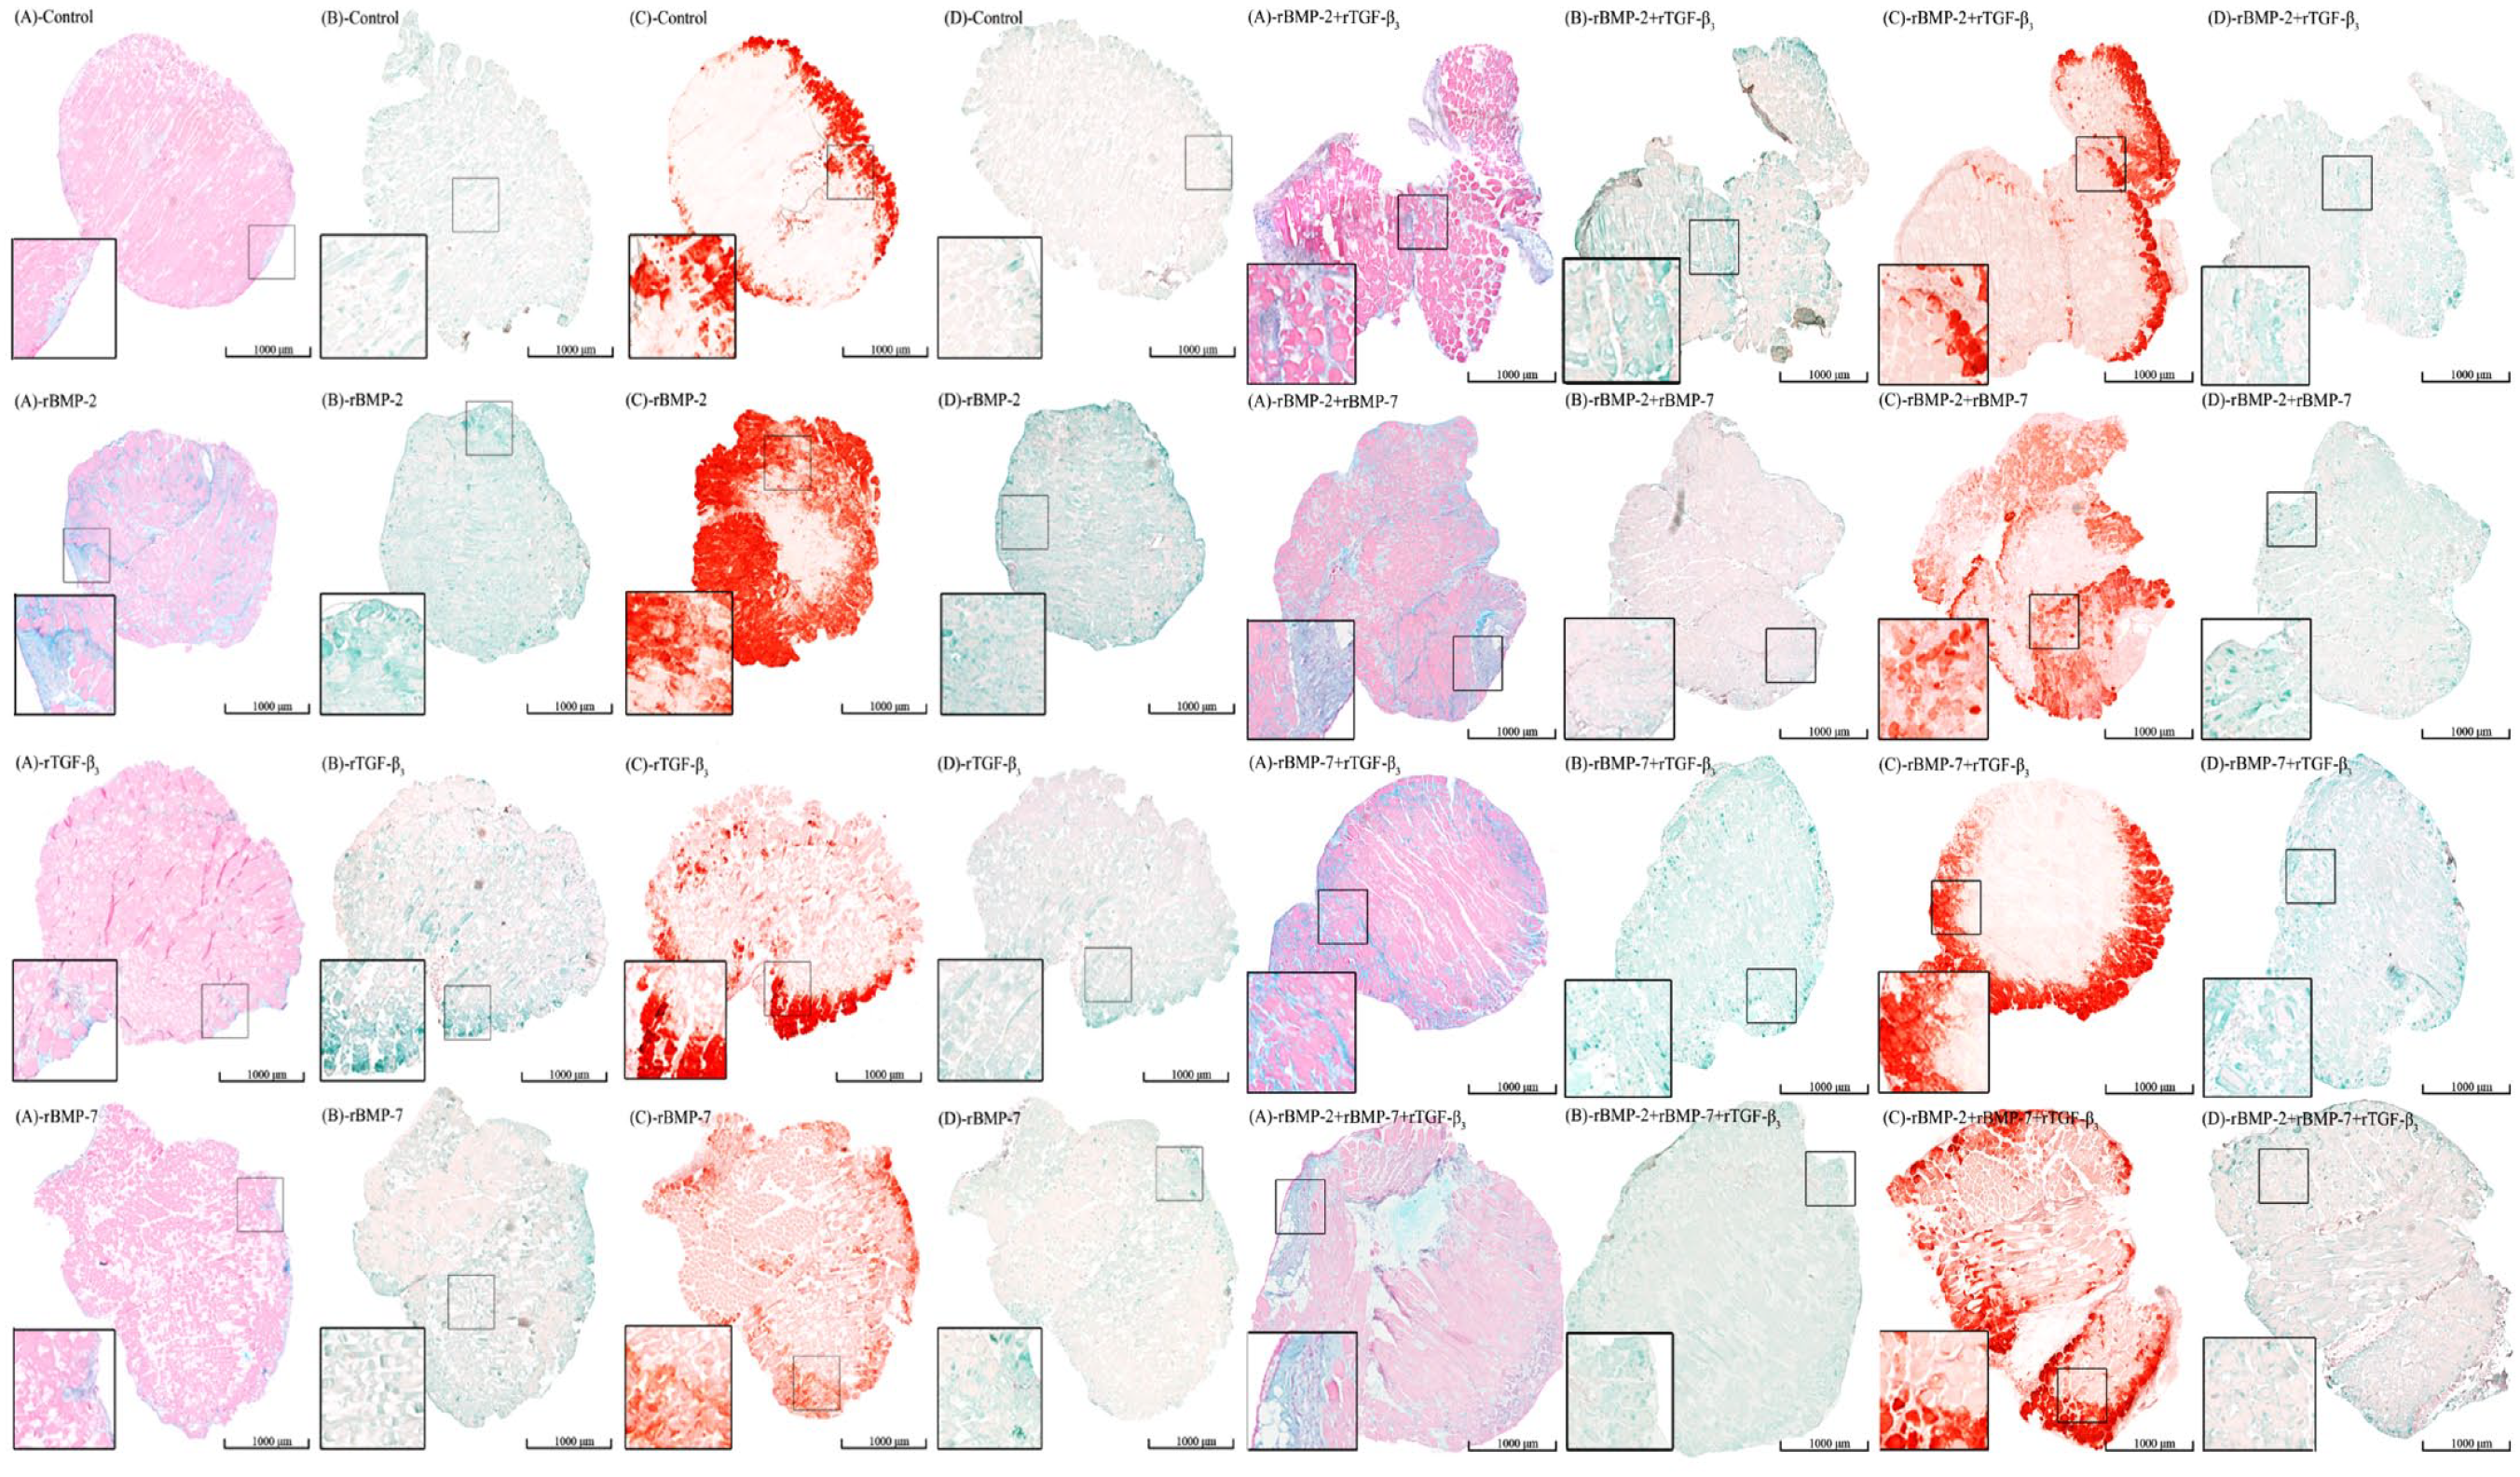
The histology and immunohistochemistry results of each group at day 30. The histological staining including Alcian blue and alizarin red S staining. Two target antigens were detected in the immunohistochemistry, which were aggrecan and osteocalcin. The color of positive reaction in Alcian blue was blue which indicated the deposition of acidic polysaccharides. The color of positive reaction in alizarin red S was dark red which indicated the calcium deposition. The color of the positive antigen-antibody interactions in this immunohistochemistry was green, which show the presence of aggrecan and osteocalcin. BMP = bone morphogenetic protein; TGF = transforming growth factor; B = rBMP-2 treated group; T = rTGF-β3 treated group; O = rBMP-7 treated group; B+T = rBMP-2 + rTGF-β3 treated group; B+O = rBMP-2 + rBMP-7 treated group; T+O = rTGF-β3 + rBMP-7 treated group; B+T+O = rBMP-2 + rTGF-β3 + rBMP-7 treated group.
Alcian blue staining was used to detect the chondrogenic morphogenesis in our experiment. Alcian blue staining showed the presence of glycosaminoglycans in cartilages as well as other body structures, and the positive area was stained in blue. 22 The positive area was found in nearly all the groups at all time points. The positive areas were mainly presented in the intercellular space or near the fascia ( Fig. 5 ). In the control group, the positive area ratios of Alcian blue staining were lower than 5% at all three time points, although it showed an increasing trend. The highest ratio of positive Alcian blue staining was found in the rOP-1 group at both day 7 and 30, while was found in the rBMP-2 + rOP-1 group at day 14 ( Fig. 6 , Suppl. Fig. S10).
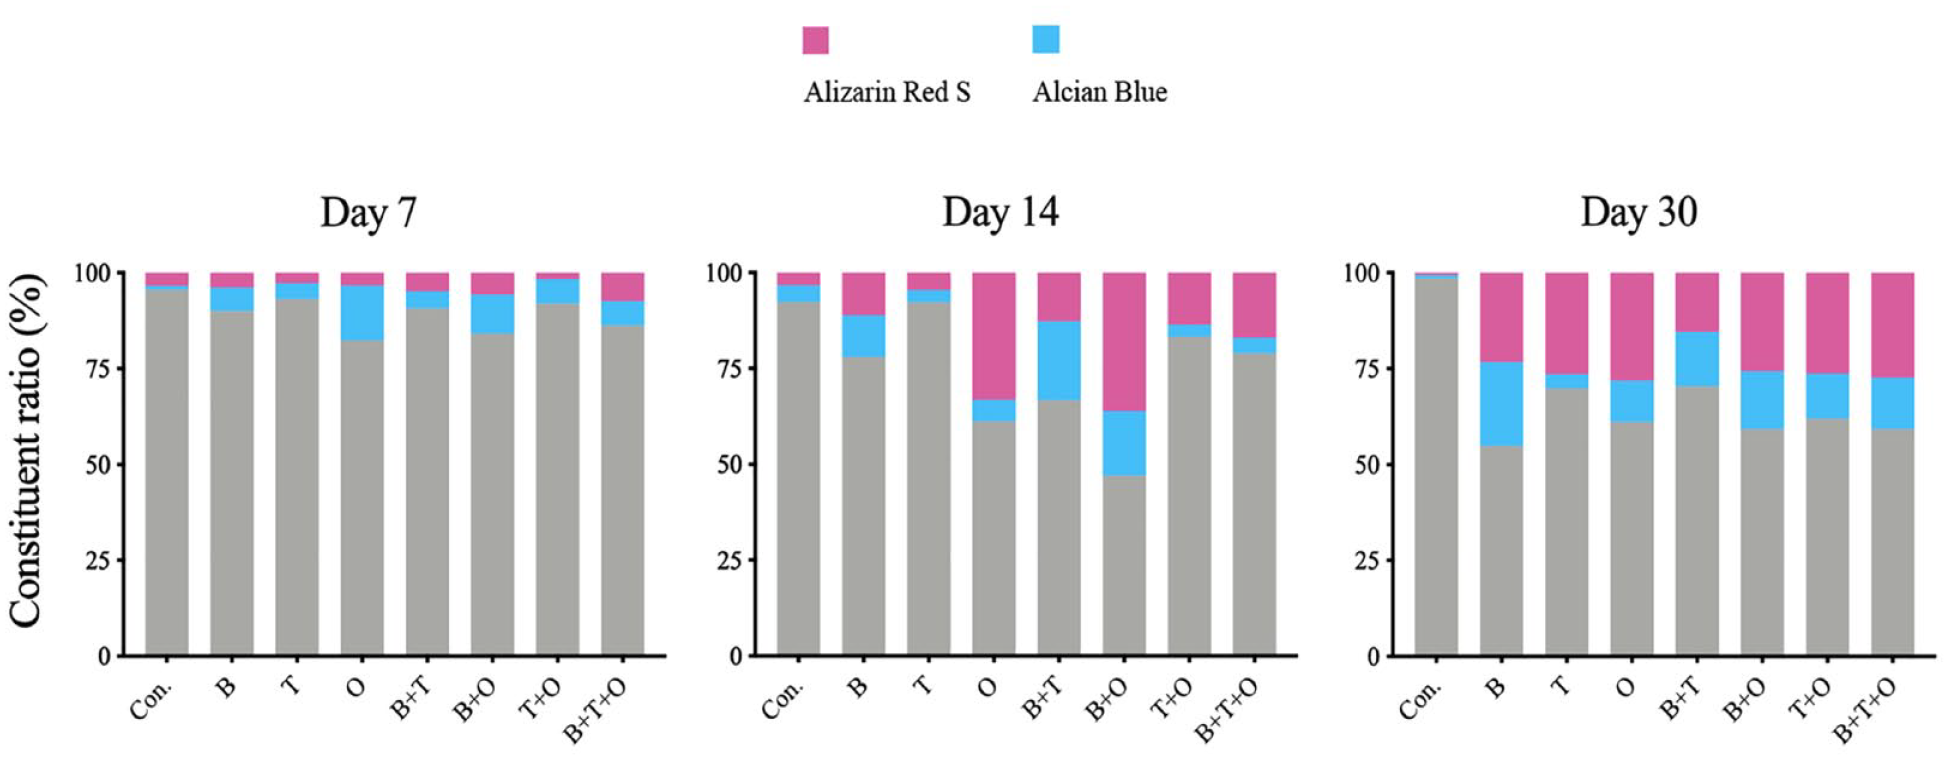
The constituent ratio (%) of positive area in Alcian blue and alizarin red S staining and negative area under different stimulation modes at day 7, 14, and 30. Con. = control group; BMP = bone morphogenetic protein; TGF = transforming growth factor; B = rBMP-2 treated group; T = rTGF-β3 treated group; O = rBMP-7 treated group; B+T = rBMP-2 + rTGF-β3 treated group; B+O = rBMP-2 + rBMP-7 treated group; T+O = rTGF-β3 + rBMP-7 treated group; B+T+O = rBMP-2 + rTGF-β3 + rBMP-7 treated group.
Analyzing the positive area ratio patterns over time for alizarin red S and Alcian blue staining, both ratios of the most experimental group showed an increasing pattern. The positive area ratio of alizarin red S staining was lower than that of the Alcian blue staining in most experimental groups, except the culturing control group at all three detection time points and the rBMP-2 + rTGF-β3 group at day 7 and 14 (Suppl. Fig. S10).
Aggrecan and osteocalcin immunohistochemistry
By means of immunohistochemistry, in which osteocalcin and aggrecan were treated as the antigen separately, the green area indicated the positive antigen-antibody interactions ( Fig. 5 ). 22 The antigen-antibody reaction revealed that osteocalcin and aggrecan coexisted in the same sample section. The MOD in osteocalcin immunohistochemistry was higher than that of the aggrecan immunohistochemistry in most experimental groups ( Fig. 7 ).
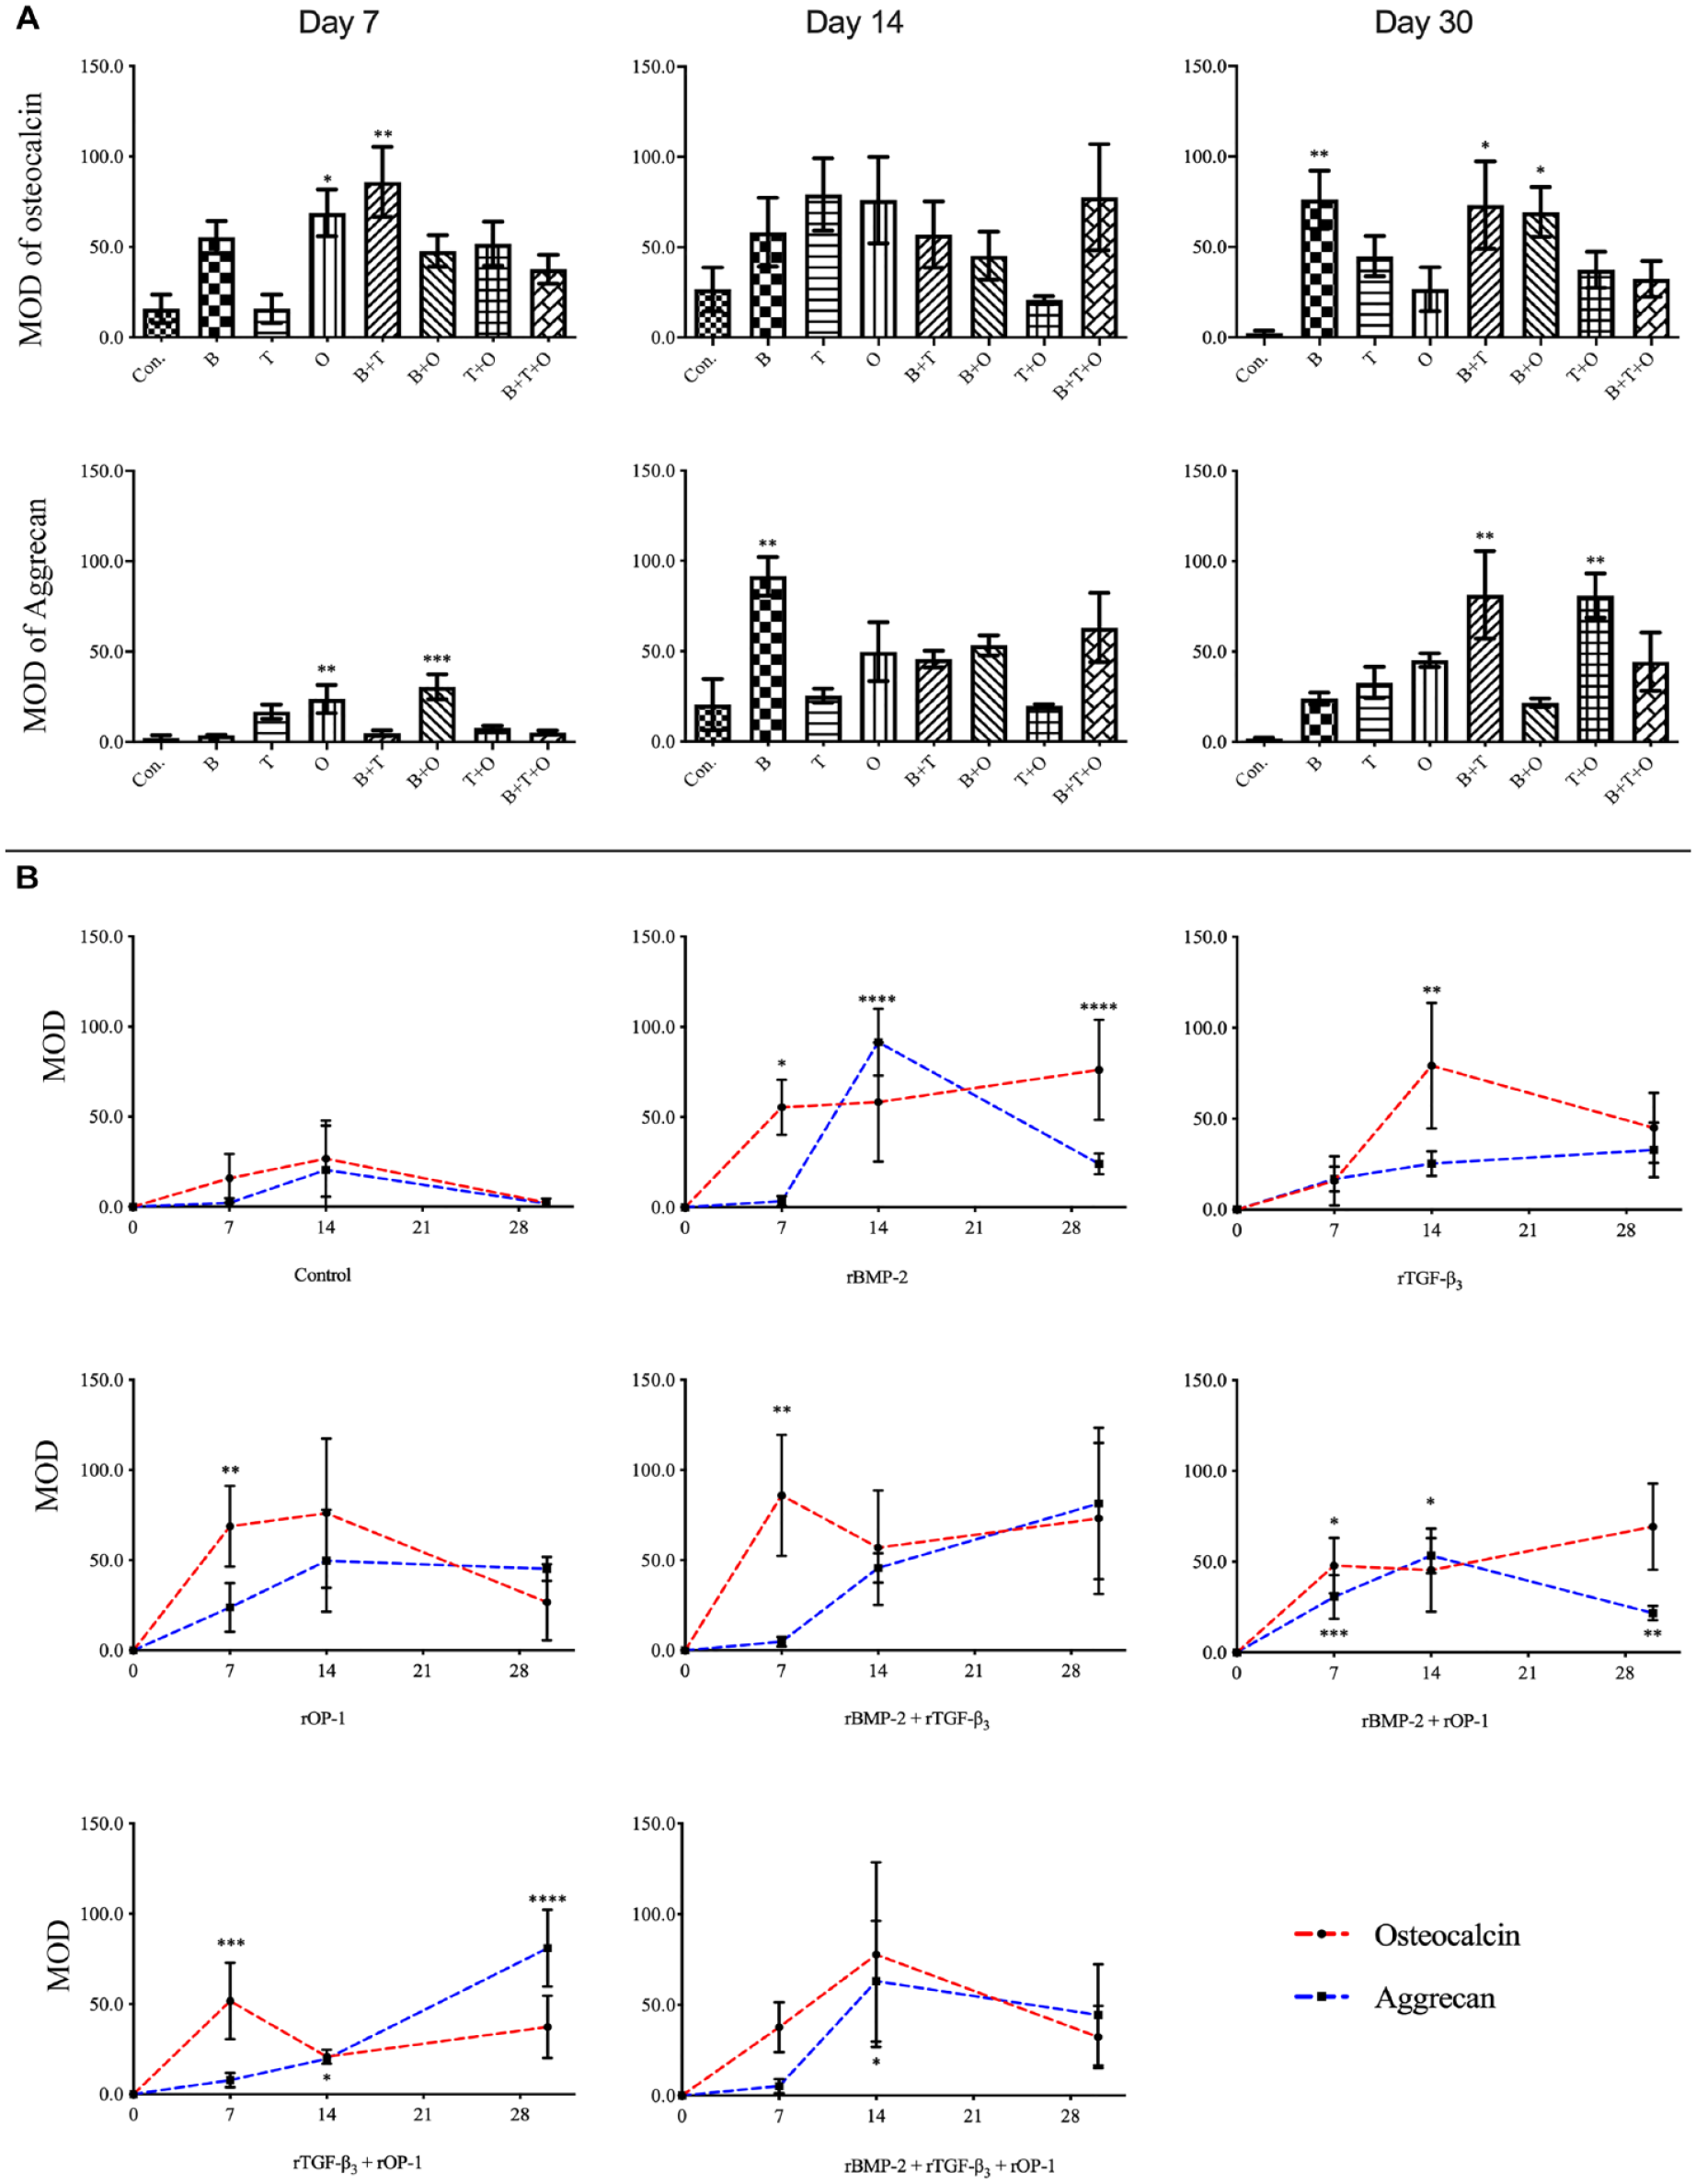
The semiquantitative analysis of the immunohistochemistry, in which osteocalcin and aggrecan were treated as the antigen separately. The results were presented as mean optical density (MOD) values.
The osteocalcin protein is related to osteogenesis. Although the positive reaction could be detected in all groups at all time points, the positive reaction in the control group was very weak. The highest MOD was found in the rBMP-2 + rTGF-β3, rTGF-β3, and rBMP-2 groups at day 7, 14, and 30, respectively ( Fig. 7 ).
The aggrecan protein is related to chondrogenesis. Although the positive reaction could be detected in all groups at all time points, the positive reaction in the control group was very weak. The highest MOD among all groups was showed in the rBMP-2 group at day 14 and then decreased, which was parallel to the expression of chondrogenesis-related gene patterns from day 7 to 14 ( Fig. 7 ).
Discussion
Our study revealed that different combinations of TGF-β superfamily proteins generally upregulated the expression of angiogenic, chondrogenic, and osteogenic marker genes in the muscle tissue model. Hierarchical clustering analysis showed distinct gene expression patterns in response to these treatments. Histological and immunohistochemical staining confirmed the presence of both osteogenic and chondrogenic morphogenesis under our experimental conditions. These findings suggest that TGF-β superfamily proteins can stimulate diverse gene expression patterns and morphogenetic responses, providing new insights into the regulation of osteogenesis and chondrogenesis.
Our previous experiments in Xiong et al. 22 involved tissue engineering approaches which were restricted to analyzing a specific tissue formation pathway. In this previous experiment, we chose to analyze only chondrogenesis-related gene expression markers. Analyzing only a single tissue formation process utilizing specific gene markers is performed by the greater tissue engineering community.22 -27 Performing the analysis in such a way limits the interpretation to a specific tissue formation process that fails to consider if other pathways, especially osteogenesis, are at all active or when these other pathways become active. The present experiment rectified this by analyzing both chondrogenic and osteogenic translational molecules in which we believed that we would see pure chondrogenesis, pure osteogenesis in the sense of intramembranous ossification, or the chronological process of endochondral bone formation showing clear signs of upregulation and downregulation of key marker genes at specific time points, as chondrogenesis and osteogenesis follow distinctly and yet similar patterns of development.40 -42 However, despite our aims, results generated a unique unexpected tissue regeneration response with serious ramifications for all future tissue engineering experiments and may explain why tissue development through growth factor applications do not properly work, clinically.
The analysis of osteogenic genes (Runx2, Bmp-2, and Ocn) and chondrogenic genes (Sox9, Acan, and Col2α1) simultaneously, while supporting the idea of parallel induced hyaline chondrogenesis and osteogenesis, was paramount to better categorize exactly what was happening in our model. Among the chosen genes, Sox9 is considered the earliest indicator for chondrogenesis as it regulates the chondrogenic differentiation of cells, 43 while the expression of Runx2 guides the chondrocyte hypertrophy process and is necessary for endochondral ossification.44,45 TGF-β superfamily can activate the expressions of both Runx2 and Sox946,47 via the Smad signaling pathway, and the inhibition of each other’s function achieves chondrogenesis-osteogenesis coordination. 48 The changes of Sox9 and Runx2 showed a parallel trend, suggesting that chondrogenesis and osteogenesis can occur consecutively. These results were consistent with the concept of “Sox9/Runx2 balance.” 46 In fact, recent studies have focused on the Sox9/Runx2 in TGF-β superfamily-mediated tissue induction to avoid the “derailed” differentiation.49,50 For example, installing a dominant Sox9 function above Runx2 is essential for the cartilage tissue engineering where the goal is to generate permanent hyaline cartilage. 51 Dexheimer et al. 46 demonstrated that blocking canonical Bmp signaling cannot be utilized to make the balance lean toward Sox9 since high Sox9 protein levels depend on this pathway. Much like we have been theorizing previously, how to intervene in the direction of morphogenesis in our muscle tissue system needs to be clarified in greater depth if one or another tissue formation process is to be favored.
In our study, the upregulating Sox9 expressions in all groups were accompanied by the increase of Col2α1 and Acan, whose productions suggest the differentiation of the cartilage extracellular matrix proteins. 52 Although the significant increase in the expressions of Bmp-2 and Ocn, as well as the positive results of alizarin red S and Ocn translation indicated the progress of osteogenesis in vitro, the negative results of Alp and Colα1, both of which were osteoblast markers,53,54 did not show the mediated effect of Runx2, which seemed to support a nonosteogenic inference. When Shen et al. 55 attempted to reveal the role of OP-1 in chondrogenic and osteogenic differentiation of MSCs, it was found that Alp and Col1α1 were not enhanced or even downregulated in osteogenic conditions. This demonstrated that Alp and Col1α1 may not be specific to the osteogenesis, especially at an early differentiation stage. Rich et al. 51 also found that there was no significant difference between the expression levels of Alp and Col1α1 after 28 day’s chondrogenic and osteogenic induction in human adipose-derived stromal cells. Indeed, it could be suggested that Sox9 plays a crucial role during the early initial tissue induction process, whereas Runx2 comes in later, 56 which is supported by the recovery of Colα1 on day 30 in most groups in our culture system. Other studies have also shown that ossification may occur after 30 day culture in vivo,35,57 so setting 30 days as the endpoint may be too early to observe more potential signs of osteogenesis. Although current evidence suggested that chondrogenesis and osteogenesis may coexist initially, the subsequent pathway of bone formation was difficult to speculate. Col10α1, hypertrophic chondrocyte marker, stimulates the late-phase chondrogenic differentiation, which could lead to endochondral ossification.51,58,59 However, the absence of Col10α1 expressions in all experimental groups except the control group counteracts this possibility. It was not clear whether the limitation of the detection time point prevented the detection of the end-stage chondrocyte hypertrophy. Hence, instead of endochondral bone formation, the present gene expression patterns are pointing more toward a pattern of intramembranous ossification. Another possibility could be “transchondroid bone formation,” in which chondroid bone formation by chondrocyte-like cells without capillary invasion occurred.60,61 This could partly explain this study’s situation that chondrogenesis and osteogenesis occurred simultaneously, yet more complex and detailed time-based studies may be necessary to validate this.
It was expected that key patterns of protein markers would follow a systematic expression approach from which we could then deduce between which time points certain morphogens would be applied to then direct the tissue response to either chondrogenesis or osteogenesis. However, to our complete surprise, our results showed that muscle tissue cultured in the presence of continuously applied morphogens rBMP-2, and/or rTGF-β3 and/or rOP-1, was not just fostering chondrogenesis but at the same time also osteogenesis. This phenomenon was particularly evident in aggrecan, a distinctive marker for chondrogenesis62. Most experimental groups exhibited a significantly higher deposition ratio compared to the control group by day 30. Simultaneously, osteocalcin, a late osteogenesis marker secreted by mature osteoblasts, 63 was also detected. Bone and cartilage tissue regeneration, from our present study, would suggest that tissue formation is running on a narrow path between tumor formation and what is defined as actual tissue reformation.31,64 Indeed, parallel tissue morphogenesis as we have observed in the muscle tissue model is normally indicative of tumorigenesis, which is defined as a multitude of diverse pathways being active in parallel that then jointly leads to improper cellular mitosis and subsequently abnormal tissue growth.65 -67 In the tissue engineering community, it is widely accepted that the presence of targeted morphogens with substrata in heterotopic or orthotopic sites causes bone, cartilage, tendon, muscle, nerve, or other tissue types to reform based upon the actual signal(s) provided initially and subsequently over the course of the tissue reformation process.68 -70 However, this interpretation must be carefully considered as the boundary toward tumor formation lies possibly somewhere in between.65 -67 Indeed, we believe that the induction of tissue morphogenesis and its recapitulation into either cartilage or bone is, in fact, a modulated form of tumorigenesis that at key temporal intervals is then guided to then subsequently undergo specifically directed tissue morphogenesis. Alternatively, perhaps this is also just the fundamental pretissue formation process in which excised tissue is attempting to redefine its role and function in vitro by adapting or evolving.
While this study did make some critical discoveries, solving certain limitations in future studies could provide more clarity. First, no antagonists were applied in our experimental groups. It is known that chondrogenesis and osteogenesis rely on a subset of antagonists that helps modulate the tissue recapitulation process better.71,72 Without the antagonist, the cultured tissue could receive signals from multiple extracellular ligands simultaneously, causing a slurry of cytotissue reactive responses. 73 Tsumaki et al. 74 and Pathi et al. 75 demonstrated the Bmps signaling was required for cartilage formation in which the availability of Noggin with other factors was necessary to achieve specific tissue formation.76,77 Since rBMP-2, in this study, showed an excellent ability to induce both chondrogenesis and osteogenesis, especially at the early 7-day in vitro culturing stage, it is worth exploring which pathway is responsible for the certain morphogenesis but more specifically, when an antagonist needs to be applied to generate the desired response. The second limitation was that many studies have shown that in addition to Smad 2/3, TGF-β isoforms can also phosphorylate Smad 1/5/8, which hitherto are considered unique to rBMPs. Thus, whether the TGF-β isoforms/Smad 1/5/8 had an impact on our tissue system also requires a deeper analysis since it is also tightly regulated by inhibitors. Third, while the data did reveal the characteristic role for each growth factor at a different stage, at each of the three culturing time points, it seemed that the cutoff point of 30 days remains much too early to extrapolate how in vitro tissue will develop properly. More extended in vitro culturing periods might have shown stabilization of the expression patterns and a proper progression to osteogenesis. Finally, muscle tissue is a heterogeneous mixture of various cells and extracellular matrices. While we did assess some temporal aspects of how the tissue responds to specific growth factors and their combinations, our study does not address the spatial patterns of gene expression among the various cell types. The histological assessment showed specific areas of the muscle tissue reacting differently, with certain factors accredited to chondrogenesis and osteogenesis being present only in certain regions of the tissue, depending on the growth factor treatment type. However, more in-depth cellular classification and verifications need to be done to properly determine the spatial characteristics of the responding regions of the tissue and what this means overall for the development of the tissue. If these criteria can be met, which we are trying to discover with more complex studies, we hope with time we will solve the mysteries of “Morpheus unbound,”78,79 which should lead to the subsequent major discovery in regenerative tissue engineering medicine treatments that finally can properly regrow lost bone and cartilaginous tissue.
Conclusion
Understanding the diversity of the chronological temporal modulated signaling cascade during tissue morphogenesis remains a crucial criterion if tissue engineering prospects are to ever succeed clinically. This study has again clearly shown that multiple TGF-β superfamily proteins applied to ex vivo tissue do stimulate unique tissue developmental processes that, however, do not follow a clear chronological signaling cascade as often described in tissue developmental processes. Future studies with a variety of gene markers of various tissue formation processes need to always be included across all tissue engineering experiments to properly determine if tissue transformation response due to various morphogens, or even biomaterials, and their combinations is a normal response by the tissue simply trying to adapt itself or is in fact transformative tumorigenesis that appears first as tumorigenesis and then after a certain time frame stabilizes into a specific tissue formation pathway. If this is the case, it might explain why tissue engineering prospects do not work properly clinically and could provide clear guidelines on what to do to achieve proper recapitulation of specific tissue reformation processes.
Supplemental Material
sj-pdf-1-car-10.1177_19476035231196224 – Supplemental material for Parallel Chondrogenesis and Osteogenesis Tissue Morphogenesis in Muscle Tissue via Combinations of TGF-β Supergene Family Members
Supplemental material, sj-pdf-1-car-10.1177_19476035231196224 for Parallel Chondrogenesis and Osteogenesis Tissue Morphogenesis in Muscle Tissue via Combinations of TGF-β Supergene Family Members by Fei Xiong, Yan Chevalier and Roland M. Klar in CARTILAGE
Footnotes
Author Contributions
R.M.K. helped in conceptualization, resources, supervision, and project administration. R.M.K. and F.X. helped in methodology, validation, and funding acquisition. F.X. and Y.C. helped in software. F.X. helped in formal analysis, investigation, writing—original draft preparation, and visualization. R.M.K., Y.C., and F.X. helped in data curation. R.M.K. and Y.C. helped in writing—review and editing. All authors have read and agreed to the published version of the article.
Acknowledgments and Funding
The authors would like to thank Prof. V. Jansson for having supported part of the project funding through his Friedrich Baur Grant and allowing part of the project to be conducted in the laboratory research premises of the University Hospital of Munich, of the Ludwig-Maximilians University. They would also like to thank all their friends, families, and colleagues for their help and support during the challenging periods of this project. The author(s) disclosed receipt of the following financial support for the research, authorship, and/or publication of this article: This research was funded by Jiangsu Shuangchuang Project (grant number: JSSCBS20211590), scientific research project of Wuxi Health Commission (youth talent project, grant number: Q202125), Duo-Innovative and Excellent Doctors Project of Wuxi 9th People’s Hospital (2021, grant number: YB202108), and the Friedrich Baur Foundation (grant acronym: CaMuTe).
Declaration of Conflicting Interests
The author(s) declared no potential conflicts of interest with respect to the research, authorship, and/or publication of this article.
Ethical Approval
The experimental and surgical protocols complied with the rules and regulations of the Animal Protection Laboratory Animal Regulations (2013), European Directive 2010/63/EU, and were approved by the animal ethics research committee (AESC) of the Ludwig-Maximilians University of Munich (LMU), Bavaria, Germany Tierschutzgesetz §1/§4/§17 (![]() ) in regard to pure tissue harvest from animals.
) in regard to pure tissue harvest from animals.
Informed Consent
Not applicable.
Data Availability Statement
The raw data supporting the conclusions of this article will be made available by the authors, without undue reservation.
References
Supplementary Material
Please find the following supplemental material available below.
For Open Access articles published under a Creative Commons License, all supplemental material carries the same license as the article it is associated with.
For non-Open Access articles published, all supplemental material carries a non-exclusive license, and permission requests for re-use of supplemental material or any part of supplemental material shall be sent directly to the copyright owner as specified in the copyright notice associated with the article.