
Abstract
Objective
To evaluate effects of physical activity and food consumption on plasma concentrations of free and total transforming growth factor beta-1 (TGF-β1), beta-2 (TGF-β2), and beta-3 (TGF-β3) in individuals with knee osteoarthritis (OA).
Methods
Participants (n = 40 in 2 cohorts of 20; mean age 70 years) with radiographic knee OA were admitted overnight for serial blood sampling. Cohorts 1 and 2 assessed the impacts of food intake and activity, respectively, on TGF-β concentrations. Cohort 1 blood draws included 2 hours postprandial the evening of day 1 (T3), fasting before rising on day 2 (T0), nonfasting 1 hour after rising (T1B), and 4 hours after rising (T2). Cohort 2 blood draws included T3, T0, fasting 1 hour after rising and performing activities of daily living (T1A), and nonfasting 2 hours after rising (T1B). By sandwich ELISAs, we quantified plasma free and total TGF-β1 concentrations in all samples, and plasma total TGF-β2 and TGF-β3 in cohort 2.
Results
Free TGF-β1 represented a small fraction of the total systemic concentration (mean 0.026%). In cohort 2, free and total TGF-β1 and total TGF-β2 concentration significantly increased in fasting samples collected after an hour (T1A) of activities of daily living (free TGF-β1: P = 0.006; total TGF-β1: P < 0.001; total TGF-β2: P = 0.001). Total TGF-β3 increased nonsignificantly following activity (P = 0.590) and decreased (P = 0.035) after food consumption while resting (T1B).
Conclusions
Increased plasma concentrations of TGF-β with physical activity suggests activity should be standardized prior to TGF-β1 analyses.
Introduction
Transforming growth factor beta (TGF-β) is a member of the TGF-β superfamily that regulates numerous biological processes in mammals, including embryonic development, tissue patterning, and bone formation. The 3 isoforms expressed in mammals (TGF-β1, -β2, and -β3) are differentially expressed in early development and, after birth, regulate cartilage matrix metabolism. 1 Of these isoforms, TGF-β1 is found in the highest concentrations in mature animals, and is the most studied.1,2 Despite being a known regulator of joint homeostasis, the exact role of TGF-β1 signaling in osteoarthritis (OA) pathogenesis is currently controversial. On one hand, TGF-β1 signaling is chondroprotective; it induces chondrogenesis, inhibits chondrocyte hypertrophy, and stimulates extracellular matrix (ECM) production.1-3 However, excessive or prolonged TGF-β1 activation can be deleterious to bone and can also induce OA-like phenotypes, such as sclerosis of subchondral bone and osteophyte formation. 3 Although these contradictory effects have yet to be fully reconciled, factors such as dosage, exposure time, and localization may determine whether the chondroprotective Smad 2/3 pathway or OA-inducing Smad 1/5/8 pathway is activated. 1
Adequate TGF-β1 activation is essential for maintaining the complex regulation of cartilage homeostasis. 2 All 3 isoforms of TGF-β are secreted as inactive complexes that consist of a noncovalently associated ligand and latency-associated peptide (LAP). 4 After secretion, LAP covalently binds latent TGF-β binding proteins (LTBP), effectively sequestering TGF-β until it is released from LAP by proteases, integrins, or changes in pH or temperature. 5 Even though TGF-β is constitutively expressed throughout the body, only the free ligand is biologically active and able to exert effects on cellular metabolism. 6
Recent evidence indicates that TGF-β1 signaling is also regulated at the level of gene expression by the circadian rhythm proteins, CLOCK and BMAL1, in cartilage. 7 While the suprachiasmatic nucleus (SCN)—the central molecular clock—is regulated by light exposure, local circadian rhythms in tissues such as cartilage are modified by fed/fasting states and joint loading. 8 In healthy joints, normal circadian rhythm keeps the activity of certain ECM molecules temporally segregated; anabolic gene expression peaks during times of activity and catabolic gene expression peaks during times of rest. 9 Consequently, dysregulation in circadian rhythm is believed to be a contributor to OA pathogenesis. 10 Given this complex regulation of expression and protein activation, our goal was to evaluate how systemic free and total TGF-β1, total TGF-β2, and total TGF-β3 protein concentrations in OA patients change throughout the day following daily activities, including physical activity and food intake.
Physiotherapy and diet can be used in conjunction with other treatments to manage OA symptoms. These therapies seek to improve mobility and physical function, reduce pain, and reduce BMI in patients. Exercise regimens in previous studies ranged from low intensity to high intensity, and overall have been associated with improved muscle strength, decreased pain in OA joints, improved physical function, and improved quality of life.11,12 Pain reduction was associated with regimens consisting of exercise at least 3 times a week; effect sizes were larger for longer duration regimens. 12 However, high-intensity regimens have been associated with higher numbers of adverse events and pain so it may not be suitable for all patients. 11 Diet therapy for weight loss improves physical function, and it is more effective when combined with exercise to improve function and reduce pain.11,12
Systemic biomarkers may be good indicators of beneficial effects of interventions in OA patients. Serum cartilage oligomeric matrix protein (COMP), hyaluronic acid (HA), and matrix metalloproteinase (MMP) concentrations increased after 30 to 60 minutes of exercise and returned to baseline levels 30 minutes postexercise.13,14 A 24-week behavioral weight management intervention for knee OA decreased systemic concentrations of inflammatory biomarkers leptin and interleukin-6 (IL-6). 15 Another study found diet and exercise interventions reduced systemic concentrations of MMP-degraded type 1 collagen and type 3 collagen. 16 Additionally, mechanical unloading by knee joint distraction increased FGF-2 (fibroblast growth factor) and TGF-β1 in synovial fluid for up to 12 months and improved knee OA outcome scores. 17 Biomarker analyses are an effective way of assessing the biochemical effects of interventions and determining their benefits.
The lack of commercially-available kits with sufficient sensitivity to quantify free TGF-β1 hindered early studies of TGF-β1. 18 When investigated previously in individuals with knee and/or hip OA, total serum TGF-β1 correlated poorly with OA severity based on sum of Kellgren-Lawrence (K-L) grades or radiographic features of OA of the lower extremities. 19 However, it is likely that total concentration primarily reflects the latent form of TGF-β1. Additionally, serum is known to contain high levels of platelet-derived TGF-β1 that is released during blood coagulation. 20 Given the recent availability of ELISA (enzyme-linked immunosorbent assay) kits designed to quantify free and total TGF-β1, and evidence of increased free TGF-β1 concentrations following joint loading and mechanical shearing in vitro,5,21 we designed the following study. We compared plasma concentrations of free and total TGF-β1, investigated the release of free TGF-β1 after physical activity and food intake, and reevaluated the associations of free and total TGF-β1 with OA severity. We hypothesized that physical activity would increase plasma concentrations of free TGF-β1 in vivo in humans.
Methods
Cohort Characteristics
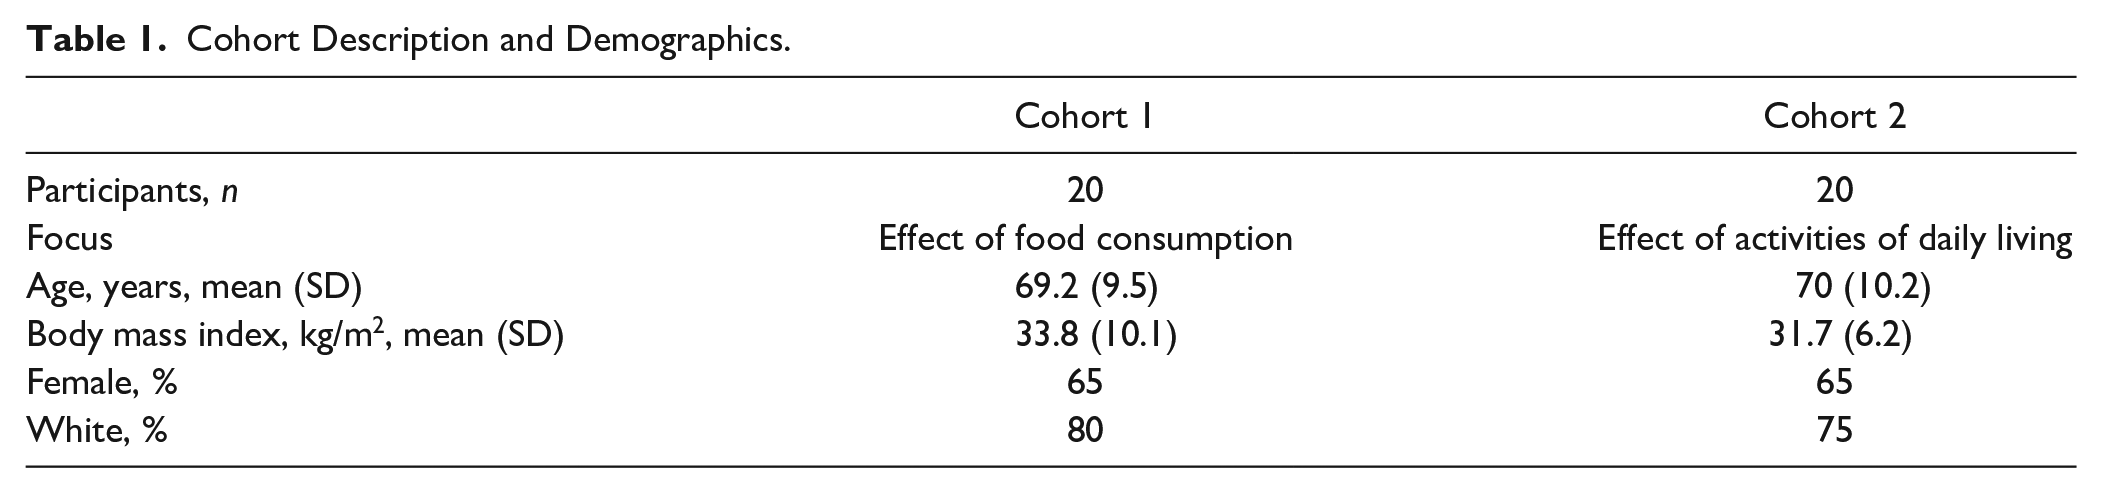
Participants were required to have symptomatic OA in at least 1 knee. Exclusion criteria included intra-articular injections of any kind within the 6 months prior to the study evaluation and comorbidities such as rheumatoid arthritis, systemic lupus erythematosus, psoriasis, gout, or hemochromatosis. Participants ranged in age from 50 to 89 years (mean 70 years, SD 10); sum K-L grades ranged from 1 to 8 (sums: 6% K-L = 1, 6% K-L = 2, 32% K-L = 4, 9% K-L = 5, 20% K-L = 6, 9% K-L = 7, 18% K-L = 8). Participants were divided into 2 cohorts of 20 individuals each ( Table 1 ) and admitted to the General Clinical Research Center at Duke University Medical Center for an overnight stay. Cohort 1 evaluated the effect of food intake on plasma biomarker concentrations while cohort 2 evaluated the effects of physical activity and food intake independently. Both cohorts received a standardized breakfast and consumed an average of 30.51 g protein, 60.76 g carbohydrates, and 25.5 g of fats. Participants were permitted to take usual medications and supplements. All procedures were approved by the Institutional Review Board of Duke University Medical Center (Protocol Number Pro00011820) and all experiments were undertaken with the written informed consent of participants.
Cohort Description and Demographics.
OA Assessment
Knee OA severity (K-L score) was graded by the consensus of 2 trained readers from posteroanterior semiflexed radiographs taken using the SynaFlexer positioning frame (Synarc, San Francisco, CA). K-L scores were summed for both knees to reflect total knee OA burden. As established in a previous study of systemic biomarkers following joint replacement surgery, 22 6 participants who had undergone a prior unilateral knee replacement (n = 3 in each cohort) received a score of 0 for the replaced knee.
Sample Collection
In each cohort, blood samples were obtained at 4 time points as shown in
Figure 1
. In cohort 1: between 6:00 and 8:00
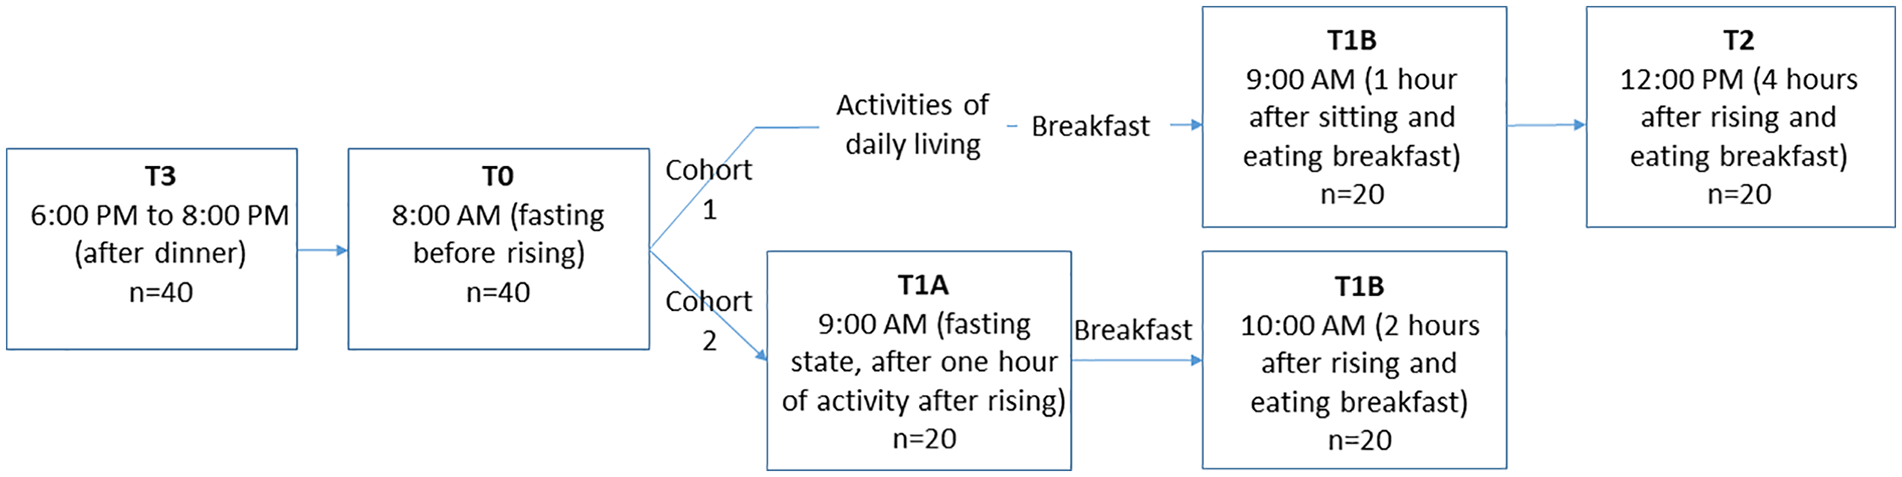
Study design. In cohort 1, blood samples were collected between 6:00 and 8:00
Quantification of Biomarkers
Free and total plasma TGF-β1 were quantified (blinded to clinical data and outcomes) in duplicate using the Legend Max Free Active and Total TGF-β1 ELISA Kits (BioLegend, San Diego, CA), respectively, according to the manufacturer’s protocols. Of note, per the manufacturer, both assays utilize the same monoclonal antibody. For total TGF-β1 analyses, samples were treated with acid, neutralized, and assayed at a 1:1000 dilution; however, free TGF-β1 analyses were conducted on undiluted samples without acid pretreatment. The minimum detectable concentrations for free and total TGF-β1 were 2.3 pg/mL and 3.5 pg/mL, respectively. Total TGF-β1 was detectable in all samples and free TGF-β1 was detectable in 79% of samples. For the purposes of statistical analysis, free TGF-β1 concentrations below the minimum detectable concentration were imputed, according to a well-established method, as one-half the lower limit of detection (LLOD). 23 Interassay coefficients of variation (CVs) were calculated including standards and controls. Intra- and interassay CVs were 7.3% and 7.4% for free plasma TGF-β1, and 3.6% and 8.1% for total plasma TGF-β1, respectively. Additionally, for comparison with plasma concentrations, free and total TGF-β1 concentrations of matched serum samples were assessed in singlicate using the same ELISA kits. Intra- and interassay CVs of standards and controls were 6.3% and 16.5% for free serum TGF-β1, and 3.7% and 3.1% for total serum TGF-β1, respectively.
We also quantified total plasma TGF-β2 and TGF-β3 isoforms in cohort 2 using a multiplex U-PLEX ELISA kit (Meso Scale Discovery, Rockville, MD) per the manufacturer’s instructions; 97.5% of samples had measurable levels of total TGF-β2, and 52.5% samples had measurable levels of total TGF-β3. The mean LLOD for TGF-β2 and TGF-β3 was 0.8815 pg/mL and 0.786 pg/mL, respectively. The data for TGF-β3 should be interpreted with caution as 47.5% of samples had concentrations below the LLOD and were imputed as one-half the LLOD for analyses. TGF-β2 had intra- and interassay CVs of 4.6% and 0.6%, and TGF-β3 had an intraassay CV of 13.5% with controls below the level of detection. While the U-PLEX ELISA also included total TGF-β1, we utilized the data generated by the BioLegend assays for total TGF-β1 since our primary goal was to compare matched free and total TGF-β1 concentrations. Of note, total TGF-β1 concentrations from the BioLegend and MSD U-PLEX kits were strongly correlated (rs = 0.915, P < 0.0001).
Statistical Analysis
Mean concentrations were calculated for all biomarkers with imputed values of one-half LLOD included. TGF-β1 variation across the timepoints was evaluated by nonparametric Friedman test (GraphPad 8, San Diego, CA) of each individual’s biomarker concentrations normalized to the mean across all time points for the individual; significant Friedman tests were followed by multiple comparisons Dunn’s test to identify significant differences between time points (GraphPad 8, San Diego, CA). Spearman correlation was used to evaluate associations between nonnormalized data: free versus total plasma TGF-β1, between all total TGF-β isoforms, serum versus plasma TGF-β1 (free and total), and TGF-β1 (free and total) versus sum K-L grade at T1A and change from T0 to T1A. For each test, a P value <0.05 was considered significant.
Results
Quantification of TGF-β in Plasma and Serum
Median (and range) plasma concentrations (pg/mL) were as follows: free TGF-β1: 5.58 (not detectable [ND]-40.75); total TGF-β1: 30880.50 (6760.00-81815.00); total TGF-β2: 24.99 (ND-170.30); total TGF-β3: 1.03 (ND-3.10). Median (and range) serum concentrations (pg/mL) were as follows: free TGF-β1: 120.91 (ND-255.65); total TGF-β1: 51895 (29667.50-91330.00). These biomarkers did not correlate with BMI in either cohort.
Effects of Physical Activity and Food Consumption on TGF-β
Plasma TGF-β1 concentrations did not change significantly over time in cohort 1 (free TGF-β1 P = 0.170; total TGF-β1 P = 0.253). However, free and total plasma TGF-β1, total TGF-β2, and total TGF-β3 concentrations changed significantly over time in cohort 2 (free TGF-β1 P = 0.010; total TGF-β1 P < 0.001; total TGF-β2 P = 0.002; total TGF-β3 P = 0.016) ( Fig. 2 ). In cohort 2, compared with baseline (T0), a significant increase in free TGF-β1, total TGF-β1, and total TGF-β2 concentration was observed in plasma samples that were collected after an hour of physical activity while fasting (T1A: free TGF-β1 P = 0.006; total TGF-β1 P < 0.001; total TGF-β2 P = 0.001). The mean fold-change increase with activity was 1.55 for free TGF-β1, 1.43 for total TGF-β1, and 1.50 for total TGF-β2. Total TGF-β3 concentrations increased, but not significantly, following activity (T1A: P = 0.590) and decreased significantly (P = 0.035) after food consumption while resting (T1B). Compared with samples collected immediately following activity (T1A), a significant decrease in total TGF-β1 plasma concentration was observed in samples collected in the evening following a day of normal activity (T3) (P = 0.029).
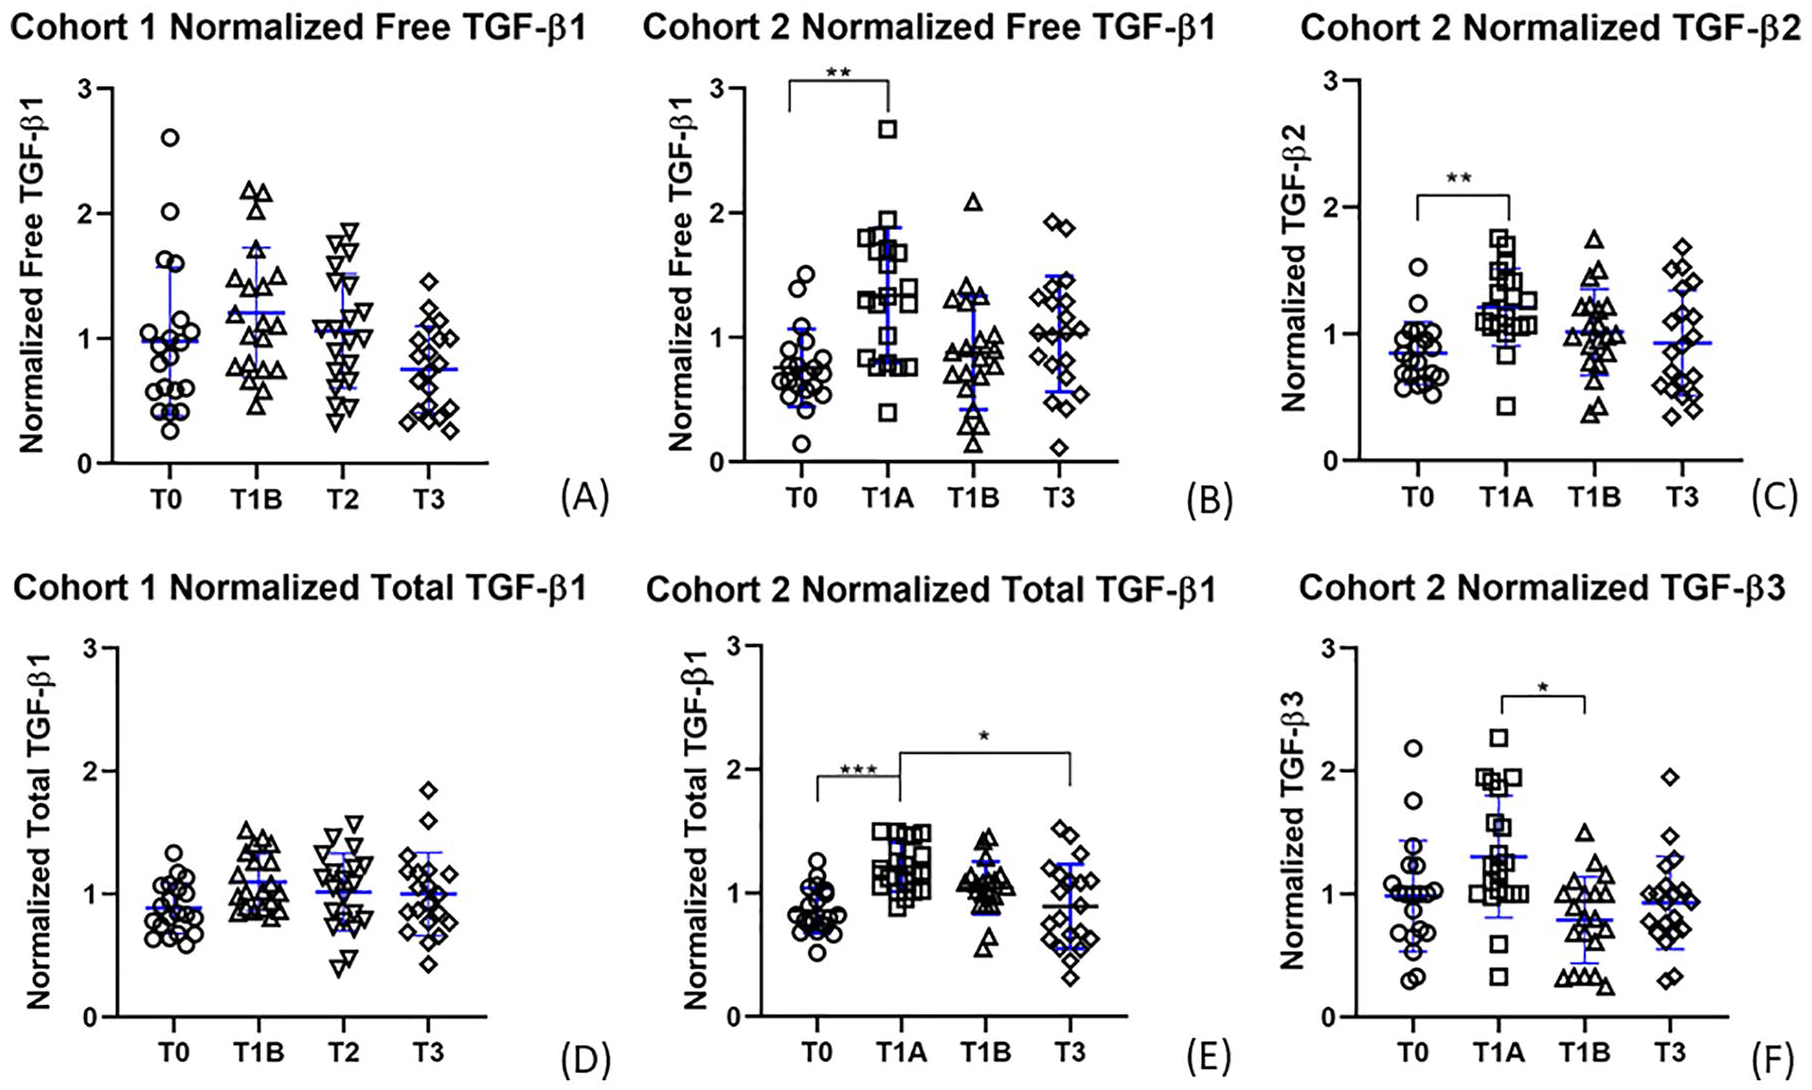
Normalized transforming growth factor beta (TGF-β) plasma concentrations over time. Normalized data of time points for (
Correlations of Free and Total TGF-β1 and of Total TGF-β Isoforms
As expected, free TGF-β1 represented only a small fraction of the total systemic concentration in plasma (mean 0.026%). There was no correlation between free and total plasma TGF-β1 (rs = 0.081, P = 0.309). A total of 97.5% of samples had measurable levels of total TGF-β2, and 52.5% of samples had measurable levels of total TGF-β3. Total TGF-β1 correlated strongly with total TGF-β2 (rs = 0.688, P < 0.001) and TGF-β3 (rs = 0.370, P = 0.0007). Additionally, total TGF-β3 correlated with total TGF-β2 (rs = 0.335, P = 0.0024). There were no associations of sum K-L with free or total TGF-β1.
Correlations of Plasma and Serum TGF-β1
As expected, due to platelet release of TGF-β during blood clotting, serum TGF-β1 concentrations were consistently higher than plasma concentrations (a mean 18.2-fold for free TGF-β1 and a mean 1.6-fold for total TGF-β1). Despite the differences in concentrations, serum and plasma samples correlated modestly for free TGF-β1 (rs = 0.245, P = 0.0026) and total TGF-β1 (rs = 0.190, P = 0.019).
Discussion
This study demonstrates that plasma concentrations of free and total TGF-β1 and total TGF-β2 significantly increased with an hour of light physical activity in a fasting state, suggesting a release from a mechanically sensitive reservoir. Interestingly, TGF-β3 increased—but not significantly—after activity; however, it decreased significantly after resting during breakfast (T1B). We observed an effective 1.55-fold increase of circulating free (active) TGF-β1 after an hour of activity (from a mean 8.45 pg/mL to a mean 13.08 pg/mL). Other studies conclude that concentrations as low as 10 pg/mL affect CD34 expression in corneal fibroblasts, and concentrations of TGF-β1 and TGF-β2 between 10 and 100 pg/mL stimulate fibroblast proliferation and have a weak chemoattractive effect.24,25 This suggests that the increase of active TGF-β1 due to activity may have physiological impacts.
These results are consistent with the known mechanosensitive nature of TGF-β1. TGF-β1 is released from extracellular matrix of myofibroblasts on mechanical contraction in vitro. 26 TGF-β1 is activated and released from muscle to the interstitial space after resistance exercise, strengthens cartilage after damage from mechanical stress, and is found in high concentrations in OA knee joints and synovial fluid.5,27,28 Notably, participants in our study performed activities typical of their morning routine rather than rigorous exercise, which suggests that reservoirs of TGF-β isoforms are sensitive to low levels of physical activity. Efflux of TGF-β from OA joints and synovial fluid may contribute to this systemic increase in concentration since the knee is an important load-bearing joint, the synovial fluid is known to exchange small molecules with circulating blood vessels, and our participants were required to stand or move during the designated time of activity. 29
Circulating TGF-β may represent a reparative response of knee cartilage to activity. TGF-β1 stimulation of primary chondrocytes downregulates IL-6 receptor expression, reducing inflammatory damage in cartilage, and promotes cartilage repair and chondrocyte proliferation.3,30 Furthermore, in a recent study, increased concentrations of TGF-β1 in synovial fluid following knee joint distraction was associated with improved knee OA outcomes. 15 Interestingly, sustained increases of TGF-β in subchondral bone caused sclerosis and osteophyte generation. 3 These contrasting effects highlight that location and duration of TGF-β1 activation are pivotal in determining its impact, and that TGF-β1 stimulates cartilage repair via brief activation in cartilage.2,3 The observed increases in free and total TGF-β1 and total TGF-β2 peaked at T1A and returned to baseline after an hour, indicating that TGF-β activation after activity was not sustained.
Interestingly, food consumption did not have a significant effect on TGF-β1 or TGF-β2 isoforms, but was associated with a decrease in total TGF-β3. Dairy and animal tissues are a potential source of exogenous TGF-β1; however, digestion of these foods and dissemination of this compound is a lengthy process. 31 TGF-β1 and -β2 concentrations at T1B, and T3 were not significantly different from baseline (T0) values, suggesting no significant effect of feeding status on these analytes and therefore no need for fasting prior to biofluid sampling for these biomarkers.
It is also noteworthy that TGF-β1 correlated strongly with TGF-β2 and TGF-β3; these isoforms are less studied than TGF-β1 and found in lower concentrations in cartilage and plasma.32,33 Knockout studies in mice of the 3 isoforms have demonstrated nonoverlapping phenotypes, indicating that each isoform has a unique and noncompensated function. 32 TGF-β1 knockout mice develop autoimmune-like inflammatory disease, as TGF-β1 primarily regulates wound healing, immune function, and cartilage homeostasis.1,32 TGF-β2 directs epithelial-mesenchymal interactions in a variety of tissues, and knockout mice exhibit abnormal lung development, congenital heart disease, craniofacial defects, and other skeletal deformities. 32 While TGF-β3 knockout mice also exhibit abnormal lung development and craniofacial defects, the morphogenesis and penetrance of the defects is believed to be distinct from TGF-β2 directed changes as TGF-β3 primarily regulates cell adhesion and extracellular matrix formation.32,33 While TGF-β1 is the most abundant isoform, all 3 isoforms are expressed in cartilage and the strong correlation between their concentrations in plasma suggests potential efflux from a shared reservoir in response to activity. 32
While a few studies have found TGF-β1 to be a good indicator of radiographic OA severity, our study, among others, did not observe such a correlation.18,19,34 He et al. 34 reported a correlation of serum total TGF-β1 with severity of unilateral knee OA (K-L grades 2-4). Otterness et al.35,36 reported no significant differences in systemic total TGF-β1 between knee OA patients and controls, but did find a small significant association with clinical outcomes. Several other studies have found TGF-β to be an inconclusive biomarker for OA detection and progression; however, these studies of systemic TGF-β1 quantified concentrations from serum and therefore may be confounded by platelet-derived TGF-β.19,21 Furthermore, total TGF-β1 has frequently been used in the past as a proxy for active TGF-β1. Notably in our study, we did not observe a correlation between free and total TGF-β1 in plasma, indicating that the two should not be considered interchangeable. Now that direct quantification of the active free form of TGF-β1 via ELISA is feasible, it could be of significant value to further investigate the clinical implications of the biologically active form of TGF-β1 in future analyses.
Our study was limited by a small sample size. Additionally, the intensity and duration of physical activity in this study may not have been vigorous enough to elicit a maximal mechanosensitive TGF-β response. In our study, despite differences in absolute concentrations, free and total serum and plasma TGF-β1 were correlated, but effects of physical activity on free and total TGF-β1 concentrations were only observed in plasma. Platelet release of TGF-β1 during the processing of serum samples likely obscured the effects of activity on TGF-β1 concentrations in serum. 13 Platelet-derived TGF-β1 is less likely to be a confounder in plasma, since samples do not clot prior to processing. Since this study evaluated only individuals with knee OA, these findings may not be generalizable to people without knee OA.
In summary, light physical activity, but not food consumption, was associated with a significant increase in free and total TGF-β1 and TGF-β2 plasma concentrations. This association may represent activation or release from mechanosensitive reservoir tissues such as those of the musculoskeletal system, and it may correspond to a reparative response. Our findings suggest that further studies of the impact of moderate exercise on TGF-β1 and its potential positive effects on knee OA outcomes would be of benefit. Furthermore, our results suggest the need for standardization of activity—but not fasting—prior to biofluid sampling intended for TGF-β analyses to better evaluate its impact on musculoskeletal health and disease.
Footnotes
Acknowledgments and Funding
The author(s) disclosed receipt of the following financial support for the research, authorship, and/or publication of this article: Claude D. Pepper Older Americans Independence Centers Grant NIH/NIA P30-AG-028716 (VBK), original funding to support the POP study by NIH/NIAMS grant R01 AR048769.
Declaration of Conflicting Interests
The author(s) declared no potential conflicts of interest with respect to the research, authorship, and/or publication of this article.
Ethical Approval
All procedures were approved by the Institutional Review Board of Duke University Medical Center (Protocol Number Pro00011820).
Informed Consent
Written informed consent was obtained from all participants before the study.
Trial Registration
Not applicable.