
Abstract
Objective
To elucidate the time course of magnetic resonance imaging (MRI)–based morphological and qualitative outcomes after an atelocollagen-assisted autologous chondrocyte implantation (ACI) and to analyze the correlation between arthroscopic and MRI-based assessment.
Design
We included ACI recipients from a multicenter registration study (CaTCh [Cartilage Treatment in Chiba] study). Morphological (3-dimensional magnetic resonance observation of cartilage repair tissue: 3D-MOCART, MOCART2.0) and qualitative assessment (T2- and T1rho-mapping) by MRI were conducted at 6, 12, and 24 months post-implantation. Global T2 and T1rho indices (T2 and T1rho in repair tissue divided by T2 and T1rho in normal cartilage) were calculated. Arthroscopic second-look assessment was performed in 4 and 15 knees at 12 and 24 months post-implantation, respectively.
Results
The 3D-MOCART over 12 months witnessed significant patient improvement, but some presented subchondral bone degeneration as early as 6 months. The MOCART2.0 improved from 57.5 to 71.3 between 6 and 24 months (P = 0.02). The global T2 index decreased from 1.7 to 1.2 between 6 and 24 months (P < 0.001). The global T1rho index decreased from 1.5 to 1.3 between 6 and 24 months (P = 0.004). Normal or nearly normal ICRS-CRA (cartilage repair assessment scale developed by the International Cartilage Repair Society) grades were achieved in 86% and 93% of the lesions at 12 and 24 months, respectively. Better ICRS-CRA grade corresponded to better MOCART2.0, with no trend in the T2 and T1rho values.
Conclusions
Atelocollagen-assisted ACI improved the MRI-based morphological and qualitative outcomes until 24 months post-surgery, and normal or nearly normal grades were achieved in most lesions by arthroscopic assessment. MRI assessment may be an alternative to arthroscopic assessment.
Introduction
The hyaline type articular cartilages of joints comprise an extracellular matrix of type II collagen and proteoglycan (PG), chondrocytes, and water that accounts for 70% to 80% of wet weight. 1 It is well known that the articular cartilage has a very low cell density, and lacks blood vessels, nerves, and lymphatic vessels. Thus, due to the poor self-repairing ability, tissue repair mechanisms are unlikely to occur in injury. 2 Although many attempts have been made to treat articular cartilage defects, none have successfully replaced large osteochondral defects with long-lasting hyaline cartilage.
Among the currently existing procedures, autologous chondrocyte implantation (ACI) is expected to repair cartilage defects that exceed 4 cm2 with good repair tissues approximating the hyaline cartilage. 3 Ochi and colleagues developed the third-generation matrix-associated ACI to create a cartilage-like tissue ex vivo in a 3-dimensional (3D) culture using atelocollagen gel, from which telopeptides have been removed to eliminate the antigenic determinants of bovine type I collagen. 4 This atelocollagen-assisted ACI preserves the phenotype of the cultured chondrocytes and enables even distribution of cells in the transplanted tissue. It also has a lower risk of chondrocytes leakage from the grafted site. They reported that the implanted tissue matured to hyaline-like cartilage at an average of 12 months. 4 However, other authors reported that the repair tissue remains fibrocartilage-like at 12 months and matures to hyaline-like cartilage at an average of 19.8 months. 5 It has been reported that the final repair tissue may be fragile immature fibrocartilage in some cases. The process and time course of repair tissue maturation remain to be elucidated.
Currently, there is no established method to reliably evaluate the quality of the repaired tissue after ACI. Determining the condition of the repair tissue after ACI would help evaluate the therapeutic effect and predicting long-term prognosis. The gold standard for analyzing the status of the repair tissue is arthroscopic assessment and biopsy, although it is invasive.
Magnetic resonance imaging (MRI) is a non-invasive method for morphologically evaluating cartilage defects and repair. 6 Knee protocols with standard 2-dimensional sequences and more advanced isotropic 3D MRI can provide a detailed morphological evaluation. 7 Moreover, T1rho- and T2-mapping are increasingly being used for biochemical analyses. T1rho relaxation time can evaluate glycosaminoglycan (GAG) concentration and water content of articular cartilage, 8 whereas T2 relaxation time can evaluate collagen sequence and water content. 9 Some authors report that the MRI-based outcomes reflect the arthroscopic assessment and can replace more invasive resources such as arthroscopy and biopsy, but this is still debatable.10-13
Our current study aimed (1) to elucidate the time course of MRI-based morphological and qualitative outcomes after ACI with atelocollagen gel as a scaffold and (2) to investigate the correlation between arthroscopic assessment and MRI-based outcomes.
Materials and Methods
Study Design
This study was a retrospective analysis of prospectively collected data from a multicenter study registering all ACI cases in the region (CaTCh study: Cartilage Treatment in Chiba study). The institutional review board of the authors’ institution approved the design and publication of this study. The collected data were anonymized for storage and analysis. The MRI and arthroscopic evaluation were performed by an independent evaluator without any information on the patient characteristics and clinical outcomes.
Patient Selection
All patients who received atelocollagen-assisted ACI 4 at each of the participating facilities of the CaTCh study were registered in a multicenter study. Among these registered patients, those who underwent surgery between February 2016 and April 2018 were candidates for the present study. The inclusion criteria for this study included those who were followed up for at least 2 years; those who completed the scheduled imaging evaluations by MRI—including T2-mapping 9 and T1rho-mapping 8 at 6, 12, and 24 months after ACI surgery; and patients without a history of cartilage repair surgery. Patient characteristics including age, sex, body mass index (BMI), diagnosis leading to ACI surgery (traumatic cartilage injury or osteochondritis dissecans), the number of lesions per knee, the total size of cartilage injury per knee, and the location of the lesion were collected from medical records.
Surgical Technique and Postoperative Procedure
All patients underwent a 2-stage atelocollagen-assisted ACI. 4 In the first surgery, an arthroscopic biopsy was performed to collect 0.4 g of normal cartilage from the non-weightbearing areas of the knee. The cartilage tissue was subjected to enzymatic digestion, the extracellular matrix was removed, and the chondrocytes were isolated. 4 Chondrocytes were isolated from the cartilage tissue, embedded in an atelocollagen gel (Koken Atelocollagen Implant, Koken Co., Ltd., Tokyo, Japan), and cultured for 4 weeks until the second surgery for implantation. During the second surgery, damaged cartilage tissue was removed from each lesion, and an atelocollagen gel containing immature chondrocytes was implanted. The implanted tissue was covered with an autologous periosteal patch and secured using suture anchors and nylon sutures. The postoperative protocol was not uniform among these patients, because it was mainly dependent on the lesion site, whether it was in the patellofemoral joint or femorotibial joint.
MRI Evaluation
The structural and compositional changes of the implanted tissue were evaluated by MRI at 6, 12, and 24 months after implantation surgery. The MR images were acquired using a 1.5 tesla (T) or 3.0 T magnet system (Ingenia, Philips Healthcare, Best, The Netherlands), by placing the patients in a supine position with the knee slightly flexed in the center of a dedicated knee coil. The complete MRI protocol is shown in Table 1 . The 3D magnetic resonance observation of cartilage repair tissue (MOCART 7 ) and MOCART 2.0 knee score 14 were used to quantify the structural changes in the cartilage repair tissue. For compositional evaluation, the repair tissue area was manually registered as the region of interest (ROI) in MATLAB (MathWorks, Natick, MA, USA), version R2020a. The repair tissue was defined on the MRI by identifying the soft anchor inserted in the margin of the lesion to secure the periosteal patch covering the implanted tissue. Then, the MRI slice that represents the largest width of the lesion was selected, and the border of the implanted tissue was traced to define the ROI. The identical slice was selected for follow-up exams, and the ROI was traced to have the same area. Minor adjustment was required in cases of differences caused in image position. To minimize the effect of imaging variations, the measured value was normalized by the value measured in native cartilage. The ROIs for native cartilage were drawn in equal size as the repair tissue, measured at a distance of at least 1 centimeter from the repair tissue to avoid including the damaged cartilage near the repair tissue. The ROIs for the repair tissue and native cartilage were selected to cover the full thickness of the cartilage layer. The evaluation of 3D MOCART, MOCART 2.0, T2-mapping, and T1rho-MR-mapping was performed according to the instructions published by Welsch et al. 7 and Schreiner et al. 14 Repair sites where the T2 or T1rho values could not be measured due to metal artifacts, non-uniform magnetic field, and body movement were excluded. T2 and T1rho indices were calculated with global mean T2 and T1rho values of the repair tissue and global mean T2 and T1rho values of normal, hyaline cartilage, respectively. 15
Magnetic Resonance Imaging Protocol.
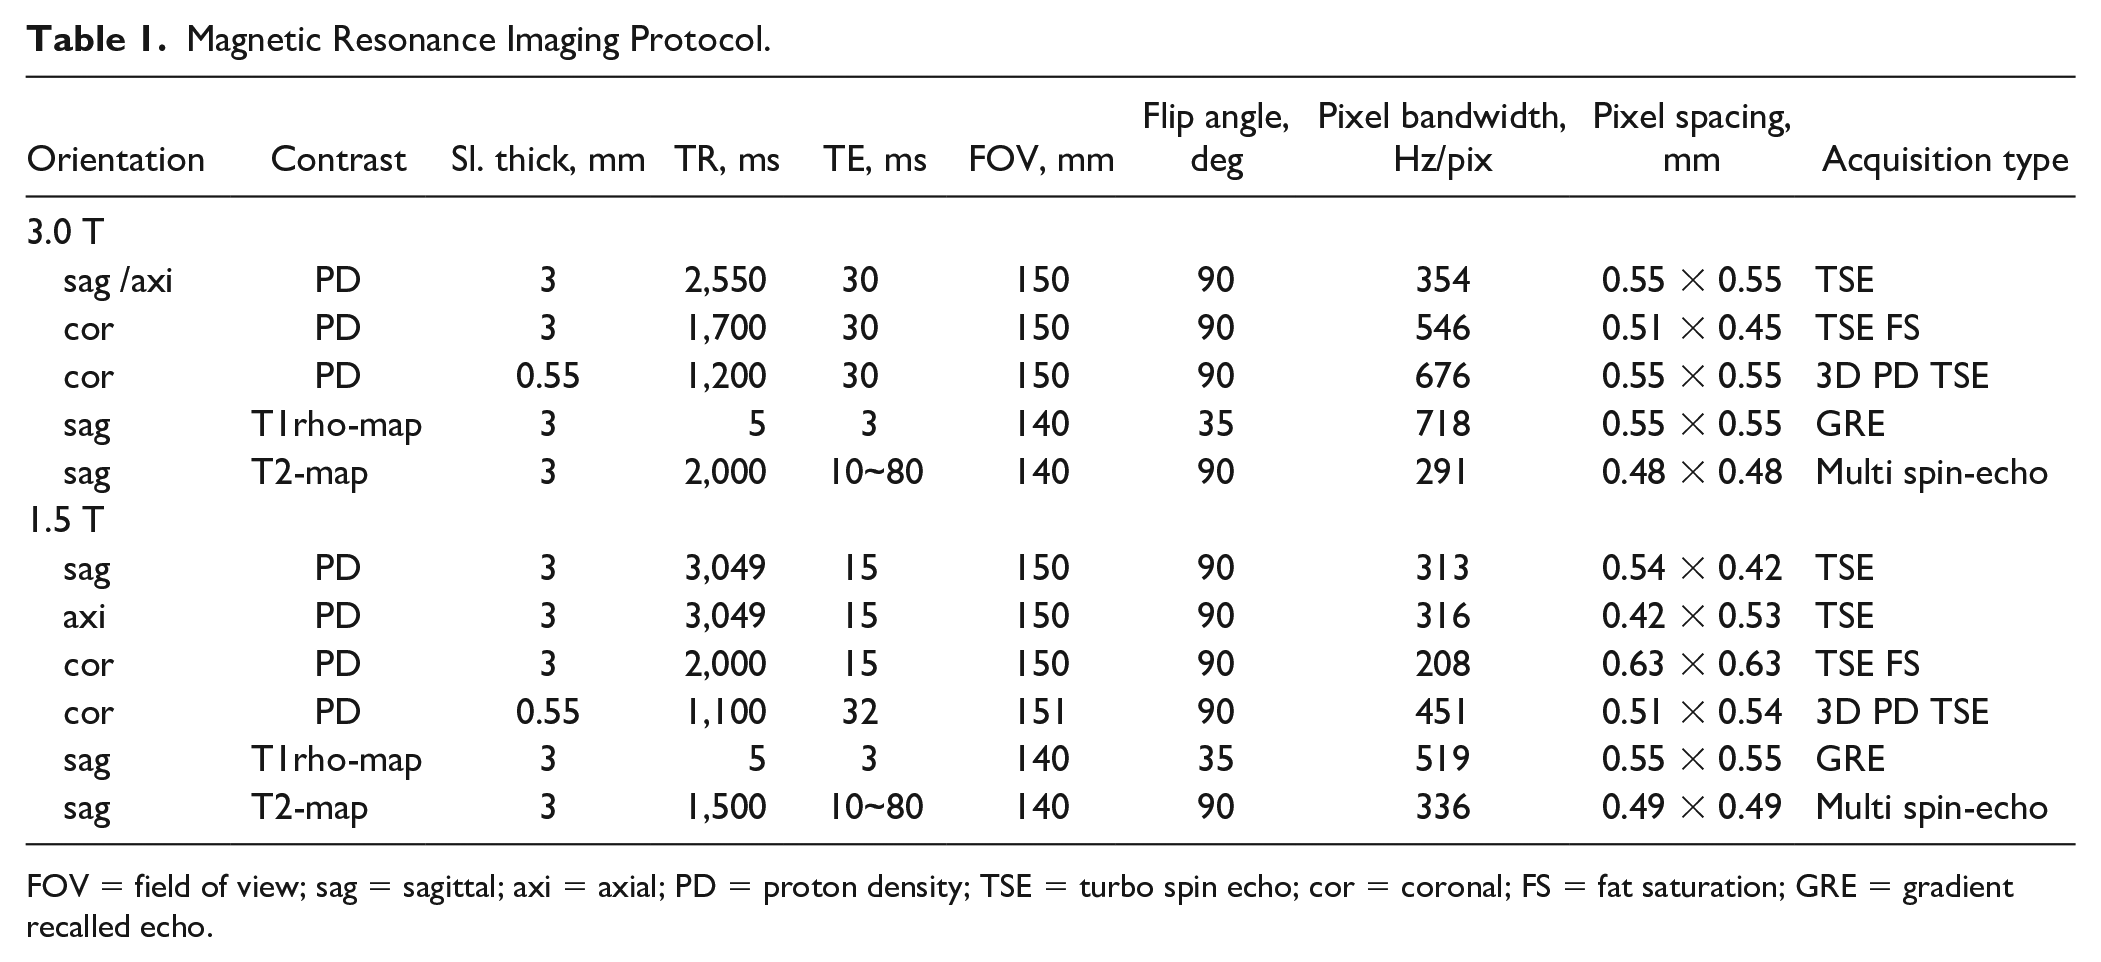
FOV = field of view; sag = sagittal; axi = axial; PD = proton density; TSE = turbo spin echo; cor = coronal; FS = fat saturation; GRE = gradient recalled echo.
Arthroscopic Assessment
Arthroscopic evaluation 12 months after implantation was recommended to all patients at the time of informed consent for the initial surgery was taken and was performed in patients who wished for a second-look evaluation by the patient’s own will. The implanted tissue was assessed by direct visualization and probing under arthroscopy and graded according to the cartilage repair assessment scale developed by the International Cartilage Repair Society (ICRS): ICRS-CRA. 16 The tissue was assessed for defect filling (by comparing the tissues level with the adjacent normal cartilage), border integrity to adjacent cartilage, and the surface smoothness (by gross appearance). A 12-point scale score was assessed, with up to 4 points awarded each for the degree of repair of the defect, the degree of integration with the surrounding cartilage tissue, and macroscopic appearance. Grade I (12 points) was considered normal, grade II (8-11 points) nearly normal, grade III (4-7 points) abnormal, and grade IV (1-3 points) severely abnormal.
Statistical Analysis
Patient characteristics were presented using descriptive statistics. MOCART 2.0 Knee score, T2, and T1rho index values were analyzed as continuous variables, and the averages of each time point were compared using a 1-way analysis of variance (ANOVA) with a post hoc Tukey test.
All statistical analyses were conducted using the Bell Curve for Excel (Social Survey Research Information Co., Tokyo, Japan). All tests were 2-sided. Statistical significance was set at P < 0.05.
Results
Study Patients
During the study period, a total of 24 knees from 24 patients were registered in the CaTCh study. Among the registered patients, 20 knees from 20 patients, were treated at 4 of the 7 participating institutions and completed the MRI evaluation. A total of 38 cartilage injury lesions were included in the analysis. MOCART assessment was performed in all subjects, while some lesions were not sufficient for T2-mapping or T1rho-mapping assessment due to imaging artifact. T2-mapping measurement was performed on 35 lesions in 19 knees, and T1rho-mapping measurement was performed in 20 lesions in 13 knees. There were 11 males and 9 females, and the mean age at implantation was 45.4± 12.4 years old (range, 16-59 years). There were 19 cases of cartilage injury due to trauma and 1 case of osteochondritis dissecans. The mean BMI of all patients was 23.5 ± 3.8. Ten patients had multiple lesions in one knee, while 10 patients had a single lesion. There were 4, 5, and 1 patients who had 2, 3, and 5 lesions, respectively. The average number of lesions per knee was 2.6 ± 1.1. Some patients received mosaicplasty for smaller lesions if the patient had multiple lesions. The MRI measurement and arthroscopic assessment were performed only on the ACI-treated sites. Patients had undergone ACI transplantation to the medial femoral condyle (n =7), the lateral femoral condyle (n =14), the medial tibial condyle (n =2), the lateral tibial condyle (n =4), the trochlea (n = 9), and the patella (n =2). The mean defect size was 9.3 ± 4 cm2 (4-17 cm2) ( Table 2 ).
Patient Characteristics (n = 20).
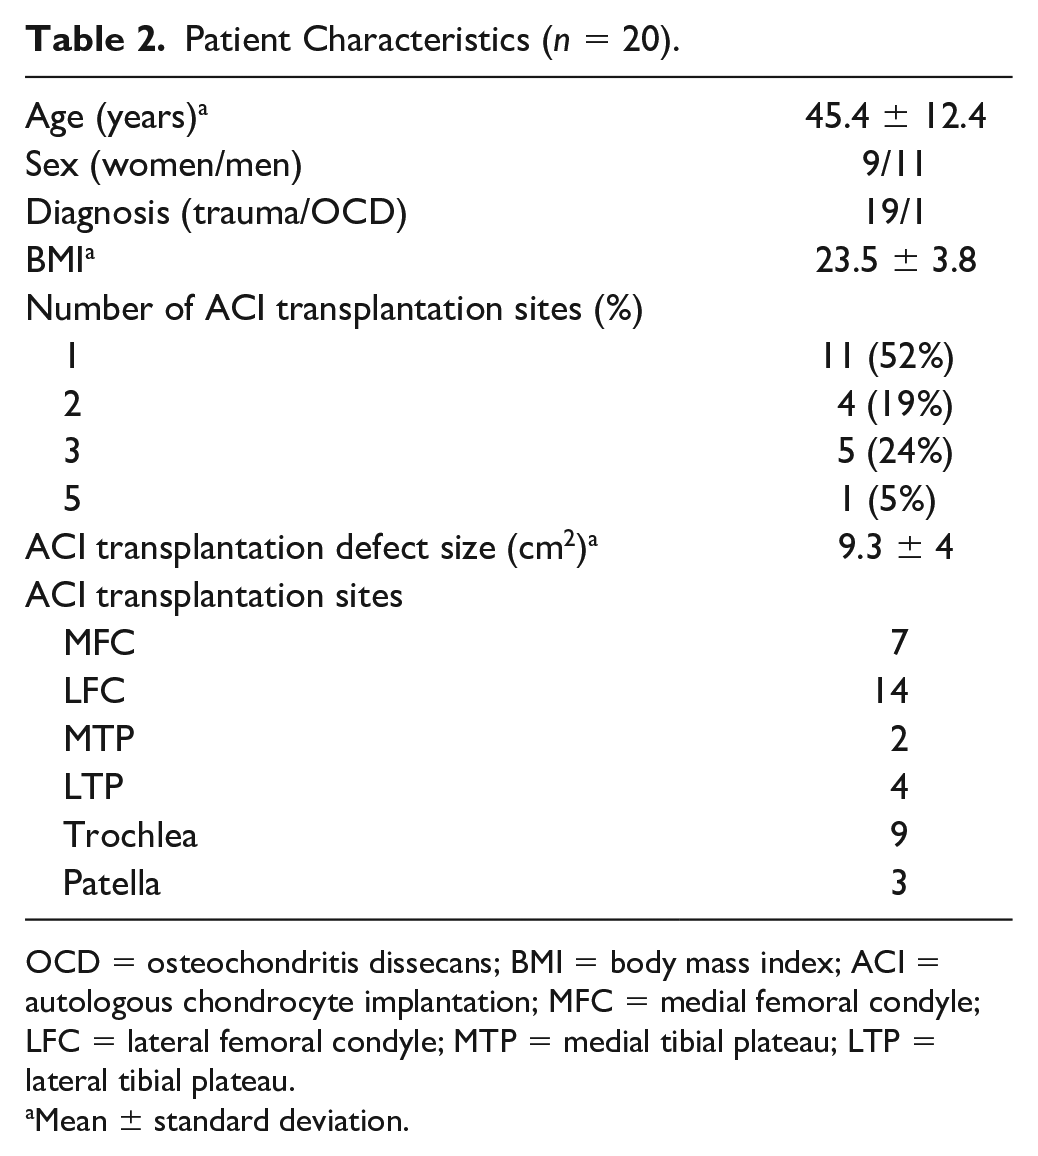
OCD = osteochondritis dissecans; BMI = body mass index; ACI = autologous chondrocyte implantation; MFC = medial femoral condyle; LFC = lateral femoral condyle; MTP = medial tibial plateau; LTP = lateral tibial plateau.
Mean ± standard deviation.
Structural Assessment by MRI
The 3D MOCART 7 and MOCART 2.0 knee score 14 were evaluated at 38 repair sites at 6, 12, and 24 months after implantation. Assessment by 3D MOCART 7 revealed that the number of lesion sites that showed morphological improvement in the defect fill level, cartilage interface between adjacent normal cartilage, surface and structure, and signal intensity were more. These changes were more apparent 12 months postoperatively. However, some cases presented with degeneration of the subchondral bone—seen as chondral osteophytes, granulation tissue, and cysts—as early as 6 months after ACI, and the cases increased over time ( Table 3 ).
The 3D-MOCART.
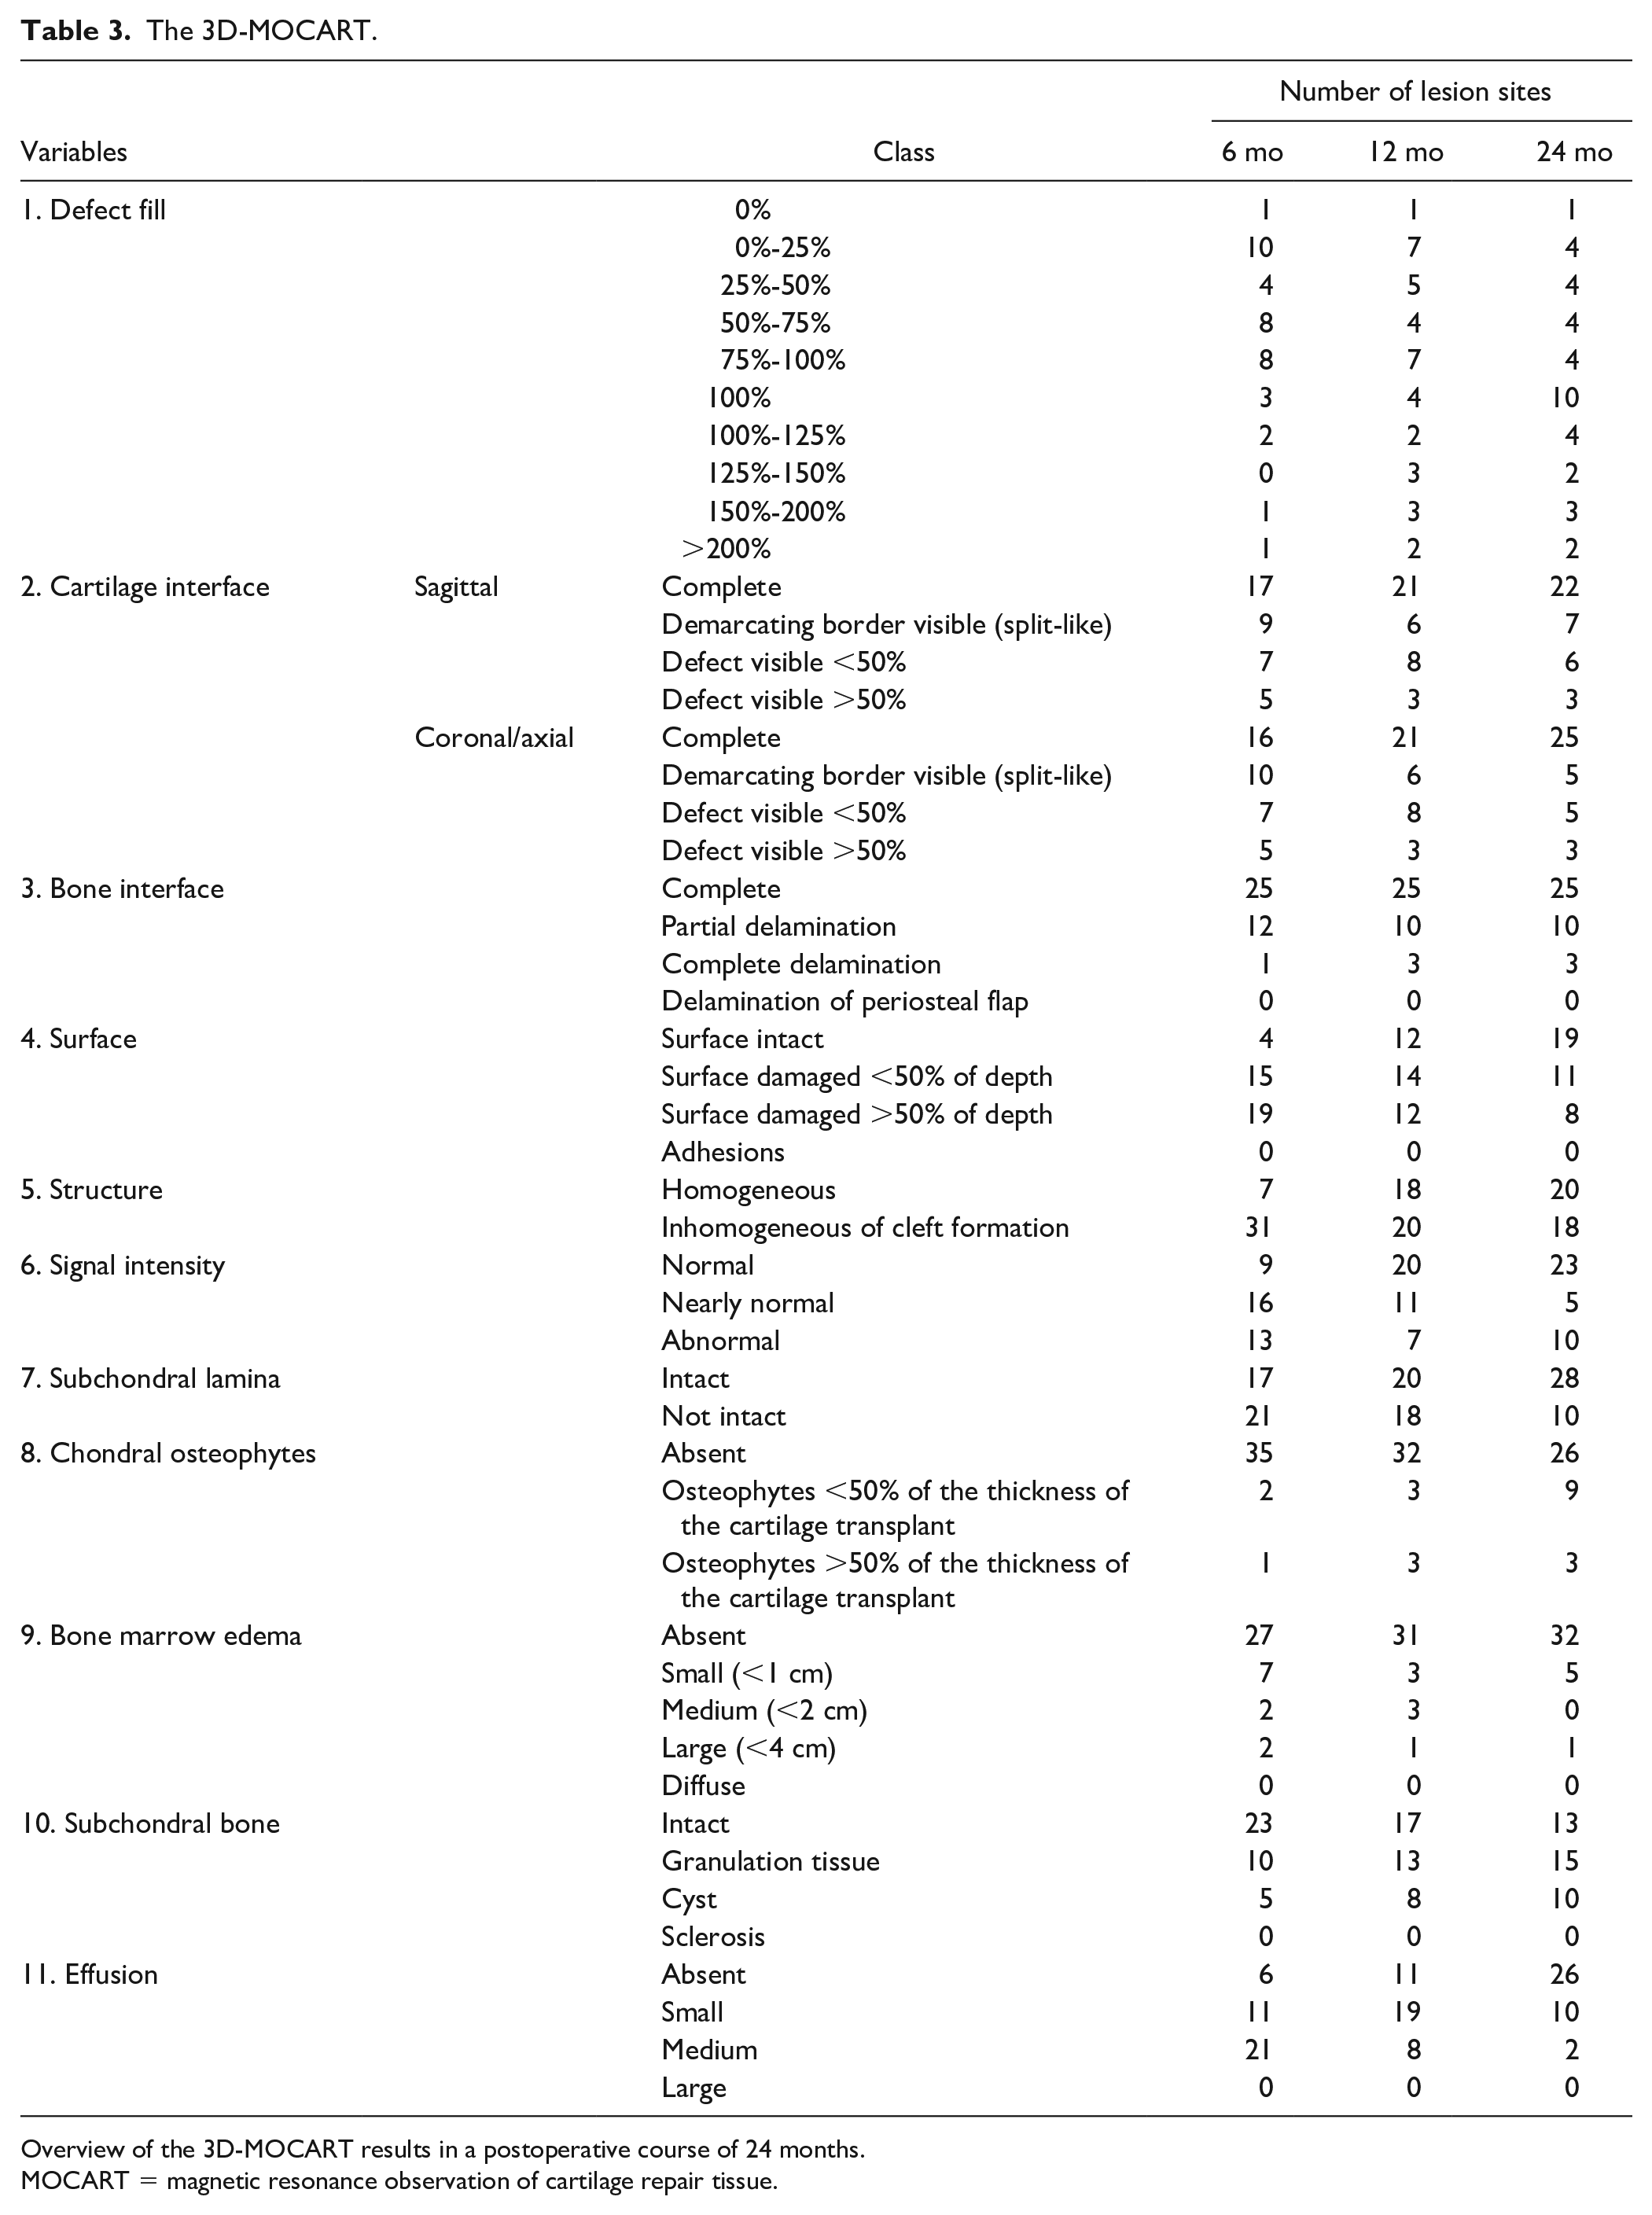
Overview of the 3D-MOCART results in a postoperative course of 24 months.
MOCART = magnetic resonance observation of cartilage repair tissue.
These changes were summarized and quantified using the MOCART 2.0 knee score.
14
The mean MOCART 2.0 score was 57.5 (95% confidence interval [CI], 38.2-76.8), 66.6 (95% CI, 42.8-90.3), and 71.3 (95% CI, 48.7-94) at 6, 12, and 24 months, respectively. The increase between 6 and 24 months was statistically significant (P = 0.02) (
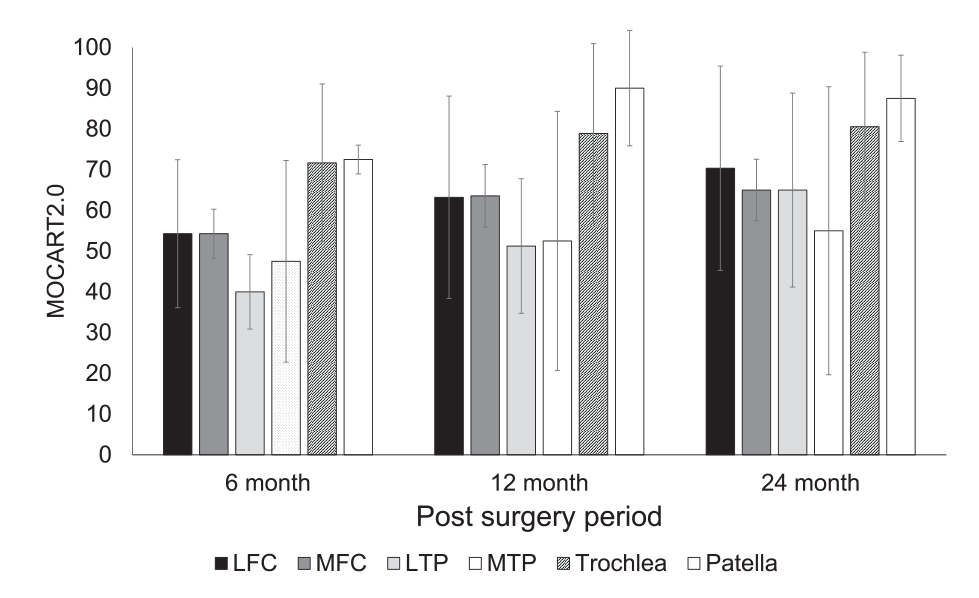
Postoperative change of the MOCART 2.0 score in each lesion site. MOCART = magnetic resonance observation of cartilage repair tissue; LFC = lateral femoral condyle; MFC = medial femoral condyle; LTP = lateral tibial plateau; MTP = medial tibial plateau.
Compositional Quality Assessment by MRI
The quality of the implanted tissue was quantitatively assessed using T2-mapping
9
and T1rho-mapping.
8
The T2 values were measured at 35 repair sites at 6, 12, and 24 months after implantation. The mean T2 values of repair tissue decreased from 50 ms at 6-month follow-up to 35.6 and 33.1 ms after 12 and 24 months, respectively. In addition, the global T2 index values decreased from 1.7 at the 6-month follow-up to 1.3 and 1.2 after 12 and 24 months, respectively. The decrease was statistically significant at postoperative months 6 to 12 (P < 0.001) (
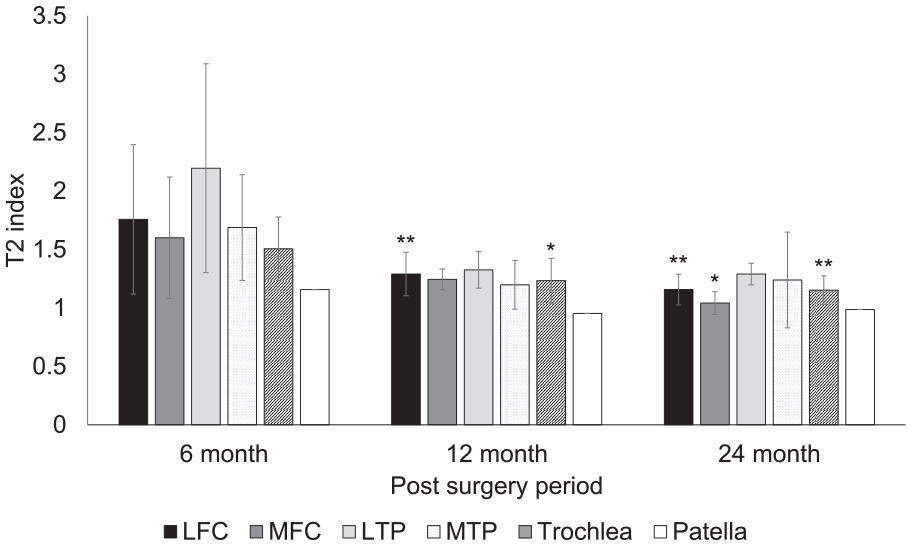
Postoperative change of the mean T2 values in each lesion site. LFC = lateral femoral condyle; MFC = medial femoral condyle; LTP = lateral tibial plateau; MTP = medial tibial plateau. **P < 0.01 compared with values at 6 months. *P < 0.05 compared with values at 6 months.
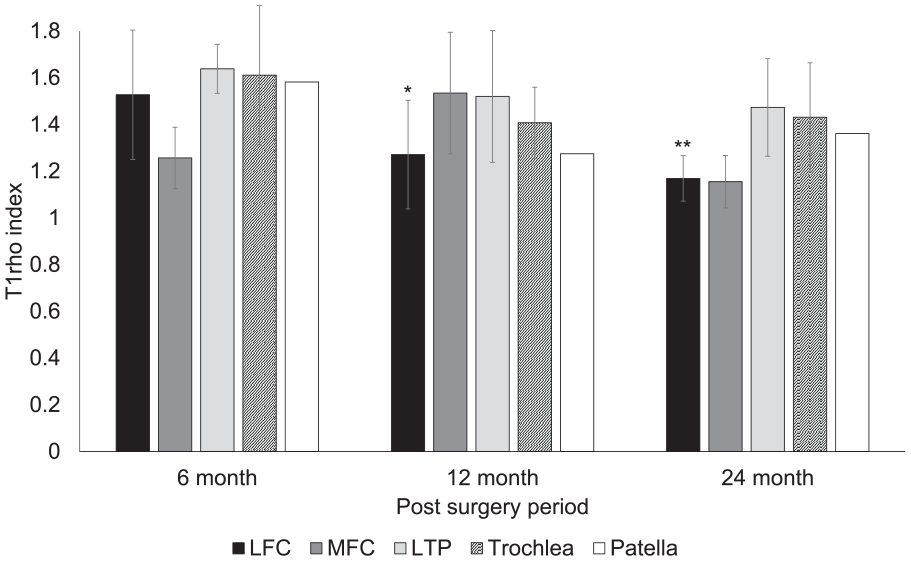
Postoperative change of the mean T1rho values in each lesion site. LFC = lateral femoral condyle; MFC = medial femoral condyle; LTP = lateral tibial plateau; MTP = medial tibial plateau. **P < 0.01 compared with values at 6 months. *P < 0.05 compared with values at 6 months.
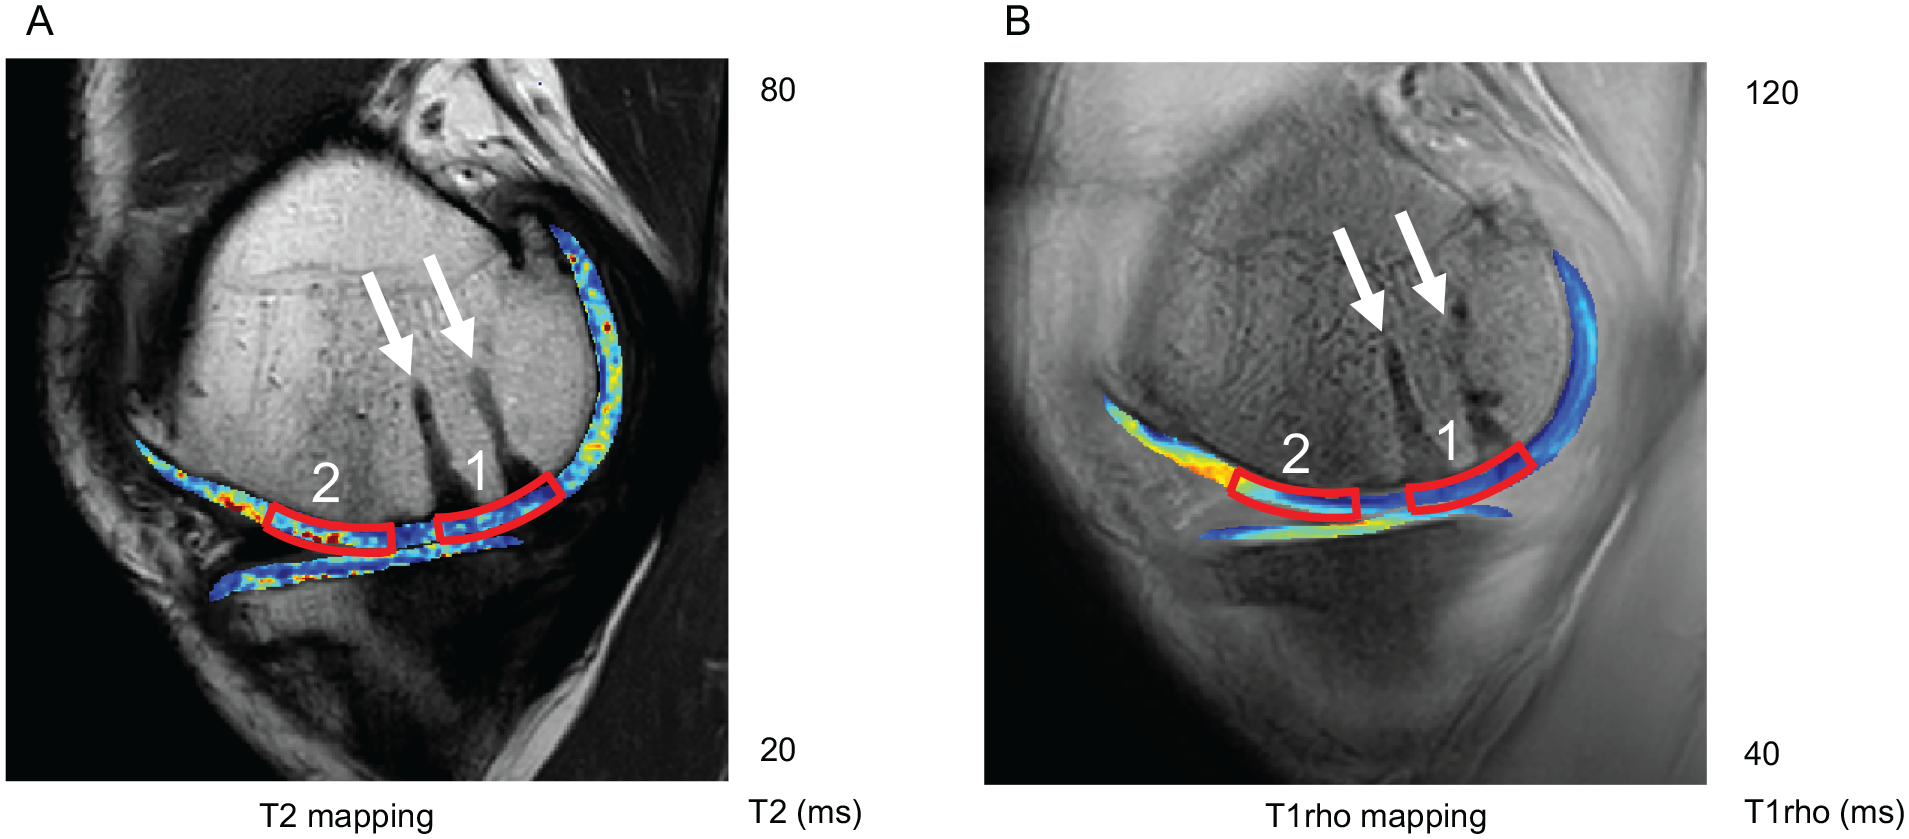
T2- and T1rho-mapping of a 41-year-old male patient 24 months after autologous chondrocyte implantation of the medial femoral condyle. (
Arthroscopic Assessment
Arthroscopic second-look assessment was performed on 7 repair sites in 4 knees at 12 months and on 30 repair sites in 15 knees at 24 months after implantation. Normal or nearly normal ICRS-CRA grades (ICRS-CRA grade 1 or 2) were achieved in 86% of the lesions at 12 months and 93% at 24 months after implantation (
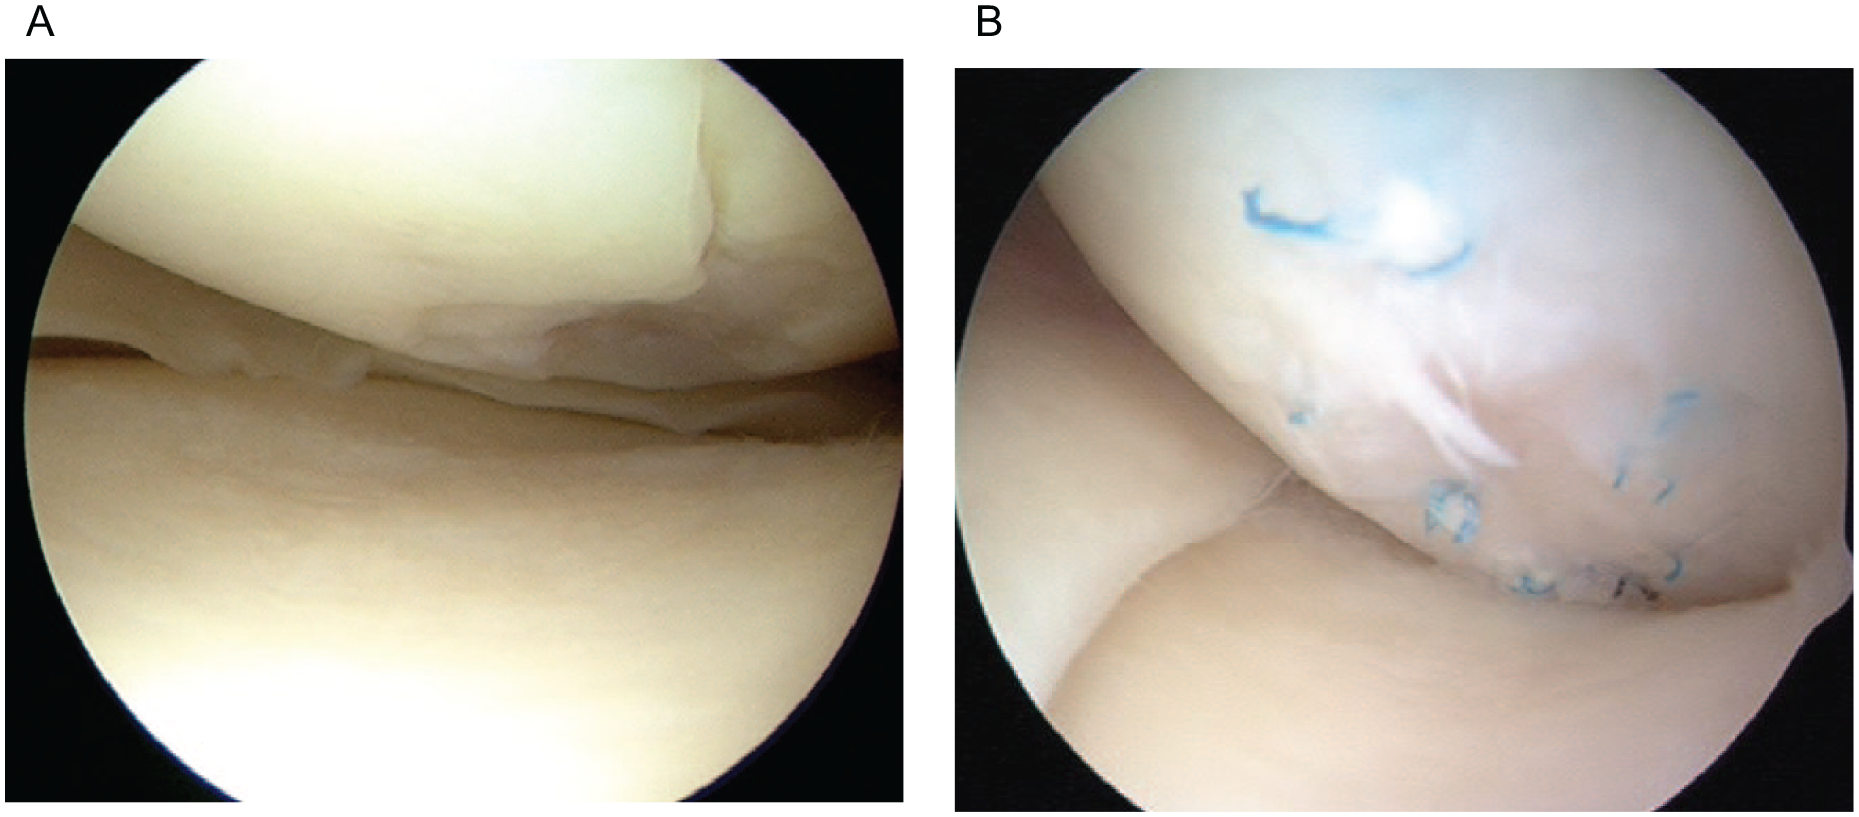
Pre- and postoperative arthroscopic image of a 31-year-old male patient. (
We compared the mean total MOCART 2.0 score in each ICRS-CRA grade in
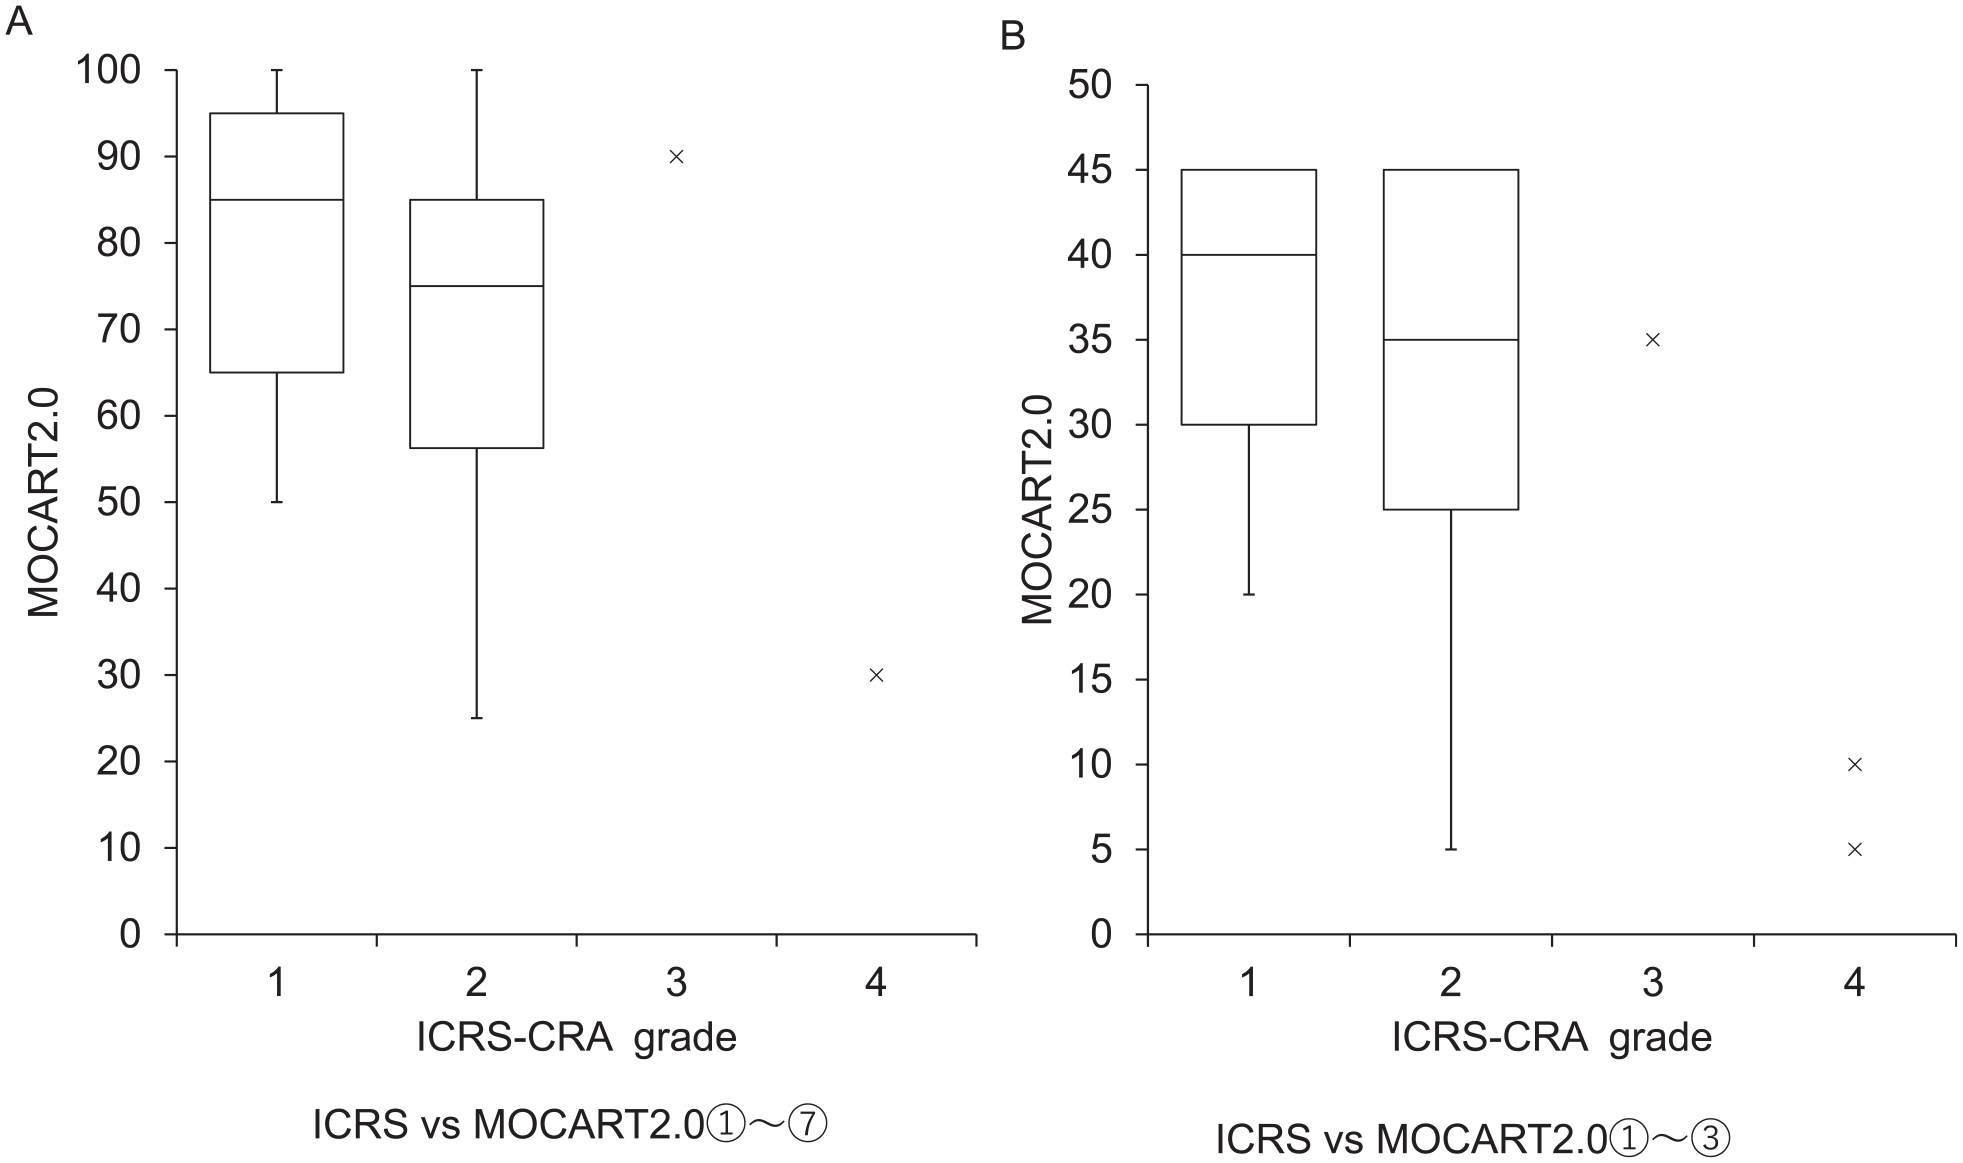
MOCART 2.0 scores in each ICRS-CRA grade. (
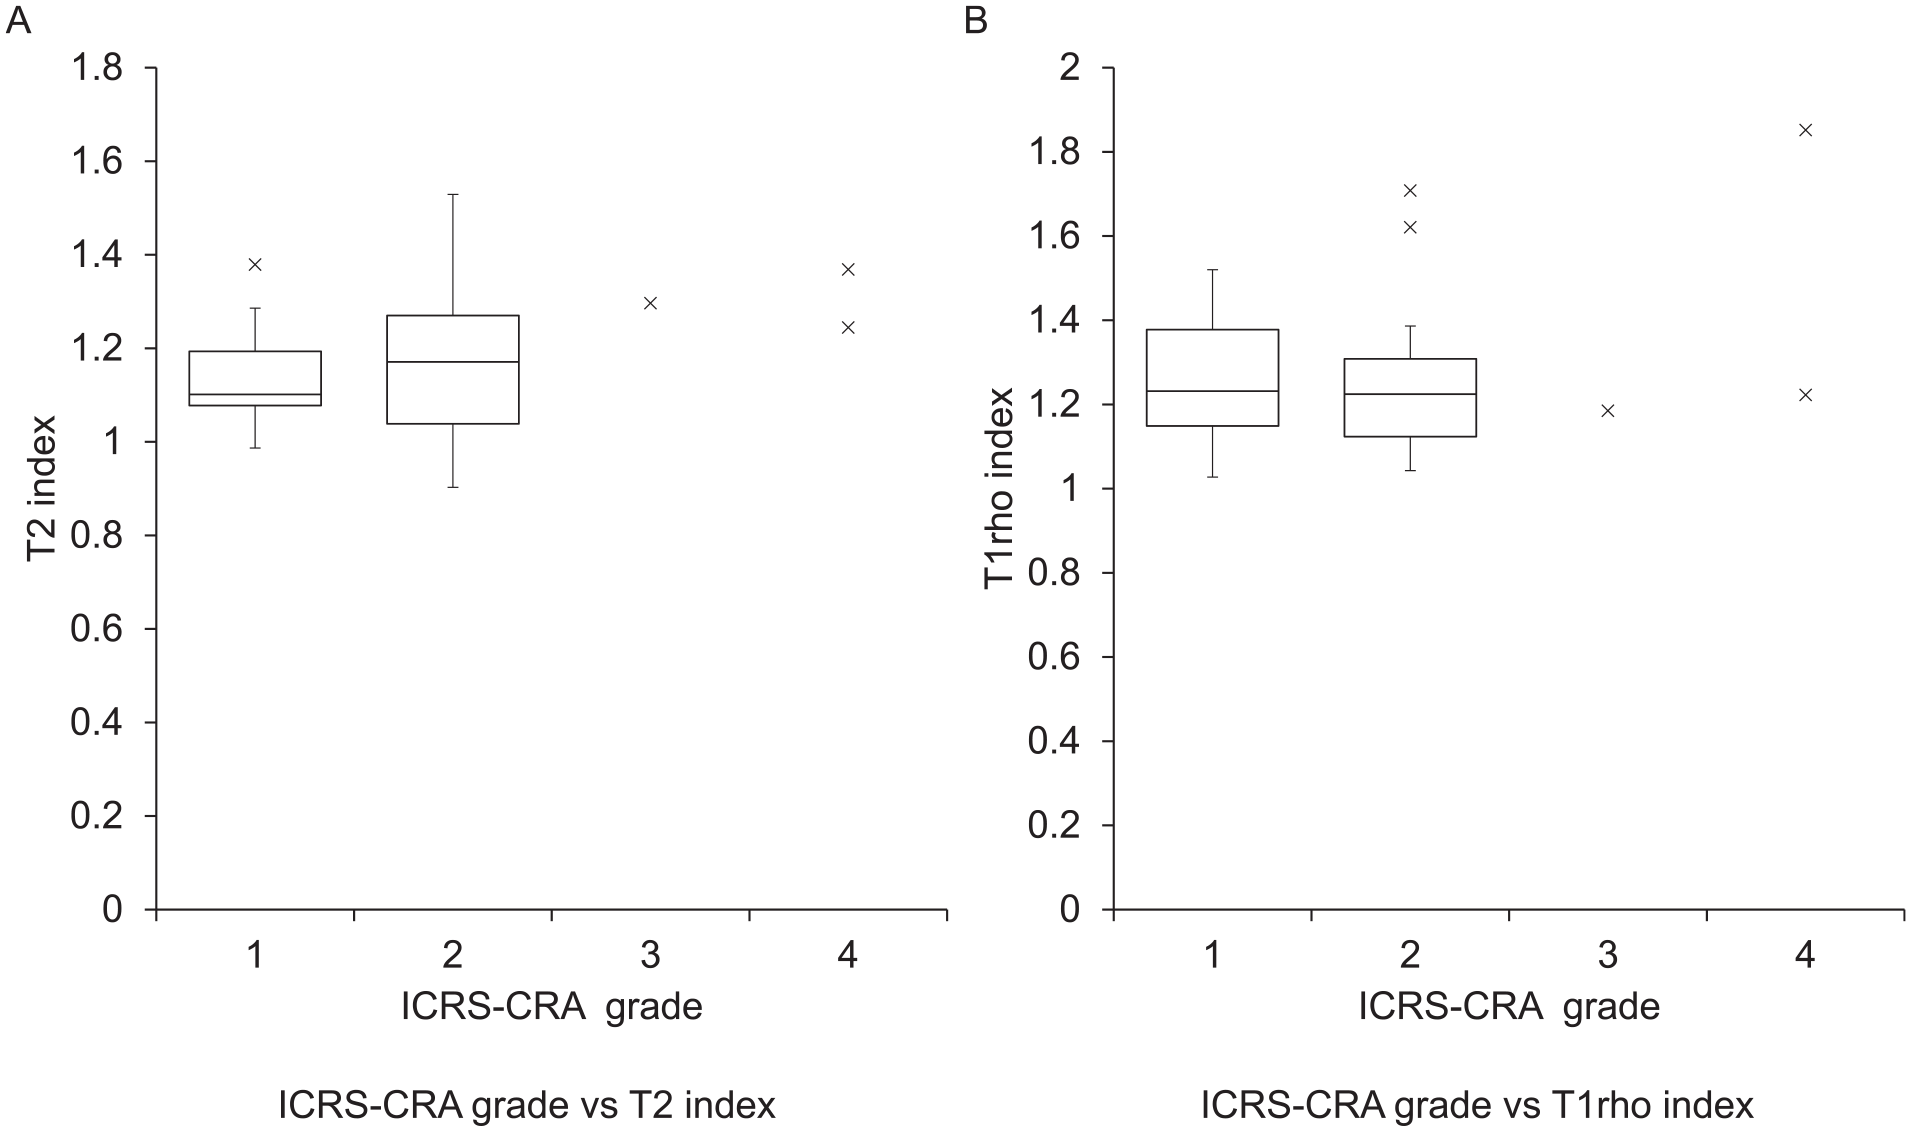
Global T2 and T1rho index in each ICRS-CRA grade. (
Discussion
In the present study, structural and compositional MRI assessment as well as arthroscopic assessment revealed that the repair tissue improved morphologically and qualitatively over time up to 24 months after atelocollagen-assisted ACI. The arthroscopic assessment indicated that 93% at 24 months after implantation had good or excellent outcomes. Furthermore, the results from comparison of MRI evaluation and arthroscopic scoring, indicating a trend of better MOCART2.0 corresponding to better ICRS-CRA grading while T2-mapping and T1rho-mapping values not matching ICRS-CRA-grades, suggest that MRI may allow similar evaluation of the structural improvement, while the arthroscopic evaluation does not reflect the qualitative changes.
Quantitative Analysis
Previous studies have shown that the MOCART scores improved 12 months after atelocollagen-assisted ACI, and this continued until the final follow-up.17,18 Other third-generation ACI studies that included radiological results after 2 years showed the MOCART score was all graded as good. In addition, Zak et al., 19 who used an Igor scaffold, showed that the MOCART 2.0 knee score was 78 at 24 months after implantation. Similar to previous reports, our current study showed that the MOCART 2.0 knee score significantly improved from 57.5 at 6 months after implantation to 71 at 24 months.
By 3D MOCART assessment, the number of cases that presented morphological improvement of the cartilage repair tissue increased over time, and the improvement was confirmed from 12 months after implantation. Conversely, as early as 6 months after implantation, some cases present with degeneration of subchondral bone seen as chondral osteophytes, granulation tissue, and cysts. In these cases, MOCART2.0 decreased with decreasing defect fill and increasing subchondral changes. Adachi et al. and Takazawa et al. reported that a slight subchondral change was seen beneath the implanted site at 6 years, but the MOCART score did not decrease. Moreover, Zak et al. reported that the defect fill of the repair tissue decreased, and the appearance of subchondral bone changes increased between 12 and 24 months in some cases. Therefore, MOCART 2.0 decreased from 5 to 10 points between 12 and 24 months. 19
Previous studies showed a 3-fold increase in the failure rate of ACI after previous marrow stimulation such as microfracture.20,21 In addition, the preoperative subchondral bone injury was significantly associated with post-ACI subchondral bone changes. 22 The subchondral changes observed in our cases may be degeneration that occurs in the early phase after surgery, possibly suggesting damage to the subchondral bone before ACI surgery. Another possibility may be that the surgical procedure, such as anchor insertion, caused damage to the subchondral bone, which progressed over time.
Qualitative Analysis
As arthroscopy is invasive and unsuitable for repeated longitudinal follow-up, MRI has become the preferred method for non-invasive follow-up of patients after cartilage resurfacing procedures. dGEMRIC imaging requires injection of gadolinium contrast and thus is more invasive and places greater demands on the imaging center and patient. 23 Conversely, T1rho- and T2-mapping can probe the macromolecular structure of articular cartilage through different mechanisms in a completely non-invasive manner indistinguishable from traditional qualitative MRI. Ultrastructural alterations to collagen and PGs can be detected by changes in T1rho and T2 values. By using spin-lock techniques, T1rho is believed to be more sensitive to PG content,24,25 while T2, through its analysis of free water proton molecule motion within the cartilaginous matrix, is believed to be highly sensitive to the orientation, concentration, and integrity of collagen in the articular cartilage.9,26 -28
Quantitative T2- and T1rho-mapping for the assessment of cartilage repair comprises intact articular cartilage as a direct gold standard within the same joint. Therefore, we described the individual relative T2 and T1rho values with a T2 and T1rho index. This is because we considered the inter-individual variability of T2 and T1rho values and the difference in the MRI protocol. 29
It has been reported that T2 values are similar to those of normal hyaline cartilage at 1 to 3 years.15,30,31 However, these studies were cross-sectional and did not explain the time course of cartilage maturation. In our current longitudinal evaluation, the T2 index improved with time to a similar range of normal cartilage tissue by 1 year after implantation.
However, to our knowledge, no study has evaluated the radiographic properties of repair tissue following ACI using T1rho-mapping. In our current study, the T1rho index improved and attained the same value as that of normal tissue by 2 years after implantation. Together with the findings of T2-mapping, it is suggested that the water content and collagen sequence improve in 1 year, but the PG content improvement will take more time.
It has been reported that T1rho-mapping complements T2-mapping in the assessment of repair tissue maturation in Microfracture or Mosaicplasty.32,33 No study has examined T1rho and compared the efficacy of T1rho and T2 quantitative MRI in evaluating cartilage regeneration after ACI. We consider T1rho-mapping and T2-mapping to be viable methods to monitor repair tissue maturation overtime after ACI quantitatively and non-invasively. However, the number of patients is low, and there is need for further confirmation of the present study.
MRI-Based Outcomes and Arthroscopic Assessment
Ochi et al. 4 reported that 93% had normal or nearly normal outcomes (ICRS grade 1 or 2) at 24 months after atelocollagen-assisted ACI. In addition, the arthroscopic assessment showed that 92% of the cases were evaluated as normal or nearly normal 12 months after implantation. 34 A more recent study reported that arthroscopic findings at 24 months after implantation were graded as normal or nearly normal according to the ICRS scale in 64 of 73 knees (87.7 %). 18 In other types of ACI, it was reported that good or excellent outcomes were obtained in 80% of patients at 1 to 1.5 years after implantation 35 and a significant correlation was observed between the ICRS and overall MRI score, especially in defect filling and cartilage signal. 36 However, some studies reported no significant correlation between arthroscopic assessment and the MOCART score. 12 The rate of good or excellent outcomes (ICRS grade 1 or 2) was 86% at 24 months after implantation in our study, and lower ICRS grade had a higher total MOCART2.0 score as well as the 3 variables (defect filling, integration, and surface) of the MOCART2.0. The MRI structural evaluation had similar results with ICRS-CRA grading. However, the results of MRI qualitative evaluation (mean global T2 index and mean global T1rho index) did not correspond to ICRS-CRA grades. This suggests that MRI can evaluate the improvement in structural appearance similarly to the arthroscopic evaluation, and MRI has advantage in that it could also assess the quality of the repaired tissue in a non-invasive manner. MRI assessment may be used as an alternative to arthroscopic assessment in terms of morphological evaluation and would provide additional value in the assessment of the quality of repaired tissue, thus being more useful in the postoperative longitudinal monitoring of cartilage repair surgeries.
Comparison with Other ACI
The measured T2 values of repair tissue in our study were lower than those in previous studies.37 -42 The difference may be due to the different types of scaffolds used in each study because the ultrastructure of repair tissue after ACI surgery differs depending on the scaffold. The differentiation status of chondrocytes in the scaffold affects the production of type II collagen and may alter the T2 value of the repair tissue. 39 Gavénis et al. 43 showed a significantly higher type II collagen gene expression and a lower type I collagen gene expression in their collagen gels compared with other matrix systems. Our lower T2 values suggest that atelocollagen-assisted ACI may be favorable for tissue maturation after ACI.
The most common problems after the ACI procedure performed using a periosteal membrane include early delamination, incomplete periosteal graft incorporation into host cartilage, and late hypertrophic periosteal response. Periosteal hypertrophy has been reported in 28% of all patients. 44 In our series, 5 cases showed graft hypertrophy until 24 months, and 1 case presented with catching that required arthroscopic shaving. Steinwachs reported that the use of an artificial collagen I/III membrane in the fixation of cells during the implantation process could reduce the incidence of symptomatic hypertrophy with the need for revision surgery 36 months after surgery. 45
This study had several limitations. First, we did not evaluate the preoperative MRI because the images were not obtained in the same manner, and there were considerable variations in the image quality. Therefore, we were unable to distinguish the changes observed 6 months after surgery from those occurring before ACI surgery. In some cases, subchondral changes, such as cysts or cartilaginous osteophytes, might have been observed before ACI. Second, the patients were not homogeneous, with variability in the number and location of lesion sites. Third, although all lesions included were diagnosed as traumatic chondral lesion by the definition of having a clear boarder from the surrounding normal appearance cartilage tissue, there is possibility that the normal appearing cartilage had potential degeneration and thus affected the measurement. Furthermore, some patients had undergone concomitant surgery, such as anterior cruciate ligament reconstruction, meniscus repair, and limb alignment correction. These variabilities in preoperative comorbidities or concomitant surgeries might have influenced the tissue maturation process. Ideally, a study on patients with single lesions in the same compartment without any combined injuries would more easily evaluate tissue maturation in a uniform environment.
However, it is common that some combined injuries occur along with cartilage injury and that these procedures are required at the time of cartilage repair. 46 Therefore, our results could be expected to reflect the tissue maturation process observed in daily practice. Finally, we were unable to determine the actual pathology of the changes in T1rho and T2 values. The only way to definitively assess the underlying pathology is to perform a biopsy for histological assessment. However, as previous studies have reported better histological maturation with lower T1rho and T2 values,47 -49 we did not perform this considerably invasive procedure owing to ethical considerations.
In conclusion, the cartilage repair tissue improved morphologically and qualitatively over time up to 24 months after implantation. The arthroscopic assessment showed good or excellent outcomes 12 to 24 months after the implantation, and there was a significant correlation with MOCART 2.0, but no correlation with the T2 and T1rho index between each group of ICRS scores.
Footnotes
Authors’ Note
This study was primarily performed at the Department of Orthopedic Surgery, Graduate School of Medicine, Chiba University.
Acknowledgments and Funding
The author(s) received technical support for using MATLAB from Dr. Obata, who belongs to the Institute for Quantum Medical Science, QST. The author(s) disclosed receipt of the following financial support for the research, authorship, and/or publication of this article: The author(s) received financial support for the research, authorship, and/or publication of this article from ZENKYOREN (National Mutual Insurance Federation of Agricultural Cooperatives).
Declaration of Conflicting Interests
The author(s) declared no potential conflicts of interest with respect to the research, authorship, and/or publication of this article.
Ethical Approval
The institutional review board of Chiba university approved the design and publication of this study.