
Abstract
Objective
In vitro expansion of chondrocytes is required for cartilage tissue engineering and clinical cell-based cartilage repair practices. However, the dedifferentiation of chondrocytes during in vitro expansion continues to be a challenge. This study focuses on identifying a cell culture surface to support chondrocyte expansion with reduced dedifferentiation.
Design
A less adhesive culture surface, non–tissue culture treated surface (NTC), was tested for its suitability for culturing chondrocytes. The cell expansion and the expression of chondrocyte markers were monitored for at least 2 passages on NTC in comparison with conventional tissue culture treated polystyrene surface (TCP). The ability of expanded chondrocytes to form cartilage tissues was evaluated using pellet culturing and subcutaneous implantation in nude mice.
Results
NTC supported bovine chondrocyte proliferation to a clinically relevant expansion requirement within 2 passages. Chondrocyte phenotypes were better maintained when cultured on NTC than on TCP. In vitro pellet culture studies showed that chondrocytes expanded on NTC expressed a higher level of chondrocyte extracellular matrix. Furthermore, the cells expanded on NTC or TCP were implanted subcutaneously as pellets in nude mice for 6 weeks. The recovered pellets showed cartilage-like tissue formation from cells expanded on NTC but not from the cells expanded on TCP.
Conclusions
This study presents an innovative and easy culturing procedure to expand chondrocytes with reduced dedifferentiation. This procedure has potential to be developed to expand chondrocytes in vitro for basic research, tissue engineering, and possibly for clinical applications.
Introduction
Hyaline cartilage is an avascular tissue with very limited self-healing capabilities. 1 To repair cartilage damage caused by injury or disease, several techniques are used individually or in combination: debridement, marrow stimulation techniques, transplantation, and cell-based therapies.2,3 Among these, an autologous chondrocyte implantation (ACI) procedure has been widely used to repair damaged cartilages.4,5 It has achieved a high success rate, especially among young patients. In addition, cartilage repair utilizing chondrocyte-based cartilage tissue engineering has yielded preclinical and clinical successes in recent years. 6 The ACI procedure and tissue engineering applications require a significant number of chondrocytes, which are usually expanded in vitro from the cells isolated from a patient biopsy.5,6 The number of chondrocytes harvested from patients vary depending on the weight of the biopsy. Among 1,000 patients studied, the mean value of biopsy weight was 280 mg with a mean value of 2,600 cells/mg. 7 To meet the cell number requirements for ACI, at least about a 10-fold expansion is required.5,8 For cartilage tissue engineering, an estimated 320-fold of expansion of cells, or even more, is required. 2 However, in vitro expansion of chondrocytes under conventional cell culture conditions is inevitably associated with chondrocyte dedifferentiation. The dedifferentiation of chondrocytes during in vitro expansion is regulated by multiple signaling pathways 9 and is defined as the loss of the chondrocyte phenotypes and the adaption of the fibroblast phenotypes while culturing on tissue culture polystyrene surface (TCP).10-12 The reduced expression of type II collagen and glycosaminoglycan (GAG) is concurrent with the increased expression of type I collagen. 10 The dedifferentiated chondrocytes either lost or showed reduced ability to form cartilage tissue in vivo.13,14 This dedifferentiation phenomenon has also been attributed to some inferior repair outcomes of ACI procedures.4,6 To improve the clinical outcome of ACI, characterized chondrocyte implantation (CCI) was developed to select the population of cells expressing a selection of positive and negative markers to predict the cells’ ability to form hyaline cartilage in vivo.14,15 CCI procedure showed better outcomes in animal models and human patients.13,16 Besides the selection of better quality chondrocytes from expanded chondrocytes, many efforts are also focused on tackling dedifferentiation.17-21 For example, the dedifferentiation phenomenon can be partially rescued by using growth factors or co-culturing with P0 primary chondrocytes or mesenchymal stem cells (MSCs).18,19,21 The use of growth factors to expand chondrocytes imposes regulatory hurdles for clinical application. Co-culturing with P0 cells showed promising results in rescuing the phenotypes of expanded chondrocytes.22,23 The limitation of source for P0 cells makes this approach impractical. However, using the conditioned media from xenogeneic P0 chondrocytes may be a promising alternative. 24 Co-culturing chondrocytes with MSCs has been reported to enhance the chondrogenesis of in vitro expanded chondrocytes. 19 Due to the multipotency of MSC, there is some uncertainty on the fate of MSCs in the co-culture in vitro and in vivo. 2
Bearing all these challenges in mind, we focused our efforts on identifying a culturing substrate to support chondrocyte proliferation yet prevent dedifferentiation. It is known that the adhesion of chondrocytes to their culturing substrates is positively correlated with dedifferentiation. 25 When chondrocytes are cultured in suspension or with little adhesion to culture surface, cells are better able to maintain the chondrocyte phenotype. 26 However, the proliferation of chondrocytes is compromised when cells are cultured with no or low adhesion. For clinical and tissue engineering applications, an estimated 160- to 320-fold amplification should be achieved during in vitro expansion within 4 weeks. 2 It would be a challenge to achieve this clinically relevant expansion by culturing chondrocytes in suspension such as pellet culture or in hydrogels.
In this study, we used non–tissue culture treated polystyrene (NTC) as a culture substrate to expand bovine articular chondrocytes. We demonstrated that bovine articular chondrocytes cultured on NTC maintained higher expression of chondrocyte markers compared with cells cultured on TCP. We achieved over 320-fold amplification of chondrocytes by 2 passages. Culturing the pellets formed from chondrocytes expanded on NTC or TCP showed that NTC pellets expressed higher levels of GAG than TCP pellets. Furthermore, only chondrocytes expanded on NTC formed cartilage-like tissue when subcutaneously implanted in nude mice. In summary, our study provides a simple yet effective culturing system to expand chondrocytes in vitro while limiting their dedifferentiation.
Materials and Methods
Isolation of Bovine Articular Chondrocytes
Bovine articular chondrocytes (BACs) were isolated from calf knee joint articular cartilage as described. 27 Briefly, knee joints of calves (2-3 months old) were obtained on the same day of calf sacrifice from Farm to Pharm, LLC (Warren, NJ), where all animal tissues are USDA (US Department of Agriculture) certified food grade. The articular cartilage tissues were in pristine condition on visual examination. Articular cartilage was then removed with sterile razor blades and minced into small pieces in a sterile biosafety cabinet. Cartilage was washed thoroughly with 1× PBS (phosphate-buffered saline; Life Technologies) before overnight digestion with 1.25 mg/mL Collagenase (Serva NB 4) in a Dulbecco’s modified Eagle medium (DMEM) complete medium (DMEM [Life Technologies] + 10% FBS [fetal bovine serum; Atlanta Biologicals] + 25 µg/mL of gentamicin [Thermo Fisher Scientific]) at 37°C with 5% CO2. The cells were filtered through a 40 μm Sterile Cell strainer (CELLTREAT Scientific) and washed with PBS for 3 times. Primary cells (Passage 0, P0) were counted using hemocytometer after staining with trypan blue (Life Technology). P0 cells were frozen in complete DMEM medium containing 10% DMSO (Sigma-Aldrich) and stored in liquid nitrogen if not used immediately.
Expansion of Chondrocytes
P0 BACs were thawed and number of viable cells were determined using trypan blue staining. A total of 4,000 cells/mL of cells were prepared in growth medium (DMEM complete medium). A total of 0.5 mL of cells were added to each well of 48-well tissue culture polystyrene plate (TCP; Corning Inc.) or the wells of 48-well non–tissue culture plates (NTC; Cyto One Cat# CO7672-7548) at 2000 cells/cm2. The plates were incubated at 37°C with changing of medium every 3 days. After 9 days, cells in the well were trypsinized and counted (P1) using hemocyometer with n ≥ 3 replicates. The fold of expansion (E1) was calculated as the average cell number/well of P1 divided by the average cell number/well of P0 seeded. These P1 cells were diluted and seeded at 2,000 cells/cm2 in NTC or TCP plates and cultured at 37°C. After 10 days, the cells were then trypsinized and counted (P2). The fold of expansion (E2) was calculated as the average cell number/well of P2 divided by the average cell number/well of P1 seeded. The total folds of expansion from P0 to P2 = E1 × E2. 21 This expansion process may be continued to P3 or P4. The Population Doubling Level (PDL) was calculated using the following formula: PDL = Log10(N/N0) × 3.33, where N = number of cells at the time of harvesting and N0 = number of cells at the seeding time.21,28
Immunofluorescent (IF) Staining
BACs at passage P1 were seeded at 5,000 cells/cm2 onto TCP or NTC culture surfaces. After incubation for 5 days, the cells were fixed with 4% paraformaldehyde. The immunofluorescent staining was performed as described. 29 Briefly, the fixed cells were blocked with staining buffer (HBSS containing 5% bovine serum and 1% BSA) for 1 hour. The cells were stained with rabbit anti-FN antibodies (R457) (kindly provided by Dr. Jean Schwarzbauer, Princeton University) at 1:100 and mouse anti-COL2 (ab3092 Abcam, Cambridge, MA) at 1:50 dilution in staining buffer at room temperature for 2 hours. The cells were then stained with goat anti-mouse IgG-AlexaFluor 555 and goat anti-rabbit IgG-AlexaFluor 488 (Thermo Fisher Scientific) at 1:1000 dilutions for 1 hour. Images were captured using a Zeiss D1 AX10 microscope and AxioVision software.
Pellet Culture and Alcian Blue Staining
A total of 2 × 10⁶ chondrocytes were harvested at each passage time and were centrifuged at 132g into a pellet (Allegra 6R centrifuge, GH-3.8, Beckman Coulter).30,31 Each pellet was cultured in complete DMEM medium at 37°C statically for 3 weeks with changing of medium every 3 days. Pellets were embedded in OCT Compound (Tissue-Tek) and stored at −80°C. The embedded pellets were cryosectioned into 10-µm-thick slices using Leica CM1850 cryostat. Each slice was transferred onto Fisherbrand Colorfrost Plus Microscope Slides (Fisher Scientific). The slides were dried at room temperature (RT) for 15 minutes. Drops of Alcian Blue (0.1% Alcian Blue in 0.1 N HCl) solution (Sigma-Aldrich) were added onto the sample directly. The slides were incubated at RT for 20 minutes. The Alcian Blue solution was then removed. The slides were thoroughly washed in PBS until blue dye no longer came off the sample. Samples were visualized with a Zeiss microscope and images were taken using a color camera Axiocam ERc and Zeiss Zen software.
Quantification of Sulfated Glycosaminoglycans (sGAG)
At each passage time point, cells were washed once with 1× PBS. A total of 0.2 mL of Papain extraction buffer (0.1 mg/mL papain [Sigma-Aldrich, from papaya latex] and 0.2 M sodium phosphate buffer, 0.5 M EDTA (pH 7.0), 0.8 mg/mL cysteine HCl) was added to each well. The lysates were transferred to Eppendorf tubes and incubated at 65°C overnight. After extraction, 0.1 mL of extract was transferred to a fresh tube. sGAG levels were measured using Blyscan Assay Kit (Biocolor, UK) following the manufacturer’s instructions. DNA in each extract was quantified using Quant-iT PicoGreen dsDNA Assay Kit (Life Technologies) following the manufacturer’s instruction. sGAG levels were normalized to DNA levels for each sample.
Analysis of Expression of Chondrocyte Markers by qPCR
Chondrocytes cultured on NTC or TCP were lysed in 0.2 mL of RNA lysis buffer (Promega) at each passage time point. Total RNA from these lysates was purified using SV 96 Total RNA Isolation System (Promega) following the manufacture’s manual. RNA concentration and purity was measured using Nanodrop2000 (Thermo Scientific). The cDNA preparation and quantitative polymerase chain reaction (qPCR) were performed as described. 27 The primers used for qPCR were purchased from RT 2 qPCR Primer (Qiagen): Cow GAPDH (PPB00298A), Cow ACAN (PPB00175A), Cow COL1A1 (PPB00932A), and Cow COL2A1 (PPB01756A). Every sample was run in triplicate. After the run was completed, a second derivative analysis was performed using the raw data to determine the mean Cp for each sample. For each gene expression, expression of GAPDH was served as an internal control. The relative mRNA expression was determined by Pfaffl analysis (EΔCp target/EΔCp reference) in which primer efficiency E = 10(−1/slope) and ΔCp = mean Cp of sample − mean Cp of the P0 samples.
Evaluation of the Cartilage Formation in Nude Mice Subcutaneous Implantation Model
P0 BACs were expanded on NTC or TCP for 2 passages. To achieve sufficient numbers of cells (targets were 70-80 millions for each condition), P0 BACs were seeded at 4,000/cm2 for passage 1 and cultured on NTC for 14 days and on TCP for 11 days. The P1 cells were harvested and seeded at about 2,500 cell/cm2 for passage 2 and cultured on NTC for another 15 days and on TCP for 9 days. Times of initial cell seeding for NTC or TCP cultures were staggered and all P2 cells were harvested on the same day. The pellets were prepared by centrifuging 10 × 106 of BAC/tube/pellet at 132g for 5 minutes. Six pellets (for each condition) were prepared and cultured in complete DMEM medium for 3 days. The subcutaneous implantation protocol #94-048 was approved by Rutgers University Institutional Animal Care and Use Committee (IACUC). Seven-week-old female athymic nude (NU/NU) mice were ordered from Charles River Laboratories (Boston, MA). Each mouse received 2 pellets subcutaneously on its back (2 pellets/mouse) under anesthesia (n = 6). At 6-week post implantation, implants were harvested after the mice were euthanized. Absorption of the pellets was observed in some cases. Four pellets of NTC group and 2 pellets of TCP group were explanted.
Histological Analyses
The explants were fixed in 10% buffered formalin for 48 hours. Paraffin-embedded specimens were sectioned at 5 µm. Sections were stained with hematoxylin and eosin (H&E) using standard protocol. The sections were also stained with Safranin O (NovaUltra Safranin O stain kit, IHC World, LLC, Woodstock, MD) following the manufacturer’s protocol.
Statistical Analysis
Each independent experiment contained 3 or more biological repeat samples (n ≥ 3), and data are presented as the mean ± standard deviation. Results shown are a representative of at least 2 independent experiments. All quantitative data sets subjected for ANOVA analysis in this study have passed D’Agostino and Pearson normality test (Prism 7 software). One-way ANOVA with a Tukey’s multiple comparisons test was performed to determine statistical significance (Prism 7 software). Differences were considered significant at a P value of <0.05.
Results
Bovine Articular Chondrocytes Adapted Different Morphology When Cultured on Different Substrates
Bovine articular chondrocytes released from the cartilage were designated as P0 and were cryopreserved in liquid nitrogen if not used immediately. A standard DMEM complete medium (DMEM + 10% FBS) was chosen over the commercially available chondrocyte growth medium to culture BACs for two reasons. First, the in vitro expansion of chondrocytes for clinical ACI procedure utilizes DMEM base medium plus 10% patient’s autologous blood serum.5,8 Second, the commercial chondrocyte growth medium usually contains FBS with multiple additional growth factors. The use of additional exogenous growth factors may require regulatory approval for clinical expansion of chondrocytes.
When cells were cultured on standard cell culture surface (TCP) in DMEM complete medium, cells spread and proliferated ( Fig. 1A and B ). On the other hand, when cells were seeded on NTC surface, cells adhered to the surface with limited spreading and formed many aggregates ( Fig. 1C and D ).
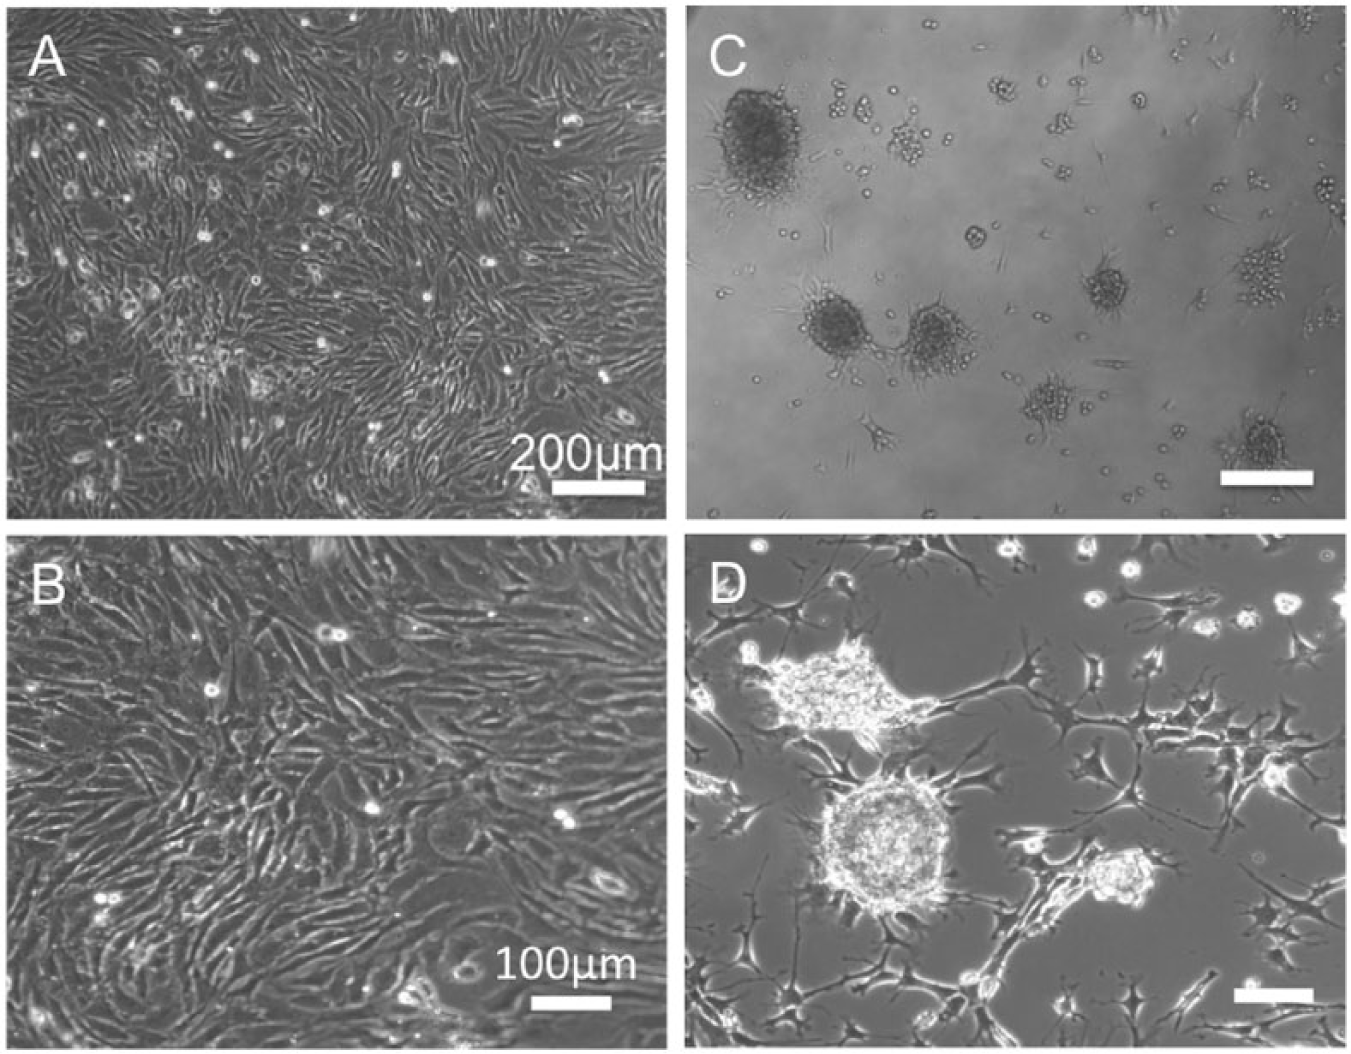
Morphologies of bovine articular chondrocytes (BACs) cultured on TCP or NTC. P0 BACs were seeded onto TCP (
The production of extracellular matrix proteins such as type II collagen (COL2) or fibronectin (FN) in BACs at P1 was evaluated by immunofluorescent staining using anti-bovine COL2 antibody and anti-FN antibodies ( Fig. 2 ). COL2 is a characteristic extracellular protein expressed by chondrocytes. 32 The expression of COL2 was detected predominantly in BACs cultured on NTC, but not in cells cultured on TCP. The expression of FN was detected in cells cultured on both surfaces. This result suggested that BACs maintained the expression of COL2 when cultured on NTC and started to dedifferentiate when on cultured on TCP, even during passage 1.
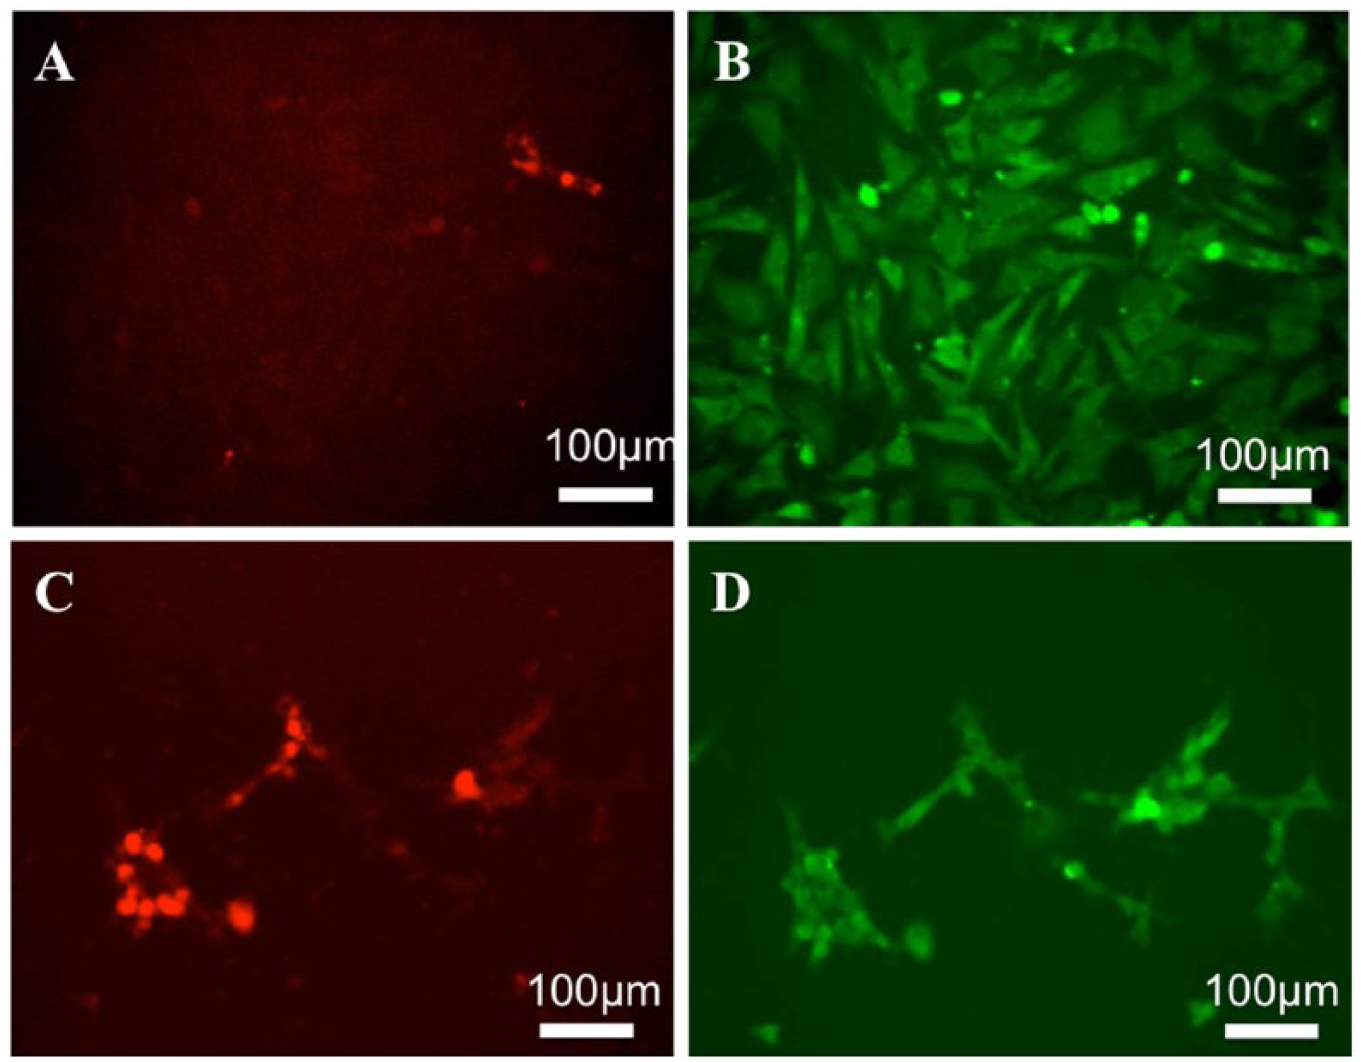
Immunofluorescent staining of BACs cultured on TCP or NTC. BACs at passage P1 were seeded at 5,000 cells/cm2 onto TCP (
Expansion of BACs on NTC Reached Clinical Requirement at Second Passages
To meet the requirement of ACI (or cartilage tissue engineering), an estimated 10 folds (or 320 folds) of expansion of chondrocytes have to be achieved.2,5,8 In order to test if the expansion of BACs on NTC can achieve a 320 times expansion, the BACs at P0 were seeded at 2,000 cell/cm2 on TCP or NTC in DMEM complete medium. In 2 passages, cells on TCP expanded 2,637-fold while BACs on NTC expanded 374-fold ( Table 1 ). The expansion from P0 to P1 and from P1 to P2 remained similar on NTC, but the expansion on TCP was drastically increased from P1 to P2.
Expansion of BACs on TCP and NTC a .
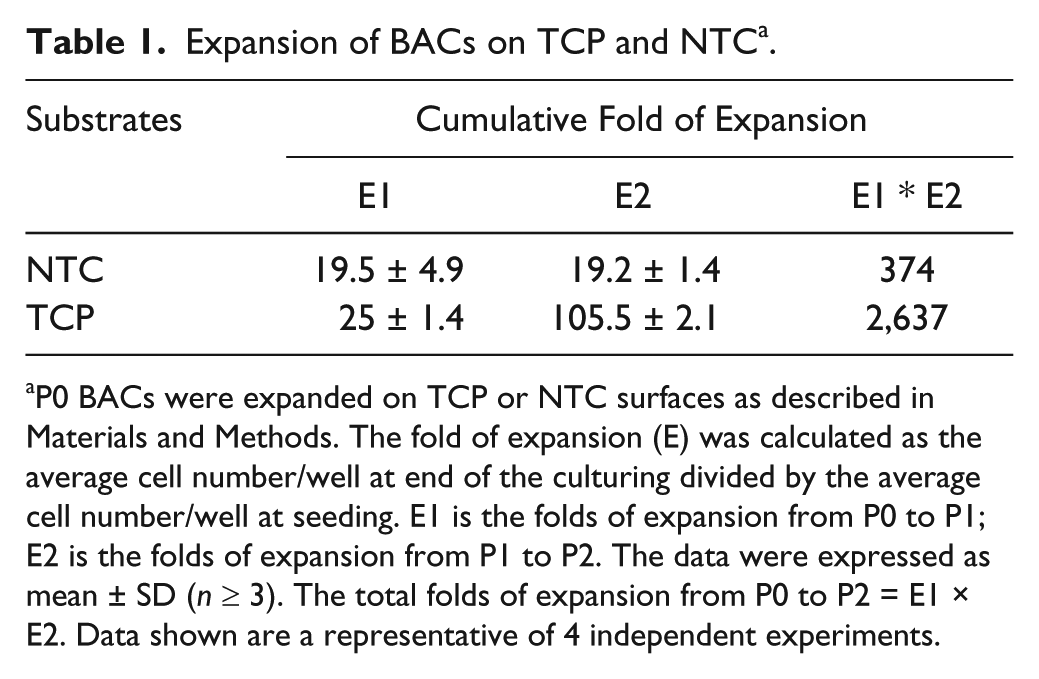
P0 BACs were expanded on TCP or NTC surfaces as described in Materials and Methods. The fold of expansion (E) was calculated as the average cell number/well at end of the culturing divided by the average cell number/well at seeding. E1 is the folds of expansion from P0 to P1; E2 is the folds of expansion from P1 to P2. The data were expressed as mean ± SD (n ≥ 3). The total folds of expansion from P0 to P2 = E1 × E2. Data shown are a representative of 4 independent experiments.
The population doubling level (PDL) reflects a general estimation of a population doubling within a passage. 28 The PDL of each passage was calculated using the following formula: PDL = Log10(N/N0) × 3.33 ( Table 2 ). It is shown that, at passage 1 (P1), cells on TCP or NTC proliferated similarly and doubled 4.7 or 4.3 times, respectively. However, at passage 2, cells on TCP proliferated a lot faster than cells on NTC. During the same period of culturing time, cells on TCP doubled 6.7 times while cells on NTC doubled 4.3 times. It has been reported that the dedifferentiation of chondrocytes is positively correlated with the proliferation of cells. 25 Our results suggested that the cells cultured on TCP have undergone dedifferentiation significantly, especially from P1 to P2.
The Average Population of Doubling Level (PDL) of Each Culture Condition a .
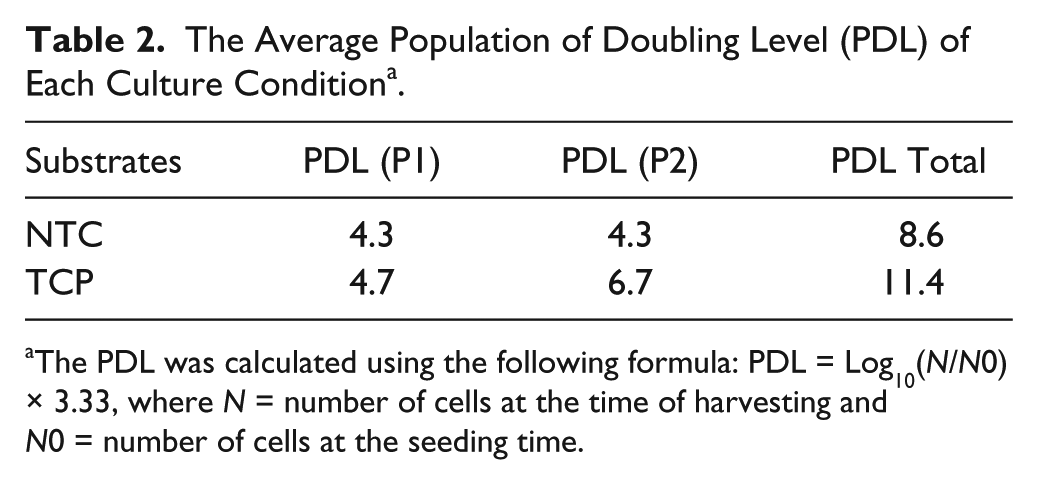
The PDL was calculated using the following formula: PDL = Log10(N/N0) × 3.33, where N = number of cells at the time of harvesting and N0 = number of cells at the seeding time.
The Dedifferentiation of BACs Was Reduced When Cultured on NTC
Dedifferentiation is characterized as morphologic changes from chondrocytes to fibroblasts, increased expression fibroblast marker (type I collagen), and decreased expression of chondrocyte markers (type II collagen and aggrecan). To further characterize the dedifferentiation of BACs during the expansion, the expression of fibroblast and chondrocyte markers was evaluated. Shown in Figure 3 , the expression of the type I collagen gene (COL1A) was significantly increased from passage 1 to passage 2. At P2, the expression of COL1A in cells cultured on TCP was significantly higher than in cells cultured on NTC ( Fig. 3A ). Cells on NTC showed higher expression of the aggrecan gene (ACAN) when compared with cells on TCP ( Fig. 3B ). At P1, there was significant decrease in the expression of COL2A in cells cultured on TCP. At P2, the expression of COL2A decreased in cells cultured either on NTC or TCP compared with P0 cells. However, the expression of COL2A was significantly reduced in cells cultured on TCP compared with cells cultured on NTC ( Fig. 3C ). The preservation of chondrocyte phenotype is often expressed as the ratio of COL2A/COL1A. Comparing the relative gene expressions, at P1, the COL2A/COL1A ratio of cells on NTC was 7-fold higher than that of cells on TCP. At P2, the COL2A/COL1A ratio of cells on NTC was 10-fold higher than that of cells on TCP. These ratio differences demonstrated a significant dedifferentiation in cells cultured on TCP.
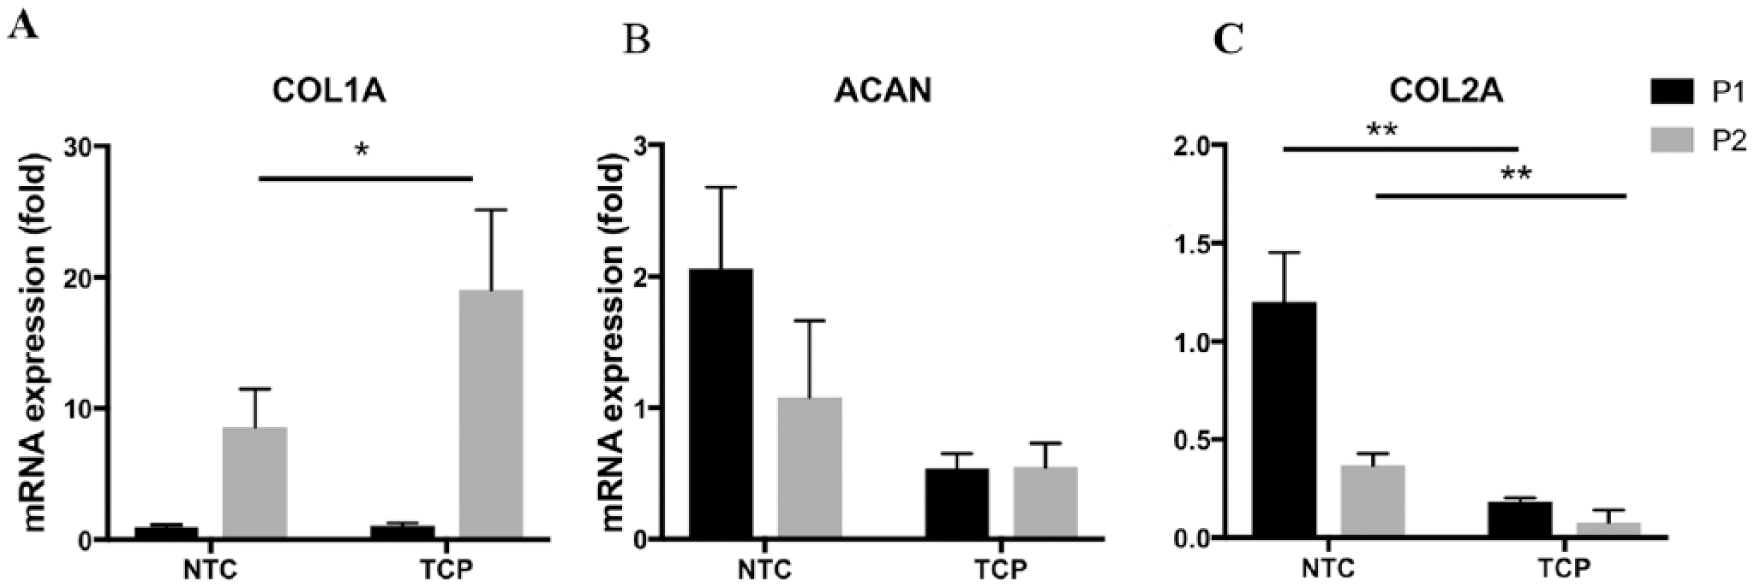
The expression of chondrocyte marker genes in expanded BACs. P0 BACs were expanded on NTC or TCP. Cells were lyzed at P1 and P2. Total RNA was extracted from each sample and gene expression of type I collagen (COL1A) (
In addition, the production of sulfated GAG (sGAG) was quantified in cells cultured on NTC or TCP. At each passage, BACs cultured on NTC produced significantly higher sGAG compared with cells cultured on TCP ( Fig. 4 ). The production of sGAG in BACs was decreased from passage 1 to passage 2 on both culturing surfaces. However, the decrease in the production of sGAG at P2 was even more pronounced in cells cultured on TCP. Together with the gene expression profiles, these results suggested that dedifferentiation occurred during the expansion of BACs on NTC or TCP. But the dedifferentiation of BACs on NTC was significantly reduced compared with cells on TCP.
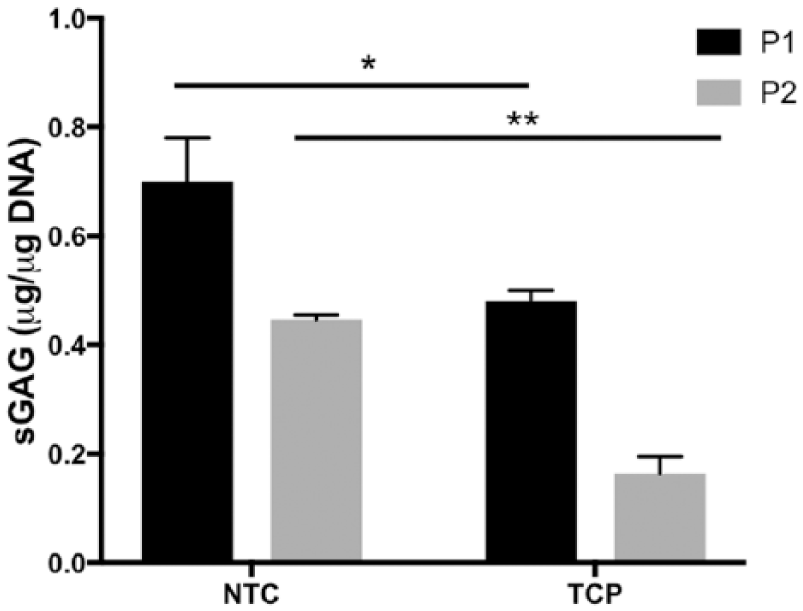
Quantification of sGAG in BACs cultured on TCP or NTC. BACs cultured on TCP or NTC were lysed at passage 1 and passage 2. The sulfated GAG was extracted and quantified as described in Materials and Methods. Data are presented as mean ± SD (n = 3). *P < 0.05, **P < 0.01.
BAC Expanded on NTC Maintained Better Chondrocyte Phenotypes in Pellet Cultures
It has been reported that pellet culture could reverse the dedifferentiation of chondrocytes. 26 We analyzed the phenotypes of pellets after culturing for 3 weeks. The pellets formed from expanded cells at different passages and different surfaces were fixed, cryosectioned, and stained with Alcian Blue ( Fig. 5 ). The blue staining represents the presence of GAG. The pellets formed from P1 cells expanded on NTC showed higher level of GAG than the pellets formed from P1 cells expanded on TCP ( Fig. 5B and D ). The pellets of P1 cells on NTC had similar amount of GAG compared with the pellets of P0 cells. This observation suggested that pellet culturing can restore the ability of cells cultured for one passage on NTC to produce GAG at similar levels as P0 cells. On the other hand, the loss of the production of GAG in BACs expanded on TCP was not reversible by pellet culturing. The same trend continued in P2 cells. Even at P2, BACs expanded on NTC produced significant amount of GAG in the pellets ( Fig. 5C ). BACs expanded on TCP produced barely detectable GAG in the pellets. This pellet culture study demonstrated that the dedifferentiation of BACs on TCP was not reversible.
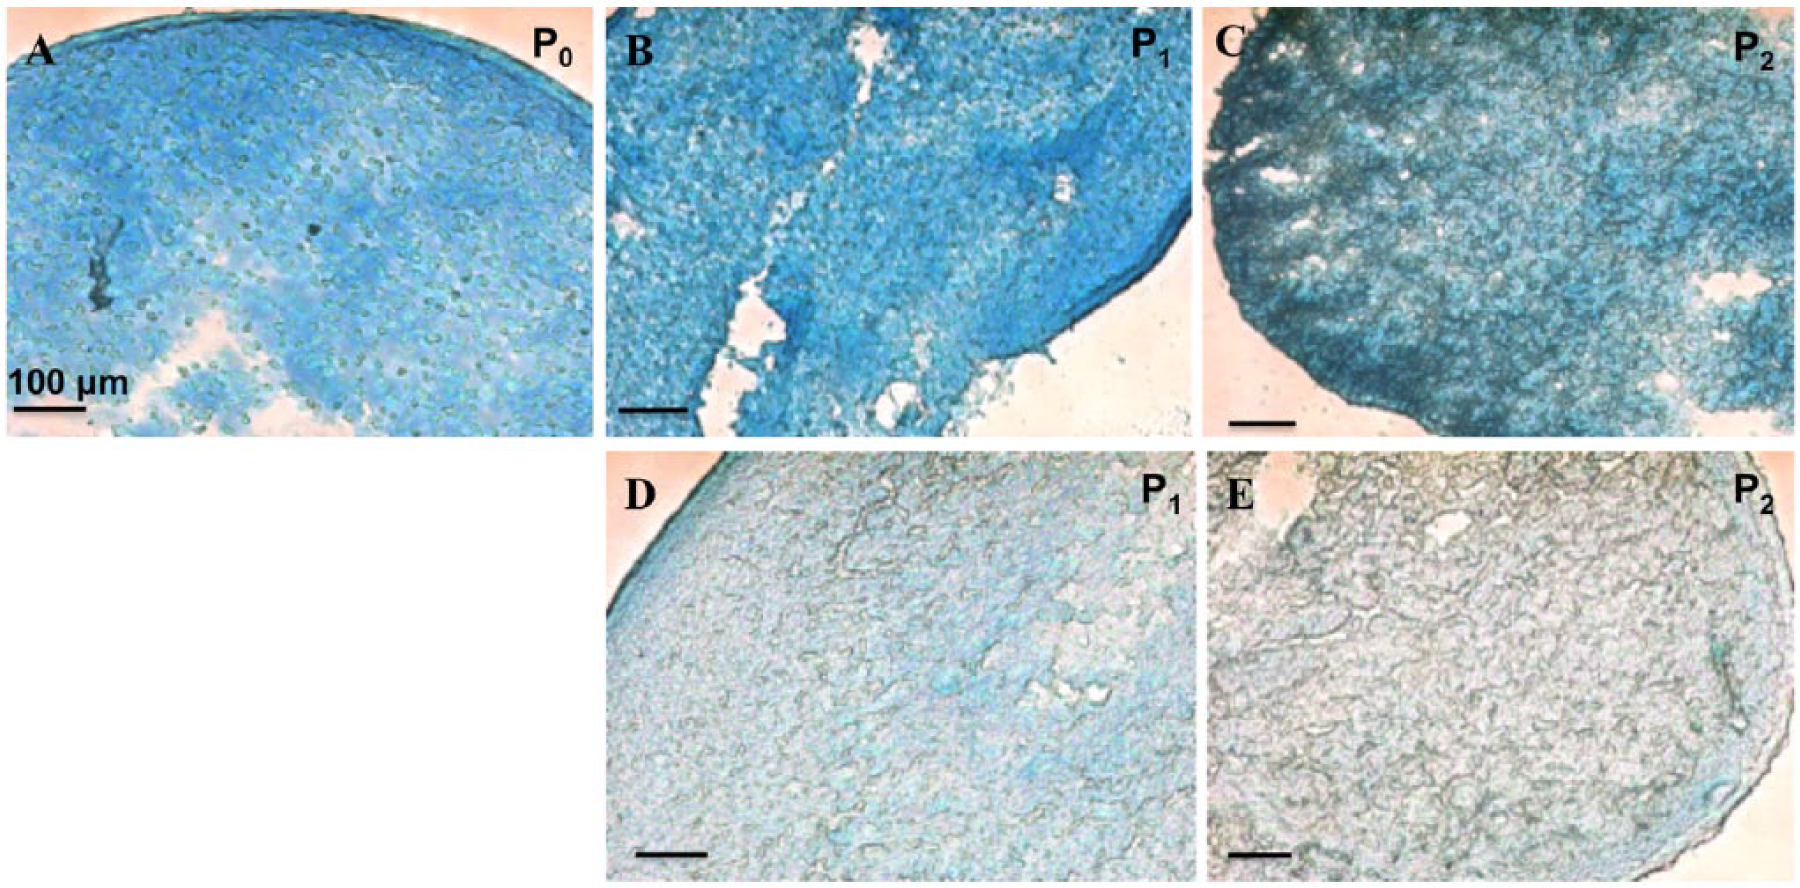
Alcian blue staining of pellets cultured from BACs expanded on TCP or NTC. Pellets from BACs at P0 (
Cartilage Formation in Nude Mice
In order to evaluate the cartilage formation potential of in vitro expanded BAC, a nude mice subcutaneous implantation model was used with modifications. 21 BACs were expanded on NTC or TCP for 2 passages, taking 29 days on NTC and 20 days on TCP to reach the target number of cells. BAC pellets were formed from cells expanded on TCP or NTC. After culturing for 3 days, the pellets were subcutaneously implanted to nude mice. The pellets were explanted 6 weeks following implantation. However, not all implanted pellets were recovered. The pellets generally became smaller. It became difficult to differentiate the implants from other tissue structures. Four explants (out of 6 implanted pellets) from the NTC group and 2 explants from the TCP group were recovered. This observation suggested that resorption of the pellets had occurred, especially with pellets in TCP group. The explants were analyzed by H&E staining and Safranin O staining ( Fig. 6 and Suppl. Fig. 1). At week 6, no mature cartilage tissues were identified in all the explants. However, obvious chondrocytes and formation of chondrocyte lacuna were observed in the explants of the NTC group ( Fig. 6A ) but not in the explants of the TCP group ( Fig. 6B ). With Safranin O staining, no explant showed the staining of mature cartilage matrix (Suppl. Fig. 1). The explants of the NTC group showed yellow staining of the matrix suggesting that deposition of cartilage matrix (e.g., GAG) by the cells ( Fig. 6C ). On the other hand, there was no yellow-orange staining in the explants of TCP group ( Fig. 6D ).
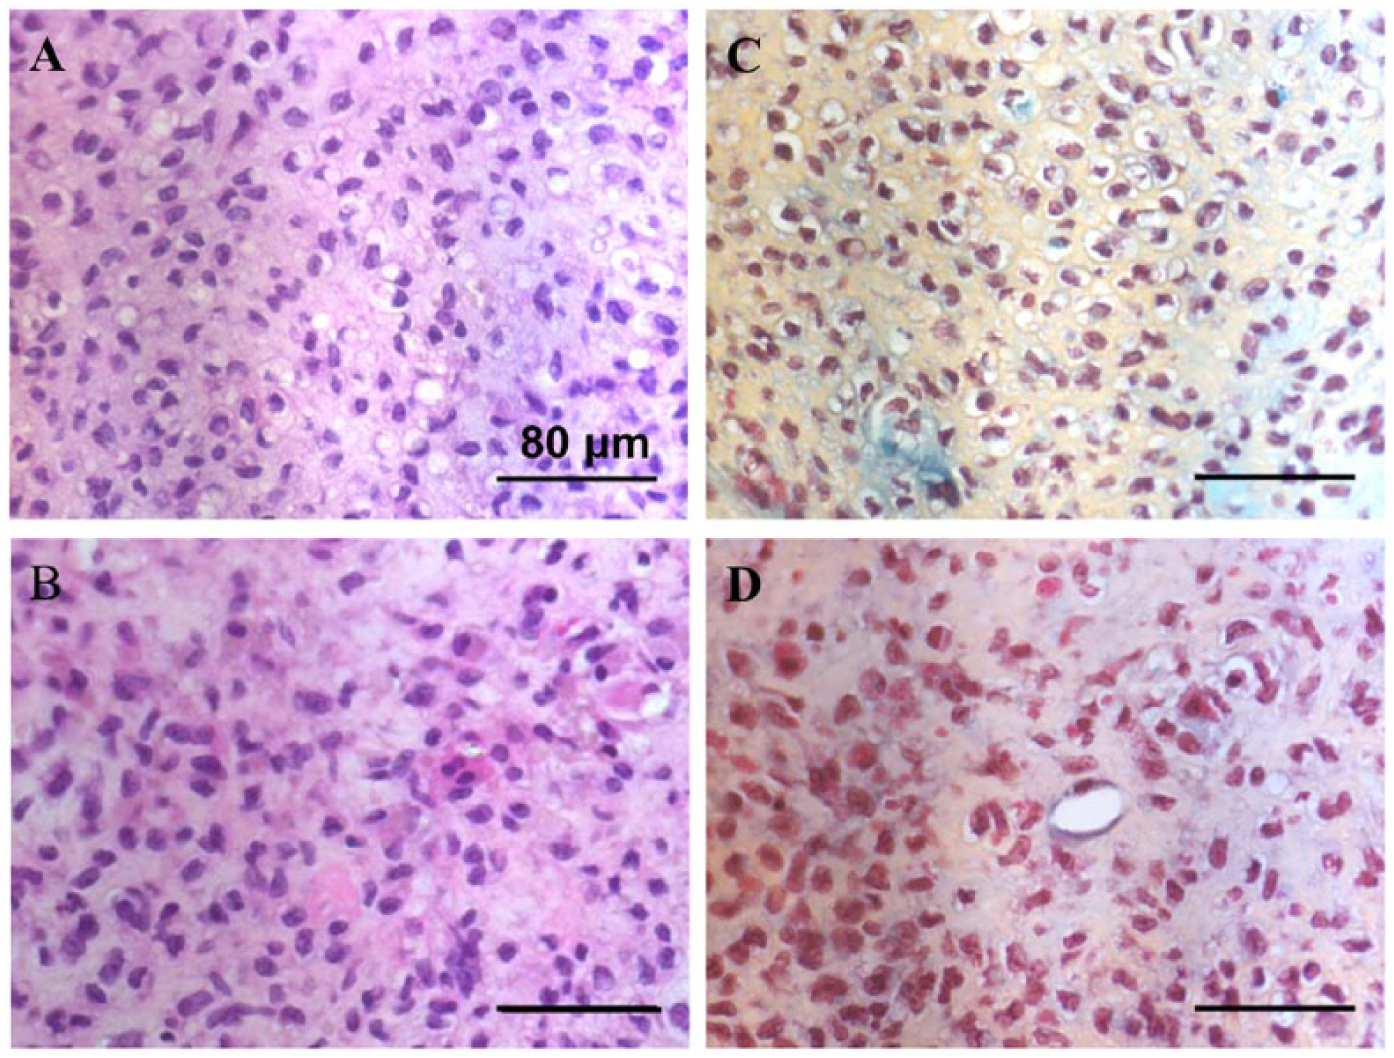
Histology analysis of the explants of BACs expanded on TCP or NTC. After 6 weeks of subcutaneous implantation, the explants from NTC group (
Discussion
The dedifferentiation of chondrocytes during in vitro expansion compromises the quality of chondrocytes for clinical ACI procedures and cartilage tissue engineering applications. 6 In this study, we presented a simple and effective way of expanding chondrocytes in vitro with reduced dedifferentiation.
Conventional cell culture surfaces (e.g., TCP) are designed to promote cell adhesion. Chondrocytes adhere to TCP and proliferate. The dedifferentiation of chondrocytes culturing on TCP has been well documented. 2 Many approaches have been developed to counteract the dedifferentiation: (1) The use of growth factors to promote the proliferation or repress the expression of dedifferentiation markers such as type I collagen is an approach used in many research projects. 18 However, the involvement of growth factors made it costly and difficult to obtain Food and Drug Administration approval for clinical use. (2) Culturing chondrocytes in a 3D culture such as soft gel or pellet to preserve the chondrocyte phenotypes. 26 However, the proliferation of chondrocytes in 3D culture is significantly reduced. The time takes to expand chondrocytes to a clinically sufficient quantity is too extensive to be practical. (3) Co-culturing chondrocytes with P0 chondrocytes or MSCs were reported to reduce the dedifferentiation of chondrocytes during in vitro expansion.19,21,24 However, the source limitation of P0 cells and multipotency of MSCs means these approaches are still far from being developed into clinical practices.
In this study, we chose a polystyrene surface (NTC) with a reduced cell adhesion compared to plasma treated polystyrene (TCP) to culture BACs. The culture medium used in this study is DMEM medium containing 10% FBS without additional growth factors. We showed that BACs cultured on NTC showed reduced proliferation but still reached clinically relevant expansion (more than 320-fold) with 2 passages.
The BACs expanded on TCP showed a reduced expression of type II collagen or sGAG compared to cells expanded on NTC, which suggests more pronounced dedifferentiation in cells on TCP. The observed reduced dedifferentiation may be attributed to the slower proliferation rate of cells on NTC at passage 2. However, the delayed growth of cells on NTC cannot be solely responsible for the reduced dedifferentiation. When comparing BAC cells expanded on NTC (P2) with cells expanded on TCP (P1), cells have undergone more proliferation/doublings on NTC (PDL = 8.6), but the expressions of type II collagen mRNA was still significantly higher than that in cells cultured on TCP (PDL = 4.7; Fig. 3C ). The level of sGAG of cells on NTC (PDL = 8.6) was comparable to the cells on TCP (PDL = 4.7; Fig. 4 ). More strikingly, the P2 pellets from cells cultured on NTC produced more GAG-rich matrix than P1 pellets of cells cultured on TCP ( Fig. 5C and D ). These observations indicate that even by the end of passage 1, cells on TCP have undergone more dedifferentiation, which in turn promoted more cell proliferation on TCP during passage 2.
Pellet culturing has been reported to reverse the dedifferentiation of chondrocytes. 26 In this study, the dedifferentiation of BACs cultured on NTC seemed to be reversible by pellet culturing. On the other hand, the dedifferentiation of BACs cultured on TCP was not reversed by pellet culturing. This result suggests that BACs expanded on TCP have dedifferentiated more than the cells on NTC.
The ability to form cartilage tissue by the expanded BACs was evaluated by subcutaneous implantation in nude mice. To minimize the effect of different PDLs, the BACs were expanded on NTC or TCP to reach similar number of cells in significantly different culturing times. In this in vivo study, we did not observe mature cartilage tissue formation from the expanded BACs. It has been reported that in vitro expanded auricular chondrocytes formed cartilage tissue in a similar nude mice model. 21 The difference between the 2 studies is that the auricular chondrocytes were seeded and cultured in a 3D collagen scaffold for 2 weeks before implantation. This matrix-assisted implantation may have improved the cartilage tissue formation in the reported study.21,33 In a different model, the intramuscular injection of 5 × 10⁶ un-dedifferentiated chondrocytes in 50 µL of PBS in nude mice also led to the formation of cartilage-like tissues within the muscle tissues. 14 Compared with the injection study, the pellet in our study, which was made of 10 × 106 cells in about 10 µL volume, may be too dense for cells to access for nutrient or produce a dense extracellular matrix. Therefore, there are potential modifications to improve our animal model. Nevertheless, we did observe an obvious difference in the explants of NTC and TCP groups. Resorptions of the pellets in the mice were more pronounced with TCP group. While the explants from TCP group showed only noncharacteristic aggregation of cells, the explants from NTC group showed the formation of immature cartilage tissues, formation of lacuna and deposition of GAG-rich matrix.
In summary, we innovatively utilized an existing culture surface to expand articular chondrocytes in vitro and demonstrated its efficacy in supporting chondrocyte proliferation and preventing dedifferentiation. This simple in vitro culturing method for the expansion of chondrocytes warrants further evaluation and has the potential to be developed into a practical approach for ACI procedures and cartilage tissue engineering applications.
Footnotes
Acknowledgments and Funding
We would like to thank Dr. Cathryn Sundback (Massachusetts General Hospital) for her insightful discussions and Dr. Jean Schwarzbauer (Princeton University) for providing us the antibody against fibronectin. We also thank Stephanie Fung and Anya Singh-Varma (Rutgers University) for their technical help. This study was supported by the New Jersey Center for Biomaterials. Tyler Hoffman acknowledges the support from the Aresty Research Center at Rutgers University.
Declaration of Conflicting Interests
The author(s) declared no potential conflicts of interest with respect to the research, authorship, and/or publication of this article.
Ethics Approval
Ethical approval for this study was obtained from Rutgers University Institutional Animal Care and Use Committee (IACUC) (Protocol #94-048).
Animal Welfare
The present study followed institutional guidelines for humane animal treatment and complied with relevant legislation.
Supplemental Material
The Supplementary figure for this article is available online.
References
Supplementary Material
Please find the following supplemental material available below.
For Open Access articles published under a Creative Commons License, all supplemental material carries the same license as the article it is associated with.
For non-Open Access articles published, all supplemental material carries a non-exclusive license, and permission requests for re-use of supplemental material or any part of supplemental material shall be sent directly to the copyright owner as specified in the copyright notice associated with the article.