
Abstract
Objective
Glucose concentrations used in current cell culture methods are a significant departure from physiological glucose levels. The study focuses on comparing the effects of glucose concentrations on primary human progenitors (connective tissue progenitors [CTPs]) used for cartilage repair.
Design
Cartilage- (Outerbridge grade 1, 2, 3; superficial and deep zone cartilage), infrapatellar fatpad-, synovium-, and periosteum-derived cells were obtained from 63 patients undergoing total knee arthroplasty and cultured simultaneously in fresh chondrogenic media containing 25 mM glucose (HGL) or 5 mM glucose (NGL) for pairwise comparison. Automated ASTM-based quantitative image analysis was used to determine colony-forming efficiency (CFE), effective proliferation rates (EPR), and sulfated-proteoglycan (GAG-ECM) staining of the CTPs across tissue sources.
Results
HGL resulted in increased cell cultures with CFE = 0 compared with NGL in all tissue sources (P = 0.049). The CFE in NGL was higher than HGL for superficial cartilage (P < 0.001), and contrary for synovium-derived CTPs (P = 0.046) when CFE > 0. EPR of the CTPs did not differ between the media in the 6-day assay time period (P = 0.082). The GAG-ECM area of the CTPs and their progeny was increased in presence of HGL (P = 0.027).
Conclusion
Glucose concentration is critical to progenitor’s physiology and should be taken into account in the setting of protocols for clinical or in vitro cell expansion strategies.
Introduction
Successful cartilage regeneration strategies require rational selection of cell source, and cell culturing strategies. Adult connective tissues used as the cell source materials contain a rare population of stem and progenitor cells (0.0001% to 1% of total cells)1-5 that have the capacity to proliferate and differentiate to form one or more connective tissue phenotypes and play an important role in tissue homeostasis and repair.6-8 These rare population of tissue-specific stem and progenitor cells that represent the native in vivo cell phenotypes are defined as connective tissue progenitors (CTPs).1-4
The colony-forming unit (CFU) assay is a functional in vitro assay, which is most-widely used to measure the prevalence, function, and potency of the CTPs, thereby helping with prediction of the therapeutically functional stem and progenitor cells present in a given tissue source or cell product.4,9-12 We, along with several other groups have documented that these stem and progenitors are heterogeneous population of cells possessing varying biological potential.13,14
In order to characterize these rare heterogeneous CTP populations, they are isolated from their in vivo environment by mechanical or enzymatic degradation and cultured in vitro in defined media conditions and environment that most closely mimic the in vivo conditions. Several in vitro parameters can influence stem and progenitor’s performance and ultimately the cellular therapy outcome or cell product quality. These include tissue process parameters like handling, harvest and digestion techniques, seeding density, cell culture operating conditions (culture plates, O2, CO2, humidity, etc.), media recipes, and finally the assays used for characterization and quantification.15-22 Thus it becomes essential that the in vitro parameters are assessed and optimized appropriately before proceeding with data collection and applications. 23
Glucose metabolism is a fundamental biochemical process that ensures a constant supply of energy to living cells. The glucose concentration in the normal human knee joint is approximately the same as that of the blood, which is between 3 and 5 mM (54-90 mg/dL).24-26 When performing in vitro cell cultures, glucose is the major energy source and is necessary for cells to maintain homeostasis, produce energy, and synthesize extracellular matrix molecules.
Current literature provides little evidence in terms of effects of glucose concentration in media recipes on stem and progenitor cells. There are 2 key reasons to understand the effect of glucose on stem and progenitor cells. First, there is growing evidence indicating that glucose imbalance in the body caused by hyperglycemia, diabetes mellitus, dyslipidemia, hypertension, or metabolic syndrome, alters normal cell function, leading to many musculoskeletal disorders and tissue damage, including osteoarthritis (OA).9,27-36 Studies have reported association between health of the cartilage and glucose imbalance, independent of age, gender, and body mass index.37-40 Although the relationships between hyperglycemia and its complications in the body are not fully understood, one of the widely studied evidence suggests hyperglycemia-induced overproduction of reactive oxygen species (ROS) by cells. ROS can lead to production of cytokines (interleukin-1β [IL-1β]) and transcription factors (nuclear factor-κB [NF-κB]), which give rise to catabolic processes leading to cell degradation and apoptosis.41-44 In addition to understanding the pathways that contribute to cell damage in general, there is a need to better understand how the quantity and quality of the native tissue–resident stem and progenitor cells in and around the knee region get altered when exposed to diabetic levels of glucose concentration.
Second, cellular therapy holds promise for numerous human diseases. However, considering the low percent of CTPs in native human tissue sources, generation of the vast number of cells required for regenerative and therapeutic purposes rely on in vitro cell expansion procedures. Despite knowing the fact that high glucose levels have potential detrimental effect on the cells in our body, in vitro cell culture techniques continue to use media recipes with high glucose concentrations (17 or 25 mM). The most widely stem cell culture basal media’s like Dulbecco’s Modified Eagle Medium (DMEM-regular) and DMEM-F12 contain 450 mg/dL (25 mM) and 315 mg/dL (17.5 mM) glucose concentrations, respectively. 45 These glucose concentrations are at least 3- to 5-fold increased from normal physiological levels in humans, and are more representative of extreme hyperglycemia.46,47 Several cellular therapy clinical trials for cartilage repair have reported usage of high glucose containing regular DMEM and DMEM/F-12 media’s to generate 1 million to 100 million cells from various sources for injecting into humans.48-54 Thus, questioning the quality and biological performance of the cells cultured and injected. In addition to several other factors that could potentially influence clinical efficacy of the stem cell treatment, glucose concentration in the media used for in vitro culture of the cells can be yet another factor. In contrast to others, effect of glucose concentration on stem and progenitor cells can be answered by a systematic study.
Thus, the goal of this study is to determine the short-term effect of high glucose level (HGL, 25mM) and normal glucose level (NGL, 5mM) containing chondrogenic media on native tissue-derived stem and progenitor cells used for cartilage cellular therapy, including cartilage (superficial zone cartilage, deep zone cartilage, Outerbridge grade 1-2, Outerbridge grade 3-4), synovium, infrapatellar fat pad, and periosteum, with regard to (a) colony-forming efficiency (CFE), (b) effective proliferation rate (EPR), and (c) extracellular matrix production as measured by surrogate marker of sulfated glycosaminoglycans (ECM-GAGs).
Material and Methods
This study was approved by the Institutional Review Board committee of the Cleveland Clinic (Protocol: 13641). Sixty-three patients with varus idiopathic OA knees undergoing total knee arthroplasty (TKA) were recruited (mean age 62.1 years, range 37-82 years; mean body mass index 30.2 kg/m2, range 19-51.4 kg/m2; male = 29, female = 34). Inclusion criteria included a diagnosis of idiopathic OA with radiographs exhibiting a relatively spared lateral compartment (>2 mm joint space width in the lateral compartment assessed in preoperative weightbearing anterior-posterior (AP) radiographs taken in full extension and 30° of fixed flexion). Therefore, this cohort consisted of patients with primarily medial compartment and/or patellofemoral disease. Fasting glucose and hemoglobin A1C (HbA1C) levels for all the TKA patients were <7. Patients were excluded if they had secondary arthritis related to systemic inflammatory arthritis (e.g., rheumatoid arthritis, psoriatic arthritis), current or previous treatment with systemic glucocorticoids or osteotropic medication (e.g., bisphosphonates, known or suspected infection, osteonecrosis, or neoplasm).
Human Tissue Procurement
During TKA, the lateral femoral condyle (LFC) and medial femoral condyle (MFC) were harvested after the distal femoral cut was performed. Outerbridge grade 1-2 cartilage (grade 1: intact surface, and grade 2: minimal fibrillation—G1-2) was obtained from LFC and Outerbridge grade 3 cartilage (grade 3: fissures to subchondral bone—G3) was obtained from MFC.2,55 From G1-2 cartilage, superficial zone (Csp; includes the top 500 ± 100 µm thickness cartilage) and the deep zone cartilage (Cdp; includes the remaining cartilage till the calcified zone) were separately assessed.
During TKA, 0.5 to 1.5 cm3 of synovial membrane (SYN) was harvested from the medial suprapatellar area, assuring that fat tissue was not present. Approximately 2.5 cm3 of fat was harvested from the infrapatellar fat pad (IPFP) after removal of overlying synovium. Then, 0.5 to 1.5 cm3 of periosteum (PERI) was harvested from the anterior femoral region, proximal to the trochlear grove. 1
All the aforementioned tissues were transported in Dulbecco’s Modified Eagle Medium (DMEM) with 1% penicillin/streptomycin and 5mM glucose from operating room (OR) to the lab for processing. All tissues were promptly processed by the same investigator (VPM) to ensure consistency.
Primary Cell Culture
Wet weights of G1-2 cartilage, G3 cartilage, Csp, Cdp, IPFP, SYN, and PERI tissues were measured and enzymatically digested to isolate cells. Succinctly, (a) freshly prepared collagenase type II (Worthington, Lakewood, NJ) and dispase (Sigma, St. Louis, MO) at a concentration of 6000 and 3 U/mL, respectively, were used to isolate cells from diced cartilage, by incubation in a water bath at 37°C for 3 hours 2 ; (b) a combination of freshly prepared collagenase type-I (111 U/mL) (Worthington, Lakewood, NJ) and dispase (24 U/ml) (Sigma, St. Louis, MO) was used to isolate cells from minced IPFP, SYN, and PERI, with incubation at 37°C for 2 hours in a water bath. 1 Postdigestion, the solution was passed through 70 µm cell strainer (Corning, NY), centrifuged at 240 × g for 10 minutes, and resuspended in media.
Cell Culture
Cells from each of the tissue source were cultured simultaneously in fresh chondrogenic media containing 25 mM glucose (HGL) or 5 mM glucose (NGL) for pairwise comparison. 2
Cells from all tissues were plated at a density of 100,000 cells/well (24,000 cells/cm2) as mentioned in our prior studies.1,56,57 Primary cell cultures were incubated at 37°C, 98% humidity, 21%O2, and 5%CO2, with media change every 48 hours. On day 6, cultures were harvested and fixed using acetone/methanol (1:1). The fixed culture slides were stained for nuclei with bis-benzimide (10 µg/mL), and for glycosaminoglycan-rich extracellular matrix (GAG-ECM) with acridine orange (AO).
Automated Large Field of View Imaging
All the stained Lab-Tek slides were digitally imaged using a Leica DM6000B microscope (Leica Microsystems, Wetzlar, Germany) with a 5× objective (pixel resolution: 1.49microns/pixel) equipped with a H101ANN1 Prior motorized stage, PL200 Prior automated slide loader (Prior Scientific Inc., Rockland, MA) and QICAM camera (QImaging, Surrey BC, CA). The entire Lab-Tek chamber was imaged under 2 fluorescent channels for image analysis: cell nuclei using bis-benzimide (excitation 360 nm; emission 460 nm) and GAG-ECM using AO (excitation 490 nm; emission 525 nm).
Colony Formation Analysis
Automated quantitative CFU analysis was performed using Colonyze image analysis software to assess CTPs derived from all the tissue sources using previously stated protocols.1,2 Using Colonyze, bis-benzimide images were processed to measure the total number of colonies (used to determine CFE) and individual colony metrics—number of cells/colony (used to determine EPR); AO staining area per cell assessed GAG-ECM levels. Standardized imaging parameters and analyses were used for all samples.
CFE was determined as percentage of colonies formed to the number of cells seeded. EPR was calculated as the ratio of log2(cells/colony) and days of culture.
Statistical Analysis
The effect of glucose concentration (25 vs. 5 mM) on the progenitor cells derived from each of the tissue source was compared pairwise to measure three outcome variables: CFE, EPR, and AO area/cells, after accounting for differences due to cell source. For the pairwise comparison, we had total of 88 samples for G3 cartilage, 80 samples for G1-2 cartilage, 104 samples for Cdp, 114 samples for Csp, 192 samples for IPFP, 159 samples for PERI, and 202 samples for SYN.
Because of the large number of zero values for the 3 outcome variables, we first used logistic regression to compare the frequency of zero values between the 2 treatment groups (HGL vs. NGL). In these models, the dependent variable was the presence/absence of a zero value for one of the outcome variables (separate models were built for each outcome) and the independent variables were treatment, cell source, and their 2-way interaction. Generalized estimating equations (GEEs) were used to account for the clustered nature of the data (i.e., multiple observations per patient). A significance level of 0.05 was used to assess the interaction term. If the interaction term was significant, then the treatment effect was tested for each cell source using logistic regression; Holm’s method was used to control the familywise type I error rate. If the interaction term was not significant, then it was removed from the model and the main effect of treatment was assessed at the 0.05 level.
Similarly, for the subgroup of patients with non-zero values for the outcome variables, a generalized linear model was built where the dependent variable was the magnitude of the outcome variable (a log transformation was used for CFE and AO area/cells) and the independent variables were treatment, cell source, and their 2-way interaction.
Results
Colony-Forming Efficiency
Among samples where CFE = 0 (15.0% of samples treated with HGL, compared with 10.4% treated with NGL media), the 2-way interaction of treatment (HGL or NGL) and cell source is not statistically significant (P = 0.279). The treatment effect was significantly different (P = 0.049), suggesting a higher frequency of cases with CFE = 0 in the HGL than NGL group ( Fig. 1A ). Cell source was also significant in the model (P < 0.001), suggesting a higher frequency of CFE = 0 cases from the Csp, Cdp, G1-2, G3, and PERI sources compared with IPFP and SYN ( Fig. 1B ).
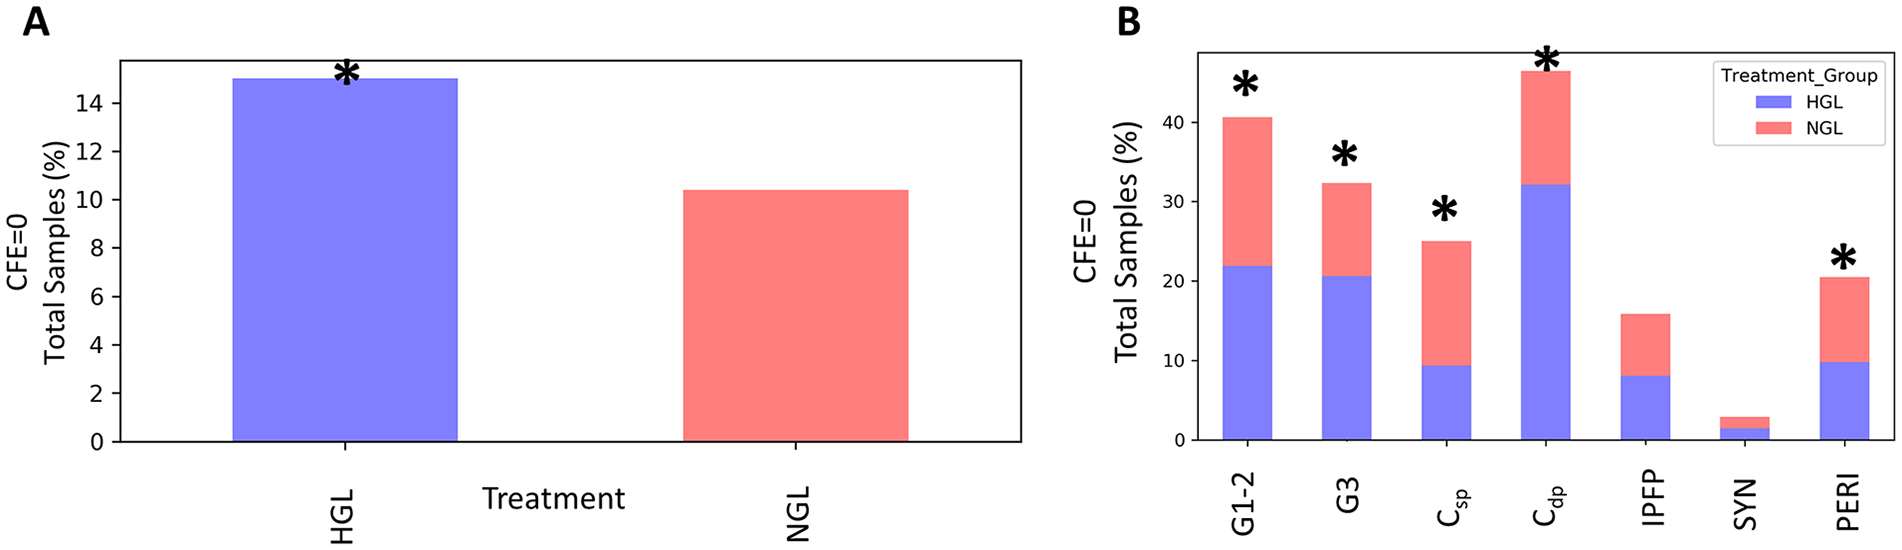
Effect of glucose concentration on colony-forming efficiency (CFE = 0). (
It should be noted that, by definition, if CFE = 0, that is, no colonies are formed, then EPR and AO area/cell are zero, since both these metrics are colony-based metrics. The differences noted above for CFE were thus true for EPR and AO area/cell as well.
Among samples where the CFE >0 (85% of samples treated with HGL, compared with 89.6% treated with NGL media), there was a statistically significant 2-way interaction of treatment and cell source (P < 0.001), suggesting that differences between the 2 treatments do differ by cell source ( Fig. 2A ). Specifically, for Csp-derived cells, the CFE in NGL (median 0.13, interquartile range [IQR] 0.28) was significantly higher than HGL (median 0.009, IQR 0.04) (adjusted P < 0.001), whereas for SYN, the CFE in NGL (median 0.03, IQR 0.093) was significantly lower than HGL (median 0.04, IQR 0.14) (adjusted P = 0.046) ( Fig. 2B ). The differences in HGL and NGL media were not significant for G3 cartilage (adjusted P = 0.920), Cdp (adjusted P = 0.360), G1-2 (adjusted P = 0.351), IPFP (adjusted P = 0.920), and PERI (adjusted P = 0.155) ( Table 1 ).
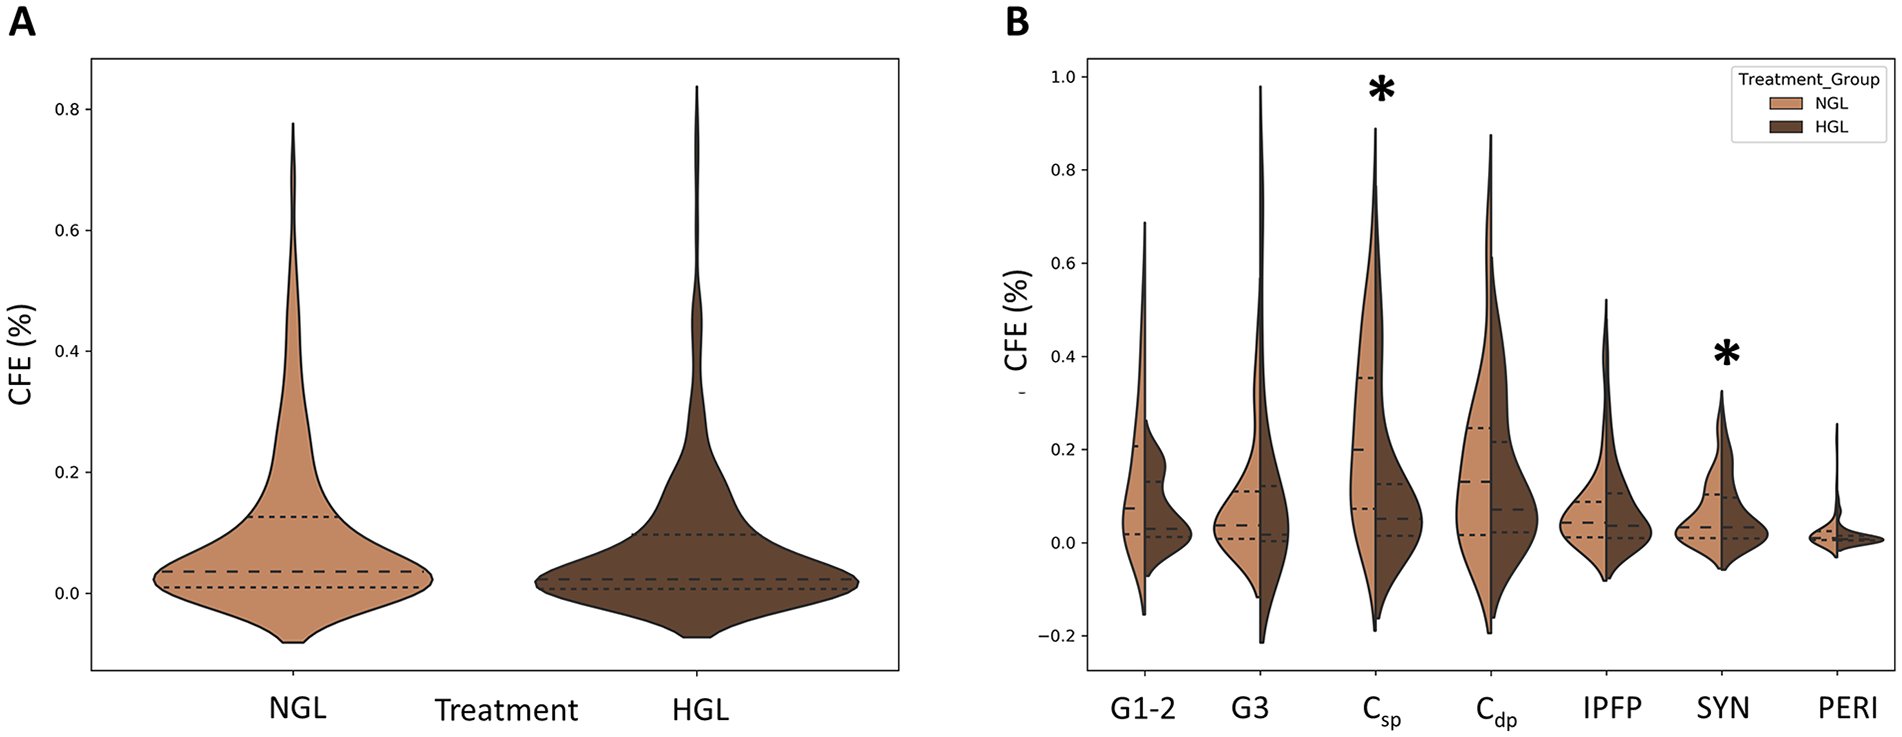
Effect of glucose concentration on colony-forming efficiency (CFE ≠ 0). (
Effect of Glucose Concentration on Connective Tissue Progenitor (CTP) Performance. a
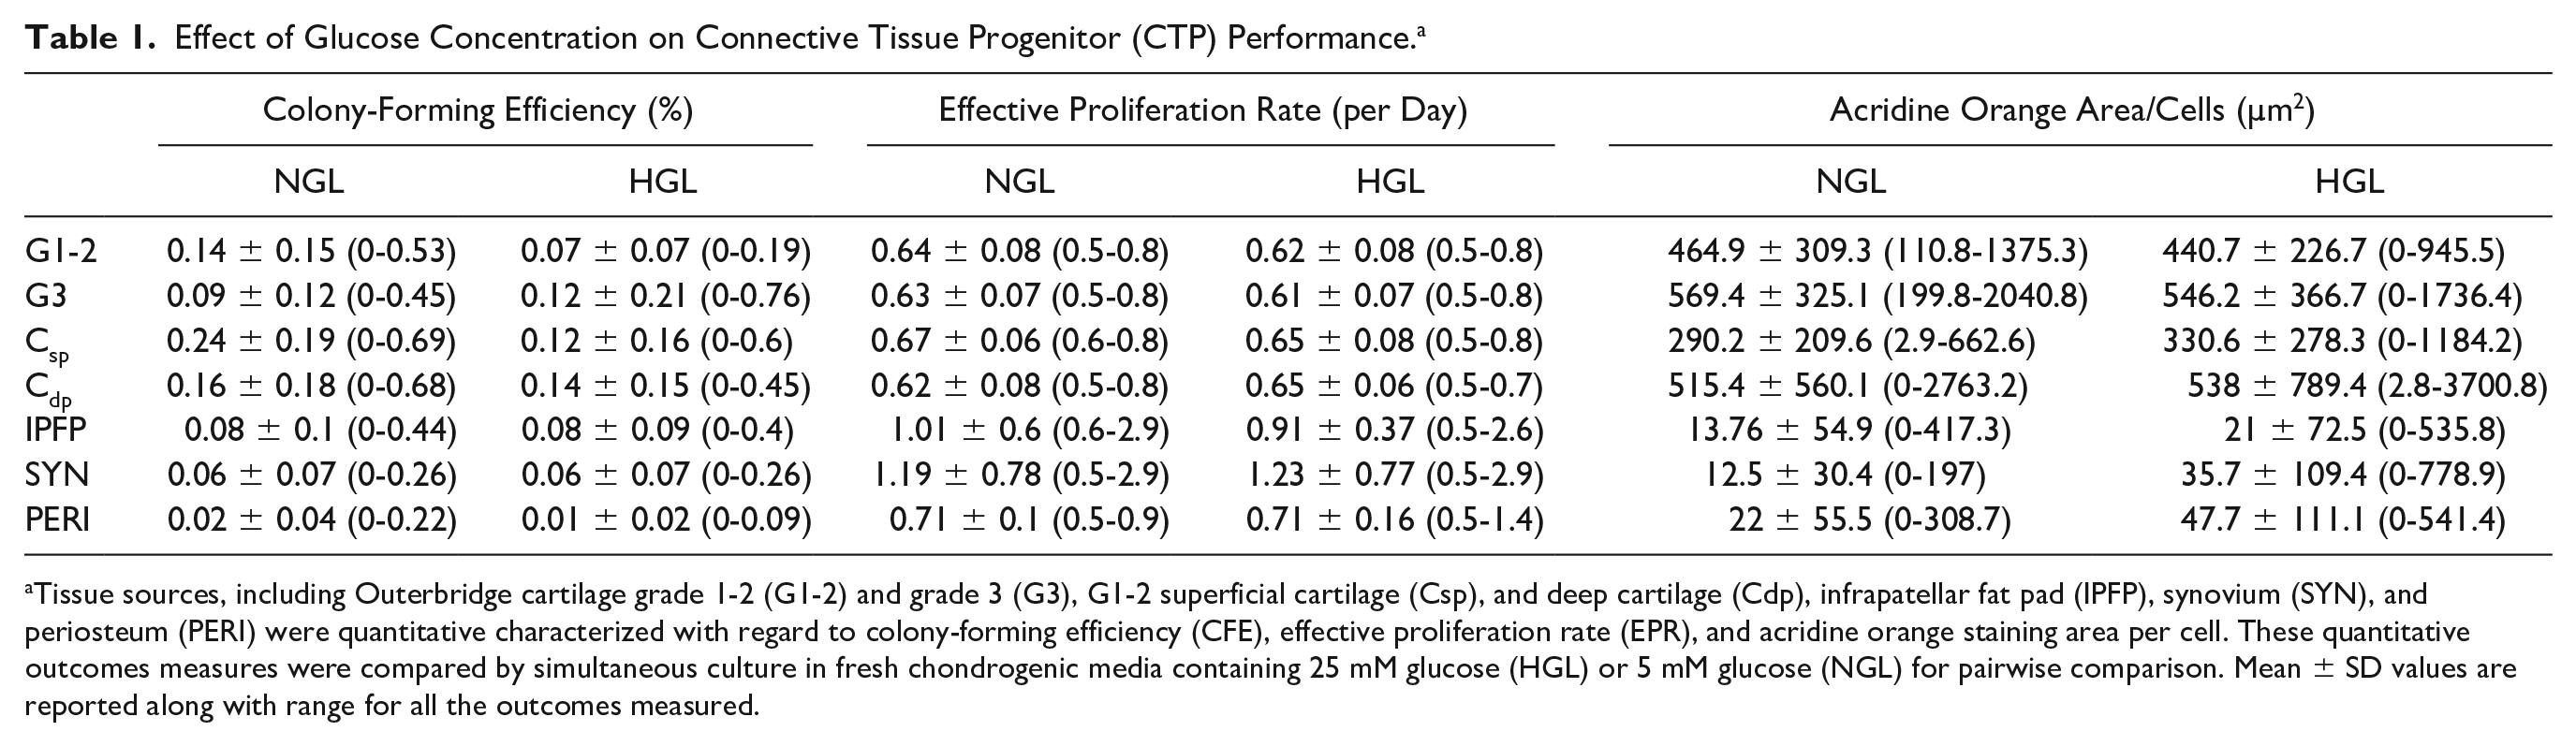
Tissue sources, including Outerbridge cartilage grade 1-2 (G1-2) and grade 3 (G3), G1-2 superficial cartilage (Csp), and deep cartilage (Cdp), infrapatellar fat pad (IPFP), synovium (SYN), and periosteum (PERI) were quantitative characterized with regard to colony-forming efficiency (CFE), effective proliferation rate (EPR), and acridine orange staining area per cell. These quantitative outcomes measures were compared by simultaneous culture in fresh chondrogenic media containing 25 mM glucose (HGL) or 5 mM glucose (NGL) for pairwise comparison. Mean ± SD values are reported along with range for all the outcomes measured.
Effective Proliferation Rate
Among subjects where EPR >0, the 2-way interaction of treatment and cell source was not significant in the generalized linear model (P = 0.717), suggesting that differences between the 2 treatments do not differ by cell source ( Fig. 3B ). In fact, the difference in the magnitude of EPR between the 2 treatment groups (NGL vs. HGL media) was also not statistically significant (P = 0.082) ( Fig. 3A , Table 1 ).
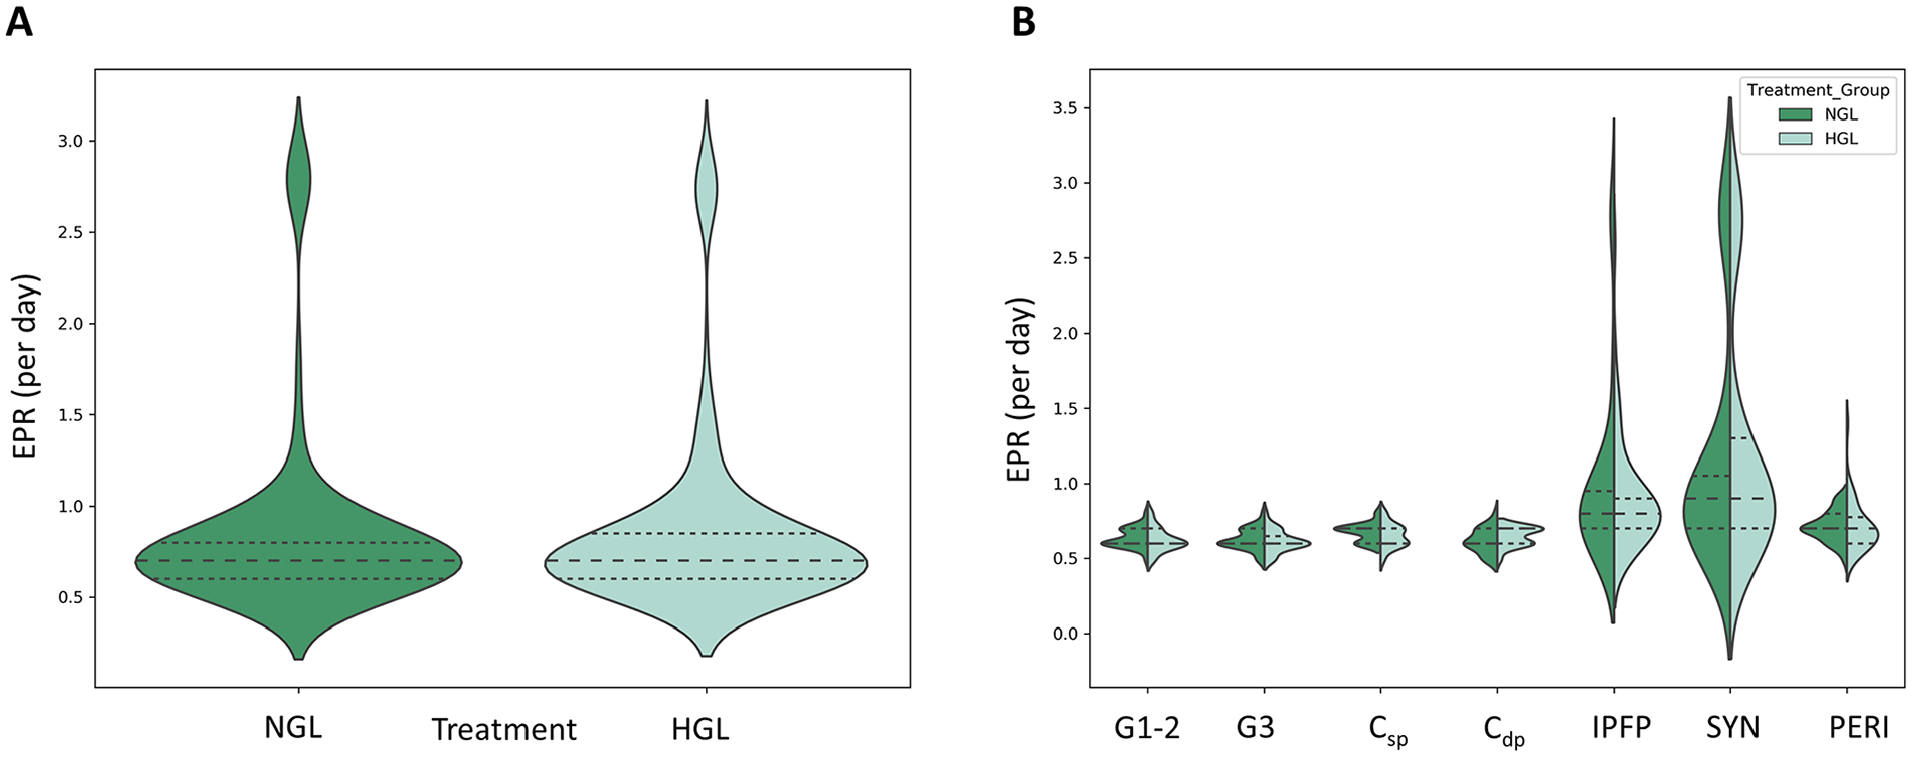
Effect of glucose concentration on effective proliferation rate (EPR) of tissue-derived progenitors. (
Differentiation Potential (AO Area/Cell)
Among subjects where the AO area/cell >0, the 2-way interaction of treatment and cell source was not statistically significant in the generalized linear model (P = 0.227), suggesting that differences between the 2 treatments do not differ by cell source. The difference in magnitude of AO area/cell did differ by treatment (P = 0.027), suggesting a higher magnitude of AO area/cell values in HGL than NGL media group ( Fig. 4A ). Cell source was also significant in the model (P < 0.001), indicating higher overall AO area/cell values for cartilage-derived CTPs (G1-2, G3, Cdp, and Csp) than from the IPFP, PERI, and SYN cell sources ( Fig. 4B , Table 1 ).
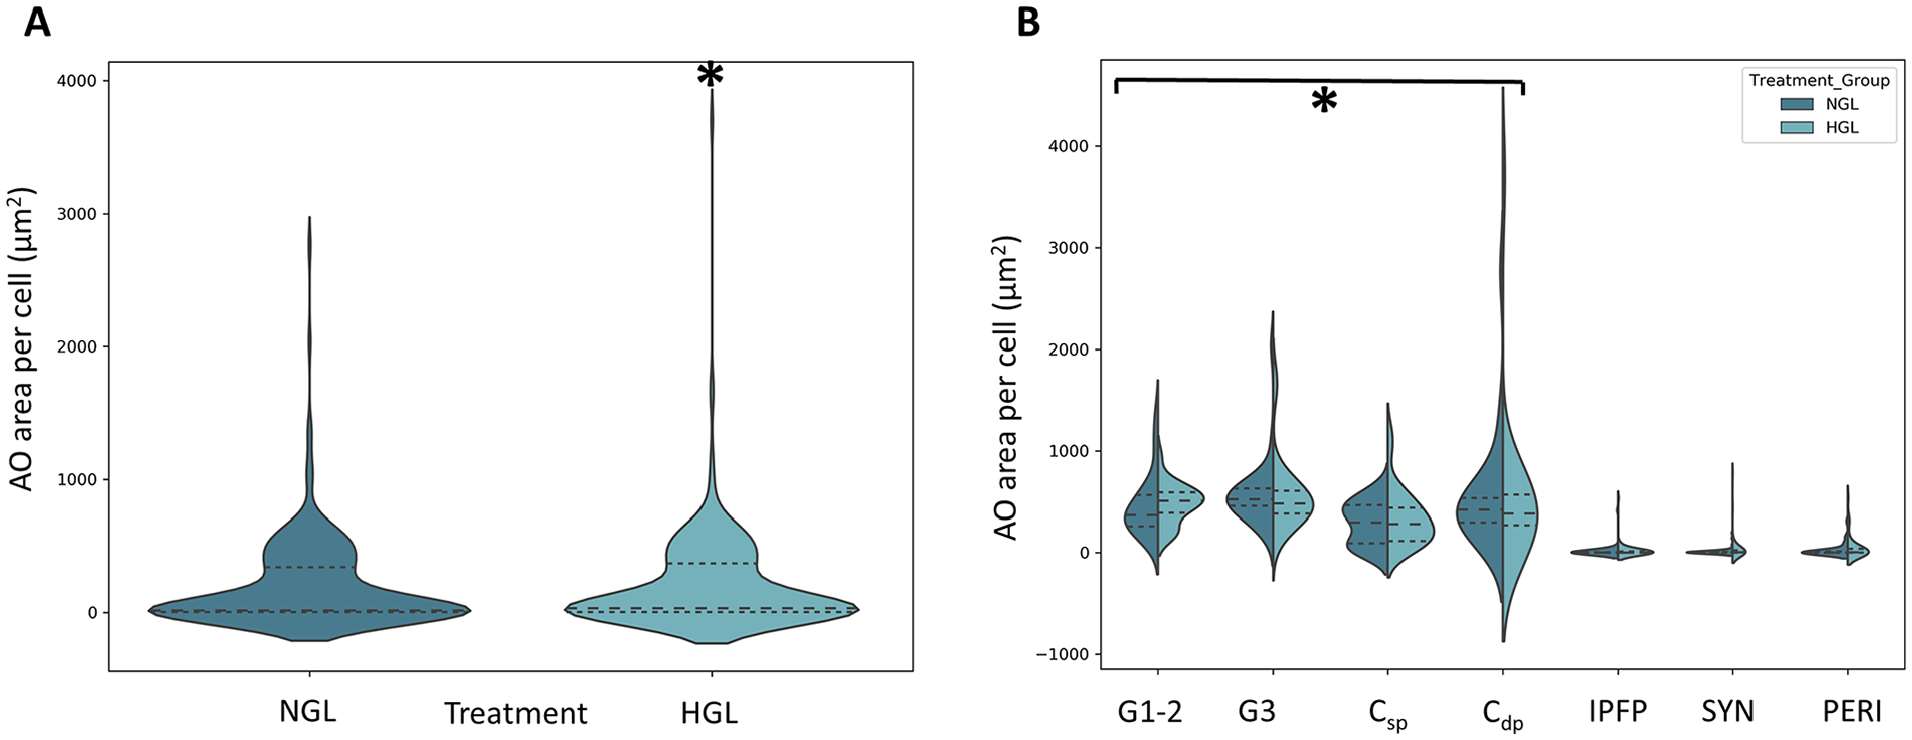
Effect of glucose concentration on sulfated proteoglycans (GAG-ECM) production as measured by acridine orange (AO) stained area per cell. (
Discussion
This study provides quantitative evidence regarding the effect of glucose concentration in media recipes on the native stem and progenitor population obtained from various tissue sources using reliable and reproducible automated CFU assay in accordance with ASTM standard test methods (F2944-12). Our outcomes suggest that high glucose concentration in media decreased the CFE, more prominently on cartilage and periosteum-derived progenitors, than infrapatellar fatpad– and synovium-derived progenitors. The proliferation potential of the CTPs did not differ significantly between the treatment groups for the 6-day assay. Last, the GAG-ECM production capability of the cells was found to significantly increase in presence of HGL media in the 6-day assay. Overall, glucose concentration in media is an important parameter to consider when culturing cells for either therapeutic purposes or in vitro studies. There are very few studies in literature that have determined the effect of glucose on the native tissue–derived CTPs, most of the existing literature provides evidence regarding the effect of glucose on culture-expanded or -passaged cell populations.23,58,59
Our results suggest that HGL resulted in higher CFU death than NGL (CFE = 0, P = 0.049). There are very few studies in literature that report on the effect of glucose on CFE from native human tissue–derived progenitor cells. These few studies also reported a decrease in CFE for bone marrow–, adipose-, and cartilage-derived stem and progenitor cells when cultured in HGL media.23,58-62 On the other hand, there are many studies in literature suggesting that high glucose exposure causes cell senescence.63,64 Several pathways have been identified that can have detrimental effect on cells due to high glucose concentration: (a) advanced glycation end products (AGEs) production due to excessive intracellular glucose concentration that saturates the glycolytic pathway, thereby activating other secondary pathways involved in glucose metabolism like polyol, hexosamine, protein kinase C, or pentose phosphate pathways 65 ; (b) ROS production induces oxidative stress and leads to mitochondrial dysfunction41,66-68; and (c) nitric oxide (NO) production can have pro-inflammatory and pro-degradative effects on cells leading to death.34,69-71 Our results also suggest that the CTPs that survived in the HGL media conditions are selective subpopulation of progenitors that potentially possess high glucose tolerance or can resist HG toxicity. Whether these subsets of cells have higher, lower, or similar in vivo cartilage repair potential remains unanswered in this study. However, some of the in vivo studies reported in literature suggests that persistent exposure to high glucose reduces differentiation potential to osteogenic and chondrogenic lineage and promotes adipogenic lineage.72,73
In addition to CFE differences stated above, we observed significantly higher CFE for Csp-derived CTPs when cultured in NGL than HGL media. In contrast, we found that CFE for SYN-derived CTPs was higher in HGL than in NGL media. This observation has never been reported previously in the literature and suggests how 2 neighboring tissues present in the same joint behave contrastingly to glucose concentrations. It should be noted that the tissue samples were obtained from TKA patient and thus a diseased joint, and so the observation could be further explored to identify its relevance to OA disease progression. Our observations are in line with previous report by Jiang et al., 62 who observed loss of CD146+ progenitors in cartilage when exposed to HGL media in vitro. It is known that articular chondrocytes are highly glycolytic cells that require steady supply of glucose for optimal energy production and cell homeostasis, as well as for anabolic function of cartilage matrix synthesis.42,74 These cells can be sensitive to alterations in glucose concentrations in synovial fluid. Rosa et al. 39 have shown that progenitors from normal cartilage respond differently than diseased cartilage to high glucose concentrations. While normal cartilage-derived progenitors have the capability to adjust to variations in extracellular glucose concentration by modulating glucose transporter 1 (GLUT-1), OA cartilage–derived progenitors exposed to high glucose concentration were unable to downregulate GLUT-1, thereby accumulating more glucose and producing more ROS. As per our literature review, there are no studies comparing CFE for synovium-derived progenitors in HGL and NGL conditions. Synovial fibroblasts, which constitute 75% to 80% of cells in normal synovium tissue, have showed increased glucose metabolism and GLUT-1 expression in a diseased joint, leading to inflammation and joint damage.75-79
Safe, effective, and reliable cell therapy approaches based on mesenchymal stromal cells (MSCs) demand control over the quantity and quality of CTPs that serve as the starting materials for therapeutics based on cell processing and in vitro expansion strategies. There is enormous heterogeneity in autogenous tissue sources of MSCs with respect to their stemness and performance.1-3,13,80-82 Because of the evident heterogeneity of the progenitors and their progeny observed in our previous studies, we measured EPR for the individual colonies in the culture. On average, for the 6-day assay performed, we noted EPR for the colonies derived from the various tissue sources were not different between the HGL and NGL treatment groups, as noted by some others in literature. 83 From work done previous in our lab, we understand that the average lag period from the day cells are placed into in vitro culture until the cells undergo their first cell division is 2 to 3 days. 84 As a result, the cells probably had a chance to undergo at most 3 to 5 rounds of replication. Although, there is no literature evidence comparing the proliferation potential of native CTPs derived from various tissue sources, researchers have reported proliferation potentials of culture expanded populations. The outcomes reported have been very contradictory. Weil et al. 85 suggested that for the short-term glucose study, stem/progenitor cells maybe resistant to high glucose conditions. Some studies have reported that the proliferation potential was inhibited by high glucose conditions for certain tissue sources in contrast to other studies suggesting increased proliferation potential of cells in presence of high glucose media.83,86-88
GAG-ECM measurements as determined by AO stain area suggested that HGL media lead to significantly higher GAG production in CTPs and their progeny from the different tissue sources. Importantly, it was noted that cartilage-derived CTPs showed significantly more GAG production than other tissue-derived CTPs. For most mammalian cells, glucose is transported into the cell by the GLUTs are converted to glucose-6-phosphate (G6P). G6P can be utilized by the cells in multiple ways, including aerobic glycolysis, oxidative phosphorylation, pentose phosphate pathway, glycogen synthesis and GAG synthesis.89-92 It is well established that GAG production is one of 3 general mechanisms for cartilage-derived cells to handle and neutralize high intracellular UDP (uridine diphosphate)-glucose levels (glycogen and lipid droplet storage are the other 2 mechanisms).89,93 It should also be noted that acridine orange staining is a surrogate marker for GAGs, and stains all sulphated-proteoglycans. Thus, in this case GAG-ECM measurement may not necessarily suggest higher chondrogenic differentiation potential. For future studies, we intend to stain the cell cultures for more specific chondrogenic markers like collagen II or aggrecan. Literature varies about the effects of glucose conditions on differentiation potential. HGL inhibited differentiation in chondrocytes, periodontal cells, and bone marrow–derived stromal cells.35,86,88,94 HGL helped with differentiation in muscle-derived stem cells and adipose-derived stem cells. 95 Other studies have suggested that HGL may cause differentiation into adipocytes. 72
It is important to understand that in mammalian cell cultures, metabolism requirements of oxygen and glucose are different based on the cell-cycle phase. During the exponential phase of the cell cycle, as per the Warburg effect, despite the aerobic conditions, mammalian cell cultures typically convert 75% to 85% of glucose to lactate, resulting in ~4 mol ATP/mol glucose. Conversely, during the differentiation phase of the cell cycle, under aerobic conditions, glucose is oxidized to CO2 in the tricarboxylic acid cycle (TCA) (~36 mol ATP/mol glucose) and under anaerobic conditions, glucose is converted to lactate (~2 mol ATP/mol glucose).91,96 Although in this study, we focused on the effect of glucose concentrations on the CTPs, the O2 levels were kept constant at 21% and was a limitation of the study.17,97
Conclusion
In conclusion, stem and progenitor derived from cartilage, synovium, periosteum, and infrapatellar fatpad colony-forming efficiency is reduced by high levels of glucose in media. Glucose concentration makes an essential contribution to stem and progenitor cells physiology and should be taken into account in the setting of protocols for clinical or in vitro cell expansion strategies. In addition, using the optimized media conditions, future work will focus on exploring selective isolation, expansion and characterization of the heterogeneous colonies to identify desired cell populations for the respective cell therapy and tissue engineering applications.
Footnotes
Acknowledgments and Funding
The author(s) disclosed receipt of the following financial support for the research, authorship, and/or publication of this article: This work was supported by National Institute of Health grant (R01AR063733) awarded to George F. Muschler. All the work was performed at the Cleveland Clinic.
Declaration of Conflicting Interests
The author(s) declared no potential conflicts of interest with respect to the research, authorship, and/or publication of this article.
Ethical Approval
This study was approved by the Institutional Review Board committee of the Cleveland Clinic (Protocol: 13641).