
Abstract
Objective:
The articular cartilage of autologous osteochondral grafts is typically different in structure and function from local host cartilage and thereby presents a remodeling challenge. The hypothesis of this study was that properties of the articular cartilage of trochlear autografts and adjacent femoral condyle are associated with the 3-dimensional (3-D) geometrical match between grafted and contralateral joints at 6 and 12 months after surgery.
Design:
Autografts were transferred unilaterally from the lateral trochlea (LT) to the medial femoral condyle (MFC) in adult Spanish goats. Operated and contralateral nonoperated joints were harvested at 6 and 12 months and analyzed by indentation testing, micro–computed tomography, and histology to compare 1) histological indices of repair, 2) 3-D structure (articular surface deviation, bone-cartilage interface deviation, cartilage thickness), 3) indentation stiffness, and 4) correlations between stiffness and 3-D structure.
Results:
Cartilage deterioration was present in grafts at 6 months and more severe at 12 months. Cartilage thickness and normalized stiffness of the operated MFC were lower than the nonoperated MFC within the graft and proximal adjacent host regions. Operated MFC articular surfaces were recessed relative to the nonoperated MFC and exhibited lower cartilage stiffness with increasing recession. Sites with large bone-cartilage interface deviations, both proud and recessed, were associated with recessed articular surfaces and low cartilage stiffness.
Conclusion:
The effectiveness of cartilage repair by osteochondral grafting is associated with the match of 3-D cartilage and bone geometry to the native osteochondral structure.
Introduction
Autologous osteochondral grafts (autografts) are attractive as treatments for cartilage defects due in part to their native tissue architecture. Autografts can be taken from nonweightbearing regions of the joint and used to treat small (1-3 cm 2 ) defects.1-3 Oftentimes, the inherent mismatch between graft donor and recipient host properties4-8 imposes remodeling requirements for complete structural and functional restoration. The extent to which articular cartilage, traditionally ascribed to have limited intrinsic regenerative capacity, 9 can remodel and adapt in such an autograft situation is unclear.
Animal models of autografts suggest that in vivo remodeling and resultant cartilage and bone properties depend on the maintenance of surface geometry. Autografts implanted approximately flush generally display, at 3 and 6 months, articular cartilage with smooth surfaces, little integration to host cartilage, variable chondrocyte viability and clustering, and trends of slight cartilage thickening.10-13 Autografts implanted with the surface recessed in adult sheep deteriorated by 6 weeks depending on the extent of mismatch; those recessed 1 mm in vivo maintained a smooth articular cartilage surface, with cartilage thickening and tidemark advancement, while grafts recessed 2 mm underwent cartilage necrosis with fibrous tissue overgrowth. 11 Autografts implanted 2 mm proud relative to adjacent host cartilage in adult sheep developed surface clefts after 3 months in vivo. 14 Biomechanical studies, both experimental and computational, demonstrated that the articular cartilage of proud grafts is subjected to increased peak contact pressures and compressive strains compared to the cartilage of congruent joints, while recessed grafts led to higher contact pressures in adjacent host cartilage.15-17 Joint scale coefficients of friction of knees with proud grafts were also elevated in vitro. 18 These studies suggest that surface geometry plays an important role in maintaining healthy cartilage, and the success of autograft repair reflects the adaptation of the graft to normal host geometry.
Structural assessment of defect repairs has traditionally focused on metrics of the central graft region and the graft-host interface, evaluated in 1 dimension or 2 dimensions in one or several sites. Graft cartilage geometry has been evaluated with histology10,11,19-22 and MRI23-25 using graded scales for parameters such as cartilage thickness, fill, integration, and elevation. Bone morphometry and fill have also been assessed with histology,13,26 conventional x-ray, 12 and computed tomography. 27 However, few studies have quantified, particularly in 3 dimensions, the extent of geometrical abnormalities in grafted cartilage and bone.19,21,28 Comparisons to contralateral controls have typically involved matching relatively small tissue sections to the graft site. These 2-dimensional (2-D) methods provide valuable structural and compositional information along one section of the graft but a limited view of remodeling within the whole joint. Three-dimensional (3-D) assessment of cartilage and bone structure in and surrounding the graft would provide further insights into the role of graft-host geometry in cartilage repair.
The reported biomechanical properties of autograft cartilage after in vivo remodeling vary due to measurement methodology and the underlying osteochondral structure at the test site. Single-location biomechanical measurements using indentation10,13,29,30 provide limited characterization of the state of repair within the entire graft because repair tissues often exhibit spatially varying properties. Normalization of stiffness measurements based on cartilage thickness is useful for estimation of material properties;31-33 when indenter dimensions are on the same order as cartilage thickness, stiffness increases as thickness decreases.34,35 Multiple sites of indentation and detailed analyses of the 3-D articular surface and the bone-cartilage interface could improve the characterization of repair tissue properties.
The hypothesis of this study was that properties of the articular cartilage of trochlear osteochondral autografts and of the adjacent femoral condyle are associated with the 3-D geometrical match of articular surface and bone between grafted and contralateral joints at 6 and 12 months after surgery. To address this hypothesis, the objectives of this study were to evaluate the cartilage of the implant and adjacent host region in grafted and contralateral joints for 1) histological indices of repair, 2) 3-D structure, 3) indentation stiffness, and 4) correlations between stiffness and 3-D structure.
Methods
Full-thickness grafts from the lateral trochlea (LT) were press-fit into defects of the medial femoral condyle (MFC) in one knee of adult Spanish goats, and operated and nonoperated knees were harvested at 6 and 12 months. The term “nonoperated” was chosen to describe the contralateral joints, as these joints are commonly used as long-term study controls but may not be completely “normal” or intact due to potential aging-associated changes. Metrics of repair were determined from array indentation testing at 63 test locations per joint, micro–computed tomography, and histology. Nonoperated and operated joints were compared in graft and adjacent host regions in terms of histological indices of repair, 3-D structure (articular surface deviation, bone-cartilage interface deviation, cartilage thickness, volume), and indentation stiffness (structural and stiffness normalized). Finally, correlations of stiffness with surface deviations were determined.
Methods are outlined below, and additional details and methods for analyses of other parameters (gross morphology, 3-D alignment, bone histomorphometry, and tidemark remodeling) are provided in the online supplementary material.
Surgical Model
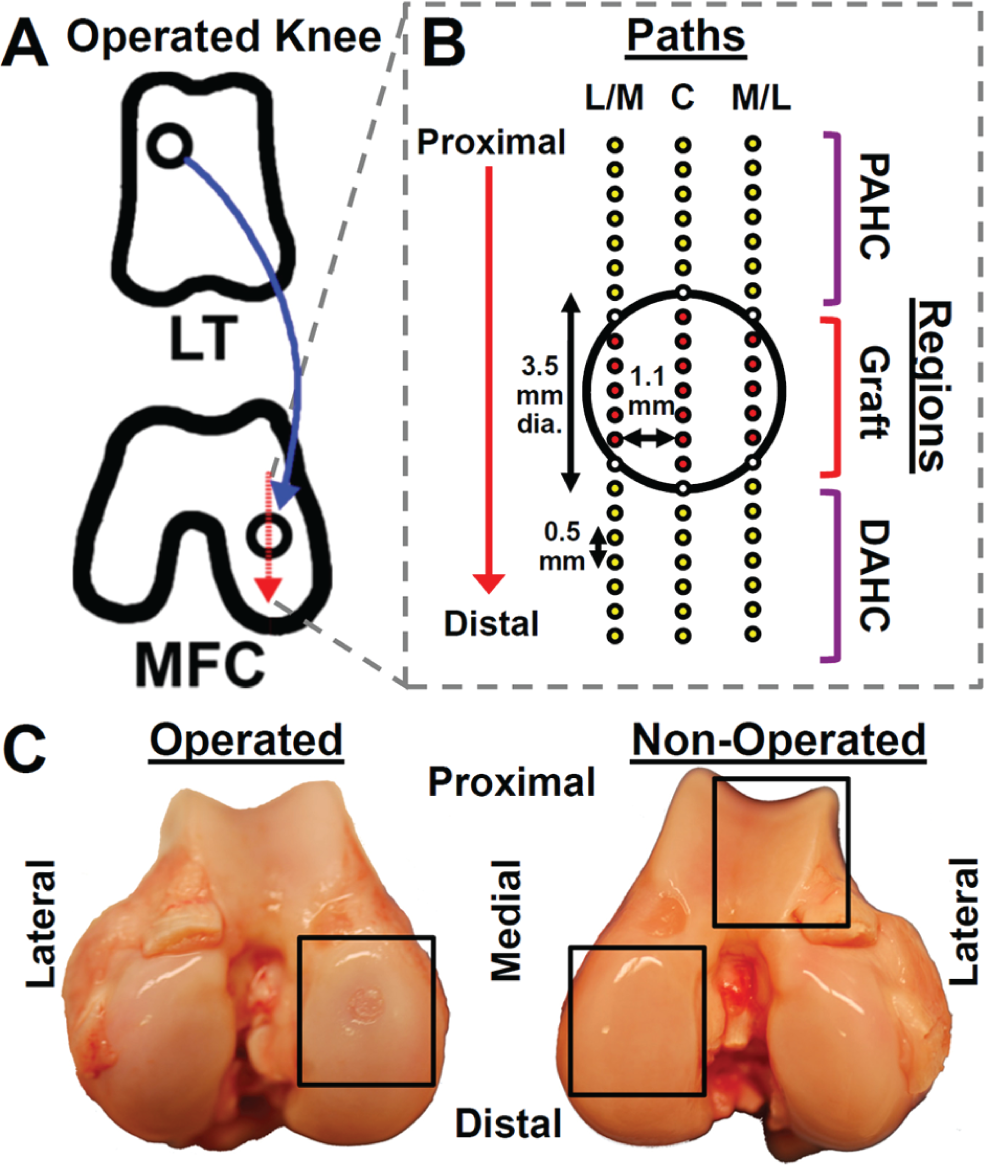
Adult female Spanish goats (2-3 years old) were used with UCSD Institutional Animal Care and Use Committee approval. In the operated knee of each goat, a full-thickness osteochondral graft (diameter [Ø] = 3.5 mm, height [h] = 6 mm) was harvested from the LT using a trephine (Smith & Nephew, Andover, MA) and press-fit into recipient osteochondral defects (Ø = 3.5 mm) drilled in the weightbearing surface of the MFC (see supplementary material). Care was taken to ensure that the graft articular surfaces were approximately flush with host articular surfaces. At 6 and 12 months (n = 4 each), animals were euthanized, and both operated and contralateral nonoperated knees were harvested for analysis ( Fig. 1 ).
(
Indentation Mechanical Testing
Cartilage load-bearing function was mapped at 63 sites per knee surrounding the defect region. At each site, rapid indentation of cartilage was performed for 1 second to a depth of 100 µm using a porous, plane-ended indenter (Ø = 0.4 mm) attached to a Mach-1 V500cs (BioSyntech, Quebec, Canada) to allow measurement of load and determination of structural stiffness (force per indentation depth) (see supplementary material). 36 Testing was performed in 0.5 mm intervals along a 10 mm proximal-to-distal path through the central axis of the defect as well as paths 1.1 mm lateral and medial to the central axis ( Fig. 1B ). Scalpel marks were created 1.5 mm proximal and distal to the beginning and end of the central path for registration with other measurements. Following indentation, condyles were fixed in 10% neutral buffered formalin.
Micro–Computed Tomography (µCT)
µCT imaging was performed to visualize the cartilage and bone relative to the indentation test sites. Radio-opaque pins (Ø = 0.25 mm, h = 3 mm) were inserted into the scalpel marks of each sample as markers to register µCT data with other metrics. Imaging was at 45 µm3 resolution (GE eXplore Locus, GE Healthcare, London, Canada). X-ray scattering from pins was negligible in areas of analysis (see supplementary material). Data export and 3-D visualization were performed with Microview v2.1.2 (GE Healthcare).
Histology
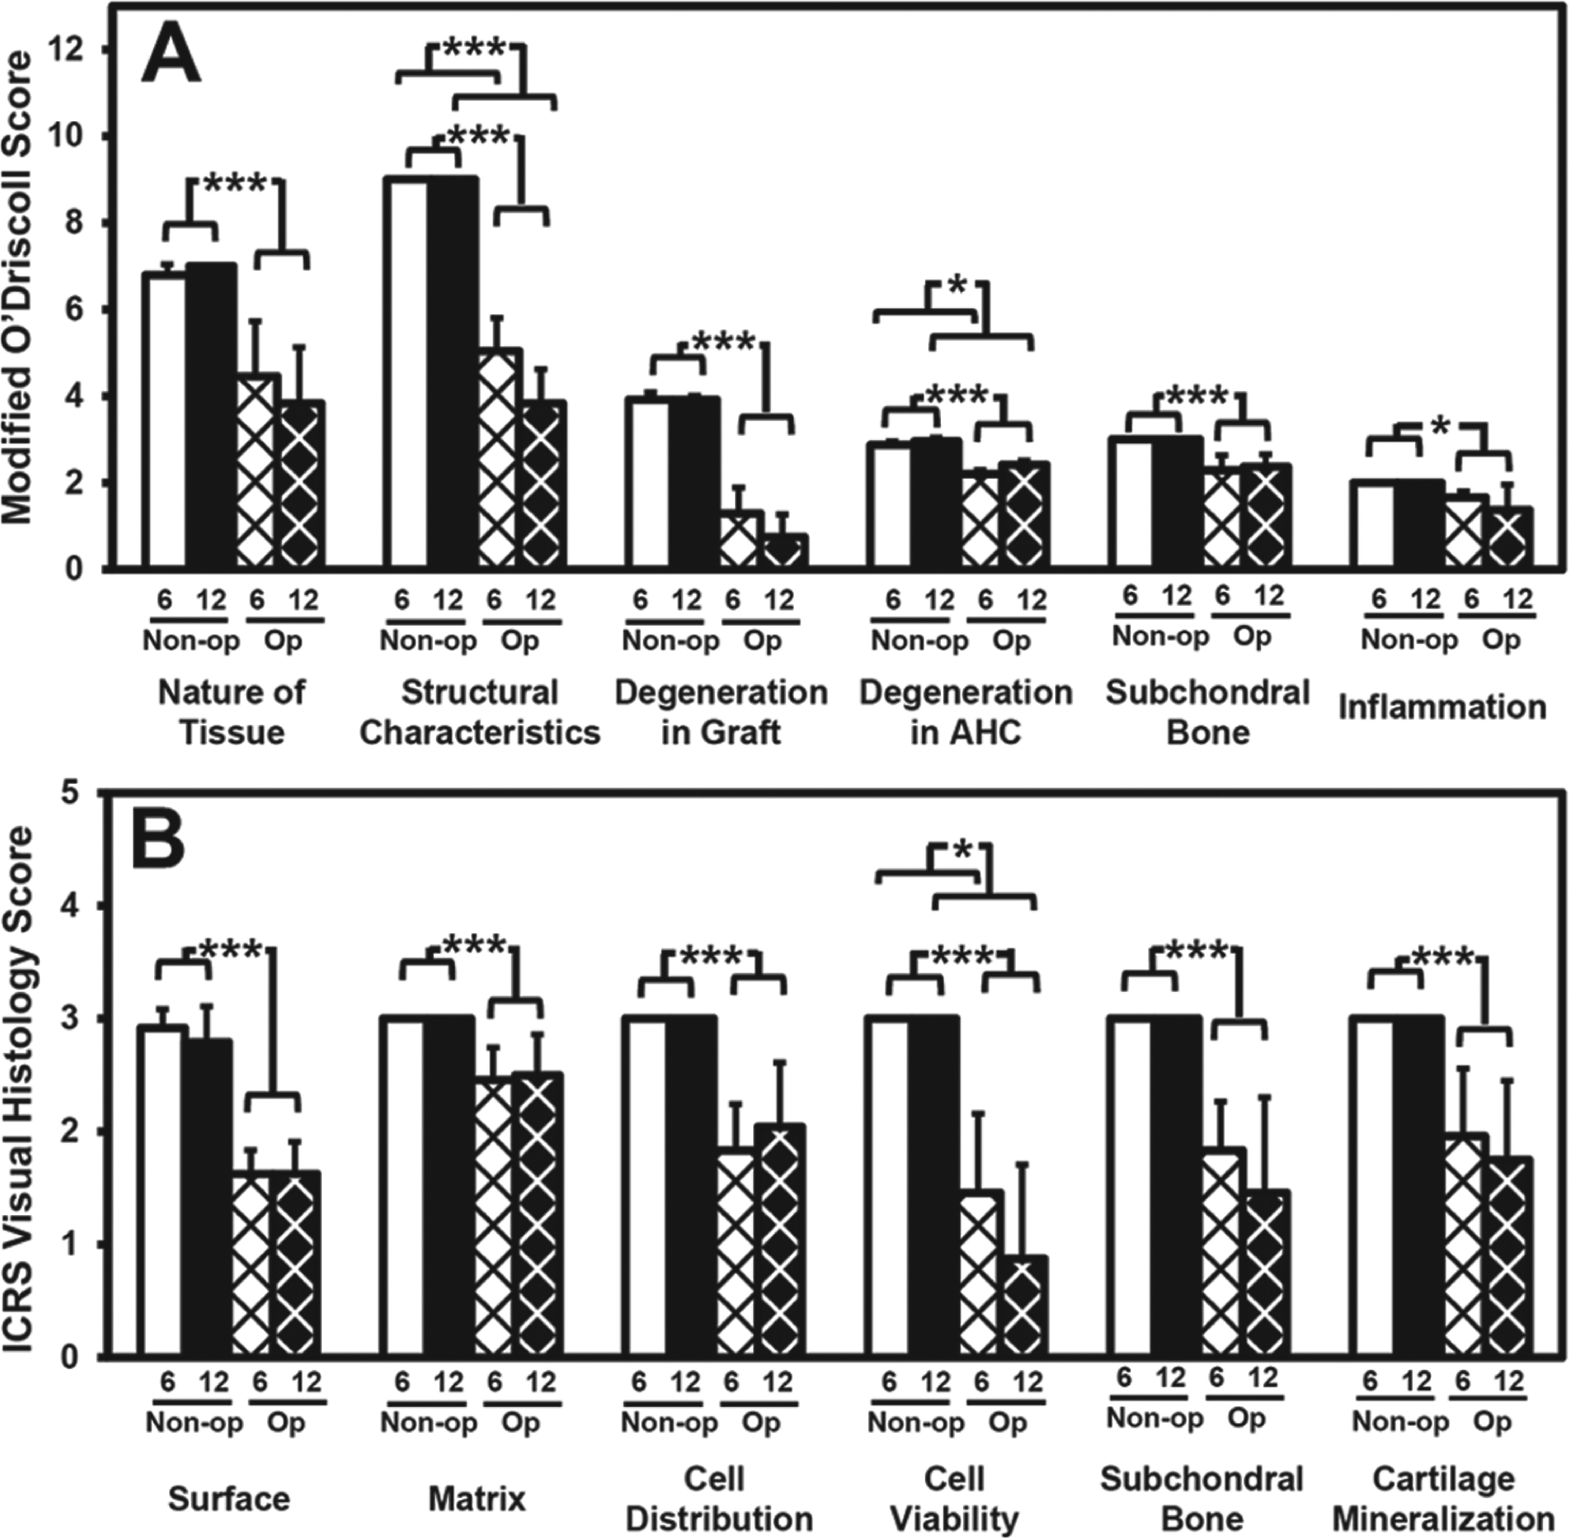
Samples were processed for histological sections at the central, medial, and lateral test paths and analyzed by histochemistry (hematoxylin and eosin [H&E], Safranin-O) and immunohistochemistry (types I and II collagen [COL-I and COL-II]). Safranin-O sections were scored independently by 2 users using the modified O’Driscoll scale22,37 (maximum total score = 28), including a category for “degeneration in graft” (maximum score = 4), and the International Cartilage Repair Society Visual Assessment Scale (ICRS I) 20 (each category, maximum score = 3). Maximum scores represent normal cartilage (see supplementary material).
Data Analysis
µCT data from pairs of operated and nonoperated joints were analyzed individually and together to allow determination and comparison of cartilage and bone properties at anatomically site-matched locations. The articular cartilage surface and bone-cartilage interface were segmented from µCT scans by thresholding in Mimics (Materialise, Leuven, Belgium). Then, positions of registration pins were identified, from which sites of indentation testing on the µCT-segmented surface were determined (
In both operated and nonoperated knees, data points were categorized as graft region, or proximal/distal adjacent host cartilage (PAHC/DAHC) region, based on a set distance from the graft center ( Fig. 1B ). Graft centers in µCT data sets were determined for operated joints as the midpoint between the proximal and distal edges of the graft subchondral bone along the central path. Corresponding graft centers in the nonoperated knee were defined in the same anatomic location based on the registered surfaces. All references to “graft region” in the subsequent text apply to tissue at the implant location. Thus, “operated graft” includes tissue originating from the grafted and/or adjacent host tissue, and “nonoperated graft” includes tissue at a corresponding anatomic location of the nonoperated contralateral MFC.
Geometric deviations of operated surfaces from nonoperated contralateral controls were calculated at the articular surface and bone-cartilage interface. Deviations from each point of the nonoperated surfaces were determined as the shortest distance to the operated surface along the local surface normal vector. Proud surfaces were denoted by positive deviations and recessed surfaces by negative deviations.
Cartilage thickness was determined from µCT scans at each indentation site as the height from the cartilage surface to the bone-cartilage interface. These measures were similar to those from histology (see supplementary material) but could be determined semiautomatically.
Tissue volume in the graft was calculated as the volume between the articular cartilage surface and bone-cartilage interface within a cylinder, 1.75 mm radius around the graft center, aligned parallel to the local surface normal vector. The difference in volume between the operated graft and contralateral nonoperated graft regions was also computed.
Normalized cartilage stiffness was determined from indentation structural stiffness and thickness to allow comparisons of material properties. The normalization factor was determined from a function that curve-fit structural stiffness versus thickness data from healthy goat cartilage for both MFC and LT samples (
Variability across the joint was determined to assess how uniform the repair tissue was compared to nonoperated and adjacent host. Two indices of variability were determined: host-implant variability, representing the average variability across an equal region of host and graft tissue, and incremental variability, representing the average of differences between immediately adjacent sites (see supplementary material).
The relationships between normalized stiffness and articular surface deviation, and between normalized stiffness and bone-cartilage interface deviation, were determined by binning together data in 0.15 mm increments of deviation. Adjacent bins were grouped when the number of points was low (<20) to obtain estimates with a confidence interval of ±10%.
Statistical Analysis
Data are reported as mean ± standard error of the mean (SEM) and compared as follows. To address objectives 1 and 2, parametric data (thickness, structural and normalized stiffness) that varied substantially (>2-fold) with standard deviations proportional to the mean were log-transformed. 38 Nonparametric data (ICRS I, O’Driscoll scores) were transformed to ranks to allow for subsequent 2-way analysis of variance (ANOVA); this is analogous to the Kruskal-Wallis 1-way ANOVA for nonparametric data.38,39 After respective transformations, data were analyzed by 2-way repeated-measures ANOVA to assess effects with a fixed factor of remodeling time (6 and 12 months) and a repeated factor of surgical operation (operated and nonoperated). Student t tests were used to compare the operated MFC to nonoperated MFC and LT thickness and stiffness at individual indentation sites.
To address objective 3, a 1-way ANOVA with a post hoc Dunnett test was used to compare normalized stiffness of operated joints at each deviation level to nonoperated average stiffness at 6 and 12 months. Comparisons between deviation levels were performed with a post hoc Tukey test.
Results
Histology
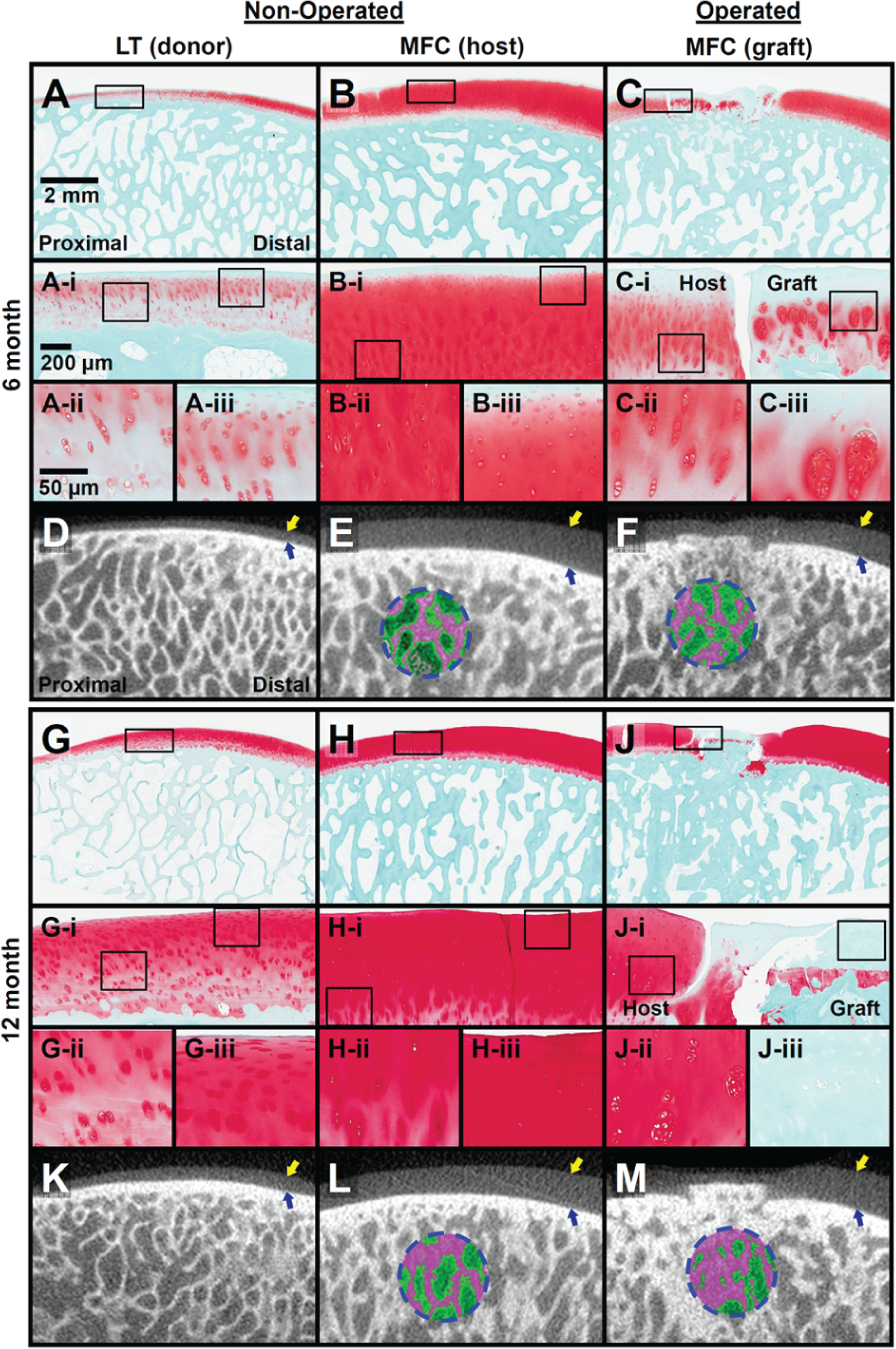
Modified O’Driscoll and ICRS I scores of Safranin-O–stained sections were significantly lower in operated than nonoperated joints in all categories ( Figs. 2 and 3 ). Total modified O’Driscoll scores for nonoperated joints were 27.6 ± 0.4 and 27.9 ± 0.2 at 6 and 12 months, respectively, and were 39% and 48% lower in operated joints, respectively (P < 0.005) ( Fig. 3A ). Operated graft cartilage showed minimal integration with adjacent host cartilage at both times ( Fig. 2C(i) and 2J(i) ), with undulating surfaces that did not appear to match the convexity of the natural joint contour. The largest difference in scores from nonoperated controls was associated with degenerative changes (O’Driscoll score: –67% at 6 months, –81% at 12 months) ( Fig. 3A ) and cell viability (ICRS score: –51% at 6 months, –71% at 12 months) ( Fig. 3B ) within the graft.
Representative (
(
At 6 months, Safranin-O sections showed chondrocyte clustering in the deep zone and loss of cellularity and proteoglycan staining in the superficial zone of graft cartilage ( Fig. 2C(iii) ). Adjacent host had superficial proteoglycan loss and normal deep zone staining ( Fig. 2C(ii) ). At 12 months, 3 of 4 grafts had significant loss of chondrocytes and were devoid of Safranin-O staining throughout the depth of the cartilage ( Fig. 2J(iii) ). Adjacent host cartilage exhibited flow into the repair region, with chondrocyte clustering in the deep zone ( Fig. 2J(ii) ) and fragmented tissue at the graft-host junction ( Fig. 2J(i) ). Graft-host subchondral bone junctions were well integrated in all operated knees. At both times, 2 of 4 knees contained fibrotic cysts.
Surface Deviations
The articular surfaces across all operated adjacent host and graft regions were recessed relative to contralateral nonoperated regions ( Fig. 4 ). The average graft region was recessed by 0.24 mm at 6 months and 0.37 mm at 12 months (P < 0.005). The bone-cartilage interface of the grafts tended to be proud relative to the nonoperated, with a ring of recessed host bone immediately surrounding the graft ( Fig. 4E and 4F ). 3-D reconstructions of graft cartilage and bone showed variability of the bone-cartilage interface ( Fig. 5 ).
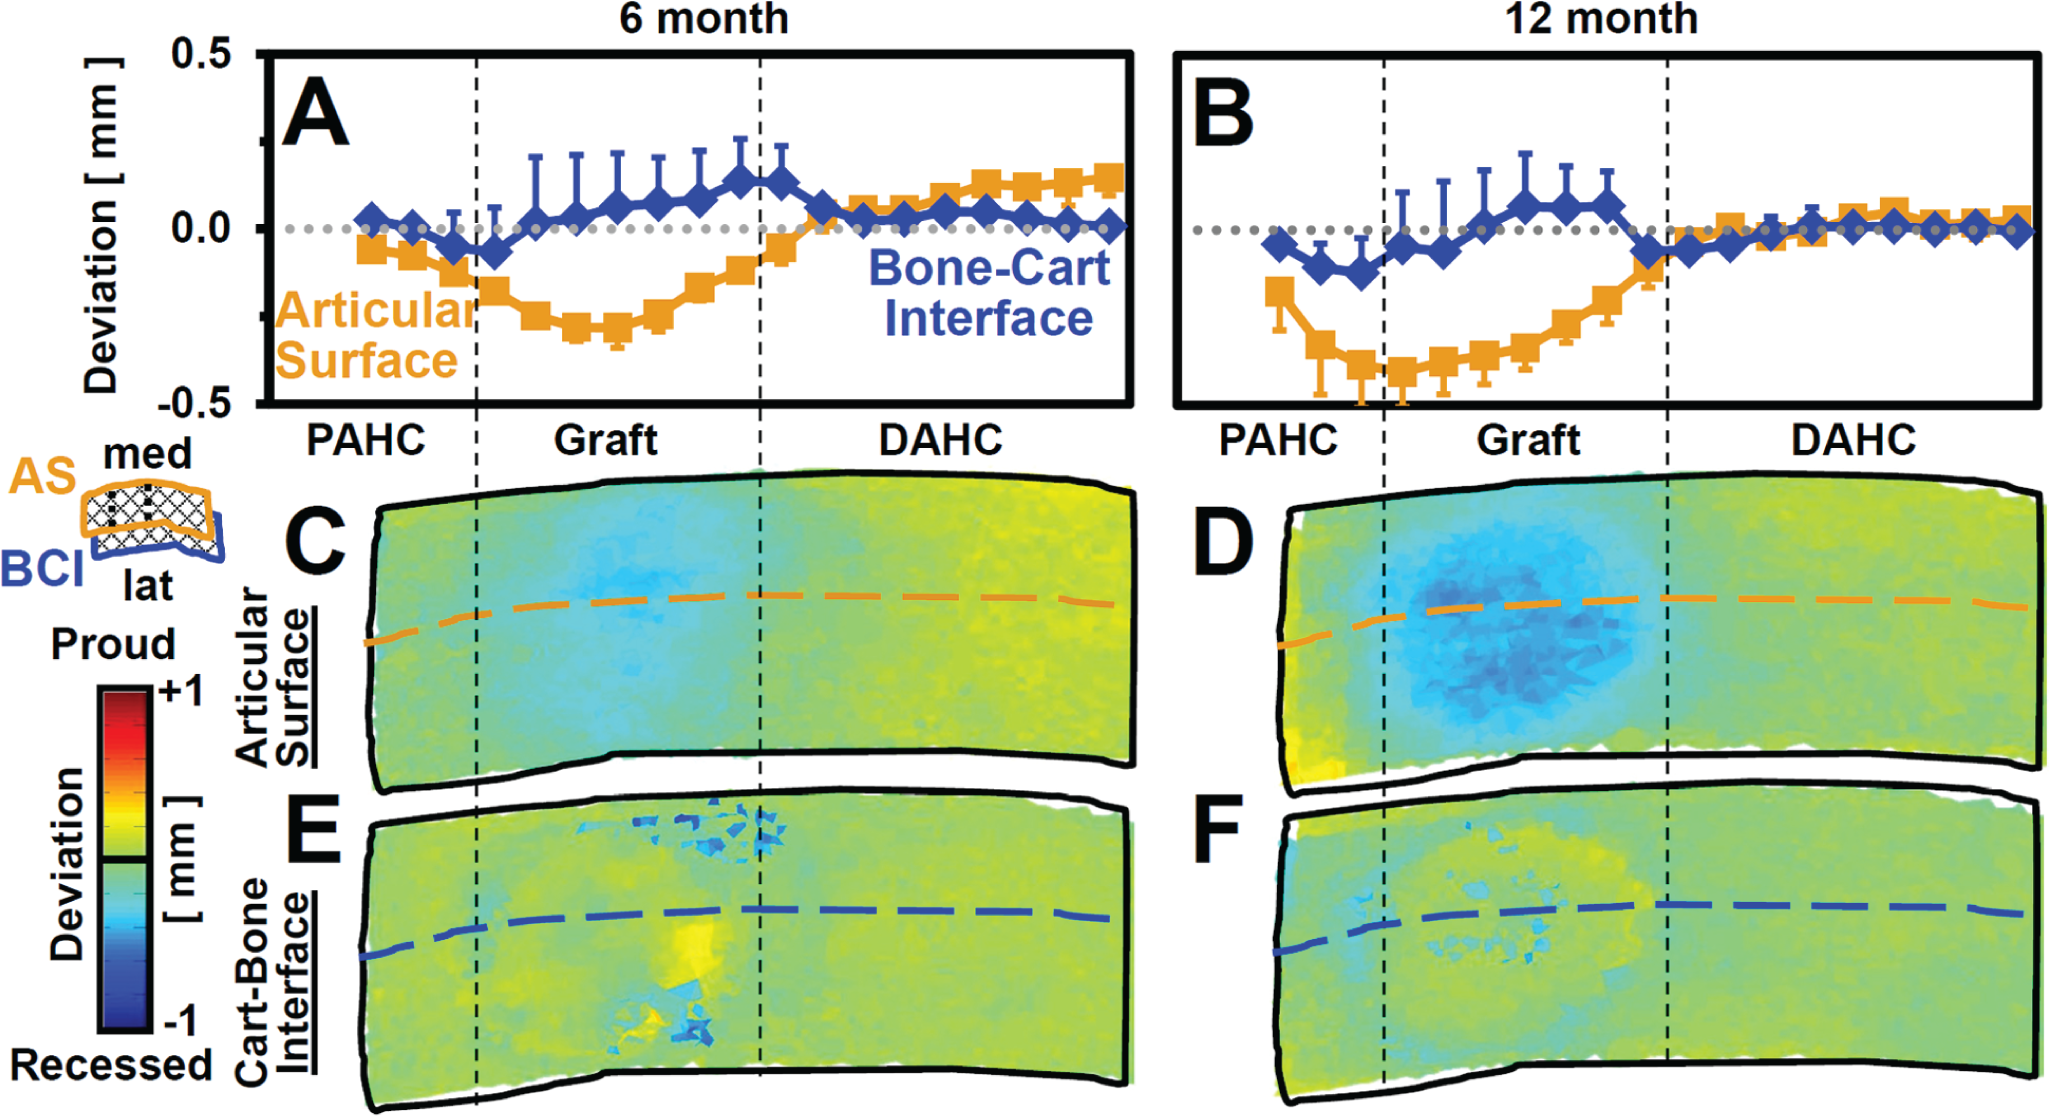
Surface deviations in the graft and proximal and distal adjacent host (PAHC, DAHC) regions at 6 and 12 months. Surface height deviation (
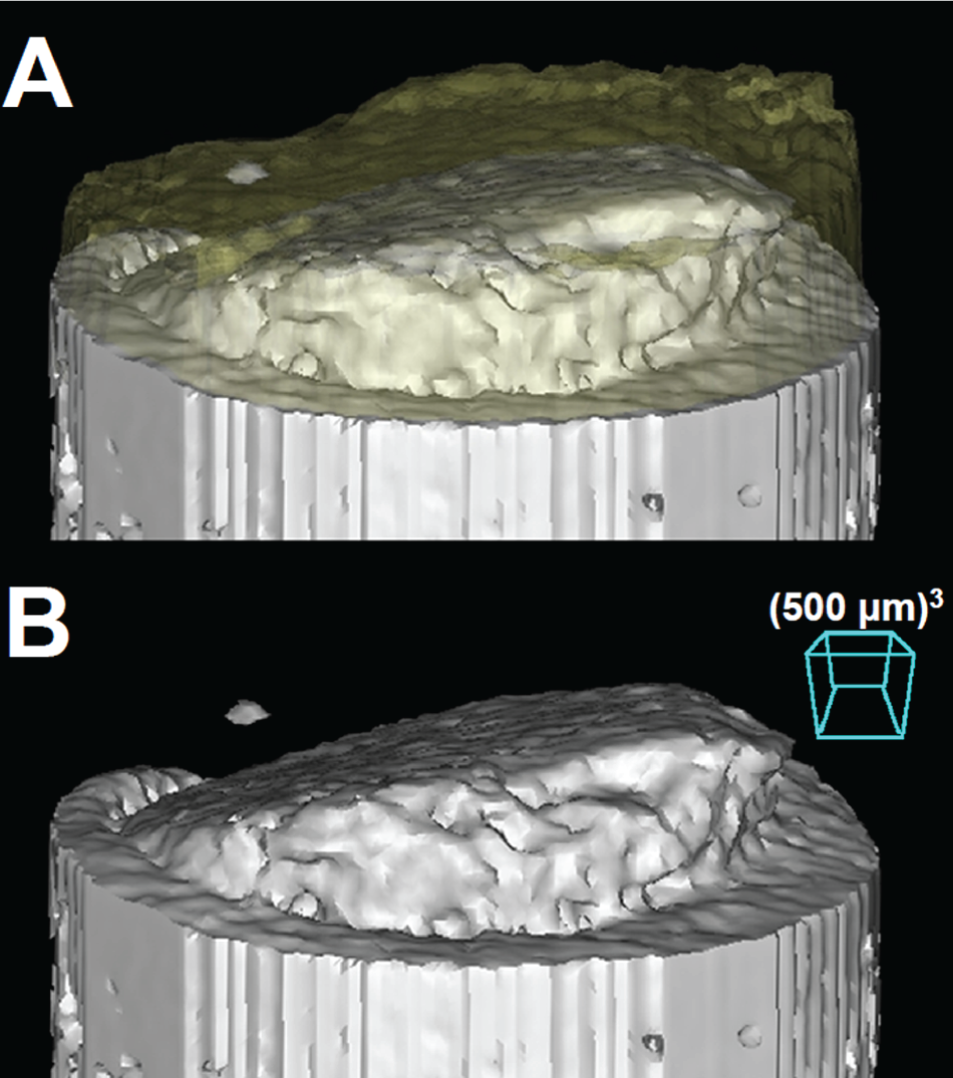
Three-dimensional bone reconstructions showing a variably proud bone-cartilage interface with respect to the adjacent host (
Cartilage Thickness and Volume
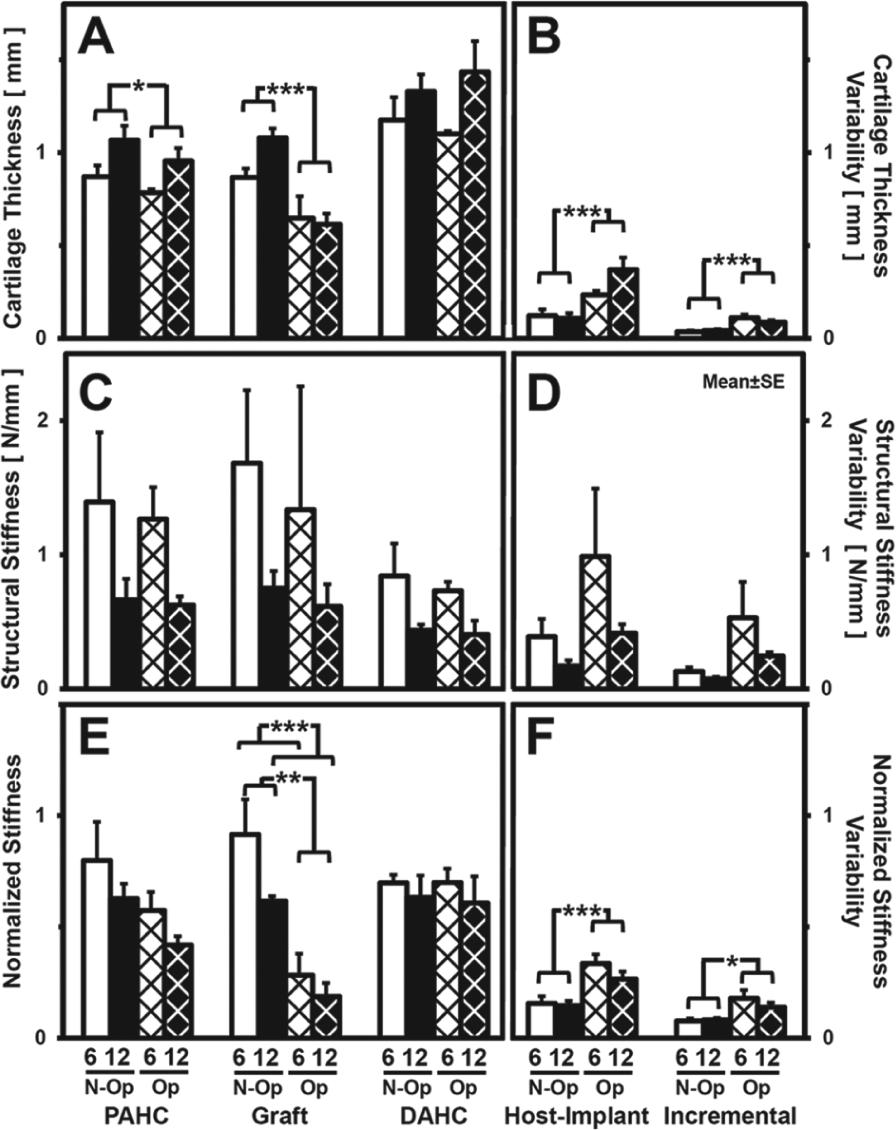
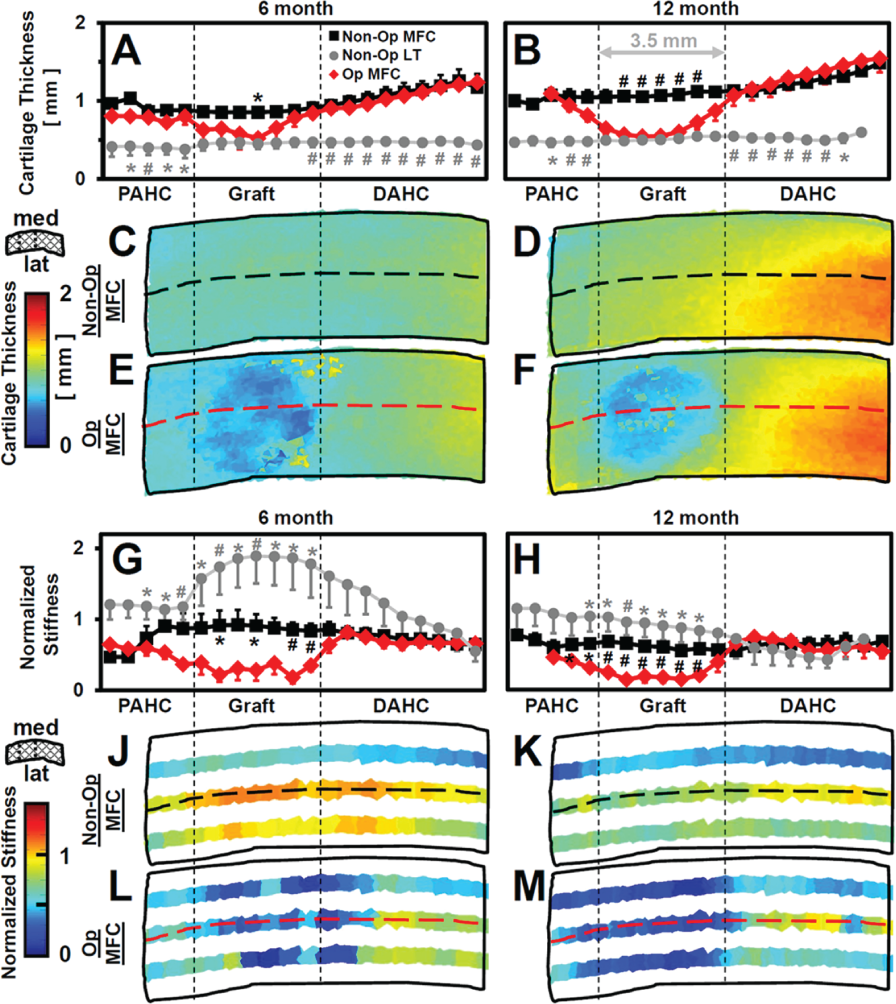
Cartilage thickness increased from proximal to distal across nonoperated joints and varied across operated grafts ( Figs. 6A and 6B and 7A - F ). In the nonoperated joint, cartilage in the MFC recipient region (0.97 mm) ( Fig. 2B and 2H ) was twice as thick as the LT donor (0.49 mm) ( Figs. 2A , 2G , 7A and 7B ), demonstrating inherent structural differences between the graft and host cartilage. Compared to site-matched locations in the nonoperated MFC, operated graft thicknesses were lower at the graft center (P < 0.005; –25% at 6 months, –43% at 12 months) and tended to be lower in the PAHC ( Figs. 6A and 7A and 7B ). Host-implant and incremental variability, 2 measures of “roughness” of properties across the joint, were both higher than the nonoperated at 6 and 12 months (P < 0.005) ( Fig. 6B ). Thickness maps across the operated surface showed low values in the graft regions ( Fig. 7C - F ).
(
(
Concomitantly, cartilage volume in the 3.5 mm diameter graft regions varied between operated and nonoperated joints (P < 0.05). Operated graft volumes at 6 and 12 months were 7.06 ± 1.48 and 7.52 ± 0.60 mm3, respectively, in contrast to nonoperated cartilage volumes in a site-matched region (8.89 ± 0.48 mm3at 6 months, 11.04 ± 0.80 mm3 at 12 months). The difference in cartilage volume between operated and nonoperated graft regions (being lower in the operated region in all samples) was 1.83 ± 1.33 mm3 at 6 months and higher at 12 months (3.52 ± 1.18 mm3; P < 0.05).
Normalized Stiffness
Cartilage stiffness varied across the joint in the proximal-to-distal direction and was lower in operated graft regions ( Figs. 6C - F and 7G - M ). Operated graft structural stiffness at 6 and 12 months was 1.22 N/mm and 0.62 N/mm, respectively, compared to 1.69 N/mm and 0.67 N/mm in the nonoperated MFC and 11.4 N/mm and 4.8 N/mm in nonoperated LT graft regions ( Fig. 6C ). Normalized cartilage stiffness of the operated graft was lower than the nonoperated MFC (P < 0.01) and decreased with time (P < 0.005) ( Figs. 6E and 7G and 7H ). In the graft region, normalized stiffness in the operated MFC was 0.28 and 0.19 for 6 and 12 months, respectively, compared to 0.92 and 0.62 for the nonoperated MFC and 1.85 and 0.90 for the nonoperated LT. Both host-implant and incremental variability of normalized stiffness were higher in operated compared to nonoperated joints ( Fig. 6F ). Stiffness maps across the operated surface showed low values extending into the PAHC and DAHC regions ( Fig. 7J - M ).
Correlation between Normalized Stiffness and 3-D Structure
Cartilage stiffness at 6 and 12 months was associated with deviations in the articular surface ( Fig. 8A and 8C ). At 6 months, normalized cartilage stiffness of operated knees was lower than the nonoperated at all articular surface deviations (P < 0.005), with lower stiffness for increasing articular recession (–17% stiffness for 0 to +0.30 mm deviation v. –54% stiffness for -0.75 mm to -0.30 mm deviation). Similarly, at 12 months, sites with articular surfaces recessed >−0.15 mm had substantially lower normalized stiffness (>−60%) than the nonoperated (P < 0.005), whereas sites near 0 mm deviation had stiffness within 15% of nonoperated values.
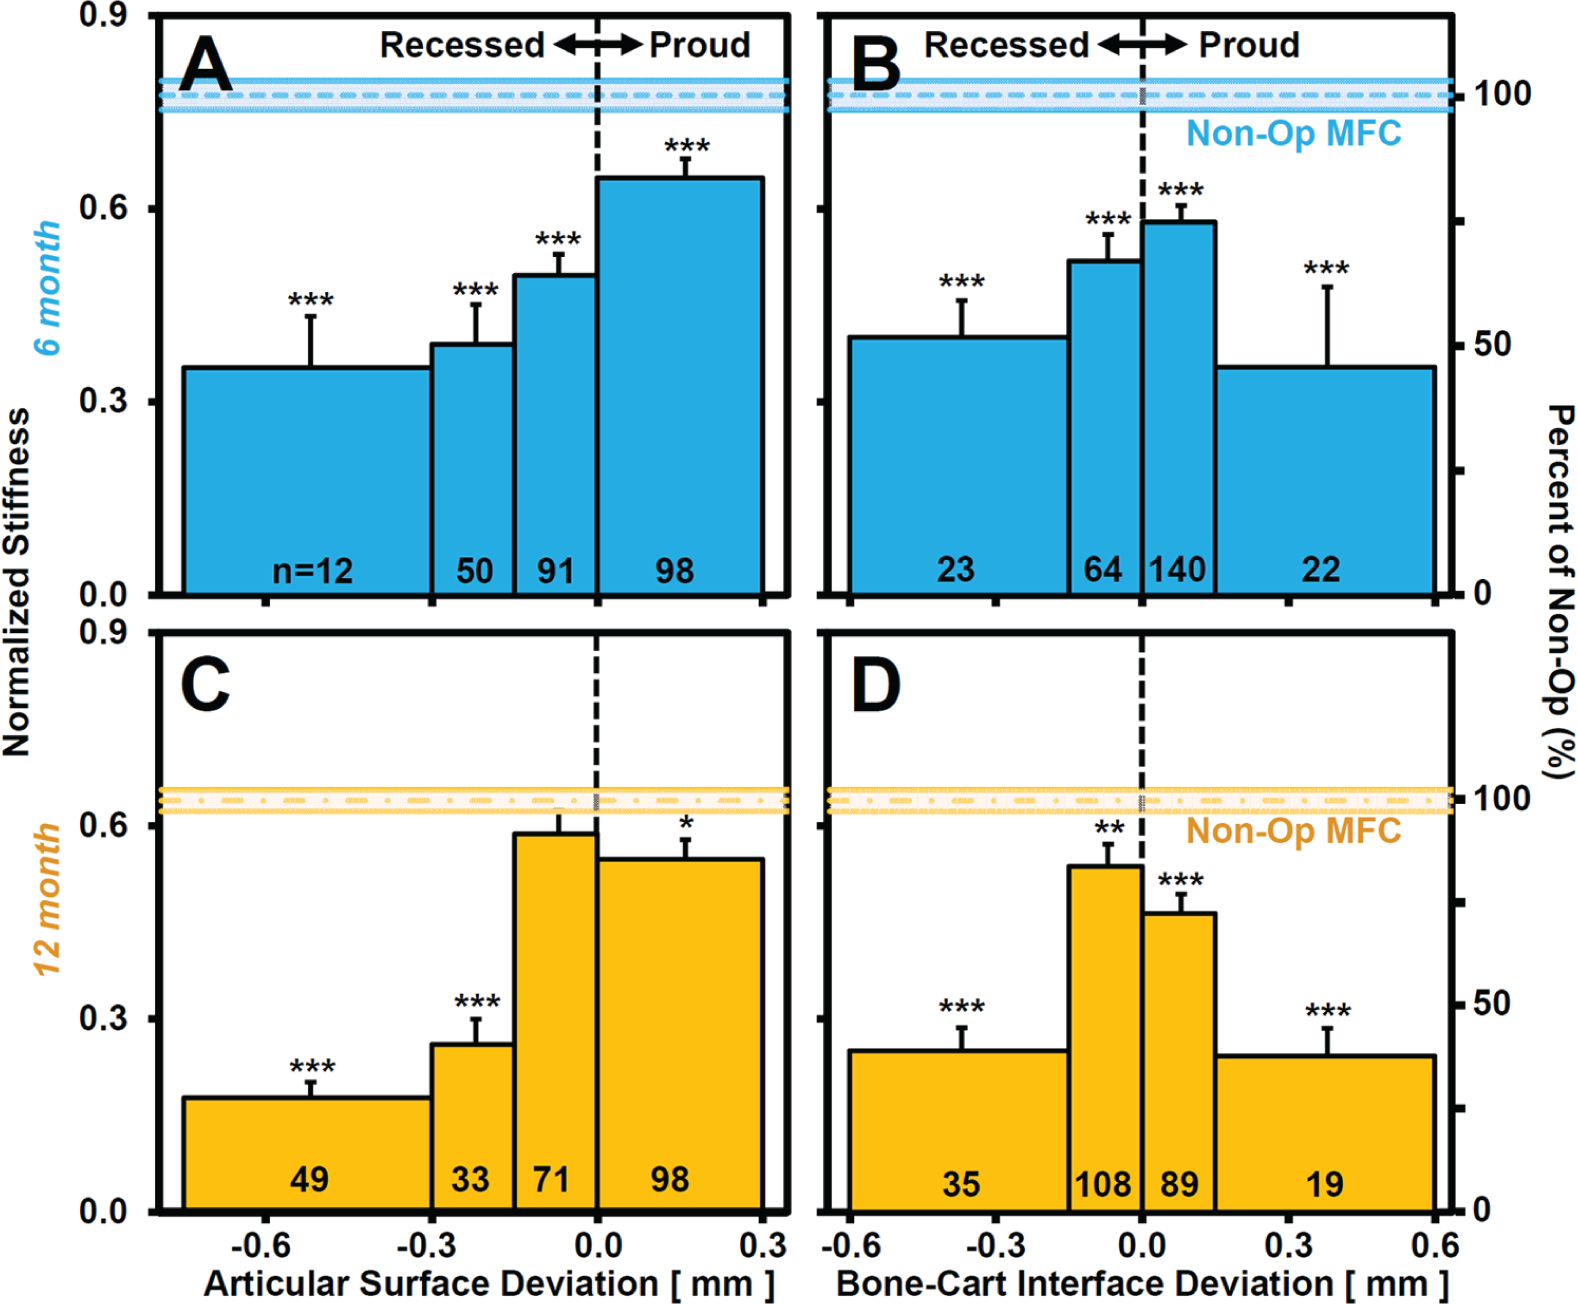
Normalized stiffness versus surface deviation of the graft and adjacent host test sites of operated joints, binned according to (
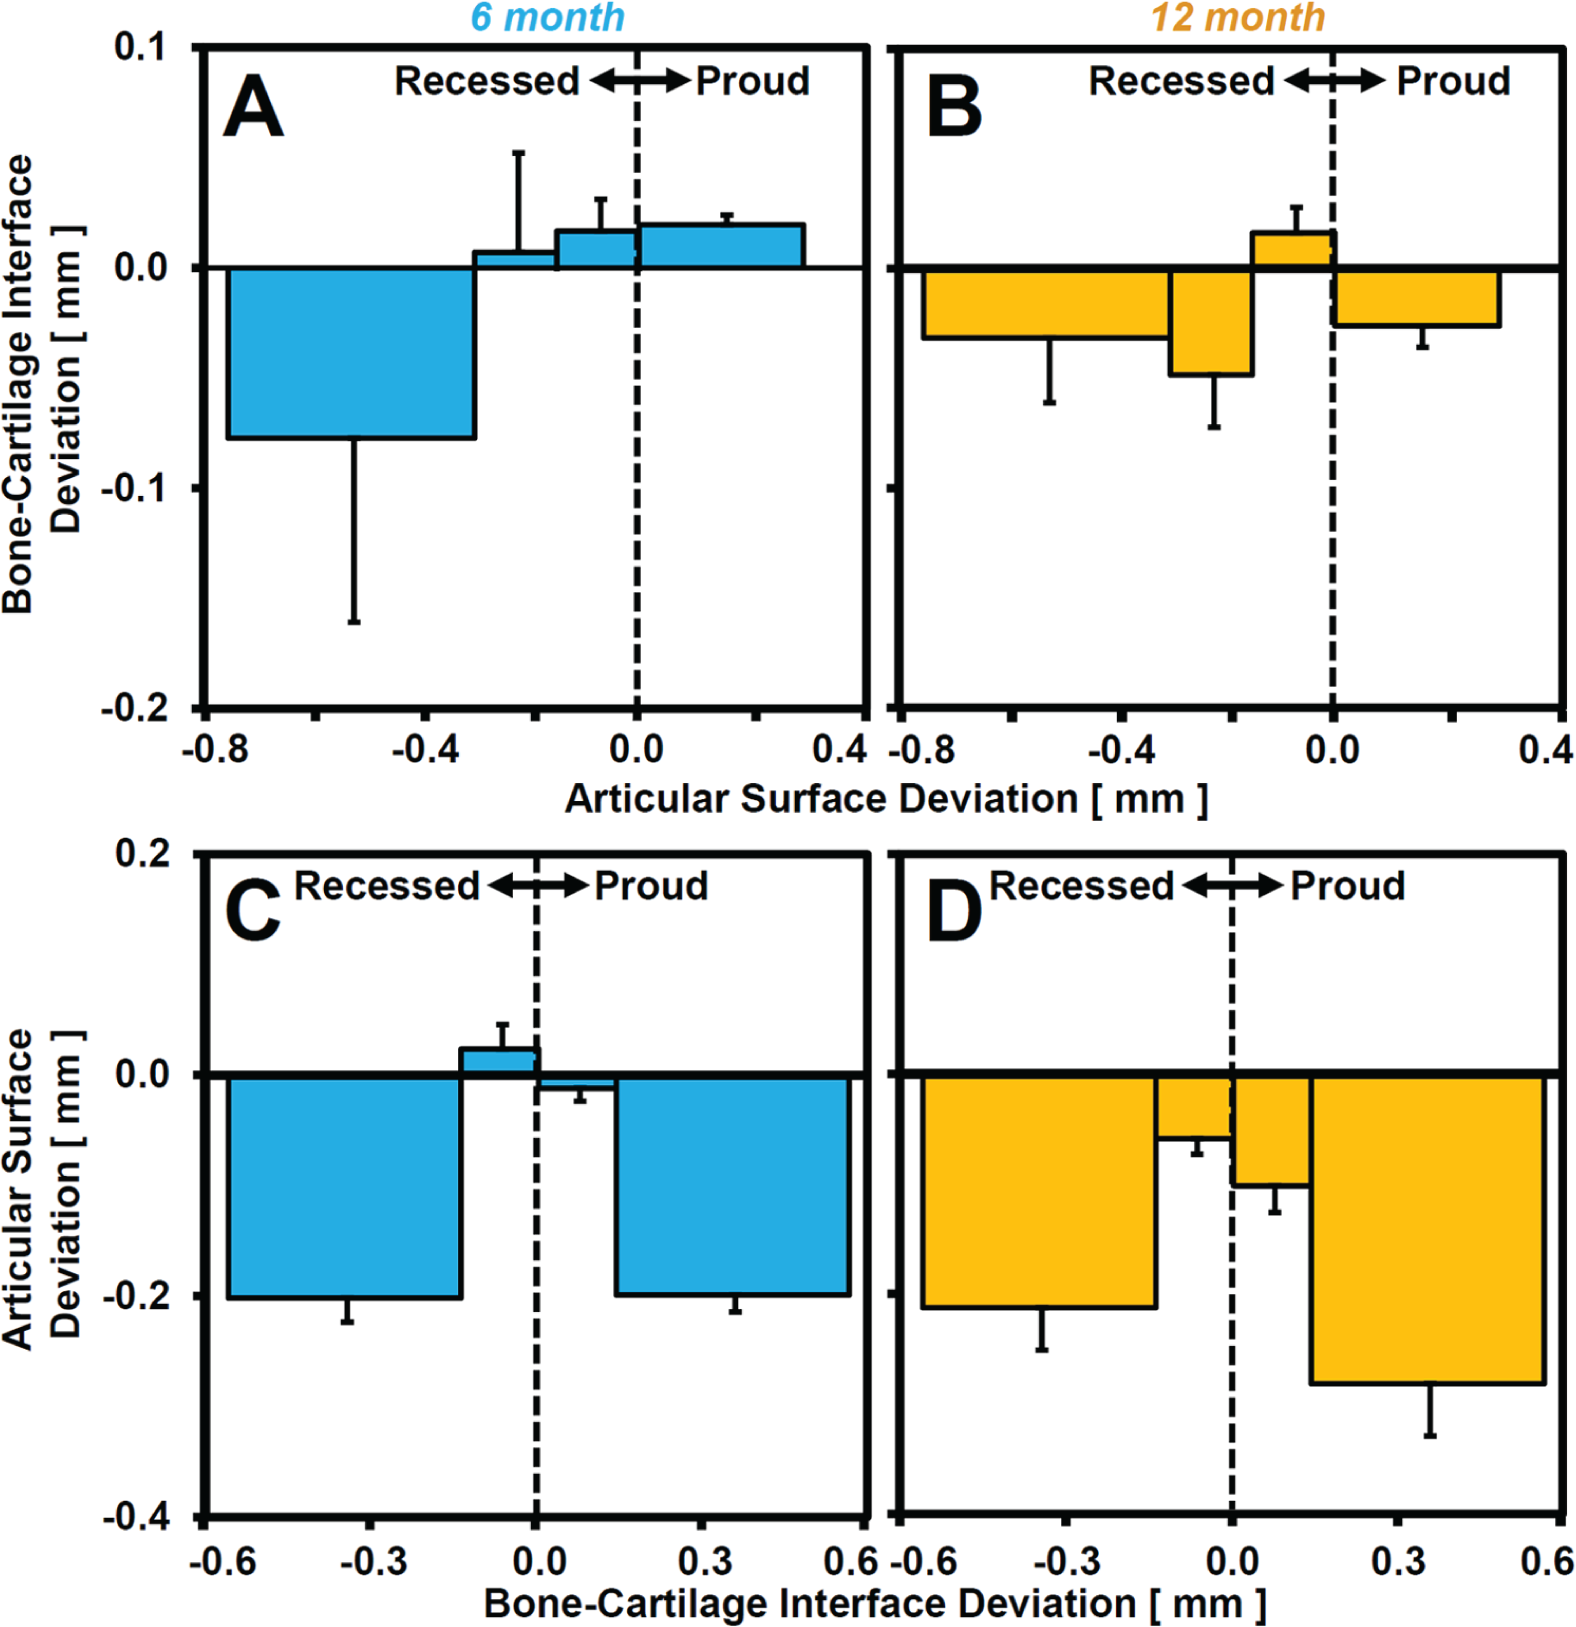
Cartilage stiffness was also associated with bone-cartilage interface deviation ( Fig. 8B and 8D ). At 6 and 12 months, normalized cartilage stiffness of operated knees with bone-cartilage interface deviations <−0.15 mm and >+0.15 mm was lower (>–50%) than nonoperated values (P < 0.005) and also lower than sites with smaller deviations (between −0.15 mm and +0.15 mm; P < 0.05).
Deviations at the bone-cartilage interface were associated with deviations at the articular surface ( Fig. 9 ). With substantial bone-cartilage interface deviation (<−0.15 mm or >+0.15 mm) ( Fig. 9C and 9D ), the articular surface was recessed (>−0.20 mm) at 6 and 12 months. In contrast, with little bone-cartilage interface deviations (between −0.15 mm and +0.15 mm), articular surface deviations were not detectable at 6 months and small (−0.10 mm) at 12 months. Conversely, deviations of the articular surface were not substantially associated with deviations of the bone-cartilage interface ( Fig. 9A and 9B ), consistent with the relationships of both proud and recessed bone-cartilage interfaces ( Fig. 9C and 9D ).
(
Discussion
This study examined the properties of the articular cartilage within and around an osteochondral autograft after 6 and 12 months in vivo and related the biomechanical quality of the cartilage to the 3-D structure of the repair region. Features of matrix and cellular deterioration were present in the graft and adjacent host regions of the operated MFC, with time-dependent recession of the operated articular surface and volume loss with respect to nonoperated structures ( Figs. 2 - 4 ). Cartilage thickness and stiffness were lower and more variable in the graft as well as proximal adjacent host regions of operated compared to nonoperated joints ( Figs. 6 and 7 ). Recession of the articular surface was associated with lowering of normalized cartilage stiffness and regions with substantial deviations at the bone-cartilage interface (proud and recessed) were associated with low normalized stiffness and recessed articular surfaces ( Figs. 8 and 9 ). Together, these results indicate that the health (v. deterioration) of operated knee cartilage, both in and surrounding the autograft, is maintained (v. altered) in association with the geometry of the articular surface and bone-cartilage interface.
A number of issues involving the graft and animal model were taken into consideration in this study. The sample size of 8 animals over 2 time points was adequate to detect significant differences between operated and nonoperated joints. However, the assessment of time-dependent effects was limited by having only 4 animals per time point. The small (Ø = 3.5 mm, h = 6 mm) graft size was chosen in order to harvest a relatively flat graft from the Spanish goat LT and avoid the groove curvature. The approach of this study was to investigate grafts placed approximately flush and assess graft properties at 6 and 12 months. Matched contralateral nonoperated joints from each animal were analyzed for direct comparison and provided indices of initial graft properties. While the treated joints were not analyzed preoperatively, with 3-D registration techniques and additional structural and biomechanical measures, it was possible to estimate location-matched geometric and stiffness properties of the donor (LT) graft based on the contralateral nonoperated joint. The interpretation of the differences in operated joints assumes negligible changes in the contralateral joint during the study. In support of this, the animals were skeletally mature (as defined by the cartilage zonal architecture and continuous calcified cartilage layer) 40 at the time of surgery and had similar thigh circumferences at harvest. However, general age-related changes may have occurred during the postoperative period.41,42 These factors should be considered in comparing conclusions from this study to those from other animal models or extrapolating results to clinical scenarios.
In the present study, 3-D articular surface deviation maps highlighted regions of cartilage recession that correlated with lower mechanical stiffness. Recession of the articular surface was time dependent within the graft (0.24 mm at 6 months, 0.37 mm at 12 months) and was also evident in the adjacent host cartilage, in agreement with histological observations ( Figs. 2C - J and 4C - F ). The trends for lower cartilage stiffness with recession of the articular surface in operated knees, and for cartilage stiffness values close to the nonoperated with small articular surface deviations ( Fig. 8A - C ), suggest that local surface deviations may influence cartilage remodeling and homeostasis. Evidence of graft subsidence is consistent with previous studies where 2-D preoperative and postoperative measurements of autograft contours indicated 0.32 mm recession in sheep MFC. 28 Articular surface recession may lead to altered mechanics, different from those needed to maintain normal cartilage viability and mechanical properties.43,44 The time course and location of altered cartilage surface geometry remain to be elucidated.
The variability in bone-cartilage interface structure, both within and between grafts, may also have contributed to the variations in cartilage homeostasis and remodeling. While grafts were initially implanted such that the articular surface was flush with adjacent host, the bone-cartilage interface was variably matched to the host. The initial implant geometry, and subsequent remodeling, may have resulted in bone-cartilage interfaces being oriented variably from flat to angled ( Fig. 5 ). The association between bone-cartilage interface location and cartilage stiffness suggests that regions of large deviations (proud or recessed) at the bone-cartilage interface may also have contributed to articular surface subsidence and lower normalized cartilage stiffness ( Figs. 8 and 9 ). These results support the idea that certain geometric features of an osteochondral graft may adversely affect repair, leading to cartilage tissue with suboptimal biomechanical properties.
The multisite array measurements36,45 of cartilage stiffness allowed characterization of stiffness properties and their variability across the joint as well as differences between the operated and nonoperated graft and adjacent host cartilage regions. The indentation technique has been well characterized46-53 and is sensitive to local cartilage degeneration 54 and the integrity of the graft-host interface.34,36 However, it has rarely 45 been used to systematically assess stiffness variability within and around a cartilage repair site. In this study, normalization of structural stiffness accounted for variable tissue thickness to reduce the variability relative to that of raw measurements; this enabled sensitive detection of graft treatment effects ( Fig. 6 ). The large number of test sites within the graft led to a precise estimate of overall tissue properties, while individual sites allowed for characterization of local variability. Host-implant and incremental variability, 2 variables computed to describe the “roughness” of parameters (i.e., thickness, stiffness) across the joint, were both higher in the operated graft compared to the nonoperated, demonstrating the inhomogeneity of graft cartilage compared to contralateral healthy cartilage. The multiple-site indentation scheme used in this study was essential to characterize the consequences of grafting on repair tissue properties due to intrasite variability.
Differences in cartilage thickness and other properties between the operated MFC, nonoperated LT, and nonoperated MFC graft regions may be due to a number of factors. In the operated graft, histological indices of deterioration (GAG depletion, chondrocyte clustering) ( Fig. 2 ) and cartilage thickening were consistent with features of early osteoarthritis (OA), while cartilage thinning and low stiffness may be related to late OA-like degeneration ( Fig. 6 ). In the nonoperated MFC, aging-related changes may have occurred during the 6- or 12-month postoperative period, with softening of the collagen network leading to increases in water content and cartilage thickness and decreases in indentation stiffness. Innate differences in thickness between contralateral joints are likely to have been minimal, as cartilage thicknesses in nonoperated distal regions of left and right MFCs were well matched. Cartilage thickening may also be associated with tidemark remodeling within the graft. While no correlation was observed between proud bone and vascular invasion, operated grafts had significantly more blood vessels crossing the tidemark closest to the articular surface compared to nonoperated donor LT and recipient MFC sites (see supplementary material), indicative of vigorous and possibly OA-like remodeling.
Thus, cartilage structure and quality within the graft likely reflect a number of factors and remodeling responses. Deleterious indices, such as chondrocyte clustering, hypocellularity, and progressive loss of proteoglycan staining with time ( Figs. 2 and 3 ), may reflect locally excessive or insufficient mechanical regulatory stimuli. Future investigations to match articular surface and bone-cartilage interface geometry and to promote remodeling to achieve native cartilage structure may lead to an increased longevity of osteochondral grafts.
Footnotes
Acknowledgments and Funding
The authors thank the In Vivo Imaging Shared Resource of the UCSD In Vivo Cancer and Molecular Imaging Center for use of their µCT machine. The author(s) disclosed receipt of the following financial support for the research, authorship, and/or publication of this article: This work was supported by the Musculoskeletal Transplant Foundation and grants from the National Institutes of Health, the National Science Foundation (NSF), and the Howard Hughes Medical Institute through the HHMI Professors Program (to UCSD for R.L.S.). Additional individual support was received through an NSF Graduate Fellowship (to E.F.C.).
Declaration of Conflicting Interests
The author(s) declared no potential conflicts of interest with respect to the research, authorship, and/or publication of this article.
References
Supplementary Material
Please find the following supplemental material available below.
For Open Access articles published under a Creative Commons License, all supplemental material carries the same license as the article it is associated with.
For non-Open Access articles published, all supplemental material carries a non-exclusive license, and permission requests for re-use of supplemental material or any part of supplemental material shall be sent directly to the copyright owner as specified in the copyright notice associated with the article.