
Abstract
Hepatitis B virus (HBV) is a well-known cause of hepatocellular carcinoma (HCC), but the regulators effectively driving virus production and HCC progression remain unclear. By using genetically engineered mouse models, we show that overexpression of hepatocyte growth factor (HGF) accelerated HCC progression, supporting the genomic analysis that an up-regulated HGF signature is associated with poor prognosis in HBV-positive HCC patients. We show that for both liver regeneration and spontaneous HCC development there is an inclusive requirement for MET expression, and when HGF induces autocrine activation the tumor displays sensitivity to a small-molecule Met inhibitor. Our results demonstrate that HGF is a driver of HBV-induced HCC progression and may serve as an effective biomarker for Met-targeted therapy. MET inhibitors are entering clinical trials against cancer, and our data provide a molecular basis for targeting the Met pathway in hepatitis B–induced HCC.
Introduction
Hepatocellular carcinoma (HCC) is the most common form of liver cancer worldwide and chronic infection with hepatitis B virus (HBV) is one of the major causes. 1 HBV infection causes chronic liver inflammation, subsequent cirrhosis, and ultimately malignant progression to HCC. The underlying mechanism that leads to the malignant transformation and the role of chronic virus infection are not clear, but the identification of proteins that function in HCC progression may be the first step toward reducing the chronicity and the carcinogenicity of infectious viruses. 2 In transgenic (Tg) mouse models, overproduction of the HBV L envelope protein alone was sufficient for forming HBV surface antigen (HBsAg) particles, which accumulated at high concentration in hepatocytes produced severe liver injury that led to neoplasia. 3 Thus, inappropriate expression of a gene for a single viral protein, HBsAg, is sufficient in mice to cause malignant transformation in the liver.
The importance of the hepatocyte growth factor (HGF) and MET proteins in liver morphogenesis was early recognized and the regulation of liver function by modifying the HGF/MET pathway has been widely studied. Because knock-out (KO) mice for Met 4 or Hgf5,6 are both embryonic lethal, conditional Met KO mice were developed for analyzing the physiological roles of Met. Liver-specific Met KO mice have a normal life span with no histological abnormalities, but after hepatectomy or chemically induced liver injury, the mice show delayed or failed liver regeneration or repair. 7 MET is activated by pathological stimulation, especially from liver injury. Overexpression in mice of mouse Hgf results in significant liver enlargement and accelerated liver regeneration after partial hepatectomy. 8 Studies using Met Tg mice have demonstrated that overexpression of Met alone is sufficient for developing HCC.9,10
Genome-wide surveys of HCC have shown that the integration of HBV into the genome of liver cells promotes neoplasia, and whole-genome sequencing of virus-induced liver cancers has revealed that mutations in chromatin regulators like arid1a, -1b, and -2 frequently influence the etiological background of HCC. 11 Also, the number of HBV integrations is associated with patient survival outcome. 12 Recent genomic studies have shown that HCC patients who have different prognoses also have different gene expression patterns.13,14 An MET-regulated expression signature was found to represent a subset of human HCC that had an aggressive phenotype and poor prognosis. 15 Despite these studies, how the HGF/MET pathway regulates the pathogenesis of HBV-caused HCC is largely unknown. Here, we report that liver tumors from human HGF (hHGF) transgenic (Tg) mice have gene expression patterns virtually the same as those from HBV-positive HCC patients, which corresponds to those patients with poor prognosis. This provides us with an important animal model for studying HCC tumor biology and for preclinical evaluation of therapeutic drugs against HCC. We also show that when these mice are also transgenic for HBsAg, the HBV antigen is markedly amplified in the circulation, and in the liver, promoting inflammation of liver.
The success of molecular targeted therapy in cancer depends on knowledge of essential pathways that contribute to tumorigenesis and the molecular targets that control pathway activity. Recently, HGF/MET signaling has been shown to play a crucial role in the tumor microenvironment by promoting drug resistance16-18 as well as providing a target in a cell autonomous fashion when signaling is autocrine and the tumor cells are addicted to the HGF/MET pathway. MET inhibitors are entering clinical trials against several types of cancers, including HCC (www.vai.org/metandcancer) and therefore biomarkers are needed that can accurately identify patients who may benefit from MET-targeted therapy. Our findings show that HGF/MET signaling markers are crucial determinants in generating HCC and predict sensitivity to MET inhibitors. This provides potential biomarkers for applying MET-targeted therapy against HBV induced and HGF-driven HCC.
Results
Overexpression of HGF is a strong driver of hepatic carcinogenesis
Sakata et al. 8 overexpressed mouse Hgf as a transgene (mHgf Tg) and showed that Hgf alone can cause liver enlargement and induce liver tumors. Hgf does not activate human MET,19,20 while human HGF Tg is a potent activator of both human and mouse MET. We developed a mouse model with a human HGF transgene (C3HSCIDhHGF) and showed an enhancement of tumor growth with numerous MET-positive cancer cell lines.21,22 Here, we have used SCID minus C3H-hHGF mice to allow tumors to develop on an immunocompetent background. The presence of mouse IgG was confirmed in all tested offspring. The strain, C3HhHGF, shared the same phenotypes as SCIDhHGF mice, including elevated human HGF titer in serum, an enlarged liver (Fig. 1A and B), and black tails that allow easy genotyping. In spite of their immunological competency, C3HhHGF mice develop a high incidence of HCC (92.3%) (Suppl. Table S1), and those HCCs showed high vascularity and a pleomorphic nuclear appearance (Fig. 1C). In spontaneous liver tumors, the existence of an hHGF transgene was confirmed by fluorescence in situ hybridization (FISH) analysis (Fig. 1D). Expression of the hHGF transgene induced gain of mHgf copies, and in some cases mHgf amplification of 8 to 30 copies was observed. These results support the idea that hHGF is a strong driver for HCC progression by inducing chromosomal changes related to the HGF/MET pathway.
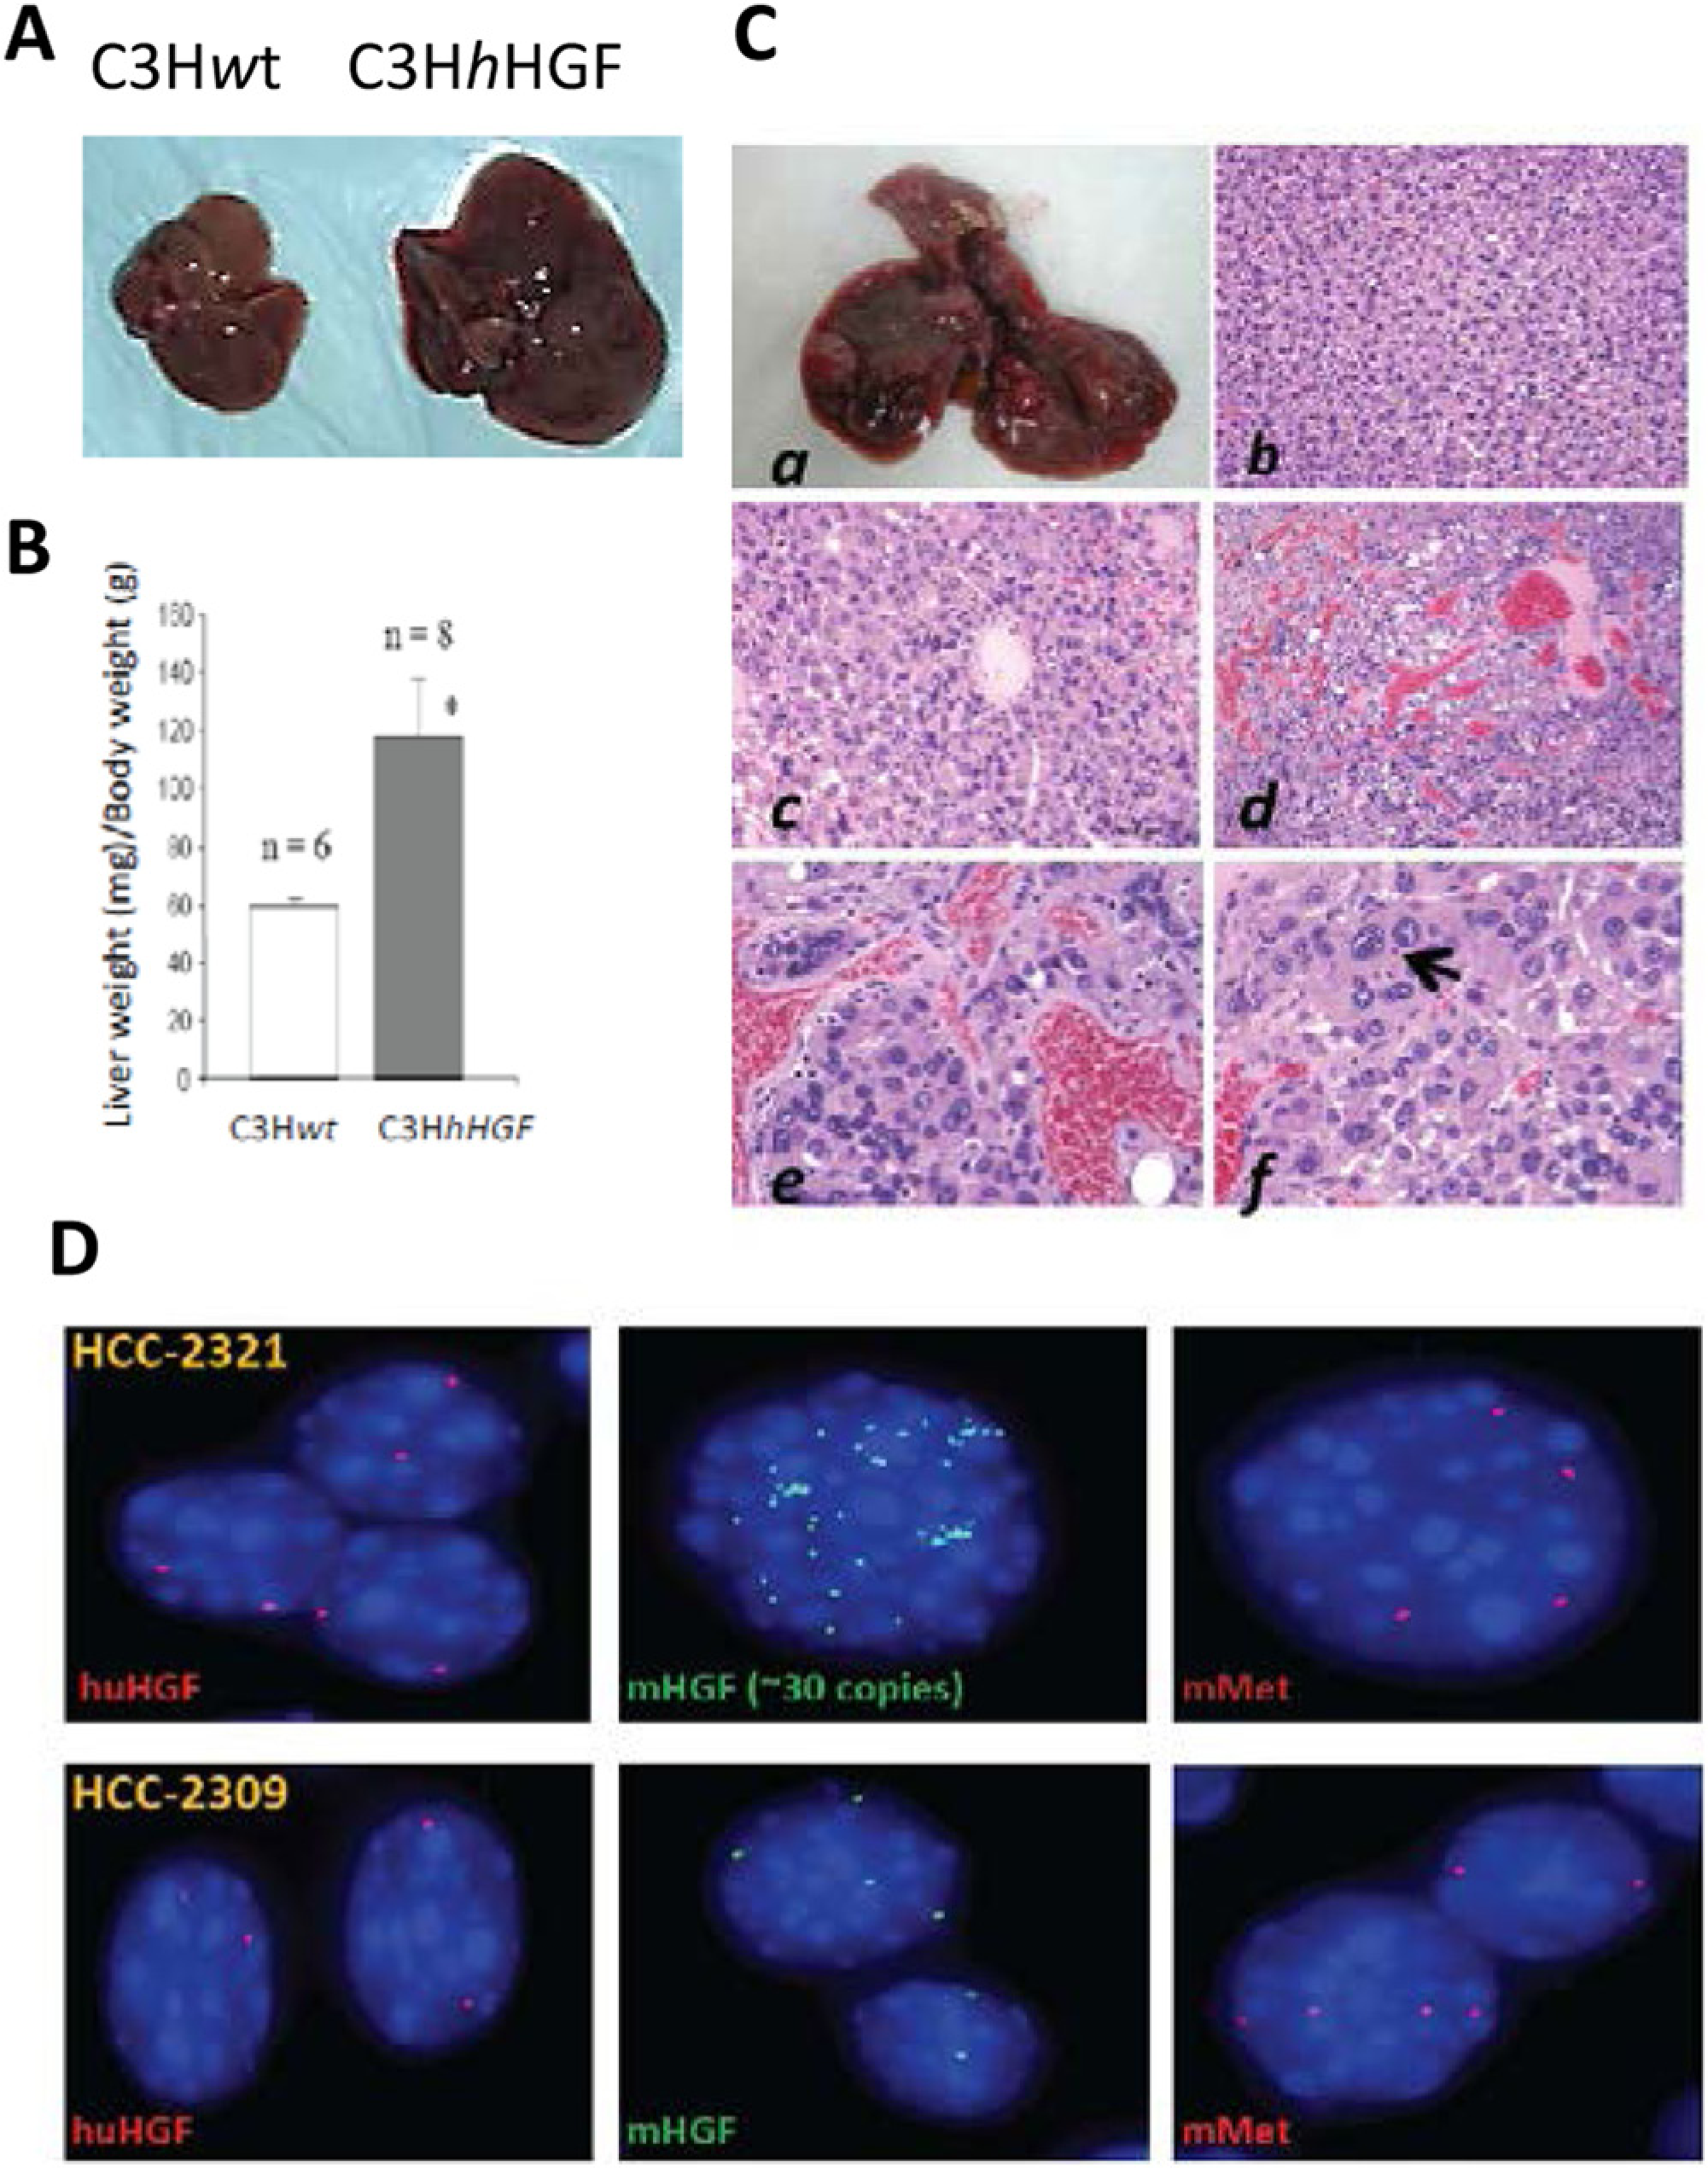
Overexpression of hHGF induces spontaneous HCC. (
HGF accelerates HCC progression in an HBsAg mouse model
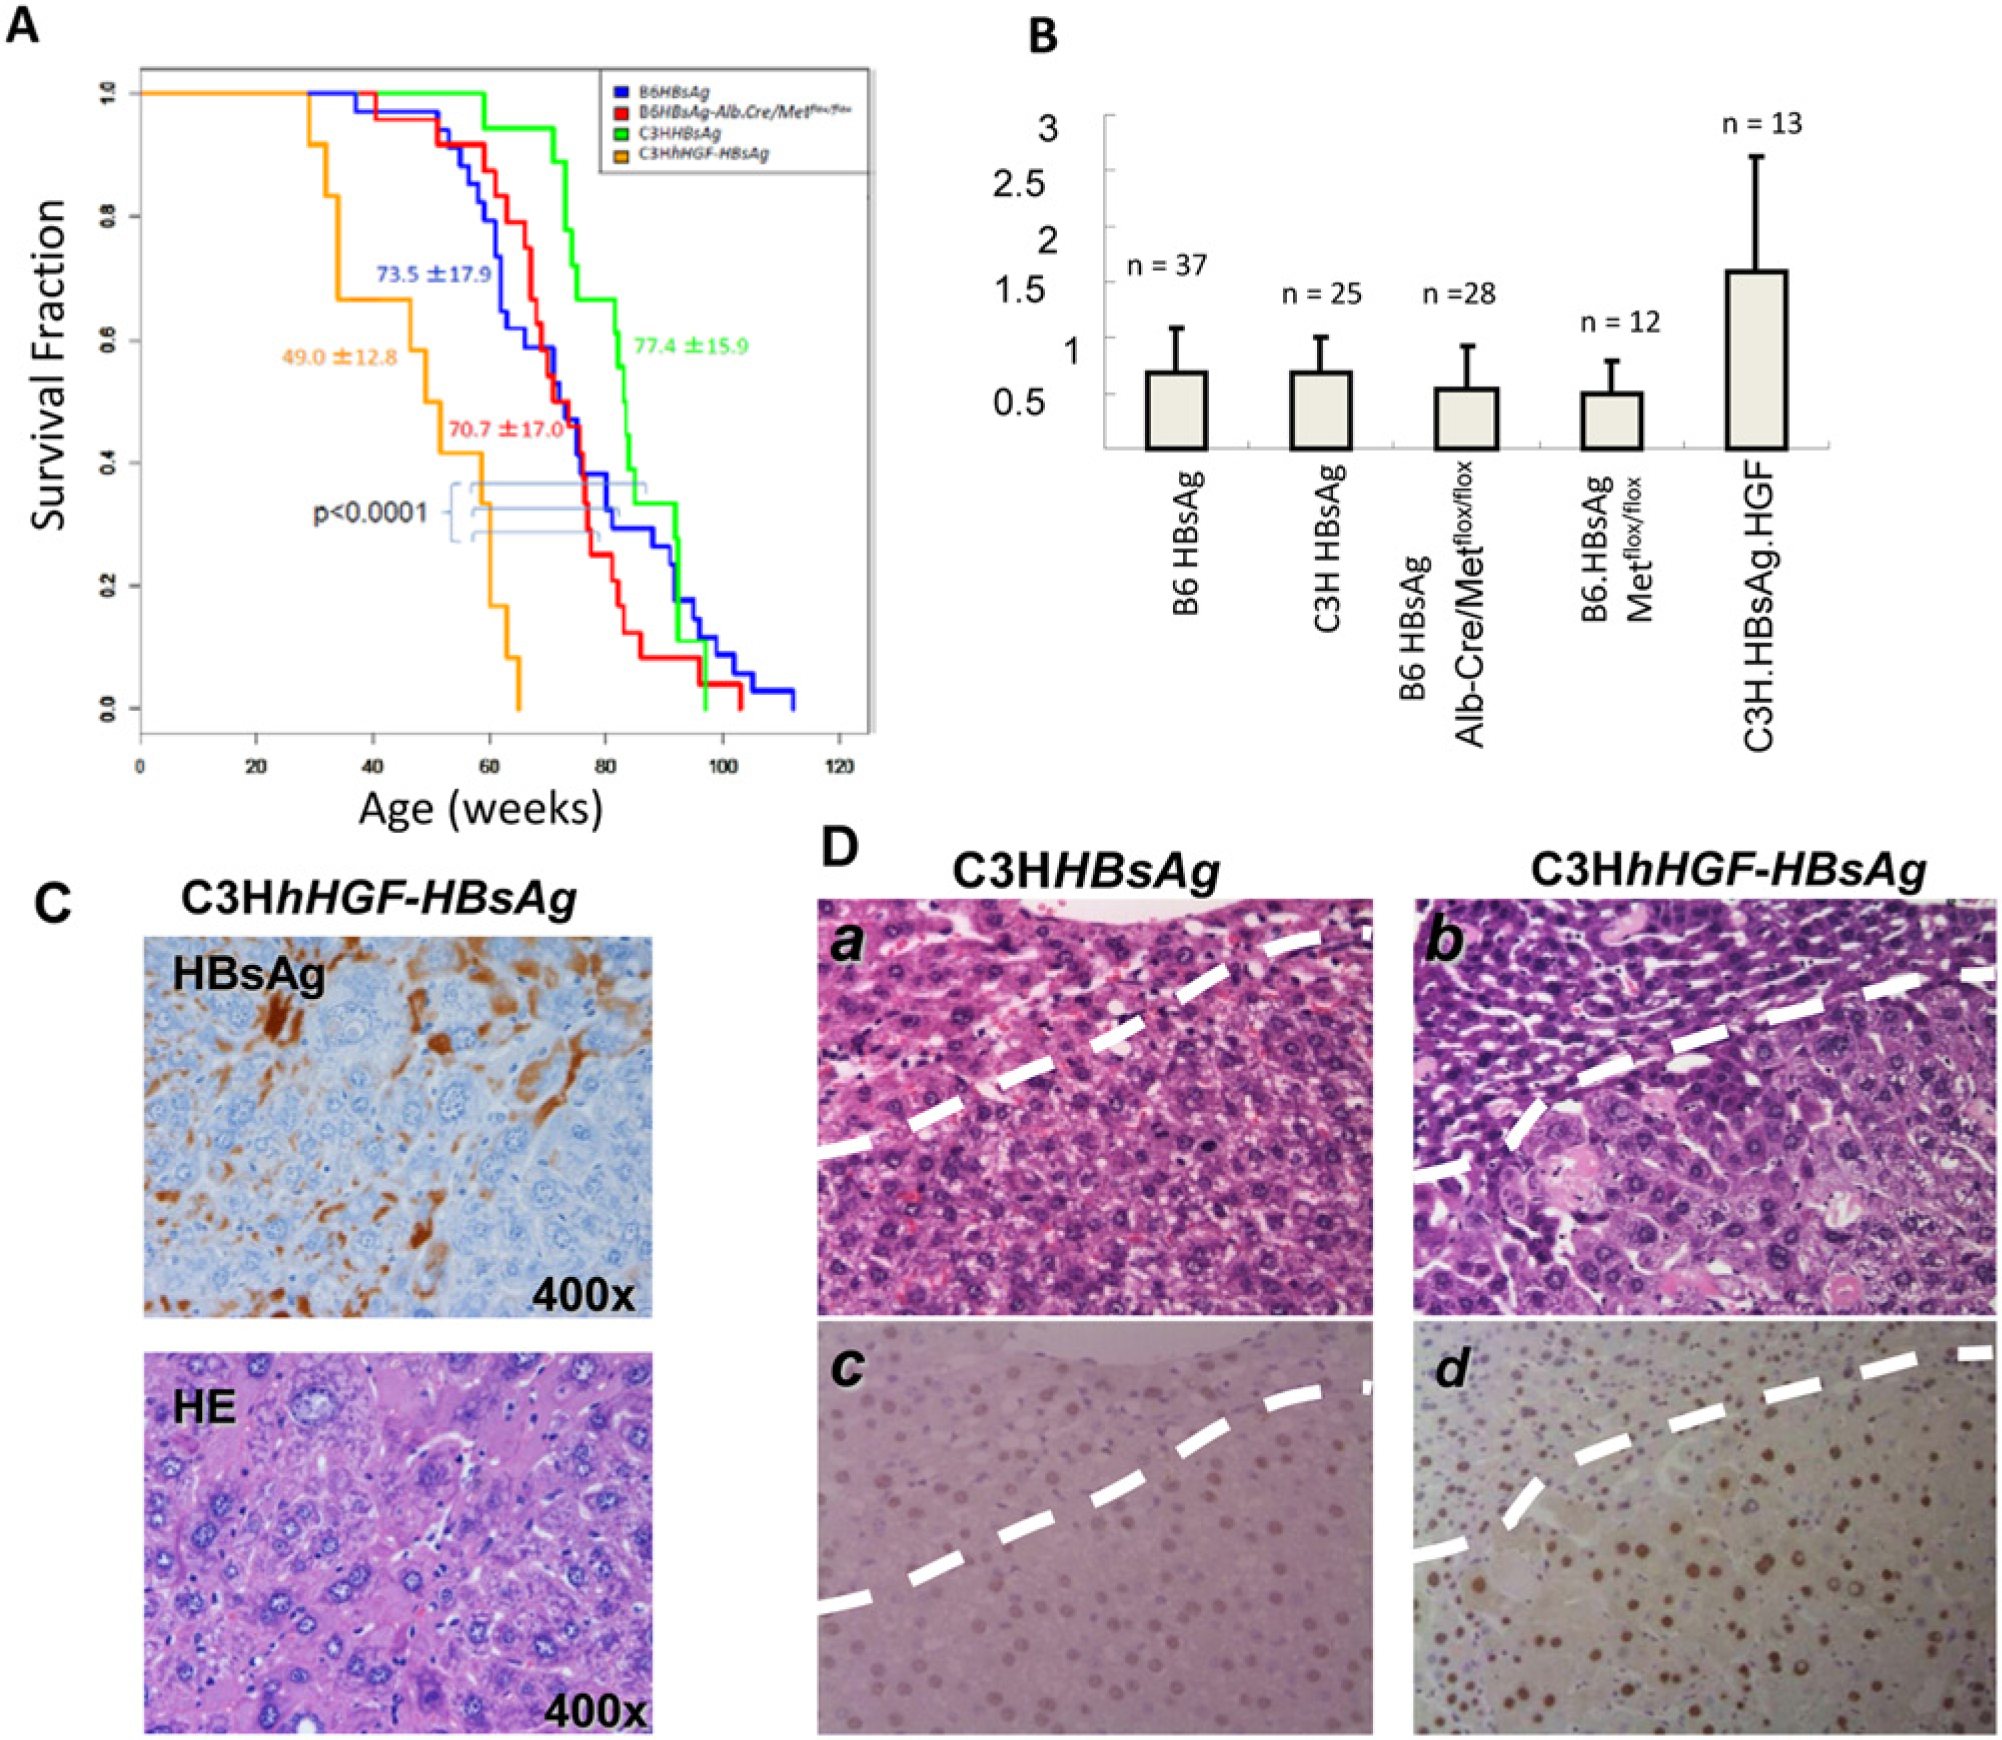
Because of the importance of HGF and HBV in causing HCC, we have begun to investigate whether there is an influence of HGF overexpression on HBsAg-induced HCC. B6 mice bearing an HBsAg transgene mediated liver cell injury, which became overt at about 12 months of age, and tumors were palpable slightly before or simultaneous with the rise in serum AFP levels. 3 We first determined if there was an influence of genetic background on tumorigenesis, and C3Hwt mice were continuously back-crossed with B6HBsAg mice to produce the C3HHBsAg strain. The incidence of HCC and the average survival time were compared between B6HBsAg and C3HHBsAg mice (Suppl. Table S1). The incidence of HCC with B6HBsAg mice was 94.6%, and 76.0% with C3HHBsAg mice. C3HHBsAg mice showed slower onset of liver tumors suggesting that HBsAg Tg mice with a C3H background have a more HCC-resistant phenotype than those with a B6 background. However, there was no statistically significant difference in the average survival time (C3HHBsAg 77.4 ± 15.9 weeks vs. B6HBsAg 73.5 ± 17.9 weeks; Fig. 2A). To compare HGF overexpression with HBV-induced HCC, we crossed C3HhHGF mice with B6HBsAg Tg mice, creating the C3HhHGF-HBsAg strain. The C3HhHGF-HBsAg mice showed a significantly reduced survival time relative to B6HBsAg (49.0 ± 12.8 weeks vs. 73.5 ± 17.9 weeks, P < 0.0001) and to C3HHBsAg mice (49.0 ± 12.8 weeks vs. 77.4 ± 15.9 weeks, P < 0.0001; Fig. 2A), as well as an increased HCC incidence (100% vs. 94.6% or 76%; Suppl. Table S1). These results show that stimulation by HGF is clearly more potent compared to the HBsAg in either a B6 or a C3H background, indicating HGF is an efficient driver. However, HGF could function by influencing HBsAg production. To test whether HGF functions by regulating HBsAg production, we compared the serum titers of HBsAg in 5 mouse strains that possess the HBsAg transgene. C3HhHGF-HBsAg mice had the highest titer, at almost twice that of other animals (Fig. 2B), indicating that overexpression of hHGF may increase the HBsAg production in hepatocytes and therefore synergize to promote HBV-caused HCC initiation. Because HBsAg production induces liver cell injury and stimulates the cycle of cell death and liver regeneration, 3 the histological expression of HBsAg in the liver tissue of C3HhHGF-HBsAg immunocompetent mice was studied. In the lesion where the production of HBsAg is remarkable, significant infiltration of lymphocytes and regeneration of hepatocytes of varied cell sizes was obvious (Fig. 2C). Pathologically, C3HhHGF-HBsAg mice developed multifocal HCC of higher malignancy (grade III in Edmondson’s classification) and developed more solid tumor nodules in the liver than did C3HHBsAg mice (Fig. 2D). Tumor cells from C3HhHGF-HBsAg mice were pleomorphic, and nucleoli and pseudoinclusion bodies were obvious. While C3HHBsAg mice showed no clear difference between nontumor and tumor regions in terms of Ki67 staining and intensity, C3HhHGF-HBsAg mice showed significantly stronger Ki67 staining within the tumor, supporting a fast-growing HCC phenotype.
Characterization of HCCs from GEM Models. (
Met is essential for HBsAg-induced HCC carcinogenesis
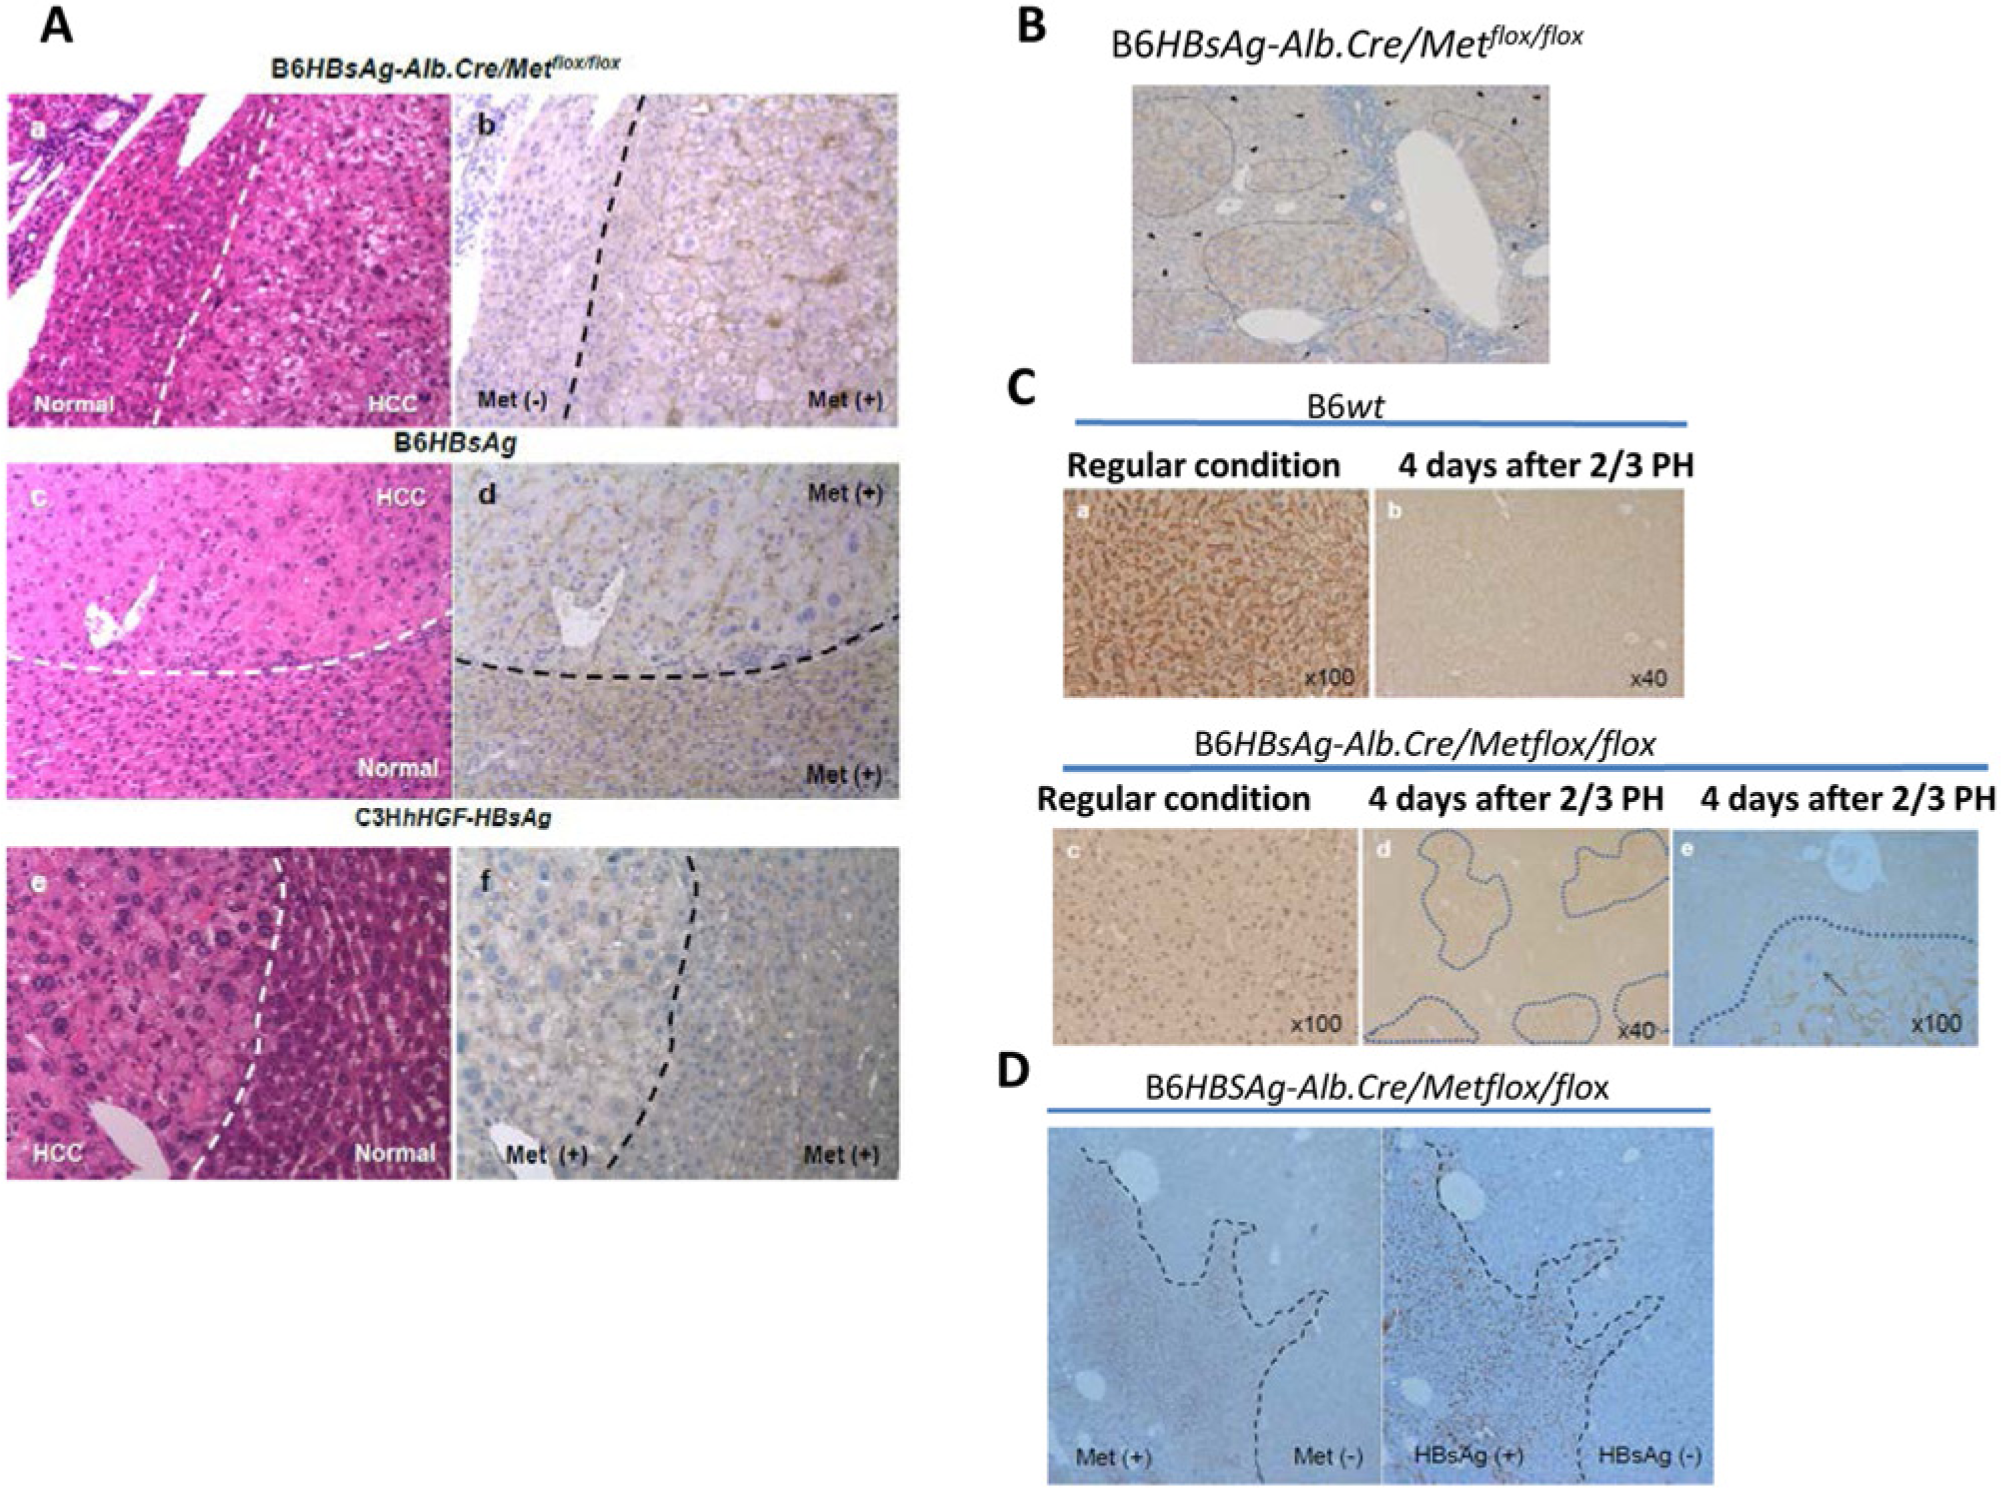
Because HGF-Met signaling is considered to play an important role in HCC formation, we expected that knocking out Met expression in HBsAg Tg mice would reduce HCC occurrence. To test this, we crossed B6HBsAg mice with a liver-specific Met KO mouse model under control of the albumin promoter (B6Alb.Cre/Metflox/flox; Suppl. Fig. S2A). Surprisingly, almost all the offspring (B6HBsAg-Alb.Cre/Metflox/flox) developed HCC (Suppl. Table S1) and had survival times similar to those of B6HBsAg mice (see Fig. 2A). More important, immunohistochemical staining showed that while all tumors from the B6HBsAg-Alb.Cre/Metflox/flox mice showed Met expression, the surrounding normal tissues remained Met-negative (Fig. 3Aa, b). In contrast, both B6HBsAg and C3HhHGF-HBsAg mice showed Met-positive staining in all tumors as well as in surrounding normal tissues (Fig. 3Ac-f). Moreover, the B6HBsAg-Alb.Cre/Metflox/flox mice frequently showed Met-positive regeneration nodules during inflammation (i.e., infiltration of lymphocytes in perivascular areas as well as in the liver parenchyma) before HCC carcinogenesis (Fig. 3B). These results indicate that the Met knock-out in the Alb.Cre/Metflox/flox mice was incomplete, so that the residual Met-positive hepatocytes were able to grow in response to microenvironmental stimuli and produce tumors.
Met is required for hepatocyte regeneration and HCC progression in HBsAg Tg mice.
(
To capture the early functional response from Met-positive hepatocytes in liver pathogenesis, we performed partial (2/3) hepatectomy in B6Alb.Cre/Metflox/flox mice to see whether liver injury could initiate Met-positive hepatocyte growth. In these liver-specific Met-KO mice, which always showed Met-negative livers under regular conditions (Fig. 3Ca, c), Met-positive nodules started to appear as early as 4 days after surgery (Fig. 3Cd), and all mitotic hepatocytes were Met-positive (Fig. 3Ce). Although it is not clear how these Met-positive cells escaped the original knock-out process, it is convincing that Met is required for liver repair and regeneration in response to injury in this model. 7 We also asked whether the expression of HBsAg resulted in Met-positive hepatocytes in the Met-KO mice. We found that before HCC was observed in aged B6HBsAg-Alb.Cre/Metflox/flox mice, liver nodules were expressing both Met and HBsAg (Fig. 3D). Thus, long-term exposure to HBsAg may cause liver damage that in turn initiates Met-positive hepatocyte growth, which causes HCC.
Characterization of gene expression profiles of mouse HCC and human HCC
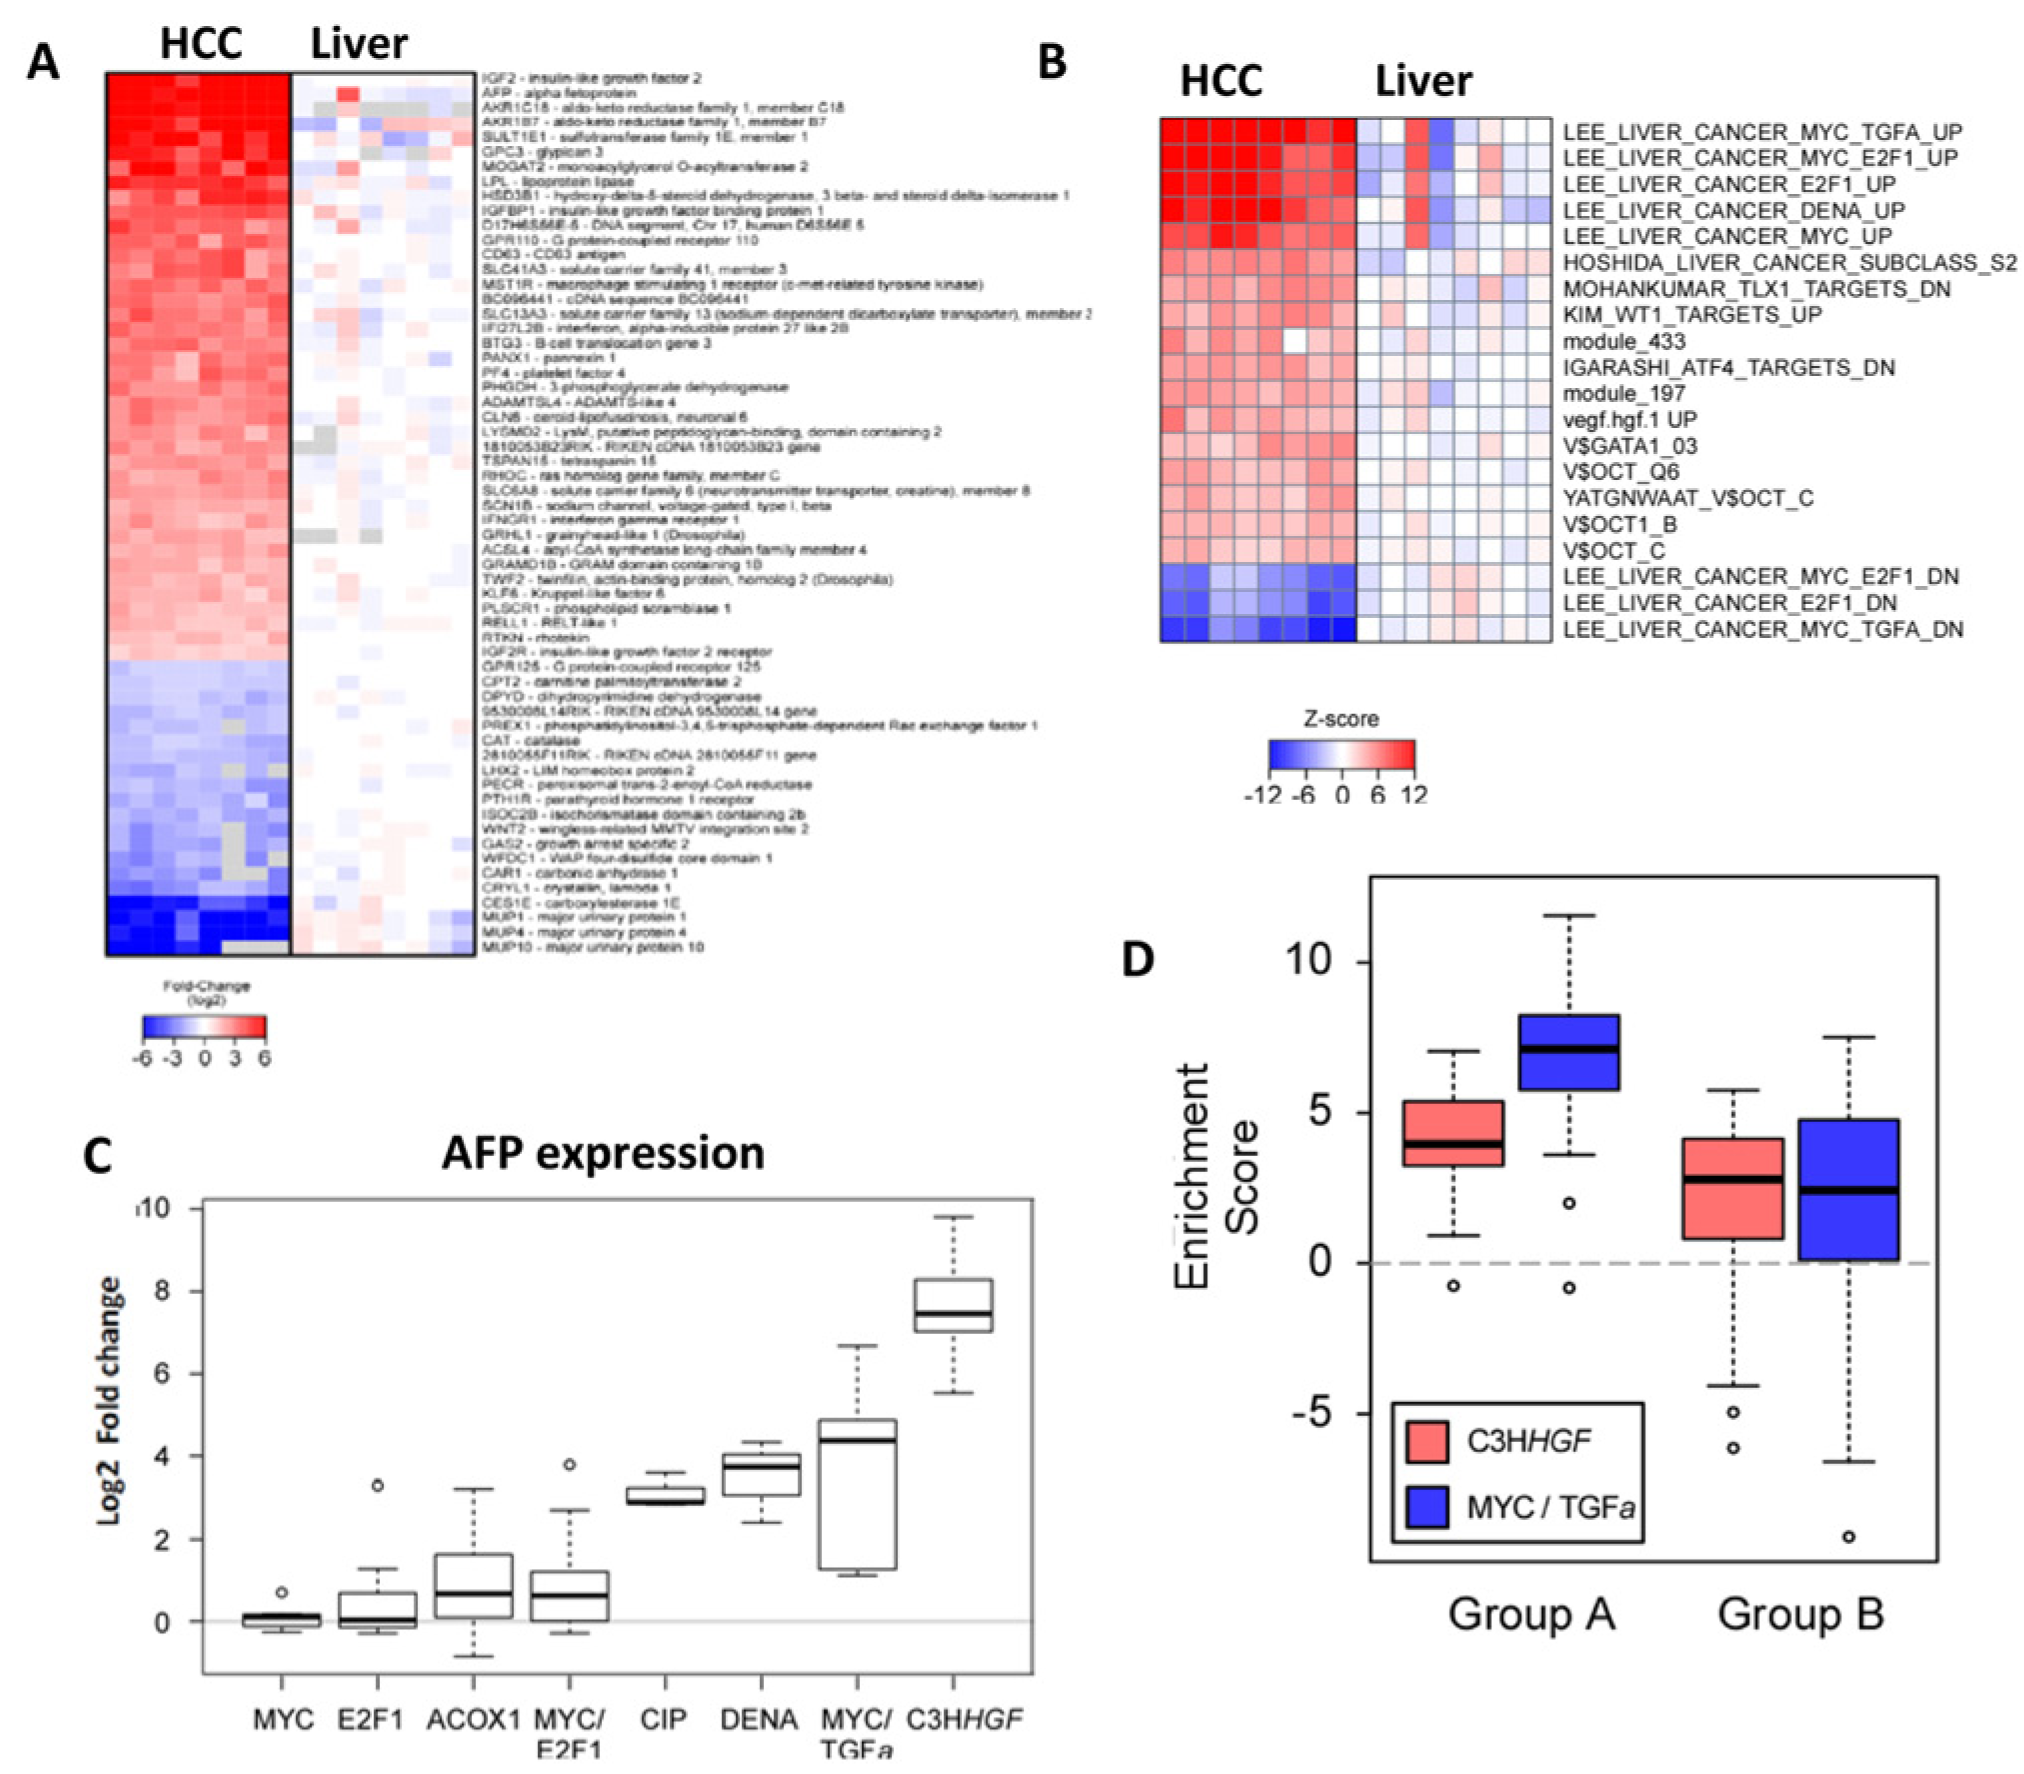
Because C3HhHGF mice developed HCC and had a very short survival time (average = 41.6 ± 4.7 weeks) (Suppl. Table S1), hHGF was considered to be the leading factor determining HCC malignancy. We therefore used microarray analysis to compare the gene expression patterns of HCC tumors from C3HhHGF mice and of liver tissues from C3Hwt mice of the same age and gender to identify the hHGF dependent molecular signatures in this HCC mouse model. We found that 2,949 out of 20,698 genes were significantly up- or down-regulated in C3HhHGF mice (false discovery rate < 0.05). The 60 genes having the largest differences in expression are shown in Figure 4A and Supplementary Table S2.
Molecular signature of the HCC from C3HhHGF mouse model.
(
To identify coordinated gene expression changes in HCC from C3HhHGF mice, we performed gene set enrichment analysis. Using the Kim and Volsky method, 23 6,856 gene sets were examined and the z-scores from the log2-transformed fold-change values for each tumor-versus-normal comparison were computed. Gene sets that were differentially expressed were identified by an approach similar to that used to identify discriminant genes, and the 20 gene sets having the largest differences in expression were identified (Fig. 4B). Many of the signatures enriched in our C3HhHGF model were described by a prior study 24 evaluating 7 HCC mouse model and 91 human HCC genetic profiles, with a majority of those cases having HBV infection. Those authors concluded that Myc-Tgfα Tg mice represented the best-fit mouse model for studying human HCC because of the high resemblance to HCC from patients with poor prognosis.
Because α-fetoprotein (AFP) is a classic diagnostic for HCC, we compared our C3HhHGF mouse model against Lee’s 7 mouse models and found that our C3HhHGF mice had the highest AFP expression (Fig. 4C). Moreover, our C3HhHGF model showed a high degree of similarity in gene expression to the Myc-Tgfα mouse model. Of the 58 up-regulated genes reported in the “LEE_LIVER_CANCER_MYC_TGFA_UP” signature, 24 54 matched our microarray data (Suppl. Fig. S1A), with 33 of these genes being significantly up-regulated (Fisher test, P < 2.2 × 10⁻¹⁶) based on our “C3HhHGF_UP” signature. Similarly, the down-regulated genes enriched in the “LEE_LIVER_CANCER_MYC_TGFA_DN” signature were also highly enriched in our “C3HhHGF_DOWN” signature. Of the 59 down-regulated genes in the signature reported by Lee et al. (“LEE_LIVER_CANCER_MYC_TGFA_DOWN HUMAN_GENE_SYMBOL”), 58 matched our microarray data (Suppl. Fig. S1B), with 31 of them being significantly down-regulated (Fisher test, P < 2.2 × 10⁻¹⁶) based on our “C3HhHGF_DOWN” signature.
Because the Myc-Tgfα mouse model was reported to be strongly associated with human HCC cases that had poor prognosis, we compared the C3HhHGF and Myc-Tgfα models against human HCC. 24 Genes that were up-regulated in tumors from C3HhHGF (n = 1,160) and Myc-Tgfα (n = 1,380) mice were interrogated in the gene expression profiles of human liver tumors that were associated with overall shorter survival (Group A cluster) and overall longer survival (Group B cluster) (Fig. 4D). We found that our C3HhHGF mouse model showed higher enrichment scores in the A group, as did the Myc-Tgfα model, suggesting that both models propagate molecular signatures that are associated with human HCC and that are indicative of overall shorter survival.
HGF is also a key factor for hepatitis C virus–caused HCC
Hepatitis C virus (HCV) infection is another major cause of HCC. We asked whether overexpression of HGF occurs in HCV-caused HCC and whether the signatures from HCV-positive tumors can be found in C3HhHGF tumor models. We analyzed 2 separate HCC data sets based on paired liver biopsy samples from 32 HCC patients with HCV infection (Suppl. Fig. S3A). Each paired sample was taken from an HCC nodule and a nonadjacent non-HCC region collected during surgery. Thirteen normal and HCV-negative liver samples obtained from patients undergoing laparoscopic cholecystectomy were used as healthy controls. 25 Relative to healthy controls, 78% of tumors (25 out of 32) showed overexpression of HGF. In the paired samples, 16 out of 32 tumors (50%) showed HGF expression that averaged 4-fold higher than in the paired nontumor sample. Using an unpaired Student’s t test with a cutoff of P < 0.05, we compared HCC with HGF overexpression to its paired nontumor tissue and identified 5,980 differentially expressed genes. Applying Ingenuity Pathway Analysis, up-regulated HGF and VEGF signatures were found in these tumors (Suppl. Fig. S3B), which is consistent with the finding that the vegf.hgf.1_UP gene set is in the 20 most up-regulated signatures in our C3HHGF model (see Fig. 4B). Moreover, HGF positively correlated with VEGF expression (r = 0.6470, P = 0.001), and up-regulated RAS and AKT were found to be major pathways in response to both HGF and VEGF overexpression. Thus, overexpression of HGF may act synergistically with VEGF through the RAS and AKT pathways to promote HCC proliferation and invasion. Interestingly, overexpression of HGF was not correlated with MET expression, suggesting that HGF (rather than MET) is the driving force for MET pathway activity in these HCV-driven HCC tumors. Although the EGFR pathway was found to frequently cross-talk with MET, we found no correlation between MET and EGFR expression.
Anti-angiogenic therapeutics blocks the growth of hHGF Tg–driven HCC
In liver tumors from C3HhHGF mice, the gene set vegf.hgf.1_UP, associated with dual stimulation of the VEGF and HGF pathways, was highly ranked, which reasonably explained the carcinogenic consequence of the hHGF transgene in mice. Both VEGF and HGF are potent angiogenic factors, so we asked whether anti-angiogenic therapeutics could block tumor growth in C3HhHGF mice. Because spontaneous tumors take 3 to 4 months to appear and another 4 to 6 months to grow, we decided to isolate HCC cells from primary tumors and perform allograft studies. Two mouse HCC cell lines (HCC2321 and HCC2309) were established from 2 C3HhHGF mice. FISH analysis confirmed the presence of HGF in both lines as a result of the hHGF transgene. Both HCC cell lines were tetraploid, while containing 2 copies of hHGF with integration sites on chromosome 17A. HCC2309 showed the expected 4 copies of mHgf and Met, whereas HCC2321 had 4 copies of Met but 7 copies of mHgf (Suppl. Fig. S4A). Thus, both cell lines carried the same genetic modification as their primary tumors (see Fig. 1D). Although the 2 cell lines both came from C3HhHGF mice, SKY analysis clearly showed different cytogenetic abnormalities (Suppl. Fig. S4B). Therefore, although mice that receive the same genetic modification are normally believed to have a genetically homogeneous disease, the disease phenotype can be genetically heterogeneous.
We first tested the cell lines in vitro for response to human HGF stimulation. HGF enhanced the proliferation of both HCC2321 and HCC2309, but that effect could be blocked by a specific Met inhibitor, SGX523 (Suppl. Fig. S4C). Western blots showed that HGF induced Met phosphorylation and its downstream MAPK and AKT signaling pathways, which could also be inhibited by SGX523 (Suppl. Fig. S4D).
We next ran an in vivo drug efficacy study, subcutaneously inoculating the 2 cell lines (HCC2321 and HCC2309) into mice. Both cell lines formed highly angiogenic allograft tumors as indicated by CD31 staining (Fig. 5A). We first tested the efficacy of sorafenib, an anti-angiogenic compound that targets mainly VEGF receptors 1-3 but also targets other receptor tyrosine kinases such as the PDGF receptor.1,27 Sorafenib alone was sufficient to reduce both HCC2321 and HCC2309 tumor growth in a dose-dependent manner (Fig. 5B). We then tested the MET inhibitor SGX523 alone and in combination with sorafenib. SGX523 alone at 60 mg/kg partially inhibited tumor growth (HCC2321, 2-tailed test, P = 0.0001; HCC2309, 1-tailed test, P = 0.03), similar to sorafenib at 10 mg/kg (2-tailed test: HCC2321, P = 6.87 ×10⁻⁵; HCC2309, P = 0.047). However, the combination of SGX523 (60 mg/kg) and sorafenib (10 mg/kg) gave no significant improvement in efficacy (Fig. 5C). However, sorafenib has been in clinical trials against HCC and has shown efficacy.
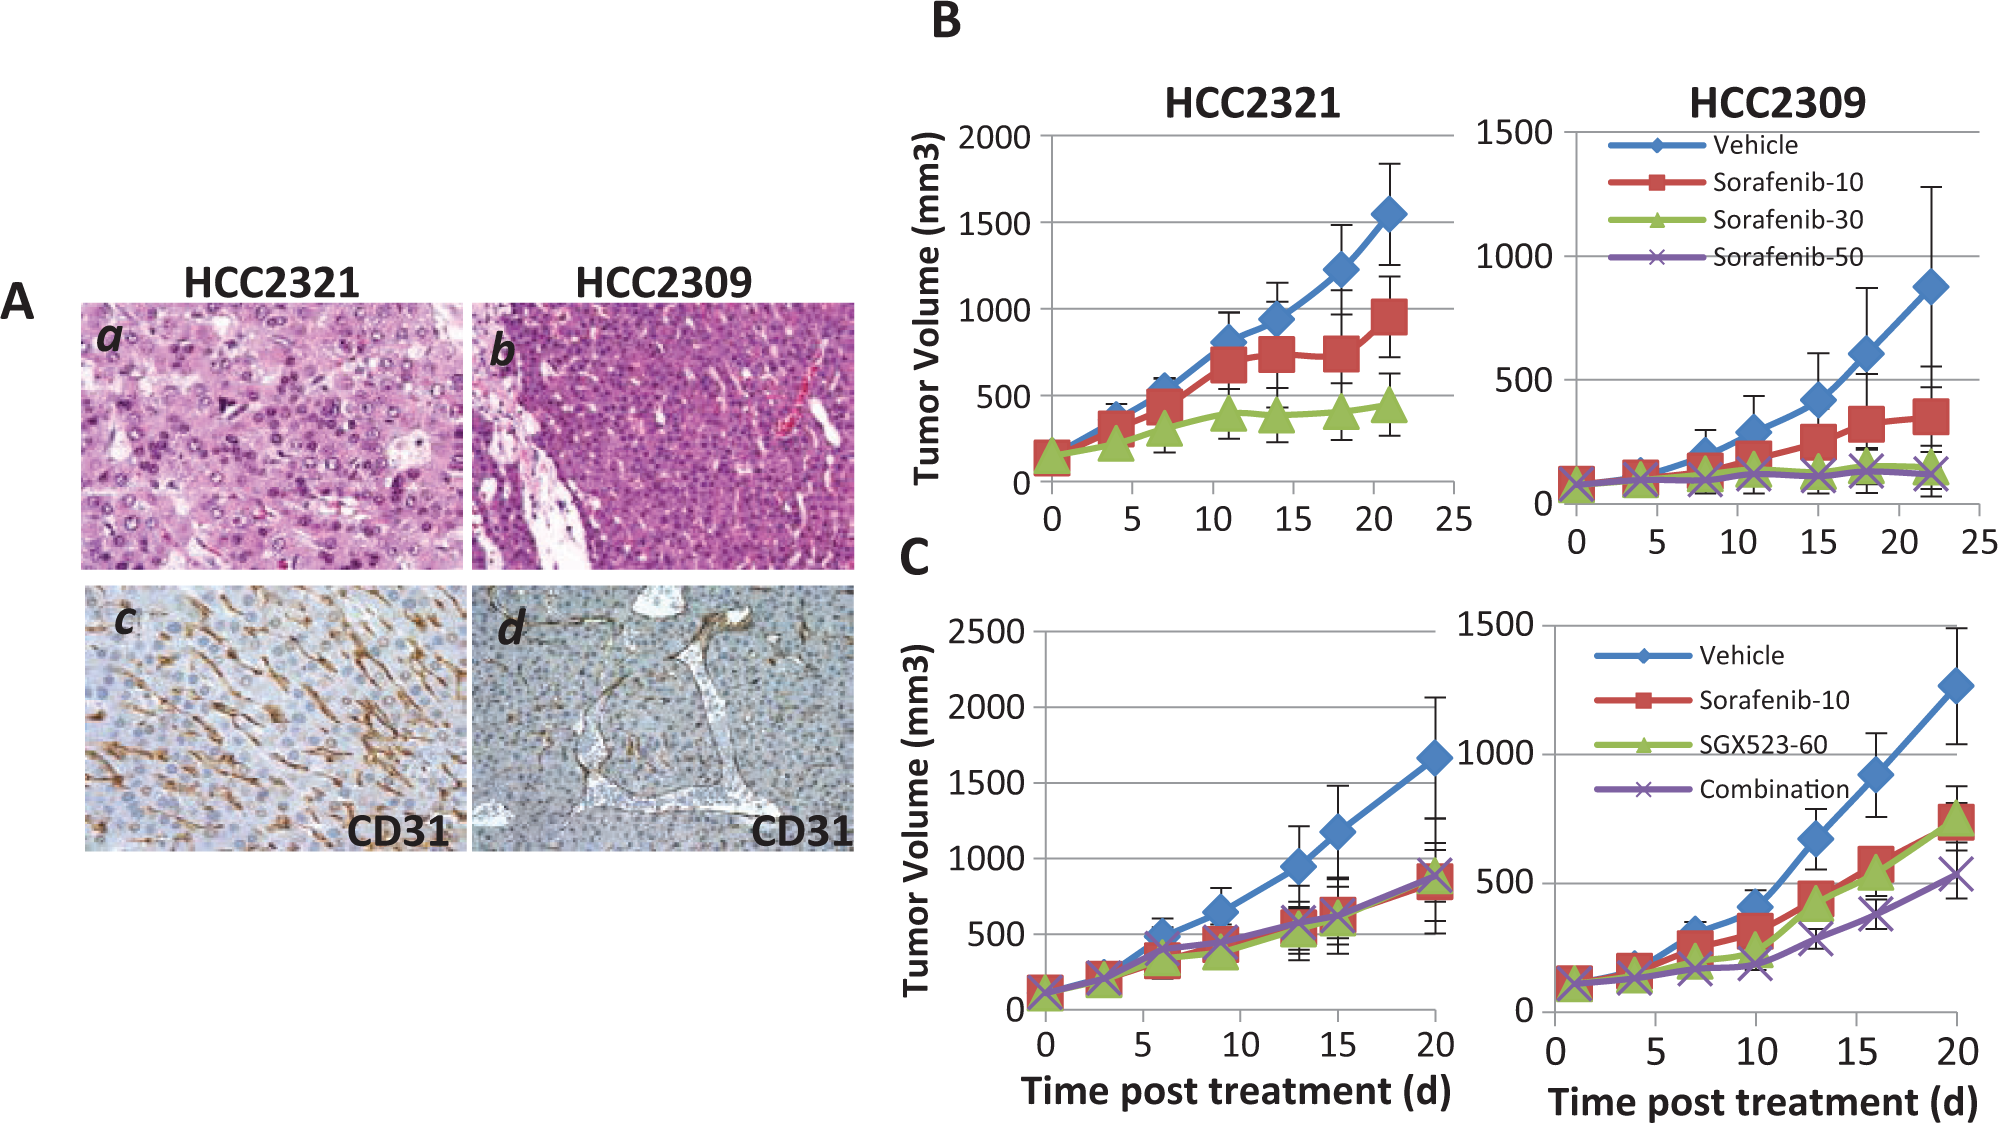
Anti-angiogenic therapeutics inhibit the growth of hHGF Tg–driven HCC.
(
Overexpression of HGF and MET amplification predicts the sensitivity of human HCC xenografts to MET inhibitors
We tested preclinically how MET inhibitors inhibit HCC growth. We also looked for biomarkers that could be useful in identifying tumors sensitive to MET inhibition. A panel of human HCC cell lines was screened by microarray (Fig. 6A, Suppl. Table S3) followed by RT-PCR for HGF and MET expression (Fig. 6B), and from this screening the JHH5 and JHH4 lines were selected as high HGF producers. When validated by western blot, we observed that JHH4 and JHH5 also had high levels of MET phosphorylation (p-MET, Fig. 6C), indicating an active HGF-autocrine loop. 16 SNU398 showed marginal HGF expression by RT-PCR but none by western blot, suggesting a less HGF-dependent activation (Fig. 6B, C). JHH5 showed extreme sensitivity to INC280, a specific MET inhibitor that in vivo tumor regression was observed within 3 days after dosing (Fig. 6D, 2-tailed test, P = 4.49 ×10⁻⁵). SNU398 was less sensitive (1-tailed test, P = 0.041), likely due to the much lower HGF-autocrine activation.
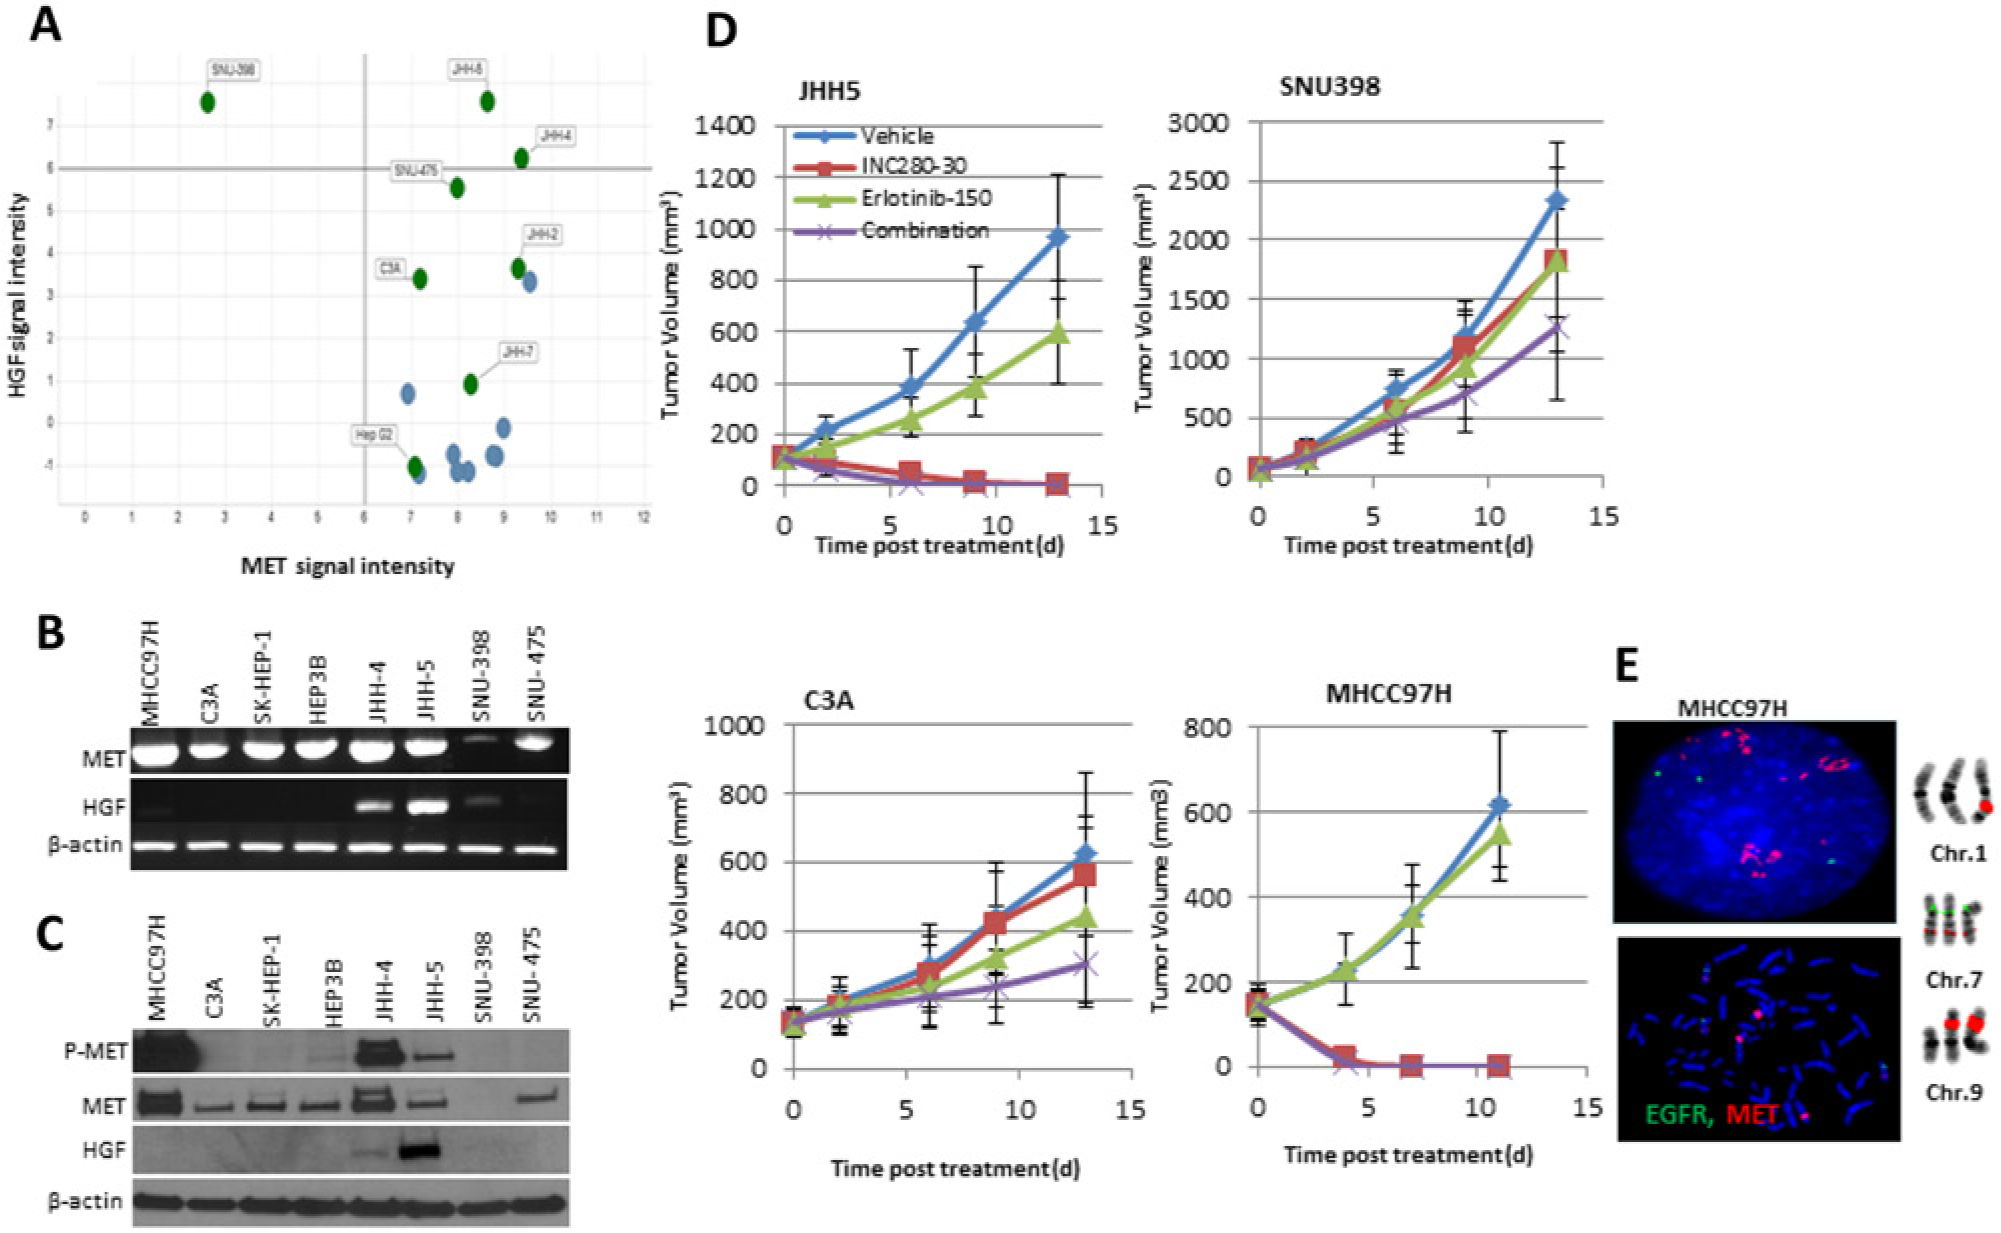
HGF-autocrine activation and MET amplification predicts sensitivity to MET inhibition
in human HCC. (
Although JHH4 cells showed high levels of MET and p-MET, this line was not tumorigenic and therefore was not tested. The HCC line C3A, which had similar MET expression to JHH5 but no HGF expression, did not respond to INC280 (Fig. 6D). Thus, autocrine HGF expression is a key marker of sensitivity to MET inhibitors. The C3A tumors lacked sensitivity to either INC280 or the EGFR inhibitor erlotinib, but a combination of the 2 drugs gave increased inhibition of tumor growth (Fig. 6D, 2-tailed test, P = 0.02). This finding was consistent with our previous results that a combination of MET and EGFR inhibitors is better for treating tumors than using either inhibitor alone. 16
MHCC97H cells were reported as being sensitive to MET inhibition due to their high level of MET expression with ligand-independent activation. 27 We found that MHCC97H tumors were highly sensitive to INC280 alone (Fig. 6D, 2-tailed test, P = 3.73 × 10⁻⁴), and they showed MET amplification in the form of homogenously staining regions (hsr) on derivative chromosomes 1 and 9 (Fig. 6E). The molecular cause that determines the sensitivity of MHCC97H is MET amplification. We conclude that total MET expression may not be the optimal biomarker for identifying HCC sensitivity to MET inhibition; instead, a biomarker combining HGF expression and MET amplification may be more accurate.
Discussion
In previous studies using mHgf transgenic mice, the overexpression of Hgf could induce liver tumors, but those mice survived to 1.5 years or older. 8 We report here that most of our hHGF Tg (C3HhHGF) mice developed HCC and had much shorter survival times (average = 41.6 ± 4.7 weeks), indicating that the hHGF transgene is a strong driver for HCC initiation. The hHGF transgene also accelerated the progression of HCC in HBsAg Tg mice and significantly reduced their survival time. Given that the hHGF transgene has the potential to cause mHgf amplification, the combination may contribute to potent stimulation of the Met signaling pathway and lead to earlier carcinogenesis. Although different genetically modified mouse models with HBsAg expression developed HCC, hHGF Tg mice had the shortest survival times, demonstrating in vivo that HGF alone is a sufficient and potent stimulator of HCC initiation and progression.
In humans, hepatitis B or C virus infection often causes chronic liver injury, which triggers liver repair initiated by HGF. 29 The prevailing hypothesis is that the production of HGF by fibroblasts is enhanced to stimulate growth of Met-positive hepatocytes. To provide the necessary HGF stimulation, an overgrowth of fibroblasts in the liver may occur and result in cirrhosis. Due to chronic infection by HBV, regenerated liver nodules may be reinjured, and repeated repair and injury cycles can, in theory, lead to hepatocyte hyperplasia and eventually to liver cancer. However, many cases of HCC in the mouse models with HBsAg expression were not accompanied by strong fibrous changes, and HGF production seemed to be much less than in hHGF Tg animals; and the reason that HBsAg Tg mice took much longer to develop HCC is due to hHGF.
In almost all HCC lesions that developed in B6HBsAg-Alb.Cre/Metflox/flox mice, the cancer cells were Met-positive but HBsAg-negative. HBsAg plays a very important role in hepatocarcinogenesis, and HBsAg expression is often observed in inflammatory and/or regenerating lesions of the liver; but once HCC develops, the tumor cells are all HBsAg-negative. This is consistent with the results of Nakamoto et al., 30 in which HCCs in HBsAg Tg mice are paradoxically HBsAg-negative, and in aged mice that have HCC, HBsAg is positive mostly in liver tissues other than the tumor. HBsAg is probably involved in pro-carcinogenic events such as inflammatory reactions by killer T cells, but it is not essential for HCC carcinogenesis.
In this study, by crossing hHGF Tg mice with HBsAg Tg mice, we showed that overexpression of human HGF can induce the overproduction of HBsAg in hepatocytes and elevate serum HBsAg. A high concentration of HBsAg in the circulation might work as a strong inducer of liver inflammation and also of immunoactivators for killer T cells that attack regenerative hepatocytes. Furthermore, we have shown that Met expression is required for liver repair and regeneration even in liver-specific Met KO mice. While Met must be knocked out in those mice, regeneration nodules still consisted of strongly Met-positive hepatocytes. Therefore, Met is essential in liver regeneration, or some mechanism—possibly incomplete expression of Cre, or hepatocyte precursor cells that are silent for albumin expression escape from Cre-induced recombination. Our data also demonstrate that in these mice HGF promotes HBV antigen production. The chronic to HBsAg exposure may help to induce the growth of Met-positive hepatocytes.
Although HBV infection alone is sufficient to produce HCC, we demonstrated that the overexpression of hHGF in combination with HBsAg production or even production of hHGF alone produces a more aggressive HCC, resulting in much shorter survival time. The fact that C3HhHGF-HBsAg mice had survival times similar to those of C3HhHGF mice (49.0 ± 12.8 weeks vs. 41.6 ± 4.7 weeks, statistically not significant) indicates that the overexpression of hHGF is the leading cause determining HCC progression. This conclusion is further supported by our genomic analysis, which showed that the C3HhHGF mouse model has a molecular signature strongly resembling that of HBV-positive HCC patients who have a poor prognosis. In HCV-positive HCC patients, furthermore, more than 50% showed overexpression of HGF accompanied by elevated activity of the VEGF and HGF pathways, similar to the characteristics of C3HhHGF mice. Thus, gene alterations and expression patterns found in HCC from hHGF Tg mice may provide useful information for targeted therapies against HGF-driven HCC, and our mouse model can be useful in preclinical testing of potential therapeutics.
Our results that either sorafenib or SGX523 alone inhibited the growth of hHGF-driven tumors support the idea that the targeting of the HGF and VEGF pathways is effective in cases of HCC with HGF overexpression. HGF is known to induce angiogenesis via the up-regulation of VEGF production as well as the down-regulation of thrombospondin-1. 31 Therefore, a combination of VEGF and MET inhibitors has been suggested to be an effective regimen. However, when we combined sorafenib and SGX523, no significant increase of efficacy was found. This may be because sorafenib is more of a multi-kinase inhibitor that may also hit the MET pathway, or because an alternative pathway through other mechanisms is involved in maintaining tumor growth. A firm answer will require the testing of more models.
EGFR also cross-talks with MET. Inhibiting EGFR results in MET activation (or vice versa) in small cell lung cancer 32 and glioblastoma, 33 and a combination of inhibitors of the 2 pathways has shown enhanced efficacy in inhibiting tumor growth.16,21 We show here that a combination of INC280 and erlotinib were better inhibitors of tumor growth, indicating a mechanism of EGFR-MET cross-talk similar to that found in small cell lung cancer and glioblastoma. Now that MET inhibitors are entering clinical trials and showing efficacy, 34 it is important to develop biomarkers that can identify the subset of patient suitable for MET inhibition therapy. While others have shown that MET amplification indicates sensitivity to MET inhibitors in gastric cancers and small cell lung cancers,32,35 we have reported that overexpression of HGF leads to constitutive activation of the MET pathway, which predicts sensitivity to MET inhibition in glioblastoma. 16 Here we have demonstrated that the combination of HGF-autocrine activation and MET gene amplification in human HCC indicates sensitivity to MET inhibition, which is valuable information for clinical patient selection. For tumors that are not sensitive to MET inhibitors alone, a combination with EGFR inhibitors may be an alternative therapeutic strategy.
Taken together, HGF overexpression in combination with MET amplification is a key driving force in virus-induced HCC progression and may serve as an effective biomarker for MET-targeted therapy.
Materials and Methods
Animal models
SCID human HGF transgenic (SCIDHGF) mice were routinely maintained in our laboratory, and Alb-Cre transgenic mice were provided by Dr. Bart W. Williams of the Van Andel Research Institute. Hepatitis B virus surface antigen transgenic mice (B6HBsAg: C57BL/6J-Tg(Alb1HBV)44Bri/J mice)3 were kindly provided by Dr. Francis V. Chisari, Professor and Head of the Division of Experimental Pathology, Scripps Research Institute, La Jolla, CA. Conditional Met knock-out (Metflox/flox) mice were kindly provided by Dr. Carmen Birchmeier (Max Delbrück Center for Molecular Medicine, Berlin-Buch, Germany). 7
All experiments in this study were in compliance with the principles of the Guide for the Care and Use of Laboratory Animals (www.nap.edu/books/0309053773/html) and were approved by the Institutional Animal Care and Use Committee (IACUC) of the Van Andel Research Institute and by the Institutional Review Board for the Care of Animal Subjects at the National Defense Medical College, Japan.
Detection of serum HBsAg levels
Blood was collected from the mice by orbital bleeding and the serum was separated by centrifugation. Serum samples were stored at −80°C until use. Serum HBsAg concentration was measured using an HBsAg EIA kit (International Immuno-Diagnostics, Foster City, CA). The absorbances were read on an automated spectrophotometric plate reader at 450 nm.
Immunohistochemical (IHC) staining for Met, CD31, Ki67, and HBsAg
Hematoxylin and eosin (H&E) staining was performed on all formalin-fixed tissue samples. For the detection of HBV antigen at the histological level, Victoria blue staining was performed using a kit from NewComers Supply (#1406A) according to the instruction manual. For IHC staining, formalin-fixed tissue slides were deparaffinized in xylene and hydrated with alcohol before being placed in 3% H2O2/methanol blocking solution. Antigen retrieval was performed by autoclaving the specimens in Antigen Unmasking Solution (pH 9.0, Vector Laboratories, Inc., Burlingame, CA) for 5 minutes. Immunohistochemical staining was performed using anti-mHGFR (i.e., anti-mouse Met) affinity purified goat IgG (R&D Systems, Inc., Minneapolis, MN) as the primary antibody; the secondary antibody was ImmPRESS REAGENT KIT anti-GOAT Ig (Vector Laboratories, Inc.). Then the slides were stained using the EnVision kit (Dako, Glostrup, Denmark) and counterstained with hematoxylin. Similarly, anti-CD31 antibody (Neomarkers, Rockford, IL) and anti-Ki67 antibody (Epitomics, Burlingame, CA) were used for staining vascular endothelial antigens and measuring the proliferative capacity of the tumors, respectively. For the detection of HBsAg staining at the histological level, polyclonal anti-HBsAg (Abcam, Cambridge, UK) was used according to the instruction manual.
Mouse gene expression microarray
Mouse tissue samples were homogenized using a handheld homogenizer (BioSpec, Bartlesville, OK) in chilled TRIzol (Invitrogen, Carlsbad, CA) for 1 minute at maximum speed. After centrifugation, supernatants were put through phase separation in 1-bromo-3-chloropropane (Sigma, St. Louis, MO). RNA was precipitated using isopropyl alcohol and washed with 75% ethanol. RNA pellet was reconstituted with nuclease-free water and purified with an RNeasy kit (Qiagen, Venlo, Netherlands) according to the manufacturer’s protocol. The quality and quantity of RNA was measured on an RNA nanochip using a Bioanalyzer (Agilent Technologies, Santa Clara, CA).
Whole-mouse-genome 4x44k gene expression 1-color microarrays from Agilent Technologies were used to obtain the global gene profiles. In brief, 300 ng of total RNA was amplified, fluorescently labeled, and hybridized onto the arrays according to Agilent standard microarray procedures. After hybridization for 17 hours at 65°C and 20 rpm, the arrays were washed and scanned with the Agilent high-resolution scanner. Probe features were extracted from the microarray scan data using Feature Extraction software v.10.7.3.1 (Agilent Technologies).
Gene set enrichment analyses
For the C3HHGF HCC model, parametric gene set enrichment analysis was used to identify gene sets that were enriched in up-regulated or down-regulated genes. For pathway analysis, 6,769 gene sets were obtained from the Molecular Signatures Database (MsigDB; http://www.broadinstitute.org/gsea/msigdb/). These gene sets were curated from multiple sources including online pathway databases, the biomedical literature, and mammalian microarray studies. We also included several hand-curated gene sets found in the PGSEA Bioconductor package. Parametric gene set enrichment analysis as implemented in the PGSEA package was used to generate enrichment scores (z scores) for each pathway within each tumor and nondiseased liver sample, using the average expression of the nondiseased liver as a reference. A moderated t statistic as implemented in the limma package 36 was used to identify gene set enrichment scores that could discriminate between tumor and non-diseased liver. The significance of enrichment was determined using the mean rank gene set enrichment test. 37
HCC cell lines
The HCC2309 and HCC2321 cell lines were generated from spontaneous liver tumors of the hHGF transgenic mice ID.2309 and ID.2321. A fresh tumor specimen was digested with 0.05% trypsin into single cells and grown in DMEM with 10% fetal bovine serum (FBS) supplemented with EGF (20 ng/mL, R&D), bFGF (20 ng/mL, R&D), HGF (10 ng/mL), insulin solution (Sigma-Aldrich Co., 1:1000), and 1% penicillin and 1% streptomycin at 37°C. HGF is purified at our laboratory. Human HCC cell lines were purchased from ATCC (C3A, SK-HEP-1, SNU398, SNU475, and Hep3B) or Health Science Research Resources Bank (Osaka, Japan; JHH4 and JHH5). JHH4, C3A, Hep3B, and SK-HEP-1 were grown in EMEM plus 10% FBS. SNU398 and SNU475 were grown in RPMI plus 10% FBS. The MHCC97H cell line was isolated from an HCC patient at the Liver Cancer Institute 38 and was grown in DMEM plus 10% FBS.
Xenograft models and drug efficacy
HCC cells (5 × 10⁵ cells in 100 µL phosphate-buffered saline) were inoculated into SCIDHGF mice subcutaneously. Tumor size was measured with calipers twice a week. Body weight was measured once a week. When average tumor size reached 100 mm3, mice were grouped (n = 10) for treatment. Dosing with sorafenib, SGX523, and/or erlotinib was delivered orally once daily for 3 weeks. Vehicles used were 10% Cremaphore EL/10% EtOH/20% double-distilled H2O (sorafenib, LC laboratory, Woburn, MA); 0.5% methylcellulose 400 with 0.05% Tween 80 (SGX523, Lily Pharmaceuticals, Indianapolis, IN); 0.5% (w/v) methylcellulose (erlotinib, LC laboratory); and 0.25% methylcellulose + 0.05% Tween 80 (INC280, Novartis, Basel, Switzerland). All mice were sacrificed 24 hours after the last dose. To determine the effectiveness of treatment, the average tumor size of each group from the last measurement was analyzed using Student’s t test (α = 0.05).
Footnotes
Acknowledgements
We thank Dr. Carmen Birchmeier (Developmental Biology, Max Delbrück Center for Molecular Medicine, Germany) for providing Met floxed mice, and Dr. Francis V. Chisari (Division of Experimental Pathology, the Scripps Research Institute, La Jolla, CA) for providing the HBsAg-Tg mice. We also thank Dr. Robert Sigler (VARI) for pathology consultations on mouse liver cancer diagnoses. We thank Kyoko Morichika and Mayumi Watanabe (Department of Integrative Physiology and Bio-Nano Medicine, NDMC) for immunohistochemical staining and Sadayuki Hiroi (Department of Clinical Pathology, NDMC) for microdissection. We thank Structural Genomics Pharmaceuticals for providing SGX523 and Novartis for providing INC280. We thank David Nadziejka (VARI) for technical editing of the article.
Declaration of Conflicting Interests
The author(s) declared no potential conflicts of interest with respect to the research, authorship, and/or publication of this article.
Funding
The author(s) disclosed receipt of the following financial support for the research, authorship, and/or publication of this article: This work was supported by the Grant-in-Aid for Scientific Research, the Japan Society for the Promotion of Science (No. 23300365 to NS), and the work was conducted under a Pre-Clinical Research Agreement between Novartis Pharmaceuticals Corporation and Van Andel Research Institute (to GVW and QX). This work was supported by the generosity of the Jay & Betty Van Andel Foundation (to GVW and QX).