
Abstract
Background
This study explored the phytochemical composition, Gas Chromatography-Mass Spectrometry (GC-MS), Fourier Transform Infrared spectroscopy (FT-IR), and antioxidant properties of the crude methanol extract (CRUME) and its fractions from Uvaria chamae in search of potential hepatoprotective drug candidates.
Methods
Qualitative and quantitative phytochemical analyses were performed on CRUME and its methanol (MEFUC), ethyl acetate (EAFUC), and dichloromethane (DIFUC) fractions. Antioxidant assays, including Thiobarbituric reacting substance (TBARS), 2,2-diphenyl-1-picrylhydrazyl (DPPH), ferric reducing antioxidant power (FRAP), and total antioxidant capacity (TAC), were conducted. FTIR analysis was used to identify functional groups, and GC-MS analysis identified bioactive compounds in the methanol fraction. Molecular docking and drug-likeness assessments were conducted to evaluate hepatoprotective potential and safety profiles.
Results
Phytochemical screening revealed diverse classes in varying concentrations. Antioxidant assays showed maximum TBARS scavenging activity for CRUME (73.67 ± 4.16% at 250 µg/mL), DIFUC (91.67 ± 0.16% at 250 µg/mL), EAFUC (81.33 ± 0.16% at 125 µg/mL), and MEFUC (69.33 ± 0.58% at 500 µg/mL), comparable to BHT (74.33 ± 0.16% at 15.53 µg/mL). DPPH activity peaked at 500 µg/mL for CRUME (98.00 ± 0.70%), DIFUC (68.33 ± 2.08%), and EAFUC (61.67 ± 5.51%), while MEFUC showed peak activity at 15.53 µg/mL (89.33 ± 1.16%), similar to ascorbic acid (64.19 ± 1.34% at 31.25 µg/mL). FTIR revealed multiple functional groups; GC-MS identified 39 bioactive compounds. Docking studies highlighted 10 compounds with strong hepatoprotective potential. Drug-likeness and ADMET profiling indicated no signs of hepatotoxicity, immunotoxicity, cytotoxicity, or mutagenicity.
Conclusion
The methanol leaf extract of Uvaria chamae and its fractions demonstrate potent antioxidant activities and contain bioactive compounds with significant potential as hepatoprotective drug candidates for the management of liver-related diseases.
This is a visual representation of the abstract.
Keywords
Introduction
The increased prevalence of hepatic disorders, due to growing exposure to toxins, infections, and metabolic diseases, requires investigation into alternative therapeutic approaches.1,2 In recent years, medicinal plants have been identified as important sources of bioactive compounds with hepatoprotective potential. Uvaria chamae, used in traditional African medicine, has attracted attention because of its varied pharmacological effects.3–5
Oxidative stress is a significant factor in disease development, notably liver illness, 6 highlighting the importance of effective antioxidant defense mechanisms. The antioxidant capacity of the extracts was evaluated using laboratory assays including Total Antioxidant Capacity (TAC), Ferric Reducing Antioxidant Power (FRAP), and 1,1-diphenyl-2-picrylhydrazyl radical (DPPH) scavenging capacity. Lipid peroxidation, a key indicator of oxidative stress, was measured by the Thiobarbituric acid reacting substances (TBARS) assay to determine inhibition levels. 7 These concentration-dependent antioxidant profiles allow for efficacy comparison with common free radical inhibitors such as BHT and ascorbic acid. Phytochemical composition and bioactive compounds were identified using Gas Chromatography-Mass Spectrometry (GC-MS), and functional groups were analyzed by Fourier Transform Infrared (FTIR) spectroscopy. Molecular docking analysis then facilitated the identification of phytochemicals with strong binding affinities to drug (hepatoprotective) target proteins. Finally, pharmacokinetic investigations built upon docking findings to strengthen the overall results.
Uvaria chamae, known as finger root or bush banana, is a large climbing shrub indigenous to tropical West and Central Africa, where it grows in both wet and dry woodlands and produces edible fruits that are widely consumed. 5 The plant is used medicinally across these regions for treating fever and exhibits antibacterial properties; additionally, the root extract has antidiabetic effects. 8 In West African nations, Uvaria chamae is referred to as Oko aja by the Yoruba, Mmimi ohia by the Igbo, and Kaskaifi by the Hausa. 9 The root and bark are traditionally applied in malaria management. The plant's distinctive phytochemical composition contributes to its health benefits. 10 Both root and leaf extracts have shown antidiabetic, hypolipidemic, 9 and antimalarial activity, as well as containing numerous natural antioxidants. 10 Building on this background, the present study aims to investigate the hepatoprotective potential of Uvaria chamae methanol extracts by performing comprehensive phytochemical profiling, antioxidant assays, and in-silico analyses to identify bioactive compounds that could serve as plant-based drug candidates for liver disease treatment.
Materials and Methods
Plant Materials
The leaves of Uvaria chamae were collected from Umuakashi Village, Nsukka Local Government Area, Enugu State, Nigeria (latitude 6.8372°N, longitude 7.3531°E). The specimen was identified and its authenticity verified by Mr Alfred Ozioko of the Biodiversity and Conservation Programme (BDCP), Aku Road, Nsukka, Enugu State, Nigeria. A voucher specimen bearing the assigned voucher number InterCEDD/A11/003 Uvaria chamae was deposited in the BDCP Herbarium, Nsukka, for future reference. The study was carried out mainly at the postgraduate laboratory of the Department of Biochemistry, University of Nigeria, Nsukka, from January 2023 to October 2024, being part of a study leading to the award of a PhD.
Preparation of Plant Extracts
Six kilogrammes (6 kg) of Uvaria chamae leaves, wet weight, were collected, rinsed with clean water, and air-dried in the shade. The desiccated samples were pulverized, and the powdered material was extracted using cold maceration using 80% methanol for 72 h. The solution was filtered using Whatman filter paper No. 1, and the filtrate was concentrated with a magnetic stirrer at 40 °C. The extract was placed in an airtight container and stored in a cool location for subsequent use. 11
Fractionation of the Methanol Extract
The methanol crude extract was mixed with silica gel mesh 60-120, passed into a chromatography column, and separated into the constituent components using methanol, dichloromethane, and ethyl acetate solvents. Thin-layer chromatography was applied to separate the phytoconstituents of the fractions. This was followed by gas chromatography-mass spectrometry to identify different substances within the sample. Fourier-transform infrared spectroscopy was done to elucidate their structures.12,13
Phytochemical Analysis of Uvaria chamae Extract and Fractions
A preliminary phytochemical examination was conducted using the protocols established by Harborne. 14
Evaluation of in vitro Antioxidant Assays of Uvaria chamae Extract and Fractions
To assess the antioxidant activity of the extract and its components, the following recognized antioxidant models were employed:
Assessment of antioxidant capacity uses the thiobarbituric acid-reactive species (TBARS) photometric assay as per the Buege method. 15 A modified thiobarbituric acid-reactive species (TBARS) assay was employed to quantify the lipid peroxides generated from egg yolk homogenates as lipid-rich substrates.
Assessment of Antioxidant Capability via the Ferric Reducing Antioxidant Power (FRAP) Photometric Test
Ferric reduction involves the conversion of Fe3+ to Fe2+ by antioxidants in an acidic environment. 15 The sample's reduction power was assessed according to the methodology outlined by Sahreen et al. 16
The evaluation of antioxidant capacity was conducted using the Total Antioxidant Capacity (TAC) photometric test as described by Pellegrini et al. 17 The total antioxidant capacity assay was conducted using the phosphomolybdate technique.
Assessment of antioxidant capability using the 2,2-diphenyl-1-picrylhydrazyl radical (DPPH) spectrophotometric method. The DPPH free radical scavenging activity of the sample was assessed using the method of Gyamfi et al. 18 with minor modifications.
To Assess the in silico Drug Likeness of the Phytochemicals in the Most Active Fraction of Uvaria chamae Leaves
Protein Retrieval and Preparation
The crystal structures of SOD (PDB ID: 5VF9) and Catalase (PDB ID: 1DGH) were obtained from the Protein Data Bank (PDB). The protein architectures were optimized using Discovery Studio software. This involved removing water molecules and irrelevant ligands, fixing missing atoms or residues, and correcting bond orders and protonation states (Gasteiger charges and polar hydrogen), utilizing AutoDock technologies. The proteins were constructed by including Gasteiger charges and polar hydrogen, utilizing AutoDock technologies. 19
Ligand Retrieval and Preparation
The crystal structures of chosen chemicals from Uvaria chamae leaf extract were obtained from the PubChem database in SDF format. The SDF files were transformed into PDB format utilizing Pymol software. 20
Prediction of Active Sites
Following the creation of protein-ligands, the receptor grid for the proteins was established at the centroid of the co-ligand. The grid box was created by selecting the amino acid residues located at the active site. The analysis of the active location was conducted utilizing Biovia Discovery Studio software.
Molecular Docking
Prior to docking, both proteins and ligands were saved in PDBQt format. Molecular docking was conducted with AutoDock Vina Software. 21 The two-dimensional diagrams and three-dimensional surface representations of the protein-ligand interactions were produced utilizing Discovery Studio software and Pymol software, respectively. The physicochemical properties, lipophilicity, solubility, pharmacokinetics, and Lipinski drug-likeness of the examined compounds were assessed using the SwissADME Server. 22
Chemicals and Reagents
All chemicals utilized in this investigation were of analytical grade and sourced from May and Baker, England; BDH, England; and Merck, Darmstadt, Germany. The reagents utilized for all assays were commercial kits and products from Randox, USA; QCA, Spain; Teco (TC), USA; and Biosystem Reagents and Instruments, Spain.
Statistical Analysis
The presented results are expressed as the mean ± standard deviation (SD) from three independent experiments (n = 5). To assess the statistical significance of the obtained data, a One-way Analysis of Variance (ANOVA) was employed. Mean comparisons were conducted using the Duncan multiple test. The statistical analysis was executed with GraphPad Prism version 8.4, and a confidence interval of p < .05 was established to determine statistical significance.
Results
Quantitative Phytochemical Analyses of Crude Extracts, Methanol Fraction, Ethylacetate Fraction, and Dichloromethane Fraction of Uvaria chamae
The result of the quantitative phytochemical analysis of Uvaria chamae extract and fractions (as shown in Table 1) revealed the presence of different classes of phytochemicals in varying concentrations. From the result, varying amounts of phenolics (1114.47 mg/100 g), alkaloids (525.40 mg/100 g), reducing sugar (137.68 mg/100 g), terpenoids (125.54 mg/100 g), tannins (27.38 mg/100 g), glycosides (1.65 mg/100 g), and steroids (1.17 mg/100 g) were present in the crude methanol leaf extract, while only the presence of alkaloids (2508.33 mg/100 g), flavonoids (1431.85 mg/100 g), reducing sugar (376.09 mg/100 g), phenols (58.12 mg/100 g), glycosides (51.49 mg/100 g), and tannins (31.57 mg/100 g) were recorded in the methanol leaf fraction. Furthermore, flavonoids (4338.28 mg/100 g), alkaloids (1228.89 mg/100 g), reducing sugar (254.71 mg/100 g), tannins (62.57 mg/100 g), glycosides (51.53 mg/100 g), phenols (51.32 mg/100 g), and steroids (1.39 mg/100 g), were detected in the ethylacetate fraction, while alkaloids (1416.70 mg/100 g), reducing sugar (248.55 mg/100 g), flavonoids (351.59 mg/100 g), terpenoids (72.50 mg/100 g), phenols (35.08 mg/100 g), glycosides (41.09 mg/100 g), tannins (9.49 mg/100 g), steroids (1.93 mg/100 g), were detected in the dichloromethane fraction.
Quantitative Phytochemical Analyses of Crude Extracts, Methanol Fraction, Ethylacetate Fraction, and Dichloromethane Fraction of Uvaria chamae.
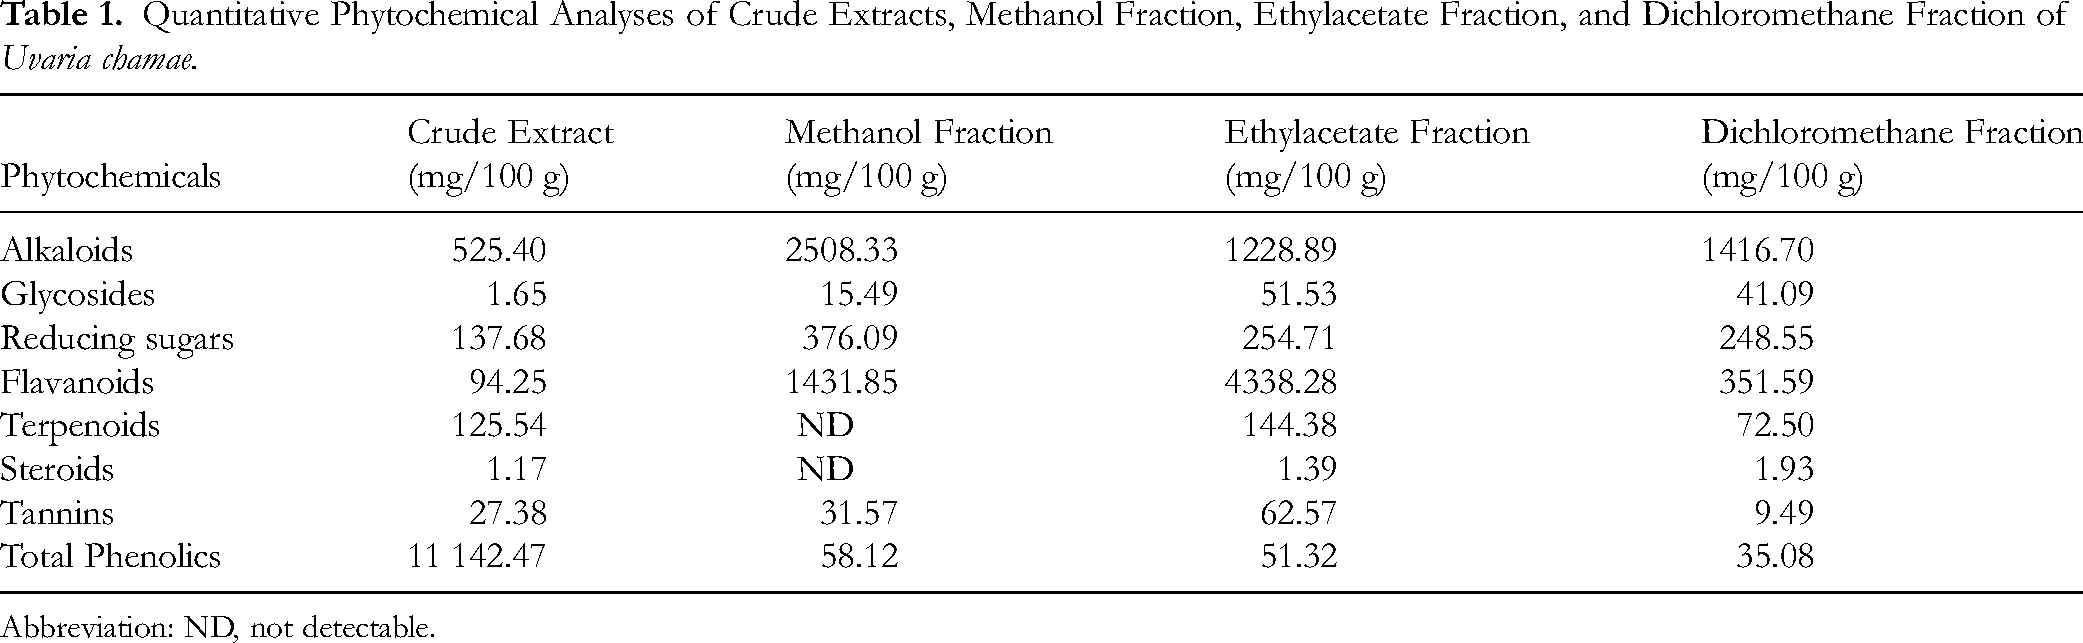
Abbreviation: ND, not detectable.
Determination of Thiobarbituric Acid-Reacting Substances (TBARS) (DIFUC), Ethyl Acetate Fraction (EAFUC), and Methanol Fraction (MEFUC) of Uvaria chamae Leaves
The result (as shown in Table 2) revealed that various concentrations (15.53, 31.25, 62.5, 125, 250, 500 µg/mL) of crude methanolic extract and fractions of Uvaria chamae leaves exhibited different degrees of TBARS scavenging activities in a non-concentration dependent fashion. From the result, the maximum % TBARS scavenging activity at the respective concentration of CRUME (73.67 ± 4.16%, 250 µg/mL), DIFUC (91.67 ± 0.16%. 250 µg/mL), EAFUC (81.33 ± 0.16%, 125 µg/mL) and MEFUC (69.33 ± 0.58%, 500 µg/mL) was comparable to that produced with butylated hydroxytoluene (BHT) (74,33 ± 0.16%, 15.53 µg/mL). Furthermore, the IC50 (µg/mL) values of CRUME (23.62), DIFUC (13.86), EAFUC (19.90) and MEFUC (38.90) revealed that DIFUC was more potent in scavenging TBARS when compared with the crude extract and other fractions and competed favorably with standard antioxidant (BHT), which produced an IC50 value of 48.64 µg/mL.
Determination of TBARS Scavenging Activities of Crude Extract, Dichloromethane Fraction, Ethyl Acetate Fraction, Methanol Fraction of Uvaria chamae Leaves.

*Results are expressed in Means ± SD (n = 5). Mean values with different letters as superscripts down the column are considered significant at p < 0.05.
Determination of Ferric ion Reducing Power (FRAP) Concentration of Crude Extract, Dichloromethane Fraction, Ethyl Acetate Fraction, Methanol Fraction of Uvaria chamae Leaves
The result (as shown in Table 3) revealed that various concentrations of (15.63, 31.25, 62.5, 125, 250, 500 µg/mL) of crude methanolic extract and fractions of Uvaria chamae leaves exhibited different degrees of FRAP absorbances in a concentration dependent fashion. From the result, the FRAP absorbances reduces as the concentration increases. The absorbances at the increasing concentrations are as follows: CRUME (8.67 ± 0.58, 4.67 ± 0.58, 2.33 ± 0.58, 0.9 ± 0.10, 0.37 ± 0.06), DIFUC (8.00 ± 5.20, 1.97 ± 1.055.33 ± 4.04, 2.67 ± 1.16a, 0.67 ± 0.06, 0.37 ± 0.06), EAFUC (6.67 ± 0.58, 3.33 ± 0.58, 2.00 ± 0.00,0.90 ± 0.10a, 0.57 ± 0.12, 0.47 ± 0.09) and MEFUC (11.0 ± 0.00, 4.67 ± 0.58, 3.00 ± 0.00, 1.67 ± 0.58, 0.40 ± 0.0)
Determination of FRAP Concentration of Crude Extract, Dichloromethane Fraction, Ethyl Acetate Fraction, Methanol Fraction of Uvaria chamae Leaves.

*Results are expressed in Means ± SD (n = 5). Mean values with different letters as superscripts down the column are considered significant at p < 0.05.
Furthermore, the total absorbances are: CRUME (17.41), DIFUC (19.01), EAFUC (13.94) and MEFUC (21.44).
Determination of Total Antioxidant Capacity (TAC) Concentration of Crude Extract, Dichloromethane Fraction, Ethyl Acetate Fraction, Methanol Fraction of Uvaria chamae Leaves
The result (as shown in Table 4) revealed that various concentrations of (15.63, 31.25, 62.5, 125, 250, 500 µg/mL) of crude methanolic extract and fractions of Uvaria chamae leaves exhibited different degrees of TAC absorbances in a concentration dependent fashion. From the result, the TAC absorbances reduce as the concentration increases. The concentrations at the increasing absorbances are as follows: CRUME (39.00 ± 6.00,19.00 ± 1.73, 12.33 ± 3.51, 7.00 ± 1.00, 4.33 ± 0.58, 2.67 ± 0.58), DIFUC (42.67 ± 0.58,20.67 ± 2.31, 10.00 ± 1.00, 5.33 ± 0.58, 2.33 ± 0.58a, 1.33 ± 0.58), EAFUC (30.33 ± 12.74, 18.00 ± 8.66, 9.33 ± 3.22a, 3.33 ± 0.58, 2.33 ± 0.58a, 1.67 ± 0.58) and MEFUC (18.33 ± 4.83, 9.33 ± 1.16, 5.33 ± 1.16, 3.00 ± 0.00, 1.67 ± 0.58, 1.00 ± 0.00).
Determination of TAC Concentration of Crude Extract, Dichloromethane Fraction, Ethyl Acetate Fraction, Methanol Fraction of Uvaria chamae Leaves.

*Results are expressed in Means ± SD (n = 5). Mean values with different letters as superscripts down the column are considered significant at p < 0.05.
Furthermore, the total absorbances are: CRUME (84.33), DIFUC (82.33), EAFUC (64.99) and MEFUC (38.66).
Determination of DPPH Scavenging Activities of Crude Extract, Dichloromethane Fraction, Ethyl Acetate Fraction, Methanol Fraction of Uvaria chamae Leaves
The result (as shown in Table 5) revealed that various concentrations of (15.63, 31.25, 62.5, 125, 250, 500 µg/mL) of crude methanolic extract and ractions of Uvaria chamae leaves exhibited different degrees of DPPH scavenging activities in a non-concentration dependent fashion. From the result, the maximum % DPPH scavenging activity at the respective concentration of CRUME (98.00 ± 0.7, 500 µg/mL), DIFUC (68.33 ± 2.08, 500 µg/mL), EAFUC (61.67 ± 5.51, 500 µg/mL) and MEFUC (89.33 ± 1.16, 15.53 µg/mL) was comparable to that produced with Ascorbic Acid (64.19 ± 1.34, 31.25 µg/mL). Furthermore, the IC50 (µg/mL) values of CRUME (4.23), DIFUC (22.4), EAFUC (12.2) and MEFUC (6.31) revealed that DIFUC was more potent in scavenging TBARS when compared with the crude extract and other fractions and competed favorably with Ascorbic Acid standard antioxidant which produced an IC50 value of 28.7 µg/mL.
Determination of DPPH Scavenging Activities of Crude Extract, Dichloromethane Fraction, Ethyl Acetate Fraction, Methanol Fraction of Uvaria chamae Leaves.

*Results are expressed in Means ± SD (n = 5). Mean values with different letters as superscripts down the column are considered significant at p < 0.05.
Fourier Transform Infrared Spectroscopy (FTIR) of Eluents of Methanol Fraction of Uvaria chamae Leaves
As in Figure 1, the Fourier Transform Infrared Spectroscopy (FTIR) of eluents of methanol fraction of Uvaria chamae leaves was shown:

Fourier transform infrared spectroscopy (FTIR) of eluents of methanol fraction of Uvaria chamae leaves.
C–Br (Halogen of Bromine) appeared at wavelength of 690.8796 cm−1, C–Cl (Halogen of Chlorine) appeared at wavelength of 1030.659 cm−1, C–O (Ether CO Symmetrical stretch) appeared at wavelength of 1236.255 cm−1, H2C=CH (Ethene C=C anti symmetrical stretch) appeared at wavelength of 1397.019 cm−1, R–CO (Ester CO symmetrical stretch) appeared at wavelength of 1721.021 cm−1, SCN (Thiocyanate SCN stretch) appeared at wavelength of 1950.449 cm−1 COOH (Carboxylic COO stretch) appeared at wavelength of 2083.711 cm−1, R2C=O (Carbonyl compound CO anti-symmetrical stretch) appeared at wavelength of 2278.126 cm−1, C=N (Nitrile CN anti-symmetrical stretch) appeared at wavelength 2512.308 cm−1, C–H (Methylene C–H symmetrical stretch) appeared at wavelength 2738.125 cm−1, R3CHOH (I alcohol OH stretch) appeared at wavelength of 3014.040 cm−1, R2CHOH (2 alcohol OH stretch) appeared at wavelength of 3346.233 cm−1 and R3CHOH (3 alcohol OH stretch) appeared at wavelength of 3542.772 cm−1.
Gas Chromatography-Mass Spectrophotometry (GC-MS) of Eluents of Methanol Fraction of Uvaria chamae Leaves
As in Table 6, the results of Gas chromatography-Mass Spectrophotometry (GC-MS) of eluents of methanol fraction of Uvaria chamae leaves identified 31 bioactive compounds, these include: 1,2-Diethylcyclohexadecane, 1-Bromooctane, 1-Docosene, 1-Dodecene (or isomer), 1-Hexacosene (or isomer), 1-Hexadecanol (cetyl alcohol), 1-Octadecene, 1-Pentadecene, 22,4-Trimethylhexane, 2,6,10,14-Tetramethylheptadecane, 2,6,10-Trimethyldodecane, 2,6,11-Trimethyldodecane, 2,6-Dimethyldecane, 2-Methyldecane, 2-Methyloctane, 3,6-Dimethyldecane, 3-Chloromethyl(oxirane), 7-Methylheptadecane, Butyl 2-ethylhexyl phthalate (mixed ester), Chloromethane, Ethyl oleate, Hexadecane, Nonane, Pentadecane, Tridecane, o-Cymene (1-methyl-2-isopropylbenzene) and p-Dichlorobenzene
Gas Chromatography-Mass Spectrophotometry (GC-MS) of Eluents of Methanol Fraction of Uvaria chamae Leaves.

In silico Drug Likeness of the Phytochemicals in Methanol Fraction of Uvaria chamae Leaves Showing the Target Proteins
As in Figure 2, the 3 D view of the target proteins used in the docking which were catalase (PDB IDGH) and SOD (PDB ID: 5VF9) were shown.
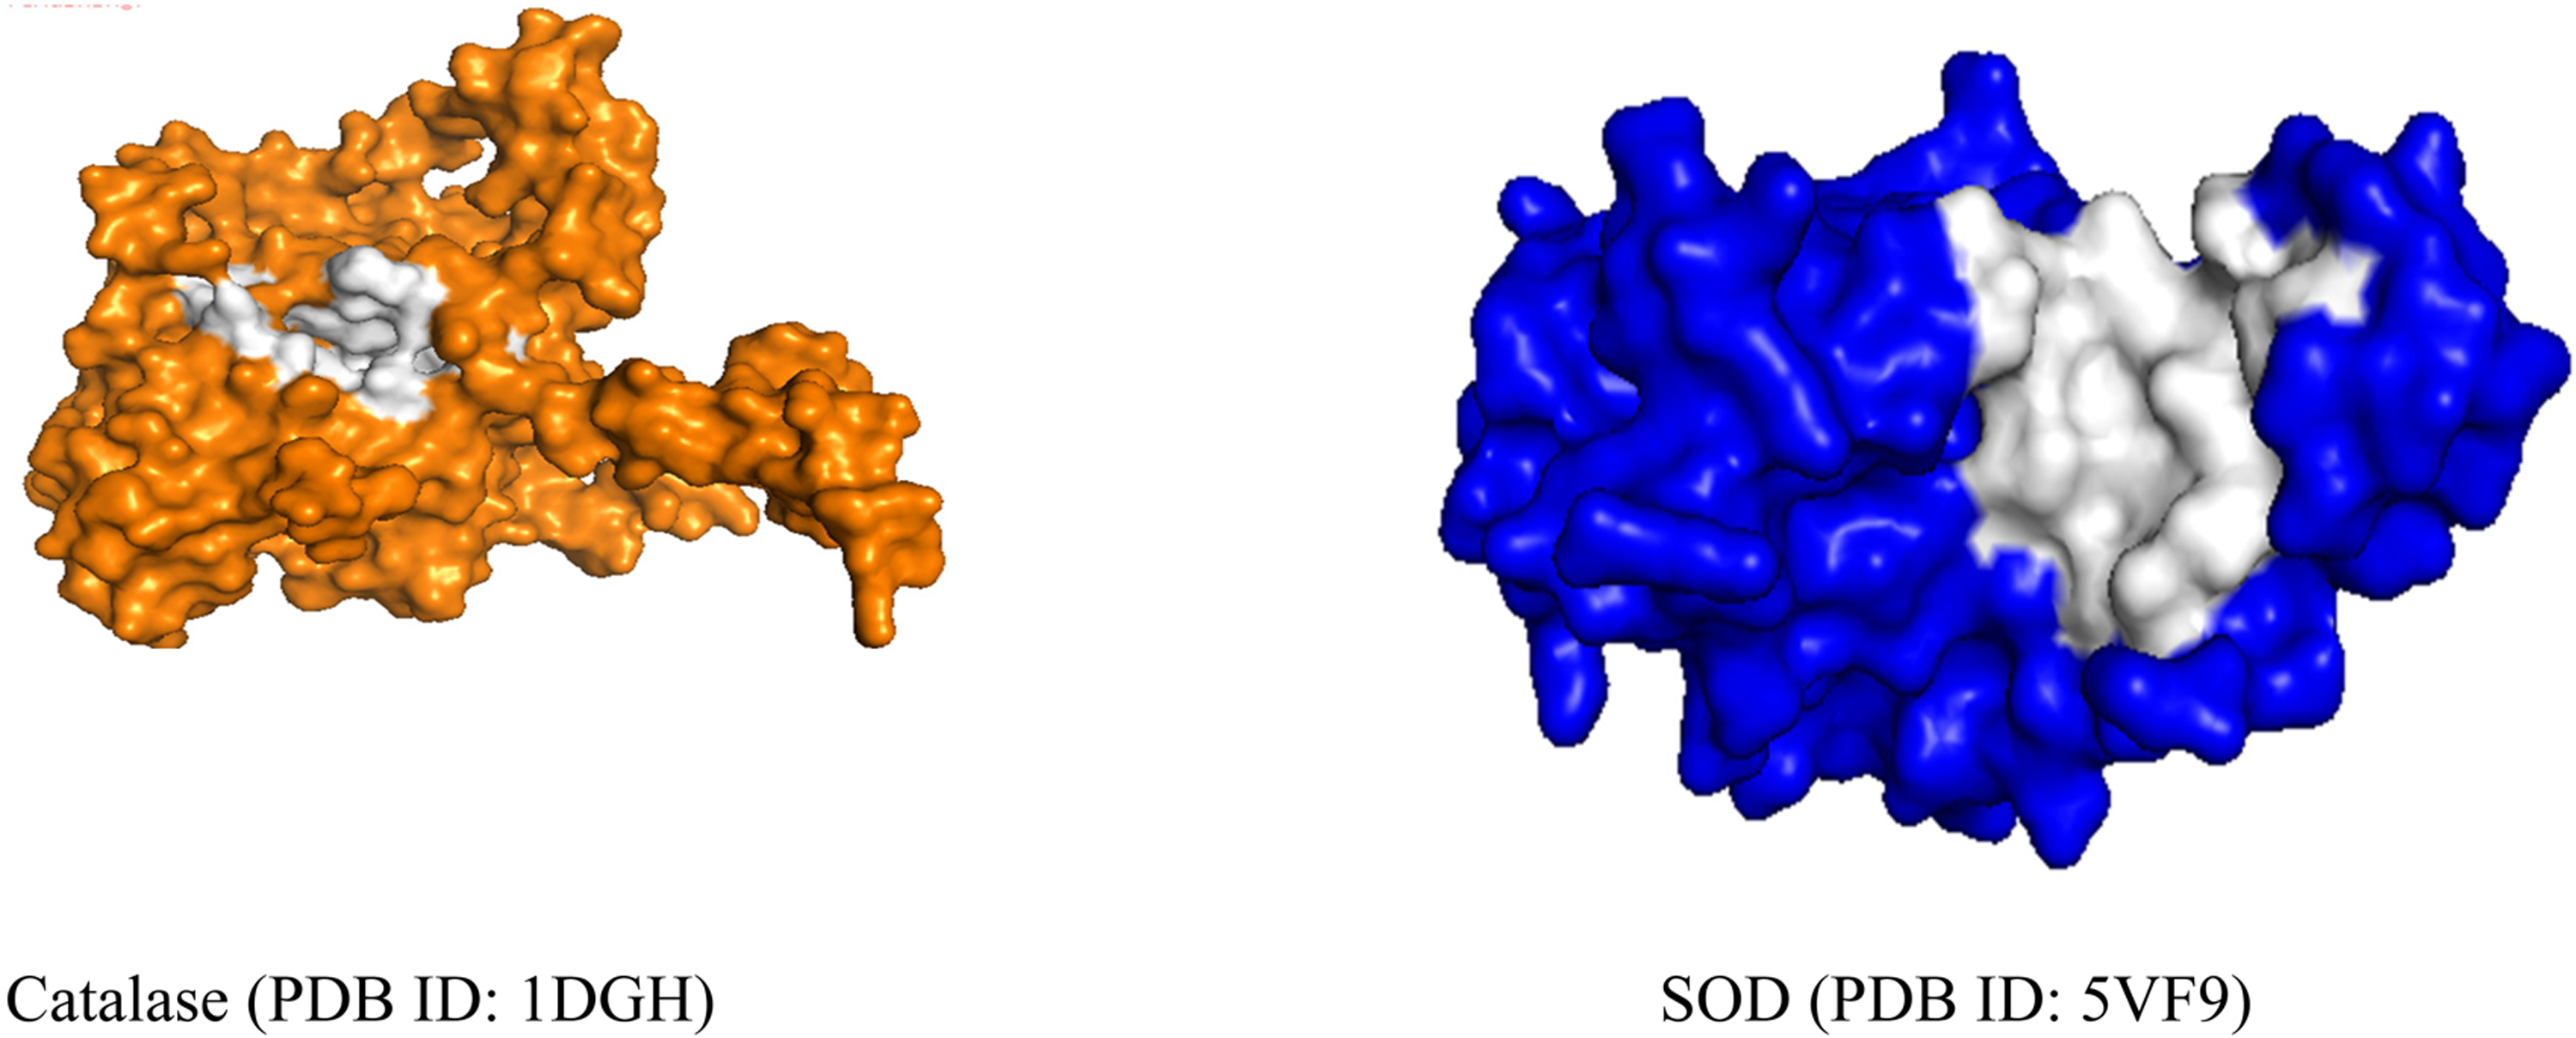
3D (surface) view of target proteins (catalase in orange color while SOD in blue color) and active site region in white color.
In silico Drug Likeness of the Phytochemicals in Methanol Fraction of Uvaria chamae Leaves Showing the Chosen Phytochemicals
As in Table 7, the GC-MS identified phytochemicals against the target proteins were assessed to determine the binding affinities. 10 phytochemicals with the lowest binding affinities for the 2 target proteins were identified and used for the docking. These phytochemicals includes Cyclohexadecane1,2,diethyl, Ethyl oleate, Heptadecane,2,6,10,14 tetramethyl, 2,4, di-tert-butylphenol, Heptadecane 7 methyl, Dodecane 2,6,10- trimethyl, 1,2,Benzene dicarboxylic acid butyl-2-ethyl hexyl ester, 1-Hexacosene, Dodecane, 2, 6, 11- trimethyl and o-cymene.
Binding Affinities of Studied Phytocompounds of Methanol Fraction of Uvaria chmae Leaves Against the Target Proteins (Catalase PDB ID: 1DGH and SOD PDB ID: 5VF9).

In silico Drug Likeness of the Phytochemicals in Methanol Fraction of Uvaria chamae Leaves Showing the 2D Active Sites in the Catalase Enzyme and the Binding of the 10 Phytochemicals to the Active Sites
As in Figure 3, the 2D view of the active sites of the catalase enzyme with the pattern of binding of the 10 phytochemicals to these active sites were shown.

Active site interaction (2D diagram) of studied phytocompounds of methanol fraction of Uvaria chamae leaves against the catalase.
In silico Drug Likeness of the Phytochemicals in Methanol Fraction of Uvaria chamae Leaves Showing the 2D Active Sites in the Superoxide Dismutase (SOD) Enzyme and the Binding of the 10 Phytochemicals to the Active Sites
As in Figure 4, the 2D view of the active sites of the SOD enzyme with the pattern of binding of the 10 phytochemicals to these active sites were shown

Active site interaction (2D diagram) of studied phytocompounds of methanol fraction of Uvaria chamae leaves against the SOD.
In silico Drug Likeness of the Phytochemicals in Methanol Fraction of Uvaria chamae Leaves Showing the Pharmacokinetics and Drug Likeness Properties of the 10 Studied Phytocompounds
As shown in Table 7, the Pharmacokinetics and drug likeness properties of the 10 studied phytocompounds were showed that Cyclohexadecane1,2,diethyl; ethyl oleate; Heptadecane 2,6,10,14-tetramethyl; 2,4-di-tert-butylphenol; Heptadecane-7-methylhexyl ester; Dodecane-2,6,10-trimethyl; 1,2-benzenedicarboxylic acid butyl-2-ethyl; 1-Hexacosene; Dodecane-2,6,11-trimethyl and o-cymene are not hepatotoxic, immunotoxic, cytotoxic and mutagenic to cells. All the 10 studied phytocompounds are not carcinogenic except ethyl oleate and o-cymene.
As shown in Table 8 the in silico toxicity and physicochemical profiling of the identified compounds demonstrates generally high lipophilicity (ClogP 3.54-10.11) with minimal hydrogen bond acceptors (NoHA) and donors (NoHD), reflecting predominantly non-polar hydrocarbon structures. Most compounds were predicted to be non-hepatotoxic, non-cytotoxic, non-mutagenic, and non-carcinogenic, except ethyl oleate and o-cymene, which showed predicted carcinogenic activity, while toxicity classes ranged from III to VI, indicating moderate to low acute toxicity risk.
Pharmacokinetics and Drug Likeness Properties of Studied Compounds.

Legend: MW = Molecular weight (g/mol); NoHA = Number of hydrogen bond acceptors; NoHD = Number of hydrogen bond donors; ClogP = Calculated partition coefficient (lipophilicity); VON = Violation of drug-likeness rules; Toxicity class = Predicted acute toxicity category (III = moderately toxic, VI = non-toxic) (Active = predicted toxic; Inactive = predicted non-toxic).
Discussion
The practice of using plant materials for disease treatment is not peculiar to Africa but also found in several other parts of the world. However, most plants used in traditional medicine for various diseases have not been scientifically proven. 23 Phytochemical screening identified some phytochemical compounds at varying concentrations. This list includes alkaloids, glycosides, reducing sugars, flavonoids, terpenoids, steroids, tannins, and phenols. These compounds, including phenolic acids, flavonoids, and terpenoids, are already extensively documented to be involved in antioxidant activity.24–26 The findings of this study are in line with the report of Onyekwelu et al, 27 which showed that Uvaria chamae leaf methanolic extracts possessed antioxidant as well as free radical scavenging properties.
Phenolic Content and Antioxidant Activity
Antioxidants are crucial for health and disease prevention because they counteract free radicals, which cause oxidation, leading to chronic diseases such as heart disease, diabetes, and various cancers. 28 As indicated in Tables 1 and 2, the ethyl acetate fraction of Uvaria chamae leaves contains the highest levels of the antioxidant phytochemicals. These bioactive compounds play a central role in controlling cellular damage and boosting the body's immune system. 29 The methanolic fraction is significantly higher in alkaloids, glycosides, reducing sugars, flavonoids, and tannin levels than the remaining fractions, with the dichloromethane fraction containing the least phytochemical concentration. These findings are in concordance with the report of Mendonca et al, 30 relating to the excellent antioxidant potential of ethyl acetate fractions, suggesting the potential for the development of plant-based medicines for oxidative stress disease management.
TBARS Assay
The TBARS assay is crucial in evaluating antioxidant defense systems as it measures lipid peroxidation products like malondialdehyde (MDA), a marker of oxidative stress. Table 2 highlights that the dichloromethane fraction of Uvaria chamae leaves exhibited the lowest IC50 (13.86), reflecting the strongest scavenging activity, followed by the ethyl acetate fraction (19.9), crude extract (23.62), methanol fraction (38.9), and the synthetic BHT standard (486.4). This demonstrates the superior efficacy of natural antioxidants in combating oxidative damage. These findings underscore the importance of TBARS in assessing the therapeutic potential of plant extracts, particularly for their role in reducing oxidative stress and supporting overall cellular health. 30
FRAP Assay
The FRAP assay is an important method in evaluating antioxidant defense thiol systems based on the ability of compounds to reduce Fe3⁺ to Fe2⁺ ions. From Table 3, the methanol fraction of Uvaria chamae had the highest reducing power at 21.44 compared to the dichloromethane fraction (19.01), crude extract (17.41), and ethyl acetate fraction (13.94). These results provide further evidence, as stated in Monon et al, 31 and demonstrate that methanol fractions exhibit better antioxidant activity due to their rich phenolic and flavonoid content. This underlines the importance of FRAP measurements for assessing plant extracts for the management of oxidative stress. These results are similar to the work undertaken by Chaves et al, 32 highlighting that the antioxidant activity of the methanol fractions remains high due to the high concentration of phenolic and flavonoid compounds.
Total Antioxidant Capacity (TAC)
The TAC assay evaluates the cumulative antioxidant capacity of all antioxidants present in a sample, providing a comprehensive measure of their combined efficacy. As shown in Table 4, the crude extract of Uvaria chamae exhibited the highest antioxidant activity (84.33), closely followed by the dichloromethane fraction (82.55), ethyl acetate fraction (64.99), and methanol fraction (38.66). These findings align with Chaves et al, 32 emphasizing the synergistic interactions of diverse antioxidants within the crude extract. This synergy enhances its overall efficacy, underscoring the importance of whole-plant extracts in therapeutic applications targeting oxidative stress and related disease conditions.
DPPH Assay
The DPPH assay is a key method for evaluating the free radical scavenging ability of antioxidants, providing insight into their capacity to neutralize oxidative stress. Table 5 highlights the superior antioxidant potential of the Uvaria chamae crude extract (IC50: 4.23), followed by methanol (6.31), ethyl acetate (12.2), and dichloromethane fractions (22.4). Notably, the crude extract surpassed the ascorbic acid standard (IC50: 29.7), showcasing its remarkable efficacy. These results align with Onyekwelu et al 27 and Monon et al, 31 emphasizing the DPPH assay's value in identifying potent antioxidants, with the crude extract offering a synergistic advantage due to its diverse phytochemicals.
In-Silico Drug-Likeness Analysis
The in-silico docking study (Table 7) identified ten key phytochemicals from the methanol fraction of Uvaria chamae leaves with strong binding affinities to catalase (PDB ID: 1DGH) and SOD (PDB ID: 5VF9). All these compounds exhibited lower binding affinity compared to other identified phytochemicals, suggesting a higher potential to bind at the active sites of these enzymes. Some of these phytochemicals, including 2,4-di-tert-butylphenol, have been reported to act as effective antioxidants by Yehye et al, 33 similar to BHT. Additionally, their phenolic structures contribute to hepatoprotective properties, akin to Silymarin's protective effects against liver damage induced by acetaminophen overdose. 34 The molecular docking results indicate that these compounds may enhance catalase and SOD activities, thereby mitigating oxidative stress and engendering protection to hepatocytes.
GC-MS and FTIR Findings
GC-MS analysis identified 31 phytochemicals, of which several possess antioxidant activity, including o-cymene and ethyl oleate. FTIR spectra revealed functional groups such as carboxylic acids, phenols, and esters, which contribute to the antioxidant properties of the extracts. These findings further support the potent antioxidant bioactivity potential of Uvaria chamae extracts.
Limitations of the Study
Limited Scope of Biological Evaluation
The study primarily focused on in vitro antioxidant assays (DPPH, FRAP, TBARS, TAC) and in silico docking analysis without performing in vivo or clinical evaluations. Therefore, the biological relevance of the observed antioxidant activity within living systems is planned to be verified in the next phase of the study.
Restricted Extraction and Fractionation Methods
Lack of funding restricted the fractionation to only a few solvent fractions (methanol, ethyl acetate, dichloromethane, and crude extract). Other alternative solvents or extraction techniques, such as supercritical CO₂ or ultrasonic extraction, would have been included as these might possibly yield different or more bioactive profiles.
Conclusion
This study underscores the therapeutic potential of Uvaria chamae leaves, particularly the methanol and ethyl acetate fractions, as potent sources of natural antioxidants. The combination of phytochemical screening, antioxidant assays, GC-MS, FTIR, and in-silico studies establishes the plant extract as a reservoir of compounds that can be developed into therapeutics against a range of hepatic disorders and a foundation for the further development of plant-based therapies. Future research should explore the pharmacokinetics and clinical efficacy of these compounds using an established model to fully realize their medicinal potential.
Footnotes
Acknowledgments
The authors are grateful to the Staff of the postgraduate Laboratory, Department of Biochemistry, University of Nigeria Nsukka for their technical assistance.
Ethical Considerations
Ethical approval is not applicable.
Consent to Participate
Not applicable.
Consent to Publish
Consent to publish is not applicable.
Authors’ Contributions
CUV: Conceptualization, Methodology, Data Curation, Writing original Draft, Writing review and editing. OCE: Methodology, Data Curation, Investigation, Writing review and editing. ESI: Conceptualization, Methodology, Data Curation, Writing review and editing, Supervision. AOE: Methodology, Data Curation, Investigation, Writing review and editing. PEJ: Conceptualization, Methodology, Data Curation, Writing original Draft, Writing review and editing, Supervision. All authors read and approved the final manuscript for publication.
Funding
The authors received no financial support for the research, authorship, and/or publication of this article.
Declaration of Conflicting Interests
The authors declared no potential conflicts of interest with respect to the research, authorship, and/or publication of this article.
Data Availability Statement
Data have not been previously deposited on any public repository. All the data generated in this study have been included in the manuscript.