
Abstract
Objective
Bergenia purpurascens, a medicinal herb indigenous to southwestern China, has garnered interest for its potential therapeutic properties. This study investigates the herb's water extract's capacity to interfere with the interaction between the COVID-19 S1 Receptor Binding Domain (RBD) and the ACE2 receptor, a critical step in the virus's infection process.
Methods
Quality standards for the Bergenia purpurascens extract were established to ensure consistency. The extract's efficacy was assessed using a Vero-E6 cell infection model to inhibit live virus infection of the COVID-19 XBB1.5 variant. Surface Plasmon Resonance (SPR) was employed to explore the mechanism of action. The extract's composition was further analyzed using Ultra-Performance Liquid Chromatography-Tandem Mass Spectrometry (UPLC-MS/MS), with active compounds identified through a combination of in silico screening and actual activity testing.
Results
The water extract of Bergenia purpurascens demonstrated significant inhibitory activity against the COVID-19 XBB1.5 variant, with stability and high potency, reflected by an IC50 value of 0.037 mg/mL. The selectivity index for the antiviral effect is approximately 9. The extract's composition was predominantly Phenylpropanoids and Carbohydrates, accounting for over 60% of the total. Interestingly, a majority of the high-content compounds were inactive, while the low-content compounds, exemplified by Ellagic acid, showed synergistic activity. The extract's inhibitory mechanism was characterized as a non-specific inhibition of ACE2 with a steady-state binding affinity (KD) of 7.9 × 10⁻⁷ M.
Conclusions
The study concludes that the water extract of Bergenia purpurascens is a promising, cost-effective non-specific ACE2 inhibitor with potential applications in COVID-19 therapy. The identification of active compounds and the elucidation of its inhibitory mechanism provide a foundation for further research and development of this traditional medicinal herb in combating viral infections.
Abbreviations:
Introduction
On May 5, 2023, the World Health Organization (WHO) declared that COVID-19 no longer represented a public health emergency of international concern. Nevertheless, it is of utmost importance to recognize that SARS-CoV-2 persists in its evolution. New variants, like the Omicron variant, exhibit high contagiousness and possess the ability to circumvent the immunity bestowed by previous infections. The protection provided by prior SARS-CoV-2 infections is limited. 1 Despite the development of effective antiviral medications and clinical management strategies, the effectiveness of current antiviral treatments against future mutants remains indeterminate. This situation emphasizes the need for continuous and dedicated efforts in the development of novel, broad-spectrum treatment alternatives. 2
The COVID-19 virus's spike (S) protein plays a crucial role in infiltrating and infecting human cells.3,4 Through its interaction with the angiotensin-converting enzyme 2 (ACE2) receptor present on the surface of human cells, the S protein facilitates the entry of the virus into these cells. 5 The S protein, a glycoprotein comprising two subunits-S1 and S2, plays a crucial role in viral invasion and replication. Within the S1 subunit lies the receptor-binding domain (RBD), responsible for recognizing and binding to ACE2 receptors. On the other hand, the S2 subunit facilitates the fusion of the viral membrane with the host cell membrane, enabling the virus to invade and replicate within the host cell.6,7 ACE2 receptors are widely distributed throughout various tissues in the human body, with particularly high prevalence in the lungs, heart, and kidneys. 8 The interaction between the S protein of the virus and the ACE2 receptor induces a structural change, aiding in the invasion and infection of the virus. 5 After the virus enters the cell, its genetic material (RNA) is released into the cytoplasm. The virus then takes control of the cell's machinery and starts replicating, producing more viral particles. These particles are subsequently released from the infected cell, enabling the virus to spread throughout the body. This infection process can damage the infected cells and lead to tissue damage and inflammation, especially in the lungs. 9 As the virus progresses, it can induce widespread inflammation, causing severe symptoms like fever, cough, and difficulty breathing.10,11 Currently, researchers are exploring potential therapies that target the S protein and disrupt its interaction with ACE2 receptors, thus impeding viral entry and infection. Further investigation is crucial to fully understand this interaction and develop effective treatments and vaccines for COVID-19.12,13
Bergenia purpurascens (Hook.f.et Thoms.) Engl. is an important plant that possesses considerable value as a source of medicine, food, and decoration. Belonging to the Genus Bergenia in the Saxifragaceae family, it exhibits a slow growth rate and is primarily distributed across the highland regions of southwestern China and other parts of Asia. 14 Both the whole plant and rhizome of B. purpurascens possess medicinal properties, owing to their high content of polyphenolic compounds such as bergenin and arbutin. Bergenin, in particular, has been identified as a potent bioactive agent and has been successfully developed into a listed drug, known as Compound Bergenin Tablets, for the treatment of chronic bronchitis. These findings indicate the significant potential of B. purpurascens as a source of natural remedies for various ailments. 15 B. purpurascens has exhibited notable effectiveness in the treatment of various ailments, such as pneumonia, tuberculosis, gastric ulcer, and acute respiratory distress syndrome (ARDS), in addition to its established therapeutic value in chronic bronchitis. These findings underscore the broad-spectrum activity and versatility of this plant species, further emphasizing its potential as a valuable natural resource for the development of novel medicines. 16 Given that the traditional use of Bergenia purpurascens is primarily related to respiratory diseases, we have reason to believe that it may also have therapeutic potential in the treatment of COVID-19 infections.
The assessment of the inhibitory activity of Bergenia purpurascens water extracts serves as the basis of this study, which aims to characterize its chemical composition and delineate its inhibitory activity mechanism towards ACE2. Identification of the non-specific ACE2 inhibitor, as discovered in this study, could lead to the recommendation of potential therapeutic alternatives for treating disorders associated with ACE2.
Materials and Methods
Herbs and Reagents
The herbs used in this study were obtained from two herbal medicine markets, Xining Herbal Medicine Market in Qinghai Province and Bozhou Herbal Medicine Market in Anhui Province, China. Professor Lijuan Mei, an expert in Plant Taxonomy, identified the herbs. Herbs that couldn't be identified were excluded. Finally, 53 herbs were left for subsequent research. The herb Bergenia purpurascens was confirmed by comparing with plant specimen PE 01800798. All herb materials are preserved for further analysis. Each of the 53 herbs has a unique ID number, as shown in Table S1. The herbs and their water extracts are stored at 4°C in Laboratory 205, Building 2 of the Northwest Plateau Institute of Biology, Chinese Academy of Sciences.
SARS-CoV-2S1protein(40591-V08H), human ACE2 protein (10108-H08H), COVID-19 neutralization antibody (40591-MM43), COVID-19 Nucleoprotein antibody (40143-R004) were purchased from Sinobiological Technology Co., Ltd (Beijing, China).
The variant strain of the XBB1.5 and the Vero-E6 cells were provided by the Guangzhou Customs Technology Center (Guangzhou, Guangdong, China).
The immunochromatographic test strips were manufactured and provided by Qinghai Altimerit Biotechnology Co., Ltd (Xining, Qinghai, China). The dry immunofluorescence analyzer was provided by Qinghai Altimerit Biotechnology Co., Ltd (Xining, Qinghai, China).
11-O-Galloylbergenin was provided by Shanghai Taoshu Biotechnology Co., Ltd (Shanghai, China). Rehmaglutin C was provided by Chemface technology Co., Ltd (Wuhan, Hubei, China). Citric Acid was provided by Macklin Inc. (Shanghai, China). Melezitose was provided by Boer Chemistry Co., Ltd (Shanghai, China). Regaloside H was provided by Chemface technology Co., Ltd (Wuhan, Hubei, China). Arbutin was provided by Aladdin Scientific Corp. (Shanghai, China). Bergenin was provided by Yuanye Biotechnology Co., Ltd (Shanghai, China). Sucrose was provided by Macklin Inc. (Shanghai, China). Ellagic acid, luteolin and apigenin were provided by Shifeng Biotechnology Co., Ltd (Shanghai, China).
Preparation of Herb Extracts
The herbs utilized in the study underwent a five-day air-drying process in a room set at ambient temperature. Next, the dried herbs were cut into 0.5 cm segments, inserted into a nylon mesh bag, and weigh-measured. Purified water was then added to an extraction vessel at a ratio of 30 times the weight of the herbs. The mixture was heated until it reached boiling point, and left to extract for 2 h. Afterward, the water extract was dried using an electric drying oven at a temperature of 60 °C, yielding a powdered dried water extract. The powder sample was properly labeled and stored in a sealed glass jar under optimum dry conditions with varied temperatures.
Activity Evaluation
Put the test samples into the sample wells of the reagent strip and let it stand for 15 min. An immunofluorescence analyzer was used to separately measure the fluorescence values of the T-line and C-line. A regression analysis with log2 (T-line fluorescence value / C-line fluorescence value) as the dependent variable and log2 (neutralizing antibody concentration) as the independent variable showed a correlation curve. This curve indicates that the neutralizing antibody blocks the binding between ACE2 and S1 proteins. It also confirms an approximate inverse correlation between log2 (neutralizing antibody concentration) and log2 (T-line fluorescence value / C-line fluorescence value). Thus,-log2 (T-line fluorescence value / C-line fluorescence value) (Activity value) can be used to comparatively and quantitatively measure and evaluate the activities of the tested compounds.
HPLC and UPLC-MS
An HPLC analysis was performed on a Hanbang NP7001C HPLC system with a dual-wavelength UV detector. Components were separated on a Hanbang C18 column (5 μm, 4.6 × 250 mm). The mobile phase, composed of water-formic acid (A; 100:0.1, v/v) and acetonitrile-formic acid (B; 100:0.1, v/v), used a 0–40-min gradient elution from 5% to 95% B at a 1.0 mL/min flow rate. Compounds were detected at 275 nm, with the column at 30°C and 20 μL sample volume. For sample preparation, mill the sample uniformly with liquid nitrogen, weigh about 100 mg into a 1.5 mL centrifuge tube. Add pure water solution (with 4 μg/mL mixed internal standard), vortex for 1 min and add steel beads. Pre-cool in a-40 °C chiller for 2 min, then grind at 60 Hz for 2 min. Next, perform ultrasound-assisted extraction in an ice-water bath for 60 min, followed by-40 °C incubation for 30 min. Centrifuge at 12000 rpm and 4 °C for 10 min, collect the supernatant through a 0.22 μm hydrophilic membrane filter. Store the sample at 4 °C overnight, centrifuge again under the same conditions, dilute 10-fold with pure water solution containing 4 μg/mL mixed internal standard. After centrifuging, collect all the supernatant through the 0.22 μm filter, place it in an LC-MS sample vial for analysis. The analytical instrument was an ACQUITY UPLC I-Class HF UPLC-triple quadrupole MS system. Chromatographic conditions: ACQUITY UPLC HSS T3 column (100 mm × 2.1 mm, 1.8 μm), 45°C column temperature, mobile phase A (water with 0.1% formic acid) and B (acetonitrile), 0.35 mL/min flow rate, 5 μL injection volume, PDA scan from 210–400 nm. For MS parameters, HESI was the ion source. Sample MS signal acquisition used separate positive and negative ion scan modes, with data acquired in DDA mode and Full MS/dd-MS2 scanning mode.
Inhibition Activity Evaluation with SARS-CoV-2 XBB 1.5 Variant
To culture Vero-E6 cells, thaw and transfer them to a tube with complete culture medium. Centrifuge at low speed, transfer the cell pellet to a culture flask, and place in an incubator. Passage the cells when they reach 80–90% confluency. The experiment has three groups: sample-treated, cell control, and blank control. Dilute the sample and measure in triplicate wells. Culture Vero E6 cells in a 96-well plate with the sample, CCK-8 reagent, and DMEM culture medium. Incubate the plate and measure the absorbance at 450 nm to create a cell viability curve for determining the maximum non-lethal sample concentration.
The Guangzhou Customs Technology Center determined the complete genome sequence of the COVID-19 XBB1.5.7 variant used in this study. Upload the sequence to the Nextclade database for classification. The results in Figure S2A of the Supplemental materials confirm the correct variant was used. Culture Vero E6 cells in a 96-well flat-bottomed plate at 2 × 10⁴ cells per well. After 12 h when cells reach 90% confluency, discard the supernatant and prepare a new 96-well round-bottomed plate. Add 20 μL of virus stock solution to Row A of this plate, then make 10-fold dilutions in 8 replicate wells for each dilution. Add 100 μL of each diluted virus fluid to the supernatant plate wells. Incubate the plate at 37 °C with 5% CO2 for 72 h. Observe and record CPE, and calculate the TCID50 using the Reed-Muench method (Figure S2B).
Dilute extract 11# to 0.33–0.0041 mg/ml in D2 medium (DMEM + 2% FBS) to make the drug incubation culture medium. The experiment has three groups: control, virus-infected, and drug-virus interaction. Each group has three replicate drug dilutions. Before infecting Vero E6 cells with the virus, add 100 μL of the appropriate drug incubation culture medium per well and incubate at 37 °C with 5% CO2 for 2 h. Then, dilute the virus in D2 medium (DMEM + 2% FBS) with an MOI of 0.2 and add to Vero E6 cells treated with each drug concentration. After 24-h incubation, fix the cells with 4% PFA fixative solution, then stain with specific primary and secondary antibodies. Take cell images and quantitatively measure the fluorescence intensity with the Celigo system to assess the viral infection level.
Measurement of Intermolecular Forces
Surface plasmon resonance (SPR) measurements were done with a BIAcore T200 instrument at 25 °C. In the experiment, SARS-CoV-2 S1 protein and ACE2 protein were separately immobilized on a CM5 sensor chip. A blank channel served as the negative control for each assay. During binding analysis, ligands were given in two-fold serial dilutions over the immobilized SARS-CoV-2 S1 or ACE2 on the biosensor chip. The binding kinetics of the interactions were evaluated with the 1:1 binding model. KD (dissociation constant) values were calculated using a kinetics model from the BIAcore T200 analysis software. Analyzing the binding data from SPR measurements enabled the software to generate KD values, indicating the interaction strength between ligands and immobilized proteins.
Virtual Screening and Molecular Docking
To identify compounds from the UPLC-MS/MS experiment, we first analyzed each compound's drug-like properties. Using Lipinski's rule of five as a standard, we selected compounds meeting these requirements for further screening. To evaluate the efficacy of the selected compounds, we used Discovery Studio 2.5 software (Accelrys, Inc., San Diego, CA, USA) for molecular docking studies. The 3D structure of the ACE2-S1 complex (PDB code: 7ufl) was obtained from the Protein Data Bank (www.rcsb.org). For the molecular docking of Erythritol, we used the LibDock method. Before docking, we added hydrogen bonds and minimized energy with the CHARMM force field. Finally, we identified the enzyme's active site as the binding site to start the docking protocol and rank compounds by efficacy.
Data Analysis
Statistical analyses used the ANOVA test, and results were shown as mean ± SEM Values were considered significant at *p<0.05 and **p<0.01.
Results
Establishment of Immunochromatographic Analysis Methods
Figure 1A shows that Eu-labeled fluorescent microspheres were used to label S1 protein and chicken IgY antibody for chromatography, with a bright fluorescent line at the T line due to the interaction between Eu-labeled microspheres and the ACE2-coated T line and a visible one at the C line due to the interaction with Eu-labeled microspheres labeled with chicken IgY, and when the binding of S protein and ACE2 was inhibited, the fluorescence at the T line decreased while that at the C line remained unchanged.

Study water extracts activity. (A) Eu fluorescent microspheres were selected to label S1 protein and chicken IgY antibody, respectively, to perform chromatography. Upon interaction with the T line coated with ACE2, Eu fluorescent microspheres labeled with S protein resulted in the formation of a luminous fluorescent line at the position of the T line. Similarly, Eu fluorescent microspheres labeled with chicken IgY produced a conspicuous fluorescent line when they interacted with the C line coated with sheep anti-chicken IgY antibody. In the presence of inhibitors, the binding between S protein and ACE2 is hampered, leading to a decline in fluorescence at the T line. However, regardless of the sample fluid, the fluorescence at the C line remains constant and unaffected. (B) 53 samples were applied to the sample hole of the reagent strip. After a 15-min incubation period, the fluorescence values were recorded by dry immunofluorescence analyzer. The-log2 (T/C) was used as the activity value to evaluate and rank the biological activities of each sample. (C) The horizontal axis is the base-2 logarithm of the concentration of neutralizing antibodies targeting the RBD region of S1 protein, and the vertical axis is the negative base-2 logarithm of the ratio of T-line fluorescence value to C-line fluorescence value (activity value). Linear regression was performed and a good linear relationship was found. (D) Using the immunochromatographic strip to detect the concentration-activity value correlation curve of the 11# water extract, a significant sigmoid curve was observed. (E) Bioactivity testing of 11# water extract prepared from herbs of different origins. (F) Biological activity detection of 11# water extract prepared with different herbal medicine-extract solution ratios. (G) Biological activity detection of 11# water extracts prepared at different extraction temperatures. (H) Biological activity testing was conducted on the 11# water extract after it was stored at room temperature for different periods of time. (I) Biological activity testing was conducted on 11# water extract after storage at 37°C for different periods of time. (J) Biological activity testing was conducted on 11# water extract after it was stored at 50°C for different periods of time. (K) The 11# water extract can be directly dissolved in water or separately dissolved in methanol or ethanol. After dissolution in methanol or ethanol, the supernatant is collected by centrifugation, and the solute is dissolved in water after the solvent is evaporated under vacuum. The active testing is then conducted. (L) The biological activity of 11# water extract was tested after reconstitution with water, methanol, or ethanol. (n = 3).
To quantitatively evaluate, we needed to show the functional value of this fluorescent chromatography immunoassay method. We diluted recombinant COVID-19 S1 protein neutralizing antibody into solutions with concentrations from 1 to 60 μg/mL and tested them with this method. The results showed a positive linear correlation between antibody concentration and activity value, indicating the method can be used for inhibition activity evaluation (Figure 1C).
Screening Active Extracts and Optimal Extracting Conditions
During the preliminary screening, all water extracts were made at 3 mg/mL, with each sample repeated twice. Figure 1B shows 16 out of 53 herbal extracts had activity values over 4.0, and 5 extracts had excellent activity above 4.6. We chose the most active water extract, #11, for further study (Figure 1B and Table S1 in Appendix A). To find the concentration-activity relationship of #11 water extract, we began with 10 mg/mL and diluted it in 2-fold gradient to get the half-maximal inhibitory concentration (IC50). Figure 1D shows as the #11 water extract concentration drops, its inhibitory activity also falls. The IC50 value was 0.39 mg/mL. We extracted raw materials at 70°C, 80°C and 95°C. The 95°C extract had higher activity than those at 80°C and 70°C (Figure 1G). We also studied the herb-to-water ratio (1:30, 1:40, 1:50) and found the extract activity was similar for all ratios (Figure 1F). To check the extraction process, we used different herb sources and the same method. Figure 1E shows water extracts from different sources had no significant activity difference. Finally, we tested different solvents (methanol, ethanol, water) for re-dissolving the dried water extract. The water extract had much higher activity, while methanol and ethanol extracts had no activity (Figure 1K). We tested the extract's activity after storage at room temperature for 0, 10, 20 days and at 37°C. There was no significant activity decrease (Figure 1H and 1I). In the accelerated stability test at 50°C, no significant activity drop was seen on days 0 and 2 (Figure 1J).
Study on Extracts Quality Standards
Three batches of 11# water extracts (Batch202303, Batch202304, and Batch202305) were prepared using the optimal extraction method for quality-standardization studies. Bergenin was designated as the marker compound for 11# water extracts. Its contents in the three batches were 9.58%, 9.90%, and 8.86% (Figure 2A and 2B). Controlling the bergenin content was a straightforward way to regulate the raw materials. Subsequently, the moisture content of the three batches was measured, with results of 3.96%, 5.37%, and 4.16% (Figure 2C), which aided in controlling the quality of the water extracts. Fluorescence immunochromatography was employed to assess the inhibitory performance of the extracts, and the IC50 values were 0.39 mg/mL, 0.22 mg/mL, and 0.67 mg/mL respectively (Figure 4D). This provided a regulatory standard for evaluating the biological activity of the water extracts. In summary, based on the above standardization results, the quality thresholds for 11# water extracts should include a bergenin content of at least 8.5%, a moisture content of at most 6%, and an IC50 value of at most 0.7 mg/mL.

Study on the quality standard of 11# water extract. (A) Performing linear regression analysis with bergenin mass as the variable and peak area as the function value, we found that bergenin showed a linear relationship with peak area in the range of 0.05 to 0.7 mg/mL, with an R-squared value of 0.9935. (n = 3) (B) After analyzing three batches of 11# water extracts using HPLC, we found that the bergenin content varied between batches, with percentages of 9.58%, 9.90%, and 8.86%, respectively. (n = 3) (C) We conducted moisture content analysis on three batches of 11# water extracts and found that during a drying process of 100 min, the extracts lost 3.96%, 5.37%, and 4.16% of their weight due to moisture loss. (n = 3) (D) In vitro activity testing of three batches of 11# water extracts using immunochromatographic assay showed that all the batches possessed activity, with IC50 values of 0.39 mg/mL, 0.22 mg/mL, and 0.67 mg/mL, respectively. (n = 3).
Live Virus Infection Test
As depicted in Figure 3A, CCK-8 analysis demonstrated a concentration-dependent decline in cell viability. Lower concentrations of the active water extracts exerted no significant influence on cell viability. However, as the concentration increased, cell viability decreased. When the concentration of the 11# water extract reached 1 mg/mL, cell viability dropped significantly, suggesting that the highest safe concentration was 0.33 mg/mL.
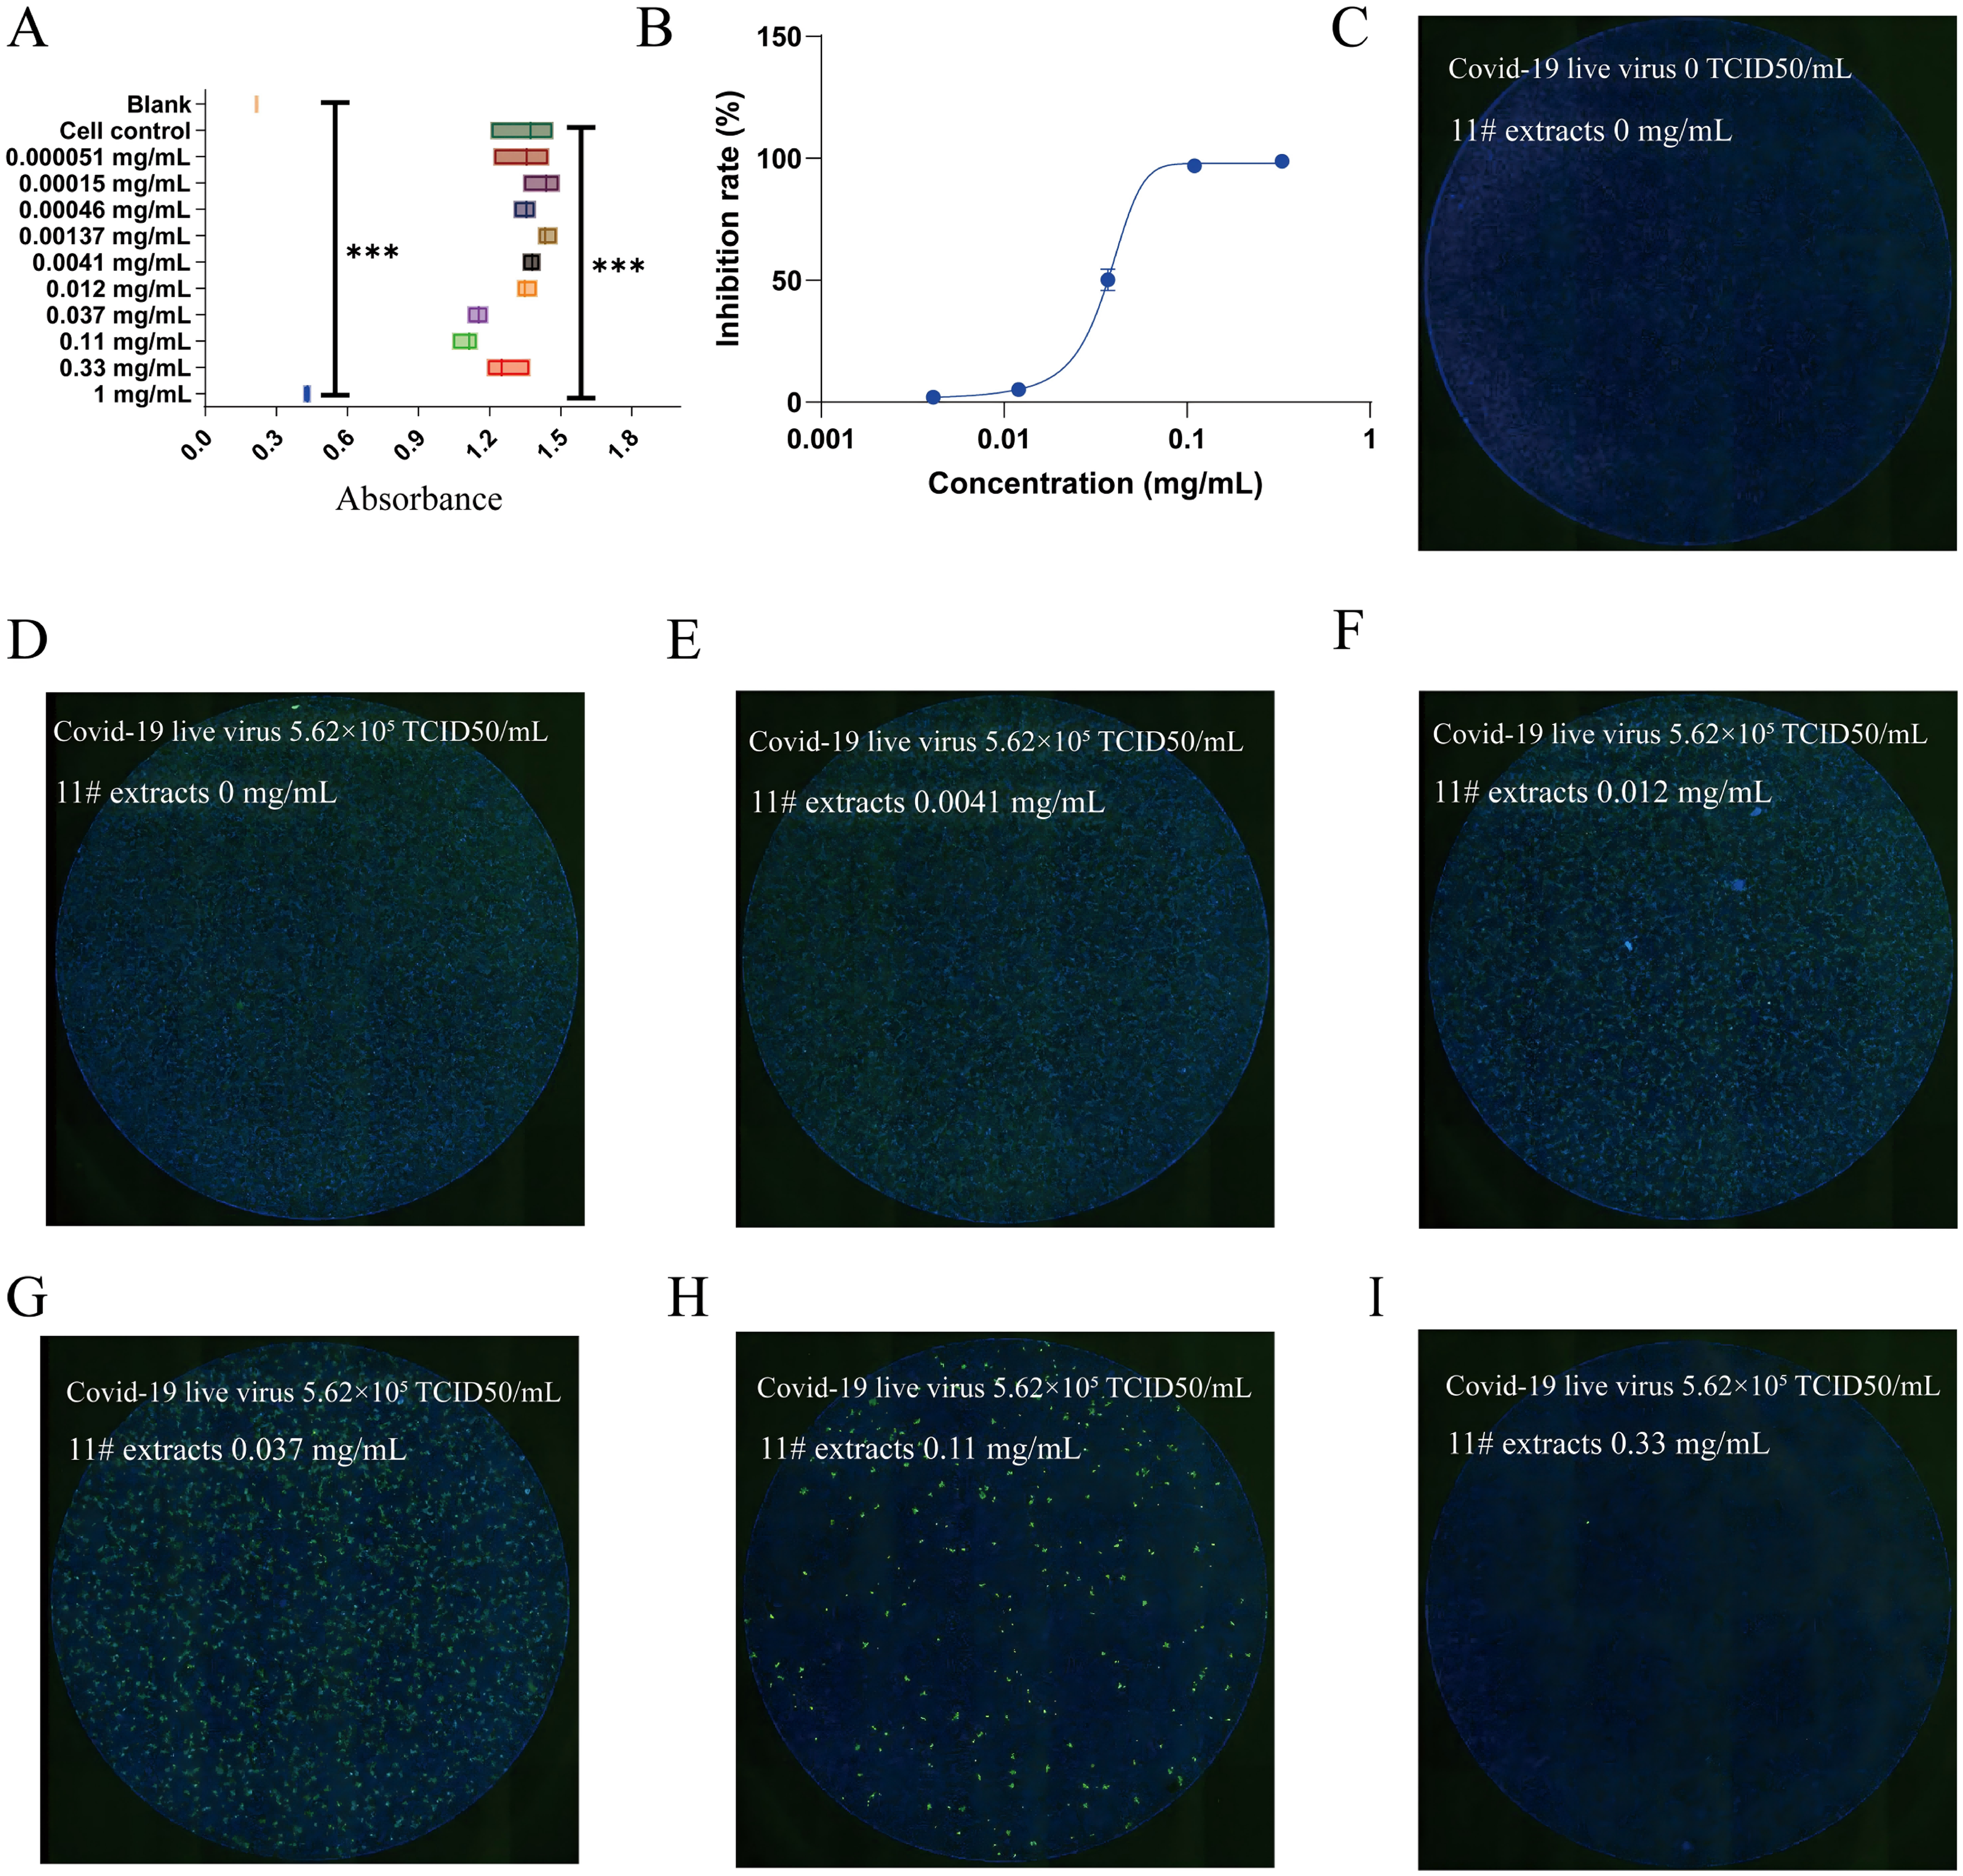
The 11# water extract inhibited COVID-19 infection in the live virus experiment. (A) The toxicity of different concentrations of 11# water extract on Vero-E6 cells was studied using the CCK-8 method. (n = 3)(B) Within the safe concentration range, we studied the inhibitory rate of different concentrations of 11# water extract on the inhibition of COVID-19 XBB 1.5 variant strain live virus infection in Vero-E6 cells. (n = 3) (C-I) After pre-mixing different concentrations of 11# water extract with COVID-19 live virus, the cells were infected with the virus and stained with immunofluorescence to detect the green fluorescence of COVID-19 nucleocapsid protein. The nucleus is stained with Dapi dye and emits blue fluorescence.
Figure S2A reveals that following next-generation sequencing of the COVID-19 variant strain, the virus clade was classified as 23A, belonging to the Pango lineage XBB1.5.7. In Figure S2B, black dots represent the cytopathic effect (CPE) induced by virus treatments in the wells of a 96-well plate. Through counting and observation, no CPE was detected at the highest viral dilution (10−6). At a 10−5 dilution, CPE was observed in 2 out of 8 wells, and at a 10−4 dilution, all 8 wells exhibited CPE. Using the Reed-Muench method, the virus titer was calculated to be 5.62 × 10⁵ TCID50/mL.
In Figure 3C, cells in the control group grew densely, indicating a normal cell state. The virus-positive group had an infection rate exceeding 95%, validating the successful establishment of the model. At a concentration of 0.33 mg/mL, the extracts exhibited significant inhibitory effects, as evidenced by minimal green virus staining, which indicated their effectiveness (Figure 3I). At a concentration of 0.0041 mg/mL, the attenuating effect was minimal, as numerous green virus-stained spots were present (Figure 3E). As the extract concentration increased, the number of green spots gradually decreased (Figure 3F-3H). Quantitative IC50 assessment indicated that the potency of the 11# extract was 0.03671 mg/mL (Figure 3G).
The highest safe concentration CG50 of water extract 11# is 0.33 mg/mL. The IC50 value of extract 11# is 0.03671 mg/mL. Then, the selectivity index (SI) is calculated by the formula:

Exploring the Inhibiting Mechanism of Extracts 11#
Figure 4A depicts the components involved in protein-protein interaction studies. The green ellipse represents the COVID-19 spike protein, the pink polygon represents the ACE2 receptor, and the light-green hexagon represents the herbal extract participating in interferon-mediated protein-protein interaction.

The mechanism of the inhibitory activity of 11# water extract was investigated using SPR. (A) The meanings of different icons. (B) Assuming that the average molecular weight of Extract 11 is 500 Daltons (Da), prepare different concentrations of aqueous solution of Extract 11 ranging from 1.56 to 100 μM, and then study the interaction between different concentrations of Extract 11 and Protein S1. (C) Assuming that the average molecular weight of Extract 11# is 500 Daltons (Da), prepare different concentrations of aqueous solution of Extract 11# ranging from 1.56 to 100 μM, and then study the interaction between different concentrations of Extract 11# and ACE2. (D) Solubilizing ACE2 proteins into different concentrations and passing them through channels coated with S1 protein to study the binding interaction between S1 protein and ACE2. (E) Under the interference of 11# water extract, pass the different concentrations of ACE2 protein solution through channels coated with S1 protein to observe the interaction between S1 protein and ACE2. (F) Compare the curves of the interaction between the stationary phase S1 protein alone and the mobile phase ACE2 protein, the interaction between the stationary phase S1 protein and the mobile phase ACE2 protein under the interference of the 11# water extract, and the interaction between the stationary phase S1 protein alone and the mobile phase 11# water extract. (G) The stationary phase S1 protein first forms a complex with ACE2 in the mobile phase, and then attempts to destroy this formed complex using the 11# water extract alone. (H) Solubilizing S1 proteins into different concentrations and passing them through channels coated with ACE2 protein to study the binding interaction between S1 protein and ACE2. (I) Under the interference of 11# water extract, pass the S1 protein solution through channels coated with ACE2 protein to observe the interaction between S1 protein and ACE2. (J) Compare the curves of the interaction between the stationary phase ACE2 protein alone and the mobile phase S1 protein, the interaction between the stationary phase ACE2 protein and the mobile phase S1 protein under the interference of the 11# water extract, and the interaction between the stationary phase ACE2 protein alone and the mobile phase 11# water extract. (K) The stationary phase ACE2 protein first forms a complex with the S1 protein in the mobile phase, and then attempts to destroy this formed complex using the 11# water extract alone.
Initially, the S1 protein was immobilized on CM5 chips, and the binding of either the ACE2 protein or the 11# water extract in the mobile phase was analyzed (Figure S3A). The 11# water extract was prepared at concentrations ranging from 1.56 μM to 100.00 μM. Binding was observed between the 11# water extract and the immobilized S1 protein, with a dissociation constant (KD) value of approximately 1.32 × 10⁻⁶ M (Table 1, Figure 4B). Similarly, for the ACE2 protein at concentrations from 6.25 nM to 100.00 nM, strong binding to the immobilized S1 was detected (Figure 4D), with a KD value of approximately 2.92 × 10⁻¹⁰ M (Table 1). Pre-mixing the 11# water extract with the ACE2 protein significantly decreased the binding between S1 and ACE2 (Figure 4F), with a KD value of 4.54 × 10⁻⁹ M (Table 1). These results indicated that the 11# water extract strongly interfered with the binding of ACE2 and S1 (Figure 4H).
Kinetic Affinity Data.

Subsequently, to elucidate the inhibition mechanism, the binding of the 11# water extract or S1 protein to the immobilized ACE2 on CM5 chips was analyzed (Figure S3B). For the 11# water extract at concentrations from 1.56 μM to 100.00 μM, binding to the immobilized ACE2 occurred, with a KD value of approximately 7.95 × 10⁻⁷ M (Figure 4C). For the S1 protein at concentrations from 6.25 nM to 100.00 nM, strong binding to the immobilized ACE2 was noted (Figure 4E), with a KD value of approximately 5.132 × 10⁻¹⁰ M. Pre-mixing the 11# water extract with the S1 protein decreased the binding between S1 and ACE2 (Figure 4G). Although the 1:1 computational model was disrupted and the software was unable to calculate the binding KD value between S1 and ACE2 in the presence of 11# water extract interference, a significant reduction in the interaction between S1 and ACE2 was observed in the presence of 50 nM 11# extract (Figure 4I).
Finally, an investigation was conducted to determine whether the 11# water extract could disrupt the pre-formed ACE2-S1 protein complex. The ACE2 protein was coated on the CM5 chip. When only S1 protein samples flowed through the channel, the resonance unit (RU) value increased significantly. Subsequently, when only the 11# water extract flowed through the complex channel, a typical ternary binding pattern was observed, indicating that the 11# water extract could still bind to the pre-formed ACE2-S1 protein complex (Figure 4K). Reversing the positions of the ACE2 and S1 proteins yielded similar results. Coating the S1 protein on the CM5 chip, passing only the ACE2 protein sample increased the RU value. Passing only the 11# water extract through the complex channel showed a typical ternary binding mode, suggesting that the 11# water extract could bind to the pre-formed S1-ACE2 protein complex (Figure 4J).
Composition Analysis
As presented in Figures 5A and 5B by the Total Ion Chromatogram (TIC) and Base Peak Chromatogram (BPC), the results of UPLC-MS detection show that most substances in the 11# water extract sample were eluted within the time range of 0.5 to 6 min. This time frame is characteristic of water extracts with high polarity. Among the identified chemicals, phenylpropanoids, carbohydrates, and glycosides were predominant, accounting for more than 65% of the total composition of the sample (Figure 5C), particularly coumarins and glycoside compounds (Figure 5E). In terms of quantity, phenylpropanoids were the most abundant (Figure 5D). Specifically, glycosides, coumarins, and simple phenylpropanoids were the most common compound classes (Figure 5F). Metabolomics mass spectrometry identified over 300 compounds. The corresponding raw data is provided in the Supplemental materials. For detailed information on the specific compound composition, refer to Appendix B.

Components analysis by UPLC-MS/MS. (A) Total ion chromatography for mass spectrometry detection, retention time is the horizontal axis. (B) Base peak chromatogram for mass spectrometry detection, retention time on the horizontal axis. (C) A total of 350 compounds were identified by UPLC coupled with high-resolution mass spectrometry. The small balls of each color in the figure represent a type of compound. The number of small spheres represents the relative content of this type of compound. (D) The small balls of each color in the figure represent a type of compound. The number of small spheres represents the number of this type of compound. (E) Classify these compounds using a more specific categorization method. Different colored balls represent different categories of compounds, while the number of balls represents the content of each category of compounds. (F) Classify these compounds using a more specific categorization method. Different colored balls represent different categories of compounds, while the number of balls represents the number of each category of compounds.
The Biological Activity of the Main Components
Our analysis identified eight compounds that were consistently present in the water extract, and their combined relative contents exceeded 74%. These compounds were Bergenin, Regaloside H, Citric acid, Sucrose, Arbutin, Rehmaglutin C, 11-O-Galloylbergenin, and Melezitose (Figure 6A). Subsequently, further activity studies were carried out on these eight identified compounds. Nevertheless, none of these compounds exhibited IC50 values lower than 2 mg/mL. Additionally, their activity was significantly lower compared to that of the original 11# extract (Figure 6B-6I). Despite this, it remains possible that the efficacy of the extract could be attributed to the presence of constituents occurring in low proportions.

Activity study of high-concentration chemicals. (A) There are eight high-content compounds in the 11# water extract, and their total relative content accounts for 73%, while other substances account for only 26%. The activity of different concentrations of Bergenin (B), Regaloside H (C), Citric acid (D), Sucrose (E), Arbutin (F), Rehmaglutin C (G), 11-O-Galloylbergenin (H), and Melezitose (I) was analyzed. Compared with the positive and negative controls, ** p<0.01 or *** p<0.001, and ns indicates no significant difference. (n = 3).
Searching for Active Ingredients in low-Content Constituents
To validate the mechanism of the 11# extract, virtual screening was conducted to assess the activity of 449 compounds identified via mass spectrometry. Among the compounds that adhered to Lipinski's rule of 5, phenylpropanoids constituted the largest group of compounds (Figure 7A and 7B). Notably, the prioritized compound, ellagic acid, was found to have the highest compound score and promote the highest level of activity (Figure 7C). To further corroborate these results, the activities of ellagic acid, luteolin, and apigenin were tested. All three compounds demonstrated inhibitory capacity, with IC50 values comparable to those of the active monomeric compounds present in the 11# extract (Figure 7J-7M). Subsequently, molecular docking experiments were performed to gain insights into how these prioritized compounds interact with ACE2 and S1. The findings indicated that these small molecules formed an obstructive layer within the protein-protein binding region, preventing S1 from binding to ACE2 (Figure 7D-7I), thus effectively inhibiting virus infection.
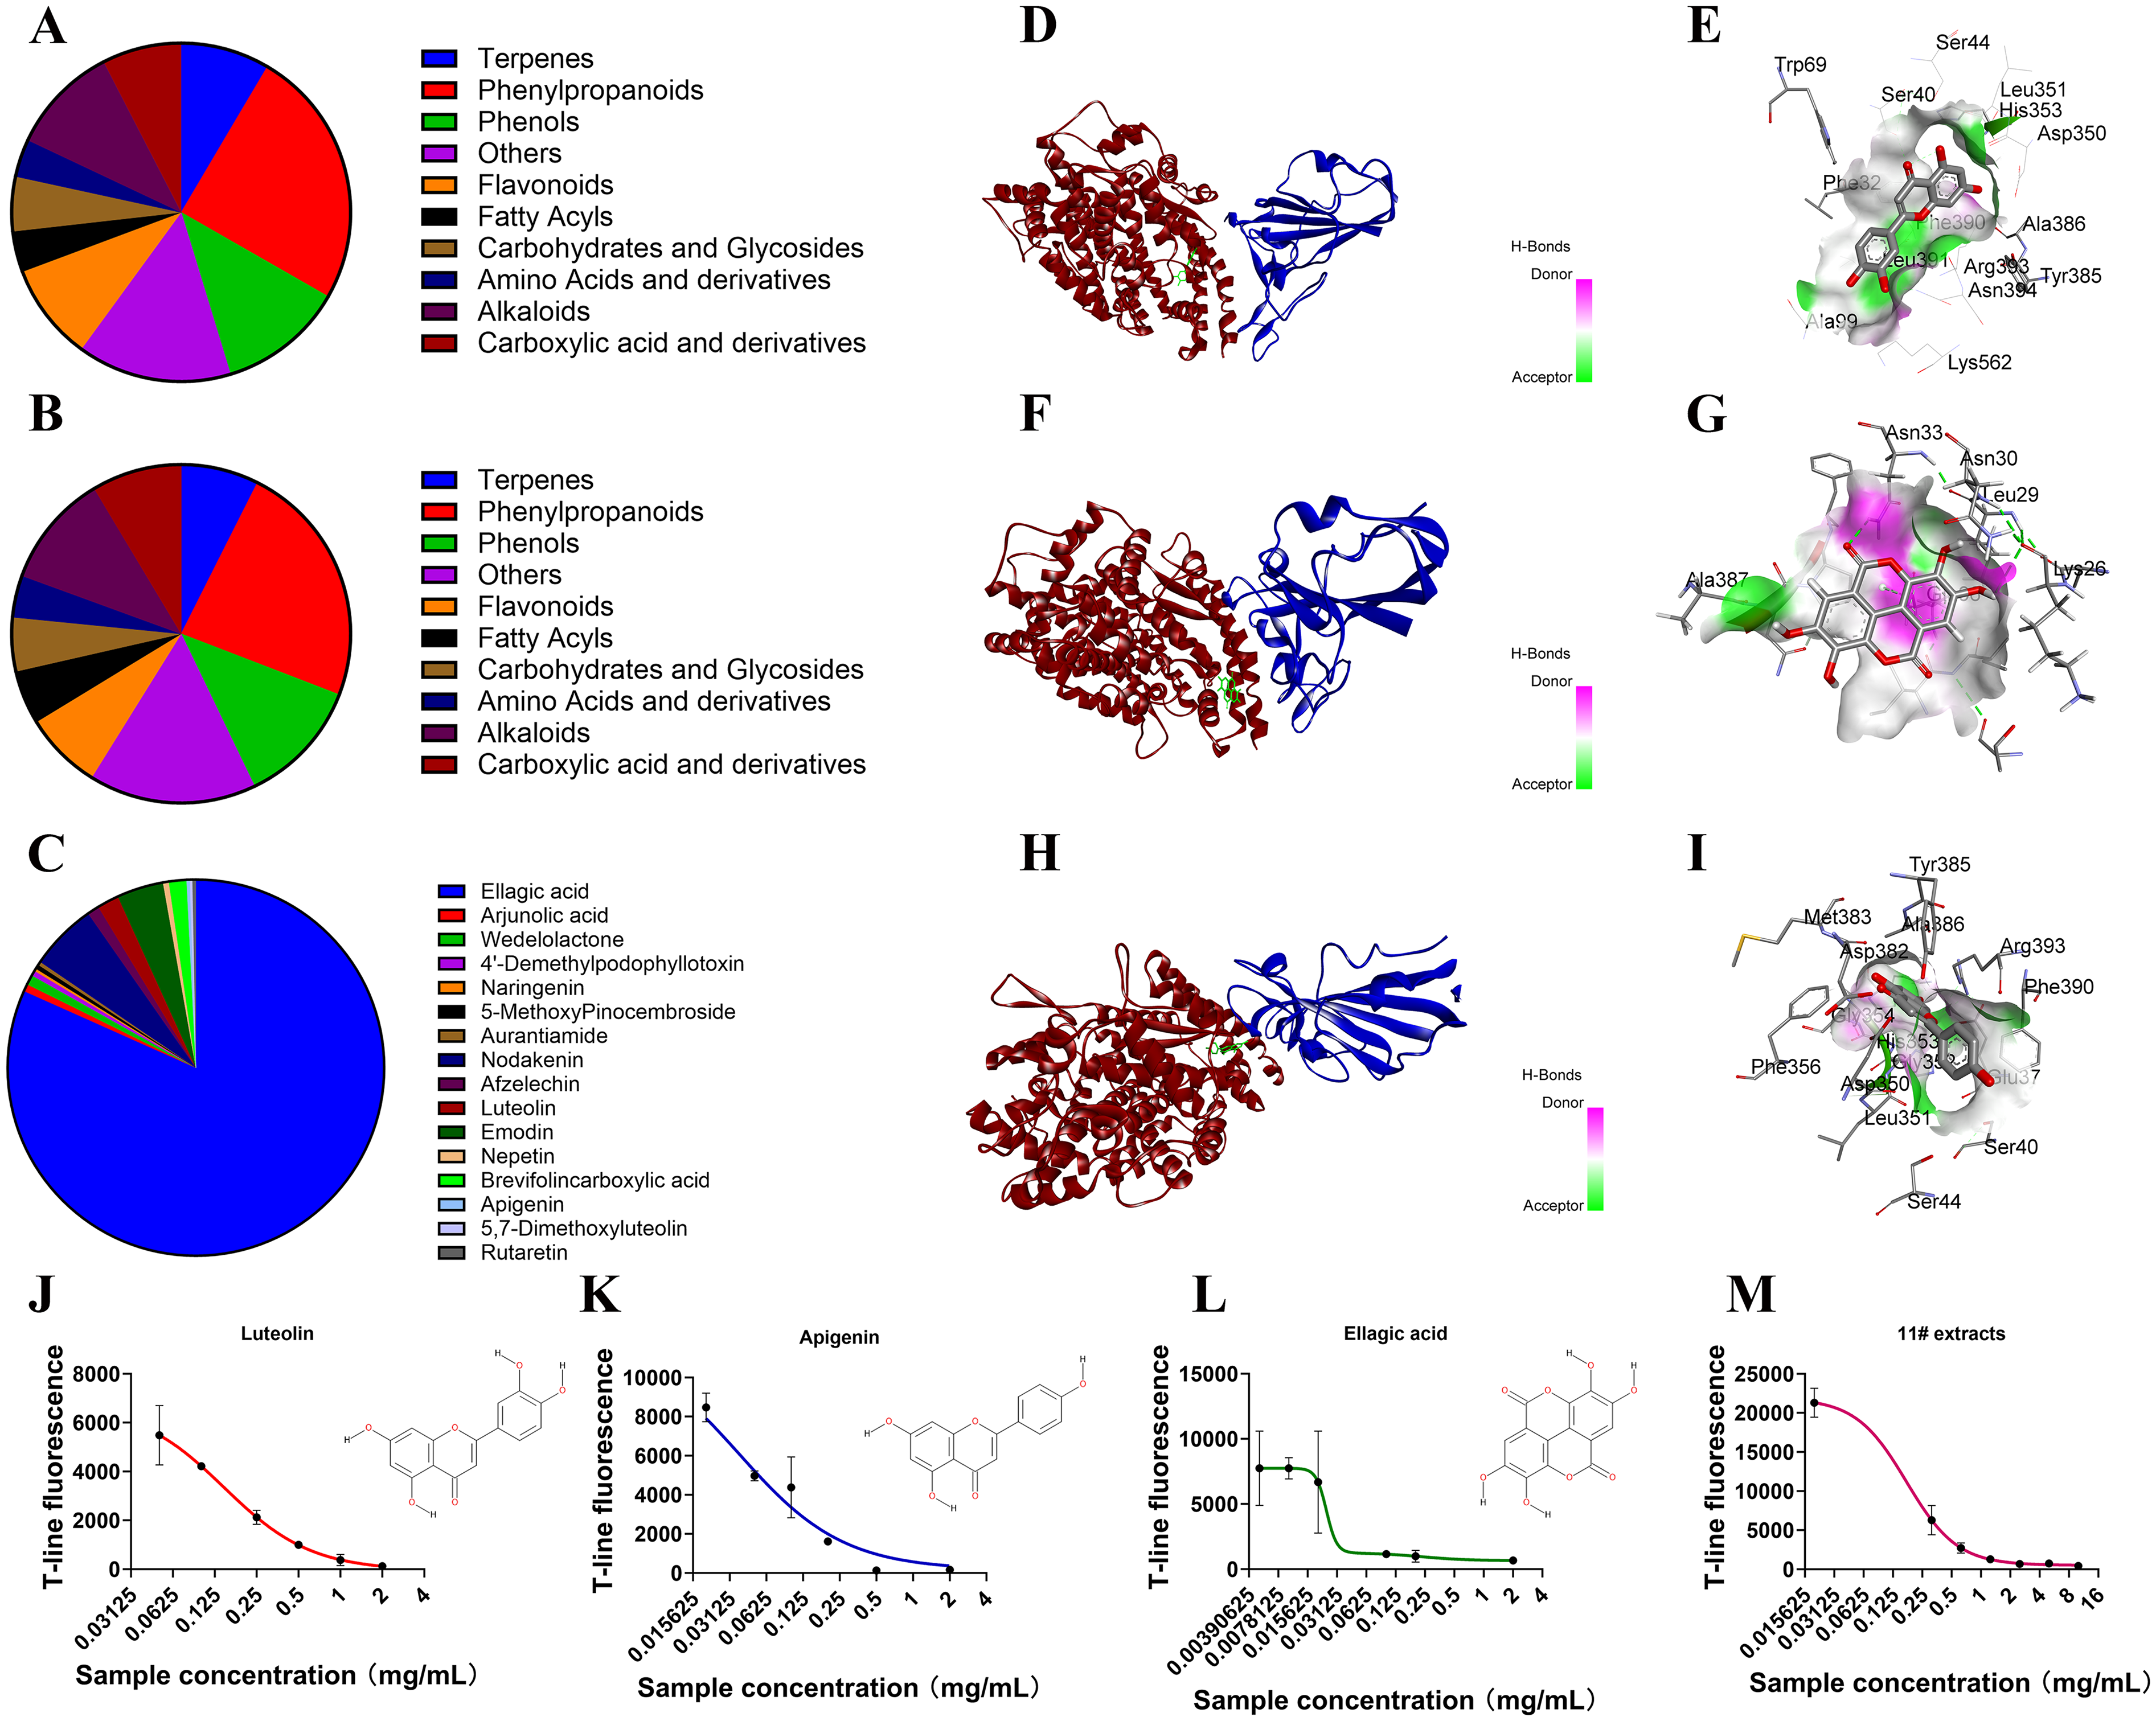
Searching for active compounds among low-content compounds. 342 low-content compounds were screened according to Lipinski's Rule of Five, resulting in 181 high-scoring compounds. These compounds were then categorized based on their relative content (A) and quantity (B), and their importance (C) was calculated based on their scores and relative content (compound importance score = compound score × relative content). Next, molecular docking was used to validate the highest importance score, ellagic acid (F and G), as well as two other high-scoring compounds, Apigenin (H and I)and Luteolin (D and E), to determine whether these compounds can bind to the ACE2 protein at the binding site of ACE2 and S1 protein. Finally, we obtained standard high-purity compounds of Ellagic acid (L), Apigenin (K), and Luteolin (J), and compared their IC50 with that of the 11# water extract (M) using immunochromatographic assay. (n = 3).
Discussion
Immunofluorescence chromatography is well-suited for initial large-scale sample screening because of its convenience and low cost (Figure 1A). In our study, recombinant antibodies targeting the spike receptor-binding domain (RBD) were utilized to demonstrate the correlation between the concentration of the active substance and the activity value (-log2(T/C)). A strong linear relationship was observed (Figure 1C), which enabled quantitative testing. The initial screening indicated that the 11# water extract exhibited the highest activity (Figure 1B and 1D). Intriguingly, Bergenia purpurascens has been traditionally employed in herbal medicine for treating respiratory-tract infections, 17 suggesting a potential link to the inhibition of COVID-19 infection.
After completing all standardization procedures and condition checks, the activity assay demonstrated that the 11# water extract effectively inhibited the COVID-19 infection of Vero-E6 cells (Figure 3C-3I), with an IC50 value of 36 μg/mL (Figure 3B). Over the past three years, extensive research and development (R & D) efforts have been dedicated to drugs targeting SARS-CoV-2. The Vero-E6 cell infection model is commonly employed to assess drug efficacy. In 2020, Gilead Sciences’ Remdesivir exhibited a remarkable IC50 value of 1.02 μg/mL in the Vero-E6 infection experiment. A variety of screened active small-molecule drugs have been shown to inhibit COVID-19 infection in the Vero-E6 model, with IC50 values ranging from 3–20 μM. Considering an average molecular weight of 350 Da, the IC50 values of these molecules can reach an impressive range of 1–7 μg/mL. 18 The 11# water extract achieved an IC50 value of 36 μg/mL, which is comparable to those of the previously published active small molecules. Future studies should incorporate comparative analyses with clinically established agents such as Remdesivir.
By comparing the binding dissociation constant (KD) values of the 11# water extract with S1 or ACE2, we determined that its binding to ACE2 was stronger. This finding suggests that the 11# water extract may non-specifically block the ACE2 receptor. Consequently, the 11# water extract is likely to retain inhibitory effects in other ACE2-related infections, such as SARS 19 or MERS, 20 and may hold therapeutic potential for future targeted treatments of ACE2-related viral infections. The non-specific binding of the 11# water extract to ACE2 and S1 may create an interfering barrier within the ACE2-S1 interaction region, thereby blocking their binding (Figure 4F and 4I). However, the 11# water extract must block ACE2 or S1 in advance, as it cannot disrupt the pre-formed ACE2-S1 complex (Figure 4G and 4K). To clarify, the term “non-specificity” in this context refers to the fact that the extract may not exclusively bind to the interface region between ACE2 and the S1 protein but could also bind to other sites on the protein. However, it does not imply the potential for binding to other target proteins.
We employed Ultra-Performance Liquid Chromatography-Tandem Mass Spectrometry (UPLC-MS/MS) to identify the chemical composition of the 11# extract. The eight compounds with the highest concentrations accounted for more than 73% of the total content (Figure 6A). Initially, we aimed to identify an active representative compound among these eight high-concentration substances. However, regrettably, none of them demonstrated any activity (Figure 6B-6I). To further verify our proposed mechanism, we utilized computational virtual screening to evaluate the activity of 342 low-concentration substances. The results indicated that ellagic acid was the most significant component in the 11# extract (Figure 7C). This presents an intriguing instance where the activity of the mixture can be ascribed to a low-concentration constituent.
Regarding the IC50 values of active compounds, ellagic acid exhibited an IC50 of 0.23 mg/mL (Figure 7L), luteolin had an IC50 of 0.15 mg/mL (Figure 7J), and apigenin had an IC50 of 0.04 mg/mL (Figure 7K). In previous literature, it was uncovered that ellagic acid could potently inhibit the binding of the SARS-CoV-2 receptor-binding domain (RBD) to human ACE2, with its half-maximal inhibitory concentration (IC50) ranging from 0.6 to 5.5 μg/mL. 21 Despite a notable discrepancy in IC50 values between our result (230 μg/mL) and previous studies, potentially due to differing screening models, both confirm ellagic acid as a highly active compound, while in vitro assays demonstrated luteolin's significant blockade of spike RBD-ACE2 binding with an IC50 of 0.61 mM (174.61 μg/mL). 22 While our findings align closely with existing research, no experimental data on apigenin's inhibition of spike-ACE2 binding exist, though network pharmacology suggests its potential therapeutic role against COVID-19. 23 The 11# extract demonstrated comparable activity to individual compounds with an IC50 of 0.17 mg/mL (Figure 7M), indicating its efficacy arises from synergistic interactions among multiple low-concentration active components. Molecular docking revealed ellagic acid, luteolin, and apigenin interact with ACE2/S1 via hydrogen bonds—ellagic acid with Lys26/Asn33, luteolin with Ser40 in a Ser40/Ser44/Asp350/Leu391 pocket, and apigenin with Arg393/His505 in a Lys403/Phe390/Ser40/Ser44 pocket. These interactions stabilize binding regions critical for ACE2-S1 engagement, with each compound occupying distinct structural niches.
While the Ellagic acid's ACE2 inhibition raises potential concerns due to ACE2's role in cardiovascular regulation, a study demonstrates that Ellagic acid (100 mg/kg) pretreatment counteracts ischemia-reperfusion effects in rats by elevating blood pressure, reducing heart rate, and improving cardiac electrophysiological markers such as QRS voltage and PR interval duration. These findings suggest Ellagic acid may mitigate cardiovascular abnormalities despite its ACE2-inhibiting properties. 24
Ellagic acid exhibits limited intestinal absorption due to its large molecular structure and low lipid solubility. Within the gut, it is metabolized by microbiota into urolithins through a series of biochemical transformations. 25 Urolithin A (UA) demonstrated no genotoxicity or systemic accumulation in vitro and in vivo, supported by ADME and genotoxicity assays. Repeated 28- and 90-day oral administration in rats revealed no adverse clinical, hematological, histopathological, or biochemical effects, with a NOAEL of 5% dietary UA, confirming its safety as an EA metabolite. 26
B. purpurascens extract shows ACE2-S1 inhibition in vitro, suggesting potential as a candidate for antiviral drug development, pending in vivo validation and preclinical studies. Despite its achievements, this study's limitations include its primarily in vitro focus, lack of in vivo validation, sole reliance on Vero-E6 cells (unable to mimic human physiology/immunity fully), and early-stage scope, necessitating deeper research to translate findings into practical anti-COVID-19 applications.
Supplemental Material
sj-docx-1-npx-10.1177_1934578X251327922 - Supplemental material for Investigation on the Inhibitory Effect of Bergenia purpurascens Water Extract on COVID-19 XBB1.5 Variant and Its Blocking ACE2 Mechanism
Supplemental material, sj-docx-1-npx-10.1177_1934578X251327922 for Investigation on the Inhibitory Effect of Bergenia purpurascens Water Extract on COVID-19 XBB1.5 Variant and Its Blocking ACE2 Mechanism by Yongxia Shi, Xiaoning Sun, Zhaoxia Yu, Dalan Dai, Hongyu Guo, Lijuan Mei, Jun Dai and Lei Jiang in Natural Product Communications
Supplemental Material
sj-xlsx-2-npx-10.1177_1934578X251327922 - Supplemental material for Investigation on the Inhibitory Effect of Bergenia purpurascens Water Extract on COVID-19 XBB1.5 Variant and Its Blocking ACE2 Mechanism
Supplemental material, sj-xlsx-2-npx-10.1177_1934578X251327922 for Investigation on the Inhibitory Effect of Bergenia purpurascens Water Extract on COVID-19 XBB1.5 Variant and Its Blocking ACE2 Mechanism by Yongxia Shi, Xiaoning Sun, Zhaoxia Yu, Dalan Dai, Hongyu Guo, Lijuan Mei, Jun Dai and Lei Jiang in Natural Product Communications
Footnotes
Acknowledgements
The authors would like to extend their sincere gratitude and acknowledge the unyielding support of Yumei Zhang throughout this research.
Authors’ Contributions
Jiang conceived and designed the study and served as the project leader. Shi led the team (Jun Dai) in performing the experiments to evaluate the antiviral activity of the active water extract. Yu led the team (Dalan Dai, Hongyu Guo) in developing and producing a substantial number of fluorescent immunochromatographic reagents for this study. Mei is responsible for botanically classifying the raw materials. In this study, Shi and Sun served as the primary contributors and shared first authorship.
Declaration of Conflicting Interests
The authors declared no potential conflicts of interest with respect to the research, authorship, and/or publication of this article.
Funding
The authors disclosed receipt of the following financial support for the research, authorship, and/or publication of this article: This work was supported by the Natural Science Foundation of Qinghai Province, (grant number 2021-ZJ-924).
Ethical Approval
Ethical Approval is not applicable for this article.
Statement of Informed Consent
There are no human subjects in this article and informed consent is not applicable.
Supplemental Material
Supplemental material for this article is available online.
References
Supplementary Material
Please find the following supplemental material available below.
For Open Access articles published under a Creative Commons License, all supplemental material carries the same license as the article it is associated with.
For non-Open Access articles published, all supplemental material carries a non-exclusive license, and permission requests for re-use of supplemental material or any part of supplemental material shall be sent directly to the copyright owner as specified in the copyright notice associated with the article.