
Abstract
Introduction
Liver disorder accounts for approximately two million deaths annually and is responsible for about 4% of all deaths globally. 1 According to Devarbhavi and colleages. (2023), two-thirds of all liver-related deaths occur in men. These deaths are often associated with cirrhosis and hepatocellular carcinoma. Saharan Africa ranks at the top of the list when considering areas prone to death as a result of liver diseases. 2 Drugs, lifestyle adjustments, or nutritional recommendations are some measures that can help reduce the rate of liver disease. 3 Chronic viral hepatitis, heavy alcohol use, aflatoxin B1 exposure, and, increasingly, metabolic risk factors associated with steatotic liver disease (MASLD) are some causes of liver diseases. Food and nutritional supplements are essential in treating liver diseases.4,5 It is therefore essential that whatever natural food is used in a certain locality be assessed for its effect on the liver.
The use of herbs and dietary products lacks sufficient scientific backing pertaining to their ability to ameliorate liver disease and restore healthy functions of the said organ. As a matter of fact, it is believed that certain herbs and dietary supplements might cause liver injury via the modulation of the cytochrome P450 enzyme. 6 This has necessitated this study on Tom Brown weaning meal, as little or nothing is known of its effect on the liver yet it is consumed by children and adults for weaning and nutritious purposes, respectively. Uno and colleages. showed that Tom Brown improves the cytoarchitecture of the testis and enhances fertility rates in male rats. 7 However, little is known of Tom Brown's effect on the liver. Aspartate aminotransferase (AST), Alanine transaminase (ALT), and alkaline phosphatase (ALP) from either the serum or bile are used as biomarkers for assessing liver function. The release of more AST and ALT beyond normal values in the serum usually signifies liver injury and calls for concern. 8 This research therefore seeks to ascertain that no detrimental effect is felt on the liver following the consumption of Tom Brown by assessing the biomarkers of liver injury earlier stated. Other objectives of the study were geared towards docking the ligands of Tom Brown that have passed the Lipinski rule of five (ROF) with AST and ALT to ascertain which phytochemical ligand in Tom Brown is responsible for its effect on the liver.
The GC-MS study has proven to be a reliable tool for assessing various phytochemical compounds embodied in extracts. This tool reveals the various phytochemical ligands or compounds. 9 Though authors have postulated important nutritional compounds in Tom Brown, such as calcium, nitrogen, iron, sodium, protein, salt, fiber, carbohydrate, and fats, little is known of its phytochemical constituents.10,11 The essence of the GCMS study is to help identify the phytochemical compound in plants or local meals that is associated with the functions linked to the plant or extract. This result can be obtained following a combination of GCMS methods and docking procedures, or bioinformatics. These methods are applicable in many other research studies.12,13 Therefore, it will be expedient that the pharmacological compounds of Tom Brown be examined through the GC-MS method, as similar plants may have different photochemistry depending on their geographical location of cultivation. Furthermore, these phytochemical compounds were used to dock with proteins associated with liver and learning/memory functions to ascertain which enhanced their role in such functions. The pharmacokinetics of each compound in Tom Brown will be assessed via absorption, distribution, metabolism, excretion, and toxicity (ADMET) in this research.
The benefits of tom brown in weaning children and enhancing fertility for adult has been reported by certain authors.7–9 The use of Tom Brown for weaning babies calls for the need to assess its effect on the memory and learning abilities of these children, especially the malnourished ones. This assessment is important in order to make sure that the detrimental effect is not meted out on the learning or memory function of a child at the expense of weaning such a child with Tom Brown meal. The rate of learning difficulties and working memory deficits among children has become alarming. 14 In Africa, there is a rise in cognitive impairment. This impairment cuts across memory, thinking, orientation, comprehension, calculation, learning capacity, language, and judgment capacities among the individuals. 15 It has long been suspected that the relative abundance of certain nutrients or food substances can alter cognitive processes and emotions. Research has established the relationship between gastrointestinal function and the nervous system. A more revealing mechanism concerning this relationship is seen in synaptic plasticity. As a matter of fact, gut hormones can influence cognitive abilities. 16 In most cases, the metabolism of gut hormones is a function of dietary intake. Therefore, it is essential to assess if Tom Brown will enhance the learning and memory capacity of children by assessing its In vivo role on learning and /memory parameters and further docking its ligand with Netrin, a protein often associated with learning and memory function. Netrin is seen to play important roles in cell migration, regulating cell adhesion, and mation of cell morphology, cell survival, and tumorigenesis. Recent research shows that Netrin strengthens neural synapses in the adult brain's hippocampus, an area known for regulating memory and learning function. This makes Netrin the protein of choice for the docking procedures.
Materials and Methods
Materials
The materials used for this research work include; GCMS instrument, Computer system with internet connection, methanol, Orbital shaker, Rotator evaporator, Centrifuge, Metabolic cages, Saw dust, Weighing balance, Dissecting set, Sample bottles, Hand gloves, Cotton wool, Disinfectant, Tissue paper, Hand towel, feeding plates, drinking bowls, Distilled water, Normal saline, Dissecting board, Wistar Rats and isoflurane (Escain ®).
Preparation, Storage and Administration of Tom Brown Feed
Preparation, storage and Administration of Tom brown feed was done in similar method to that of Uno and colleages. 7 However, there were certain adjustment in the composition ratio of the constituents used for Tom brown diet preparation. The food substances used in the preparation of Tom brown were purchased from Watt market in Calabar, Cross River State, Nigeria. The food substances and their respective composition ratio are given in Table 1.
Food Substances Composition and Percentage Ratio of Tom Brown Weaning Meal.

The grains were carefully selected in order to separate dirt. Thereafter, they were washed and air dried. Yellow corn, guinea corn, soya bean, millet, groundnut and crayfish were roasted at temperature of 70 °C for a period of ten (10) minutes. Fresh cow meat was dried at same temperature for a period of 1 h, 30 min. Thereafter, they were grounded into particulate form using the Chester Edu Smart 820 CNC milling machine and used as feed for the experimental animals. The weight of the different food substances were weighed before and after roasting. Then, the animals were divided into three groups namely; Control, Combined (50% Tom brown and 50% rat-chow) and Tom brown group. Control group received Normal rat-chow, combined group received Tom brown and rat-chow in cycles such that animals in this group received Tom brown on the first day and followed with rat chow on the second continually in this pattern through out the experimental period. However, Tom brown group received 100% of Tom brown feed. The feeding period lasted one month (Four weeks).
Extraction of Phytochemicals, Quantification by GC-MS and Identification of Chemical Constituents
After weighing one gram of the oil, it was put in a test tube with 25 milliliters of ethanol. For ninety minutes, the test tube was left to react at 60 °C on a hotplate. Following the reaction time, the test tube's reaction product was moved to a separatory funnel. 20 milliliters of ethanol, 10 milliliters of cold water, 10 milliliters of hot water, and 3 milliliters of hexane were successfully added to the funnel after the tube had been cleaned. After mixing the extracts, 10 milliliters of a 10% v/v ethanol aqueous solution were used for three rounds of washing. Anhydrous sodium sulfate was used to dry the solution, and the solvent was then removed. After the sample was dissolved in 1000 ul of pyridine, 200 ul was moved to a vial for examination.
BUCK M910 gas chromatography equipped with an HP-5MS column (30 m in length, 250 μm in diameter, and 0.25 μm in thickness of film) was used for analyzing phytochemicals. Spectroscopic detection by GC-MS involved an electron ionization system that utilized high-energy electrons (70 eV). Pure helium gas (99.995%) was used as the carrier gas with a flow rate of 1 mL/min. The initial temperature was set at 50 °C with an increasing rate of 3 °C/min and a holding time of about 10 min. Finally, the temperature was increased to 300 °C at 10 °C/min. One microliter of the prepared 1% of the extracts diluted with acetonitrile was injected in a splitless mode. The relative quantity of the chemical compounds present in each of the extracts was expressed as a percentage based on the peak area produced in the chromatogram. 17
Bioactive compounds extracted from different extracts were identified based on GC retention time on the HP-5MS column and matching of the spectra with computer software data of standards (Replib and Mainlab data of GC-MS systems). 18
Retention indices were also calculated for each of the ligands using the method explained by Von Mühlen and others. 19
Prediction of ADMET Properties of the Ligands in Tom Brown
Bioactive compounds from the various ligands were screened for their Absorption, Distribution, Metabolism, Excretion and Toxicity (ADMET) properties using the pkCSM prediction tool. The pkCSM tool is a well-established tool for the prediction of ADMET properties of lead drug compounds. 20 First, the ligands were converted into their respective SMILE strings using PubChem. The strings were then be used to individually predict the ADMET properties of the various ligands together with their molecular descriptors, their pharmacokinetic will be predicted in addition to their molecular descriptors.
Lipinski Rule of Five Screening
The ligands (bioactive) compounds which were obtained from the GC-MS analysis were further screened for Lipinski rule of five (ROF) using the SWISSADME tool. The SWISSADME is a free-web tool used in the prediction of lead compounds or small molecules pharmacokinetics, drug-likeness and medicinal chemistry friendliness. 21 Following ADME screening, ligands that meet ROF were further prepared for molecular docking.
Ligand Preparation for Docking
The screened ligands with zero violation of the Lipinski rule of five were prepared for molecular docking using various tools. First, the structures of the ligands were retrieved from their unique SMILES using Chem3d 15.1 tool. Following retrieval of their structures, the energies of the ligands were then minimized and saved in protein data bank (PDB) files. The ligands were further prepared using Autodock vina 4.2 and saved in protein data bank, partial charge (Q) and atom type (T) {PDBQT} files individually as done by Trott & Olson. 22
Preparation of Protein (Pepsin) for Docking
AST, ALP and Netrin protein were retrieved from the Research for Collaboratory for structural Bioinformatics (RCSC) protein database online.
Other details of the proteins as obtained from MCULE and RCSC were 1AJ2, DHPS_ECOLI, P0AC13 and 83333 for the PDB ID, Uniprot name, Uniprot Accession ID and Uniprot taxoNomic ID. As a protein complexed with native ligands (n = 2), the binding sites of protein were retrieved using these native ligands as guide. Defining of the binding site was done using Biovia Discovery Studio Client 21. The binding site was defined to be x = 41.244328, y = 4.789960, z = 8.01488 and radius of 15.434639. The protein was further prepared by removing water molecules and the resulting structure was saved in PDB format. The protein in PDB was converted into PDBQT file using the AutoDock vina 4.2 for docking according to Trott and Olson. 22
Docking Studies
Molecular docking was performed using the AutoDock vina 4.2 as used by Trott & Olson. 22 First, the various AutoDock files were retrieved and configured accordingly to align with the various ligands that were prepared and proteins. Using the docking command line, docking was performed and the resulting docking modes split for each ligand. The interactions in the various binding modes were then visualized in 2D in Biovia Discovery studio Client 21 to display the amiNo acids, types of bonding and bond lengths. The docking score was also generated for the eleven ligands with zero violation of the Lipinski rule of five.
Choice of Experimental Animals and Administration of Tom Brown Feed for in Vivo Procedures on Liver Enzymes and Memory/Learning Assessment
15 albino wistar rats were used for this research. This is because they are tough, and easy to maintain. The rats were obtained from the Department of Human Physiology, Arthur Jarvis University, Nigeria. The rats were weighed at the start of the experiment, and was randomly distributed into their metabolic cages. Animals weighed between 120 g to 200 g at the start of the experiment and were maintained in the animal house of the Department of Physiology, Arthur Jarvis University at light and dark cycles daily. The animals were separated into 3 groups (Control, Tom brown, and Combined). Each group had 5 animals each. Control group received only rat chow. Tom brown experimental groups were fed with Tom brown feed instead of normal rat chow. This is because Tom brown is consumed as daily meal in many houses either for the purpose of weaning children or for its delicious taste. Combined experimental groups were given Tom brown feed and normal rat chow a day. The Tom brown experimental group animals were first given Tom brown feed for twelve hours in the early hours of the day. Thereafter, they were given normal rat chow for the remaining twelve hours of the day. This pattern was maintained for week 1 and 3. A second pattern of feeding the Combined experimental animals was giving them normal rat chow for twelve hours in the early hours of the day, followed with Tom brown chow for the remaining 12 h of the day. This pattern was maintained for week 2 and 4. The combined animals were so given the rat chow and Tom brown because people eating Tom brown don’t rely on only Tom brown. They spice up their feeding pattern with other meal per day. However, for weaning purpose, many mothers can place their children on only Tom brown for months. Hence, the need for the Tom brown group. All animals were given free access to water and their respective chow types throughout the period of experiment. The animals were maintained in the animal house of the Department of Human Physiology, Arthur Jarvis University, at a temperature of 28 °C for 12 h light and dark cycles. The cages were always kept clean. Food and water intake as well body weight changes were daily determined with the aid of an electronic weighing balance.
Determination of Body Weight Changes, Food and Water Intake of Experimental Animals
The body weight of the animals was determined using an electronic weighing balance. The initial weight of each animal was recorded after random grouping, prior to commencement of administration. Thereafter, the rats were weighed daily until the end of the study.
The food intake was obtained by measuring the quantity of food remaining on the feeding plates in the container after 24 h and subtracting it from the initial quantity of food at the start of each day's feeding. This was possible as animals were camped in metabolic cages. The difference in quantity was recorded as the food intake. The recording was done at the same time daily to ensure consistency and accuracy of results.
Water intake was obtained using a calibrated feeding bottle. The difference in quantity at the end of the day will be subtracted from the initial volume of water at the start of the day. The result was used as the daily water intake of the animals in the various experimental groups.
Collection of serum for Liver Enzymes Analysis in the Laboratory
Blood was collected from the animals via cardiac puncture. Animals were anaesthetize using Isoflurane (Escain ®). Thereafter, the animals were gently placed on a dissecting board, cut through the linea alba and further dissected to expose the heart. With the help of a syringe, blood was gotten from the ventricle chambers. The blood was transferred to a sample bottle and further spinned with the centrifuge to get the serum. The serum was used for the determination of ALT, AST, ALP and various bilirubin concentration.
Measurement of Serum Alkaline Phosphatase (ALP)
ALP was measured by the optimized standard method recommended by Deutsche Geseiischage for Klinische Chemic GSCC and used by Umoh and colleages. 23
Measurement of Serum Alanine Transaminase (ALT), Aspartate Aminotransferase (AST) and Bilirubin
ALT, AST was determined using the method of Reitman and Frankel while Total, Conjugated and Unconjugated bilirubin concentration was measured via Colorimetric method as described by Sherlock and further used by Umoh and colleages.23–25
The Novel Object Recognition Task (NORT)
NORT was carried out in a black open-field box (45 cm×45 cm×50 cm). There is an initial habituation to the apparatus prior to the NORT, and then two trials in the novel object task, an acquisition trial (trial 1) and a retention trial (trial 2) is carried out on the rats. These two trials are separated by a retention period (also called a delay or inter-trial interval) ranging from 15-min (short-term) to 24-h (long-term). The rats were placed in an arena and allowed to investigate two identical objects for the duration of trial 1, usually five minutes. After the retention period, trial 2 is completed where the rats are presented with a familiar object (one of the objects from trial 1) and a novel object (not present in trial 1). If the rats remembers the familiar object from trial 1, it should spend more time investigating the novel object during trial 2. The most common measure for memory in the novel object task is the discrimination index. Lighting conditions via a 60-Watt white light bulb was employed.
The behaviors score was done using the Open field through the following procedures:
In this study, NORT was carried out on rats during the light phase of their light-dark cycle between 9:00AM and 5:00PM, when the rats are less active. This time was maintained in order to reduce the variability in result due to the circadian influence on behavior. The phases observed in the experiment include:
Pre-training phase: The rats were exposed to a familiarization phase where they are placed in the testing arena without any objects. This was one to help them familiarized with the environment and reduce anxiety-related behaviors. Control Group Comparison: A control group of rats which do not received any treatment or intervention was used as the bases for comparison with the Tom brown and Combined experimental group animals. The performance of the experimental groups compared to the control gave the deviations from the baseline learning and memory levels
Statistical Analysis
Results from in Vivo aspect of this research were presented as mean ± standard error of mean (SEM). Statistical package for social sciences (SPSS) was used to analyze the data and charts were produced using Microsoft excel, 2020 version. The analysis of variance (ANOVA) test was the method of analysis used for the work. Values were considered significant at P < 0.05. Results from docking procedures and GC-MS analysis were presented in figures and tabular forms where necessary.
Ethics Approval and Consent to Participate
All experiment were performed in accordance with the guideline for care and use of laboratory animal of the Faculty of Basic Medical Science Animal Research Ethics Committee, Arthur Jarvis University. Ethical approval was granted by the committee with approval number FAREC-FBMS-00255
Results
Analysis of Phytochemical Ligands in Tom Brown Extract
The phytochemical ligands found in Tom brown extract from GC-MS instrument were thirty (30) in numbers. This was similar to those also found in a research by Uno and colleages. 7 The Compounds are shown below (Table 2). Figure 1 shows the GC-MS chromatogram (abundance vs retention time) of the bioactive compounds from Tom brown extract. The bioactive compounds are represented by the various peaks. The peaks were 30, representing a total of 30 bioactive compounds. The retention times of the various bioactive compounds as well as their concentrations are also shown in Table 2. The table shows the retention time (min) of the 30 bioactive compounds, their molecular weights, peak areas (%) and development (min). The retention time ranged from 8.358 to 26.761 for compounds 4-methyl itaconate and Octadecanoic acid. On the other hand, the molecular weights of the various compounds ranged from 112 to 660.04 g/mole for Butanedioyl dihydrazide and phytic acid, respectively. Peak area shows that lupeol was the most abundant with a peak area of 25.69 while Beta-caryophyllene had the least peak area with a value of 0.03. Retention indices was calculated

GC-MS chromatogram of the bioactive compounds from Tom brown extract (Abundance is plotted on the vertical axis against Retention time on the horizontal axis).
Phytochemical Compounds in Tom Brown Weaning Meal.
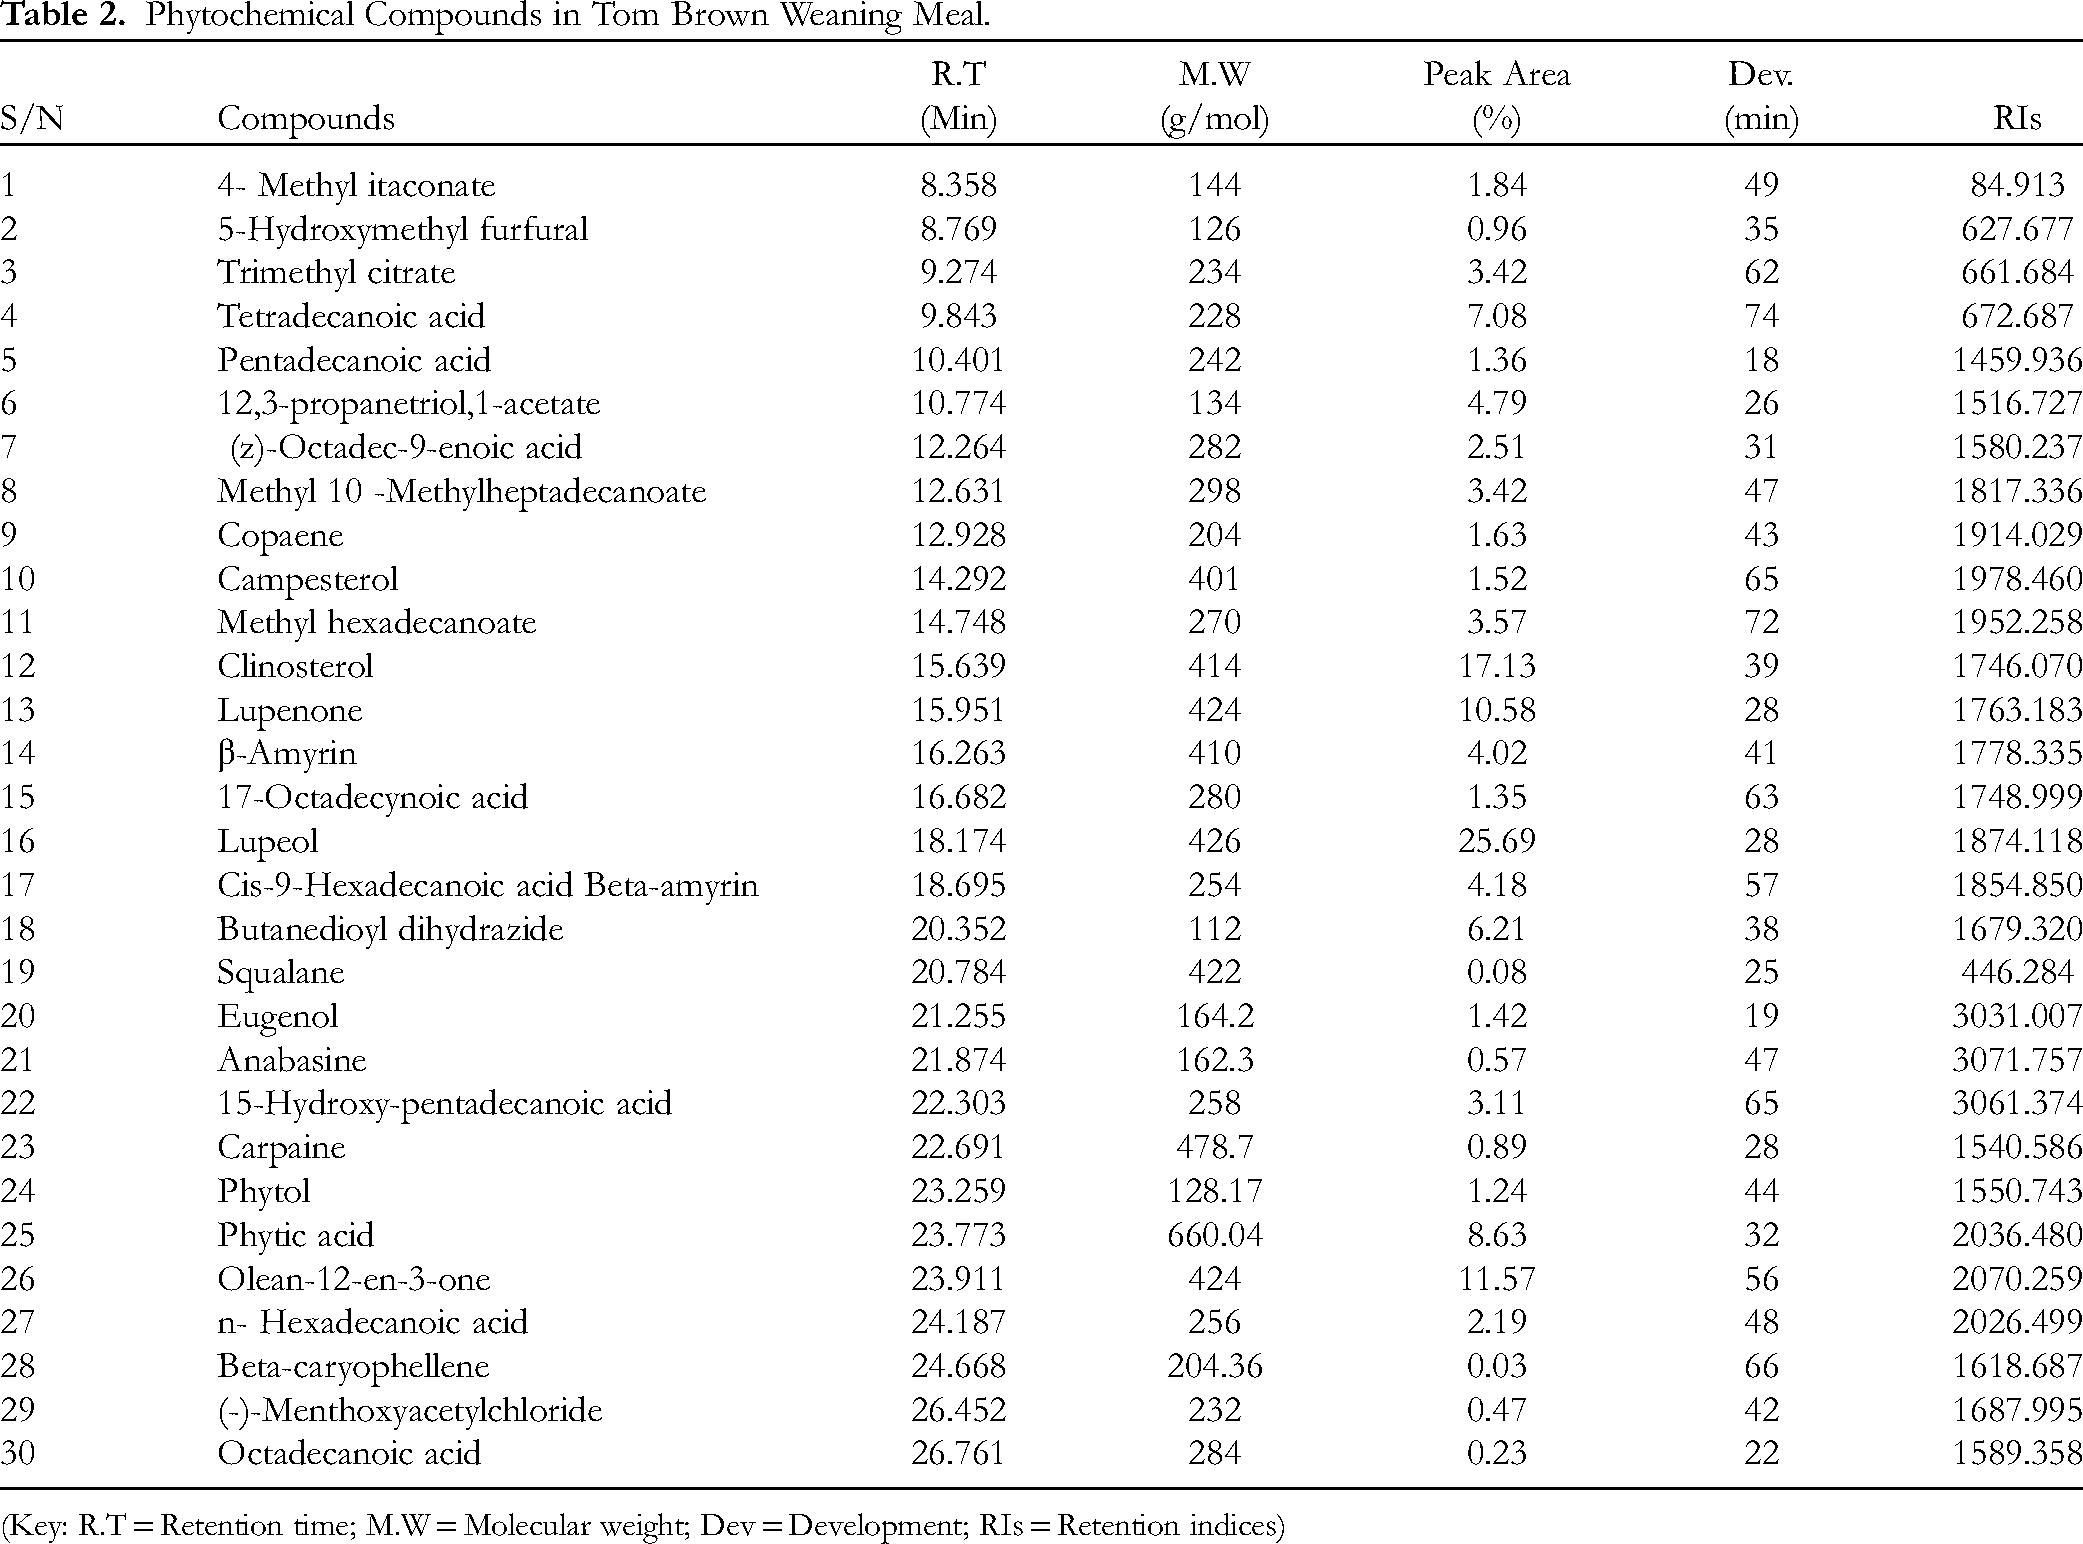
(Key: R.T = Retention time; M.W = Molecular weight; Dev = Development; RIs = Retention indices)
Chemical Structure and ADMET Properties of Ligands
The ligands’ chemical structure of Tom brown feed extract are shown below (Figure 2 and Figure 3) as extracted from SwissADME while the ADMET properties of the ligands are given in Table 3 and 4 as sourced from SwissADME.
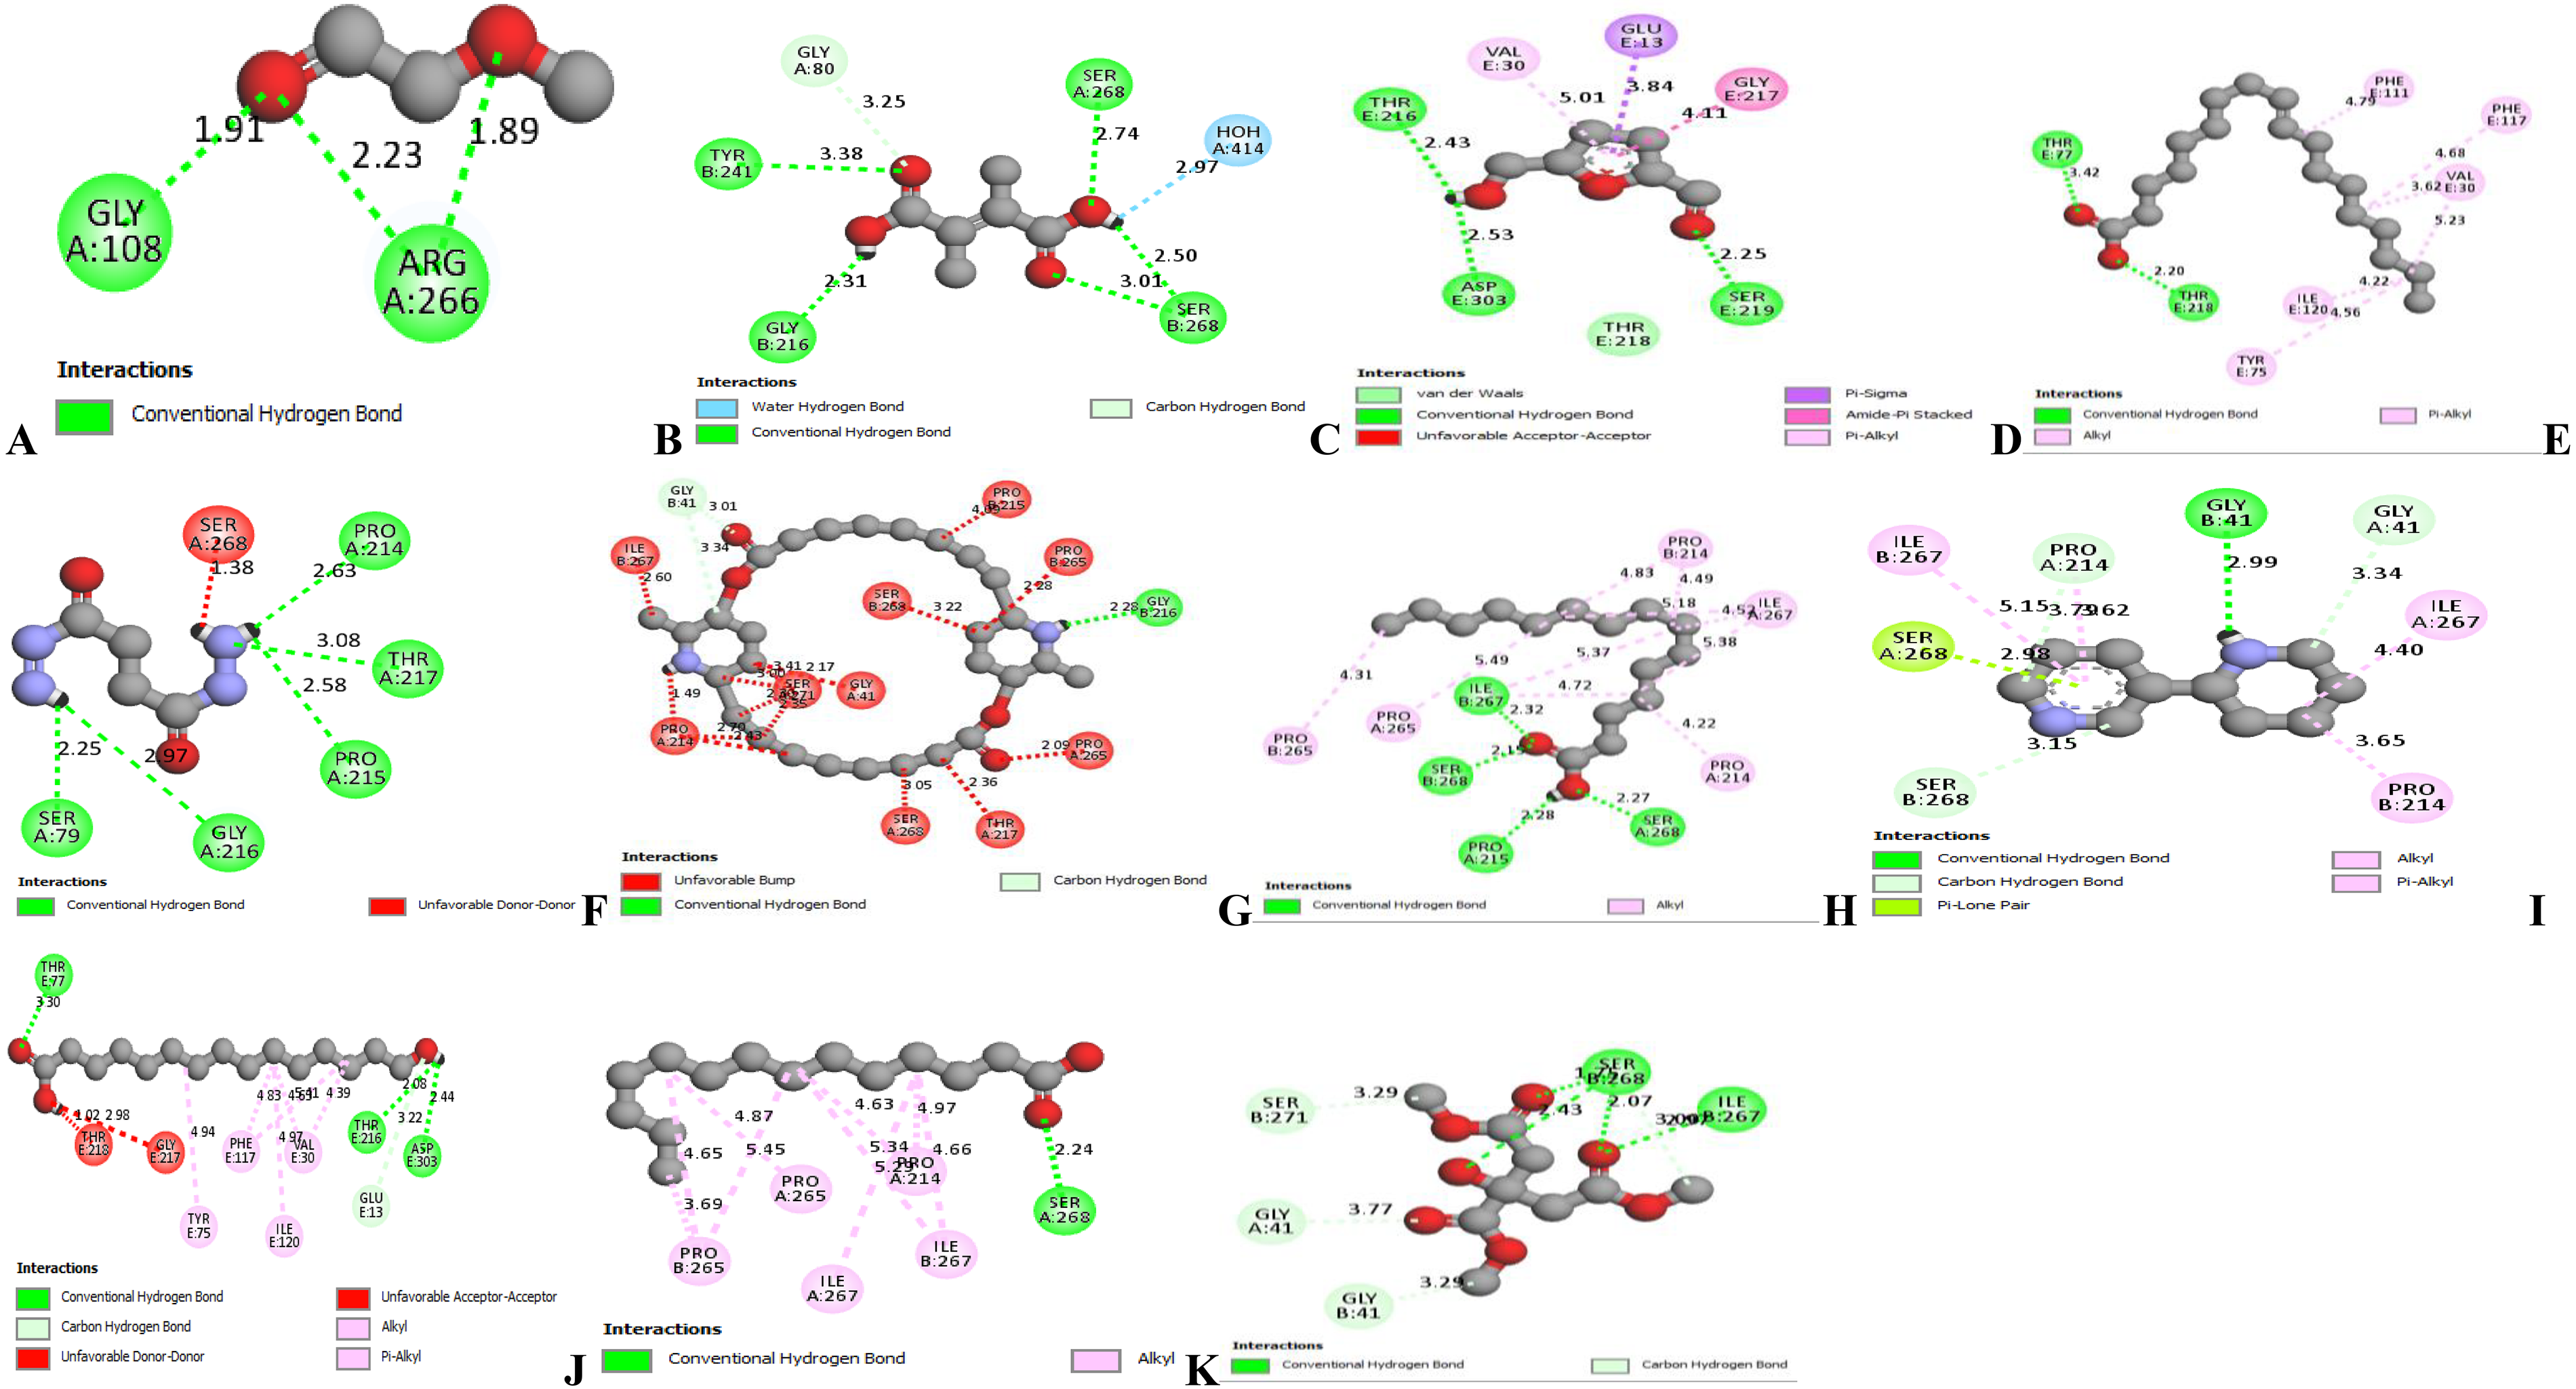
Docking outputs for the various ligands (A-K) with Alanine Transaminase(ALT) visualized in 2-D using Biovia Discovery studio 21. A= (-)-Menthoxyacetyl chloride, B= 4-Methyl itaconate, C= 5-hydroxymethyl furfural, D= (Z)-octade-9-enoic acid, E= Butanedioyl dihydrazide, F= Carpaine, G= 15-Hydroxypentadecanoic acid, H= Anabasine, I= Pentadecanoic acid, J= Tetra-decanoic acid, K= Tri-methyl Citrate.

Docking outputs for the various ligands (A-K) with Aspartate transaminase visualized in 2-D using Biovia Discovery studio 21 A= (-)-Menthoxyacetyl chloride, B= 4-Methyl itaconate, C= 5-hydroxymethyl furfural, D= (Z)-octade-9-enoic acid, E= Butanedioyl dihydrazide, F= Carpaine, G= 15-Hydroxypentadecanoic acid, H= Anabasine, I= Pentadecanoic acid, J= Tetra-decanoic acid, K= Tri-methyl Citrate.
ADMET Properties of Ligand i-xv in Tom Brown Feed Extract.

KEY: I = Octadecanoic acid; II = (-)-menthoxyacetylchloride; III = Beta-caryophellene; IV = n- hexadecanoic acid; V = Olean-12-en-3-one; VI = Phytic acid; VII = Phytol VIII = carpaine; IX = 15-hydroxy-pentadecanoic acid; X = Anabasine; XI = Eugenol; XII = squalane; XIII = Butanedioyl dihydrazide(succino dihydrazide); XIV = Cis-9-hexadecanoic acid; XV = Lupeol.
ADMET Properties of Ligand xvi-xxx in Tom Brown Feed Extract.

KEY: XVI = 17-octadecynoic acid; XVII = Beta-amyrin ; XVIII = Lupenon(e); XIX = Gamma-sitosterol; XX = Methyl hexadecanoate; XXI = campesterol; XXII = copaene; XXIII = Methyl 10 –methylheptadecanoate; XXIV = (z)-octadec-9-enoic acid; XXV = 12,3-propanetriol,1-acetate; XXVI = Pentadecanoic acid; XXVII = Tetradecanoic acid; XXVIII = Trimethyl citrate; XXIX = 5-hydroxymethyl furfural; XXX = 4- methyl itaconate.
The predicted ADMET properties which explains the pharmacological activity of compounds were for ligands that met Lipinski rule of five (ROF) of which all of the ligands found in Tom brown had met the rule. Absorption was evaluated using water solubility, CaCO3 permeability, intestinal absorption, skin permeability, P-glycoprotein substrate, P-glycoprotein I and II inhibitors. Water solubility values of the study bioactive compounds ranged from −7.701 to 0.01. CaCO3 permeability ranges from Intestinal absorption for the various ligands ranged from 50.932 to 100.00. Skin permeability for the ligands ranged from −4.326 and −1.58. A total of 29 ligands were not substrates of P-glycoprotein except ligand VIII. All the ligands except V, XV, XVII, XVIII, XIX, & XXI were inhibitors to P-glycoprotein I and II inhibitors while VII & XII were inhibitors to P-glycoprotein II inhibitors. Distribution was evaluated using VDss (human), fraction unbound (human), BBB and CNS permeabilities. From the predicted result presented in Table 4, the VDss values ranged from −0.881 to 0.812 for the ligands. Fraction unbound values ranged from 0 to 0.775 for the ligands. For BBB and CNS permeabilities, the values for the ligands ranged from −8.285 to 01.143 and −9.599 to −0.65, respectively. The predicted parameters for metabolism were CYP2D6 and CYP3A4 substrates and CYP1A2, CYP2C19, CYP2C9, CYP2D6 and CYP3A4 inhibitors. From the predicted result presented in Table 4 and 5, None of the ligands were substrates to CYP2D6 while to CYP3A4, 18 ligands were substrates while 12 ligands were Not. All the ligands were Not inhibitors to CYP2C19, CYP2C9, CYP2D6 and CYP3A4; however, 10 ligands were predicted to inhibit CYP1A2. The predicted excretion parameter showed that total clearance ranged from 0.191 to 1.86 for the ligands. All the ligands were not substrates to renal OCT2. Ames's toxicity profiling of the ligands showed that all ligands apart from II, VI, XI, and XXV could be carcinogenic. On the other hand, all the ligands except IV and X did not indicate hepatotoxicity concerns. Furthermore, all the ligands were not inhibitors to hERG I but V, VII,XII, XV, XVII, XVIII, XIX and XXI were inhibitors to hERG II. Oral acute toxicity of various ligands in rats ranges from 1.365 to 2.968 while chronic toxicity in rats ranges from 0.637 to 11.25. In general, the pharmacological activities of all ligands are found on Table 3 and 4 for reference purpose.
Docking Scores of Ligand with AST, ALT and Netrin.

The retention indices of the ligand ranges from 446.284 to 3071.757 of which squalene had the lowest of the retention indices with anabasine having the highest retention indices. The development (Dev.) on the column of Table 2 explains the time of flight on the mass chromatography, a detection method for gas phase ions that determines their mass-to-charge ratio (m/z) based on how quickly they travel a known distance. The Dev. (min) ranges from 18 to 74 min. Pentadecanoic acid and Tetradecanoid had the lowest and highest development time respectively.
Docking Output of various Ligands with AST, ALT and Netrin
All the thirty ligands in Tom brown extract met the Lipinski rule of five. For precision and avoidance of ambiguity in this research, ligands which had zero violation of the Lipinski rule were the ones selected for the docking procedures. A total number of eleven (11) ligands met this requirement and were used in the docking procedures against AST, ALT and netrin. AST and ALT were the liver enzymes of choice for the docking procedures because they are considered more related to the liver incases of injuries or disease and highly release into the serum during injuries or diseases. However, this is not really applicable for ALP as they are produced in the bones aside the liver as well. Netrin was also a protein of choice for the docking procedures as recent researches shows that it is linked to memory and learning processes in the body. The outcome of the docking visualization in 2-D using Biovia Discovery Studio 21 are shown in Figure 4, Figure 5 and Figure 6. The figures presents diverse hydrogen and other bonds generated when the 11 ligands are docked with ALT, AST and Netrin. Docking scores generated from the affinity between ligands and pepsin protein are presented in Table 5.

Docking outputs for the various ligands (A-K) with Netrin in 2-D using Biovia Discovery studio 21. A= (-)-Menthoxyacetyl chloride, B= 4-Methyl itaconate, C= 5-hydroxymethyl furfural, D= (Z)-octade-9-enoic acid, E= Butanedioyl dihydrazide, F= Carpaine, G= 15-Hydroxypentadecanoic acid, H= Anabasine, I= Pentadecanoic acid, J= Tetra-decanoic acid, K= Tri-methyl Citrate.

Mean food intake among experimental groups Values are expressed as mean ± SEM, n = 5. No significant difference among groups.

Mean water intake among experimental groups. Values are expressed as mean ± SEM, n = 5. No significant difference among groups.
Comparison of Food Intake among Experimental Groups
The mean ± SEM of food intake in the Control, Combined, and Tom brown experimental groups were 14.51 ± 01.35 g, 13.98 ± 1.26 g, and 11.87 ± 1.16 g. Analysis of this result showed no significant difference among the experimental group (Figure 7). However, Tom brown experimental animals showed lower food intake compared to other experimental groups.

Body weight changes among experimental groups. Values are expressed as mean± SEM. No significant difference among groups.
Comparison of Water Intake among Experimental Groups
The mean ± SEM of water intake in Control, Combined, and Tom Brown experimental groups were 19.80 ± 0.86 mls, 21.80 ± 1.39 mls and 21.80 ± 2.03 mls respectively. The result showed no significance difference among the experimental groups (Figure 8).

Weekly body weights of the experimental animals. Values are expressed as mean ± SEM. No significant difference among groups.
Comparison of Body Weight Changes Between among Animals
The mean ± SEM of body weight changes in the Control, Combine and Tom brown groups were 56.94 ± 6.16 g, 72.00 ± 4.50 g and 67.88 ± 6.95 g respectively. Analysis of the result showed no significant difference among the experimental animals (Figure 9). However, Tom brown experimental group showed higher body weight throughout the weekly duration of the experiment (Figure 10).

Alanine aminotransferase concentration in Control, Combined and Tom brown fed rats. Values are expressed as mean ± SEM, n = 5. No significant difference among groups.
Aspartate aminotransferase concentration in control, Combined and Tom brown fed rats. Values are expressed as mean ± SEM, n = 5. No significant difference among groups.
Comparison of serum Alanine Aminotransaminase (ALT) Activities among Experimental Animals
The mean ± SEM of ALT activities in the Control, combined and Tom Brown experimental groups were 67.89 ± 3.15 Iu/L, 71.68 ± 1.30 Iu/l and 73.65 ± 0.89 Iu/l respectively. Analysis of the result showed no significant differences among the experimental groups (Figure 11).
Alkaline phosphatase concentration in the control and Tom brown fed rats. Values are expressed as mean ± SEM, n = 5. No significant difference among groups.
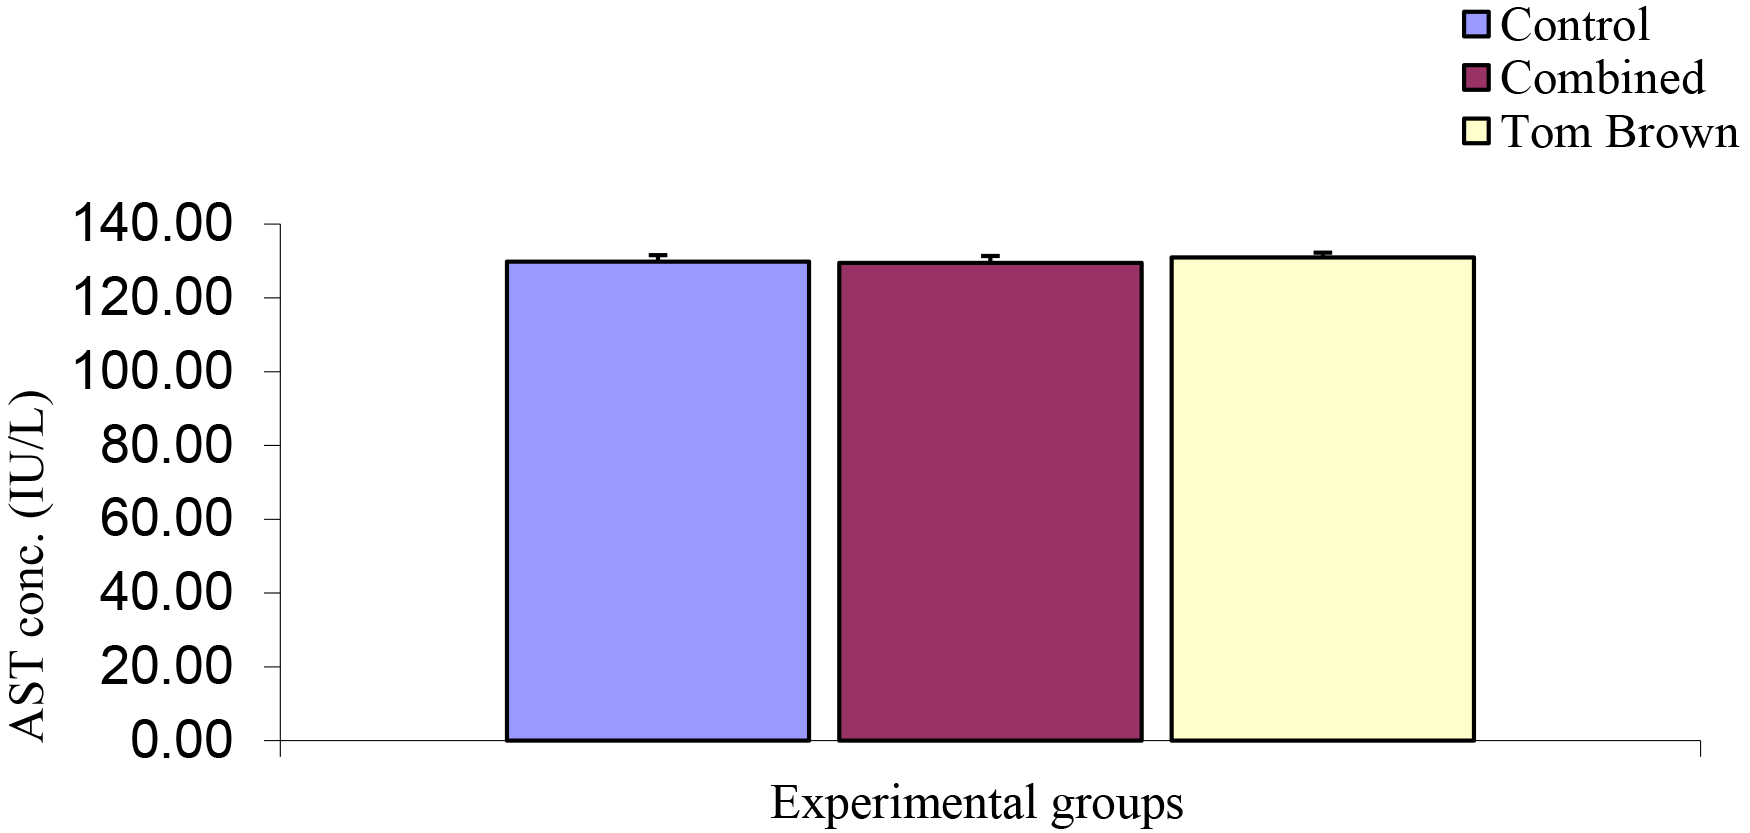
Comparison of the serum of Aspartate Transaminase (AST) Concentration among Experimental Groups
The mean ± SEM of control, Combined, and Tom brown were 129.81 ± 1.77 Iu/L, 129.51 ± 1.84 Iu/L, and 130.94 ± 1.31 Iu/L respectively. The analysis of this result showed no significant difference (Figure 12).
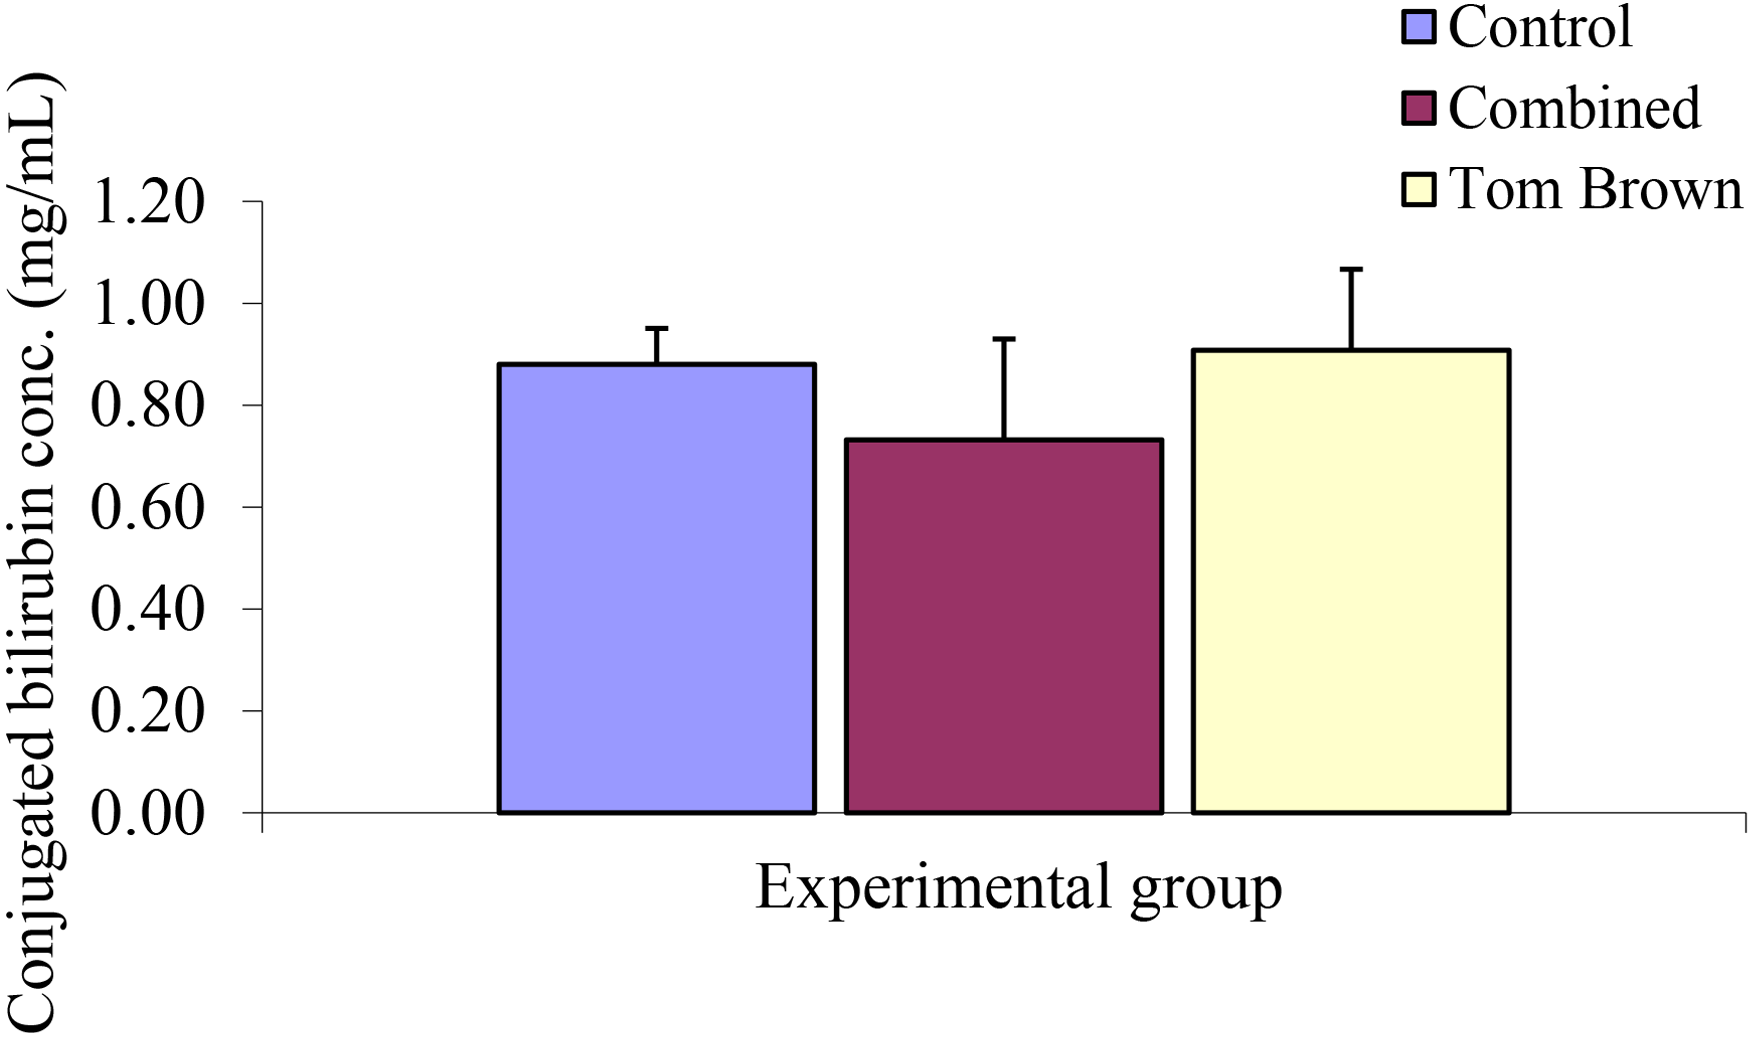
Conjugated bilirubin concentration in the control and Tom brown fed rats. Values are expressed as mean ± SEM, n = 5. No significant difference among groups.
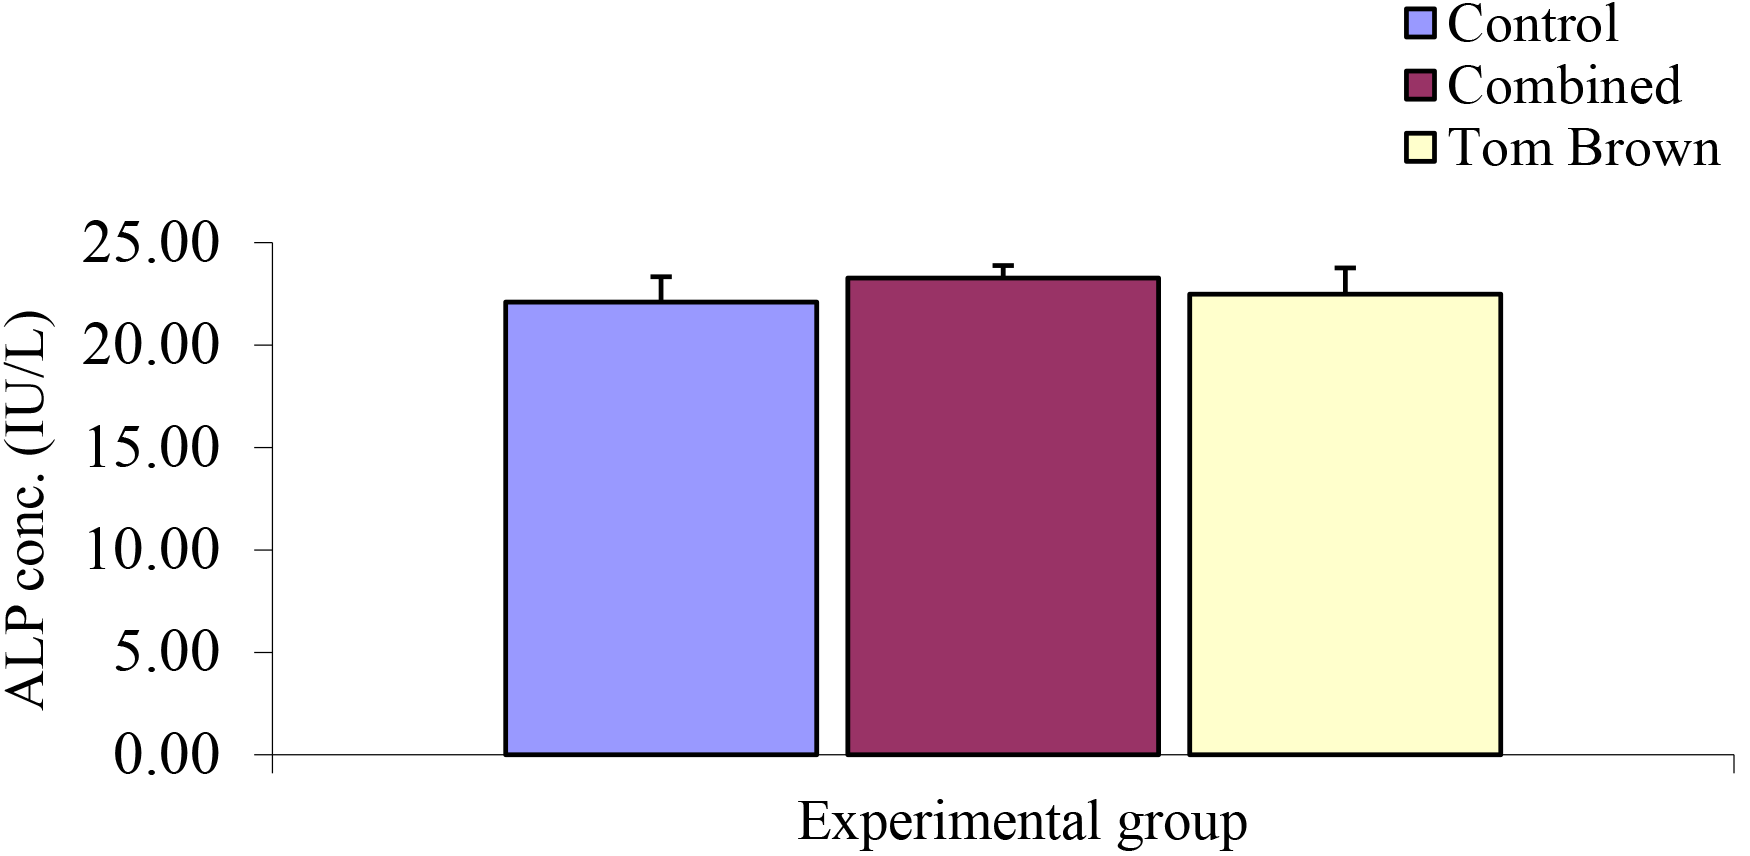
Comparison of serum Alkaline Phosphatase (ALP) Concentration among Experimental Group
The mean ± SEM of control, combined, and Tom brown were 22.10 ± 1.24 Iu/L, 23.28 ± 0.61 Iu/L, and 22.48 ± 1.29 Iu/L respectively. The analysis of this result showed no significant difference (Figure 13).

Unconjugated bilirubin concentration in the control and Tom brown fed rats. Values are expressed as mean ± SEM, n = 5. No significant difference among groups.
Comparison of Conjugated, Unconjugated and Total Bilirubin Concentration among Experimental Group
The mean ± SEM of conjugated bilirubin concentration between the Control, Combined, and Tom brown are 0.88 ± 0.12 mg/dl, 0.73 ± 0.19 mg/dl, 0.91 ± 0.15 mg/dl. Analysis of the results showed no significant difference among experimental groups (Figure 14). The mean ± SEM of unconjugated bilirubin concentration between the Control, Combined, and Tom brown experimental groups were 0.86 ± 0.07 mg/dl, 0.94 ± 0.20 mg/dl, 0.96 ± 0.16 mg/dl. Analysis of this result showed no significant difference among experimental groups (Figure 15). The mean ± SEM of total bilirubin concentration between the Control, Combined, and Tom brown experimental groups were 1.74 ± 0.17 mg/dl, 1.50 ± 0.22 mg/dl, 1.87 ± 0.07 mg/dl. Result also showed no significant difference among experimental groups (Figure 16).

Total bilirubin concentration in the control and Tom brown fed rats. Values are expressed as mean +SEM, n = 5. No significant difference among groups.

Chemical structures of Ligand I – XV: I=4- methyl itaconate, II=5-hydroxymethyl furfural, III= Trimethyl citrate, IV= Tetradecanoic acid, V= Pentadecanoic acid, VI= 1,2,3-propanetriol,1-acetate, VII=(Z)-Octadec-9-enoic acid, VIII= Methyl 10 -methylheptadecanoate, IX= Copaene, X= Campesterol, XI= Methyl hexadecanoate, XII= Clinosterol, XIII= Lupenone, XIV= β-amyrin, XV=17-Octadecynoic acid.
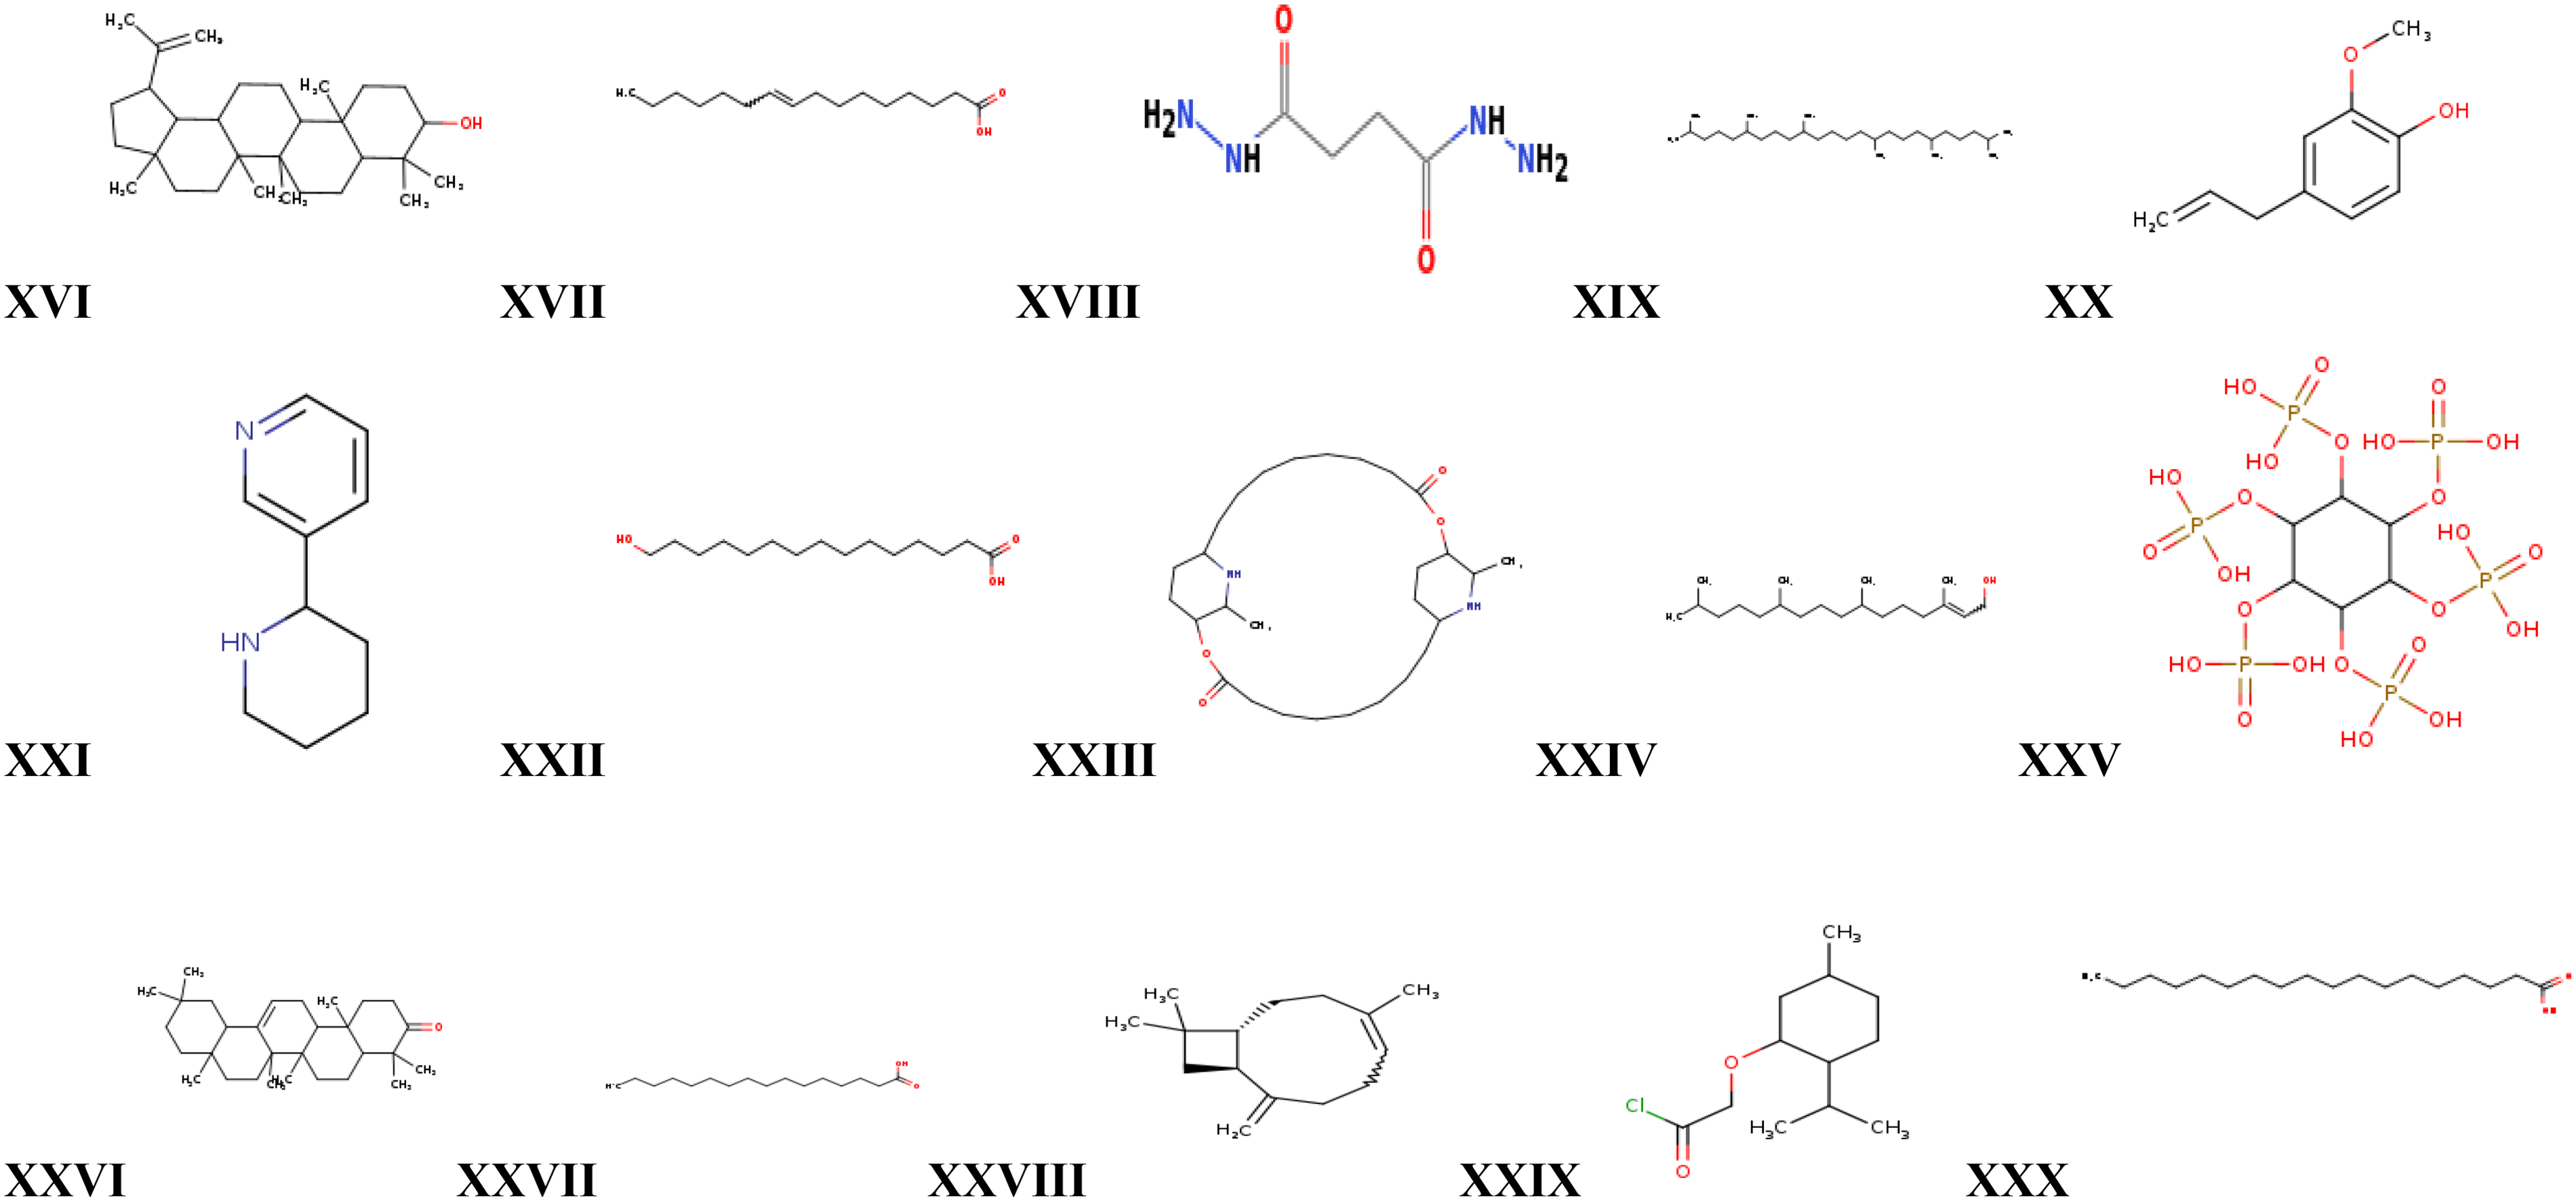
Chemical structures of Ligand XVI-XXX. XVI= Lupeol, XVII = Cis-9-hexadecanoic acid, XVIII = Butanedioyl dihydrazide (succino dihydrazide), XIX = squalane XX = Eugenol, XXI = Anabasine XXII = 15-hydroxy-pentadecanoic acid, XXIII = carpaine, XXIV = Phytol, XXV = Phytic acid, XXVI = Olean-12-en-3-one , XXVII = n- hexadecanoic acid, XXVIII = Beta-caryophellene, XXIX = (-)-menthoxyacetylchloride, XXX = Octadecanoic acid.
Habituation and Discrimination index for Short and Long Term Memory among Experimental Groups
The Mean ± SEM of habituation index for short term memory of the Control, Combined and Tom brown experimental groups are −0.08 ± 0.73, −5.38 ± 3.00, −16.44 ± 5.00 respectively. Those of Discrimination index for short term memory of Control, Combined and Tom brown experimental groups were 0.00 ± 0.04, −0.02 ± 0.09, −0.22 ± 0.09 respectively. The mean ± SEM of the habituation index of long term memory for the Control, Combined and Tom brown experimental groups are −5.88 ± 1.80, −9.16 ± 3.45, −14.77 ± 6.35 respectively whereas the discrimination index of the long term memory for Control, Combined and Tom brown fed rats were −0.34 ± 0.09, −0.31 ± 0.08, −0.10 ± 0.15 respectively. Results showed no significance difference among experimental groups (Table 6)
Habituation and Discrimination index of Short and Long Term Memory among Experimental Groups.

(No significant difference among experimental groups).
AST ALT Ratio among Experimental Groups
The Mean ± SEM of AST ALT ratio among experimental groups were 380.48 ± 1.21, 363.77 ± 10.87 and 364.00 ± 7.61 for Control, Combined and Tom brown experimental groups respectively. The result showed no statistical significance among the experimental groups at P > 0.05 (Table 7)
Multiple Comparisons of AST:ALT Ratio among Experimental Groups.

Discussion
The essence of a protein-rich meal has become essential in assessing its effect on the liver following consumption. Tom Brown weaning meal has been shown to contain high protein contents and nitrogen. 26 Subject to this, Tom Brown could be a meal of importance in protecting the liver and further ensuring normal functions of the liver as it is observed that protein rich meals enhances these acclaimed functions in the liver. Alanine transaminase (ALT), aspartate transaminase (AST), alkaline phosphatase (ALP), and serum bilirubin are often frequently used laboratory tests carried out to assess the functions of the liver and ascertain its disease state. 27 An increase in these parameters is usually linked to liver damage. However, in cases where these parameters have non-significant results compared to those of a control group, whatever extract, drug, or substance administered or taken by the experimental animals in the research is said to have the tendency to neither affect the organ negatively or positively. Such extract from a food substance or fruit may be recommended for consumption even in disease conditions of the organ question being that it has no effect on the organ. Umoh and colleagues have shown this in their research. 7 It is also important to note that the elevation of the liver function tests is applicable to 80% of the general population. In fact, elevation could be transient in patients without symptoms, and 30% of the elevation could resolve itself within three weeks. Hence, it is important to be careful when arriving at conclusions after noticing an elevated liver function test in order to avoid unnecessary testing. 28 In ascertaining the liver health state, a ratio of the AST and ALT becomes paramount. A borderline AST and/or ALT value, which is often used to assess the health state of the liver, is defined as less than two times the upper limit of normal (ULN); a mild AST and/or ALT elevation is that which is 2 times ULN; a moderate AST or ALT elevation is that which is 5–15 times ULN; a severe AST and/or ALT elevation is greater than 15 times ULN; and a massive AST and/or ALT elevation is greater than 10,000 IU/L. Assessment the ratio of AST to ALT in this research showed no statistical significance among the experimental groups, further ascertaining the fact that Tom brown weaning meal poses no effect on the liver.
The magnitude of AST and ALT elevations varies depending on the cause of hepatocellular injury. 29 However, the values of the AST and/or ALT here may not be applicable to experimental animals such as rats, mice, and others. The reason is that research on experimental animals is usually assessed using the control experimental groups as the baseline for determining favorable or unfavorable outcomes in other experimental groups.30,31 Also, liver function diagnosis can detect the pattern of the liver disorder. It can be a hepatocellular or cholestatic pattern. For hepatocellular patterns, elevated aminotransferases out of proportion to alkaline phosphatase are associated with acute or chronic viral hepatitis, steatohepatitis, acute Budd-Chiari syndrome, Ischemia hepatitis, autoimmune, hemochromatosis, medication or toxins that could be from food, autoimmune, alpha-antitrypsin deficiency, Wilson disease, and Celiac disease when ALT is predominant in the elevation. However, when AST is predominant, then such is linked to alcohol-related, steatohepatitis, cirrhosis, and non-hepatic (hemolysis, myopathy, thyroid disease, exercise). Cholestatic patterns present themselves with elevated alkaline phosphatase, gamma glutamyl transferase, and bilirubin out of proportion to AST and ALT. Hepatobiliary causes are often linked to bile duct obstruction, primary biliary cirrhosis, primary sclerosing cholangitis, medication-induced, infiltrating diseases of the liver (sarcoidosis, amyloidosis, lymphoma, etc), cystic fibrosis, hepatic metastasis, and cholestasis. Non-hepatic causes include bone disease, pregnancy, chronic renal failure, lymphoma or other malignancies, congestive heart failure, childhood growth, infection, or inflammation. 27 Tom Brown possesses no effect on the liver following its non-significant results of AST, ALT, ALP, and bilirubin concentration in the serum of the tom brown-fed and combined experimental animals compared to the control group. In this study, the liver enzymes assessment was carried out after four weeks. Same study has been shown by Umoh and colleagues. 23 Liver toxicity can either be acute or chronic. Acute liver toxicity occurs in days or weeks and may be as a result of drugs, chemical substances or viruses which may be contacted from external substances including edible ones. Hence, the assessment of liver functions in four weeks was not out of place. 32 Docking of the various compounds in the tom brown with AST and ALT was to ascertain if there is any compound in Tom brown following the GCMS study that may offer a protective effect on the liver. Compound carpaine and 5-Hydroxymethyl furfural (5-HMF) were possible compounds of Tom brown that mediates a protective effect on the liver following other researches. However, in this research, though these two compounds were present but their effect were minimal, considering that their peak area were among the least of the compounds with carpaine having a peak area of 0.89 and 5HMF having a peak area of 0.96. The dominating and most active compounds of Tom brown as evident in this study was Lupeol with 25.69 peak area. Newly developed technology has also been a novel approach to ascertaining the authenticity of results gotten from laboratory procedures. Engineering techniques, bioinformatics, docking procedures, and many others constitute these new technological approaches in research. Artificial intelligence, photoacoustic imaging, and other procedures have been used in research that concerns the liver.33–35 The result of docking with AST in this study showed a better score with the carpaine ligand of −6.3. Carpaine is a compound that dominates the extract of Carica papaya linn seed extract.
A study has shown the extract of Carica papaya to be effective in the treatment of liver injuries. 36 There is a possibility that this effect of Carica papaya extract is a result of the content of carpaine. This was also confirmed by Ogan and colleages. 37 Also, docking studies of the eleven ligands that had zero violations in Tom Brown extract with ALT enzymes showed that 5-hydroxylmethyl furfural had a better docking score of −5.6. The possible effect of Tom Brown extract posing neither detrimental or positive effect on the liver could also be linked to 5-hydroxymethyl furfural (5-HMF).Irrespective of the fact that the compound was among the least of the peak area assessment. A previous study suggested that 5-HMF attenuates liver fibrosis in CCl4+-alcohol-induced mice by suppressing oxidative stress. 38 Therefore, the hepatocellular protective effect of Tom Brown feed is likely due to the effects of carpaine and 5-HMF ligands found in the extract.
Habituation and discrimination index for short-term memory during the novel object recognition test of the experimental animals showed no significant difference among experimental groups. Also, long-term memory appeared to be more enhanced in the Tom Brown experimental animals, as their respective habituation and discrimination indexes in the novel object recognition test were higher than those in the control and combine experimental groups, though not significant. Netrin was the protein docked with the eleven ligands that had zero violations using the Lipinski rule of five. Carpaine had a better docking (−7.7) score with netrin protein. Certain research on the long-term spatial memory and morphological changes in the hippocampus of Wistar rats exposed to smoke from Carica papaya leaves has proven that the leaf extract would cause a significant increase in the enhancement of long-term spatial memory in animals that smoked the dried leaf compared to the control. Therefore, smoking papaya leaves has the ability to maintain a long-term spatial memory at all doses, but retrieving those memories is better at low and medium doses. 36 This effect of Carica papaya is most likely a function of carpaine, as shown by Oyewole & Oweyele as well as Ogan.37–39 From the results, it can be inferred that Tom brown pose no detrimental or enhancing effect on long term memory and may be recommended as a meal of choice in conditions patients are conscious about their meal choices not altering their memory or liver functions. Again, though Carpaine is linked to memory functions, it also had a low peak area from the GCMS result of Tom brown whereas as lupeol was the most active compounds of Tom brown. Carpaine may be a compound that enhances consolidation of memory in Tom brown. However, its effect may be best seen following increased peak area or concentration which wasn’t so in Tom brown. Long-term memory function is associated with the hippocampus. 40 Therefore, the target side of carpaine extract in enhancing long-term memory could likely be the hippocampus aspect of the brain.
Limitation of the Study
This study was limited to GC-MS analysis of the Tom Brown extract, ADMET properties, and liver. Further studies should be conducted on other aspects of the gastrointestinal tract to ascertain the effect of this diet on the digestive system.
Conclusion
Conclusively, Tom Brown possesses no negative or enhancing effect on hepatocellular and learning/memory functions. Docking study and GCMS carried out on Tom brown using ALT,AST and Netrin shows a good score with compounds of 5-HMF and carpaine,. However, a larger sample size and investigation of long-term consumption of Tom Brown meal with exploration of additional biomarkers connected to liver and brain health might be positive steps in the right direction towards future research because these compounds had limited peak area in the Tom brown irrespective that they passed the Lipinski rule of five. The examination of potential synergistic or antagonistic interactions among the ligands of Tom Brown should also be studied for future research.
Footnotes
Acknowledgement statement
The authors acknowledge the academic and technical staff of Physiology Department, Faculty of Basic Medical Sciences, Arthur Jarvis University, Akpabuyo, Cross River State, Nigeria for their technical support. We will also extend our acknowledgement to Dr Uduak Anthony Inwang for his idea and advice during the course of the work.
Authors contributions
Ekementeabasi Aniebo Umoh: Conceived, design and supervised the experiment.
Agnes Igimi Odey: Writing of manuscript and provision of resources.
Condoleezza Bohneji Mbu: Data analysis and contributed reagents.
Kevin Marshal Otu: Contributed reagent, materials and analysis.
Joseph Okon Asuquo: Laboratory sacrifice and methodology.
Effiom-ekaha Otu Otu: Laboratory sacrifice and methodology.
Victor Kanu Uno: Co-supervision.
David Oyom Bassey: Data Analysis.
Declaration of Conflicting Interests
The authors declared no potential conflicts of interest with respect to the research, authorship, and/or publication of this article.
Ethics Approval and Consent to Participate
All experiment were performed in accordance with the guideline for care and use of laboratory animal of the Faculty of Basic Medical Science Animal Research Ethics Committee, Arthur Jarvis University. Ethical approval was granted by the committee with approval number FAREC-FBMS-00255
Funding
The authors received no financial support for the research, authorship, and/or publication of this article.
Informed Consent
There are no human subjects in this article and informed consent is not applicable.
Statement of Animal Rights
All procedures in this study were conducted in accordance with the International Animal Guidelines of Arthur Jarvis University, Nigeria and were approved by Faculty of Basic Medical Science Animal Research Ethics Committee, Arthur Jarvis University (FAREC-FBMS-00255)
Supporting Information Statement
Smiles strings of compounds from GC-MS analysis were sourced from PubChem home page (http://.pubchem.ncbi.nlm.nih.gov). Results of the experiment on ADMET and structures of compounds from the GC-MS result on Tom brown were further gotten from swissadme homepage (![]() ) by inputting the smiles on the homepage and clicking on Run icon. GC-MS and docking result of Tom brown's ligands is made available following request from corresponding author.
) by inputting the smiles on the homepage and clicking on Run icon. GC-MS and docking result of Tom brown's ligands is made available following request from corresponding author.