
Abstract
Background/Objectives
Diabetes mellitus is among the leading cause of death worldwide. This study evaluated the alpha amylase and alpha glucosidase inhibitory properties of kaurane diterpenoids (kauran-13-ol (D1), xylopic acid (D2) and kauran-16α-ol (D3)) from the fruit of X. aethiopica.
Methodology
In vitro alpha amylase and alpha glucosidase inhibitory assays were performed on D1, D2 and D3 (0.03125, 0.0625, 0.125, 0.25, 0.5, 1.0 and 2.0 mg/mL) and acarbose (0.003125, 0.00625, 0.0125, 0.025, 0.05 and 0.1 mg/mL) followed by molecular docking studies, molecular dynamics simulation and MMPBSA to examine their mode of interaction, binding affinity, binding mode and binding energy established with the enzymes. Also, ADMET properties of the studied diterpenes were examined to explain their druggability potential.
Result
The in vitro alpha-amylase and alpha-glucosidase studies identified D3 as the most promising inhibitor among the kaurane diterpenes with lower IC50 values of 0.65 and 0.17 mg/mL. The molecular docking analysis showed that D1, D2 and D3 established vital hydrogen bond, hydrophobic and pi-interaction with the receptors, while the molecular dynamics simulation showed the kaurane diterpenes exhibited good stability at the enzymes’ binding pocket. The MMPBSA binding energy values showed the diterpenes had good binding energies that corroborated that of molecular docking. The ADMET properties identified the compounds as promising drug candidate.
Conclusion
The study demonstrated that the kaurane diterpenoids have good inhibitory effect on the diabetes enzymes. Further comprehensive investigation into the antidiabetic properties of the diterpenes may lead to the identification of new hit molecule.
Keywords
Introduction
Diabetes mellitus is a non-communicable metabolic disorder characterized by high blood sugar levels resulting from defective insulin secretion, insulin action, or both. 1 Diabetes is a prevalent disease that affects millions of people globally. The most common types of diabetes are type 1 and type 2 diabetes, which contributes to 5–10% and 90–95% of cases, respectively. 2 Diabetes can cause a range of complications, including microvascular and macrovascular endpoints. 3 Microvascular complications include retinopathy, nephropathy, and neuropathy, while macrovascular complications include ischaemic heart disease, stroke, and peripheral vascular disease. 4 Therefore, effective management of diabetes is essential to prevent these complications.
Enzymes like glycosidases are key players in the pathophysiology of diabetes by breaking down carbohydrates into glucose. 5 Alpha-amylase breaks down long-chain carbohydrates in the mouth of diabetic and non-diabetic subjects, while α-glucosidase is associated with the breakdown of starches and disaccharides in their small intestine. 6 Various studies have shown that inhibiting the activity of these enzymes can be an effective strategy for managing diabetes.7,8 Synthetic drugs like acarbose and voglibose are known to inhibit the activity of α-amylase and α-glucosidase, leading to a reduction in blood glucose levels. 4 However, currently available synthetic drugs for this purpose are associated with gastrointestinal side effects and may not be affordable to diabetic patients. 8 The development of natural inhibitors with fewer or no side effects has been proposed as an alternative option for the control of hyperglycemia.4,9
Natural products from medicinal plants have been explored as potential antidiabetic agents through their mechanistic approach to inhibiting and activating enzymes in diabetes pathophysiology.10,11 For instance, studies have shown that plant-derived compounds such as polyphenols and flavonoids can effectively inhibit and activate these enzymes, providing a promising avenue for developing new antidiabetic drugs.9,12 Kaurane diterpenes are unique tetracyclic diterpenoids commonly isolated from medicinal plants belonging to families like Annonnaceae, Euphorbiaceae, Fabaceae, Rutaceae Chrysobalanaceae, Jungermanniaceae, Erythroxylaceae, Rhizophoraceae and many more.13,14 This type of diterpenes has huge promising pharmacological potentials like antimicrobial, antidiabetic, larvicidal, schistosomicidal, antitumor and cytotoxic activities. 14 Famuyiwa et al 14 previously isolated derivatives of kaurene diterpenoids from the fruit of Xylopia aethiopica (Dunal) A. Rich (Annonnaceae).
Molecular docking and molecular dynamics (MD) simulation has become extensively useful in identifying potential drug candidates that can be developed for the treatment of diseases. 15 The computational methods help to identify hit molecules through their binding energy and also provide insight into their binding mode, stability and interactions.12,16 In our effort to identify new drug candidates that can function effectively as alpha amylase and alpha glucosidase inhibitor, kaurane diterpenoids (kauran-13-ol (D1), xylopic acid (D2) and kauran-16α-ol (D3)) previously isolated from the fruits of X. aethiopica by our research group (Figure 1) 14 were evaluated using in vitro and in silico (molecular docking, molecular dynamics simulation and ADMET) approaches.

Chemical structure of kaurane diterpenoids derivatives.
Materials and Method
Extraction and Isolation
The extraction and isolation of D1, D2 and D3 as performed by Famuyiwa et al 14 are presented in Supplemental material.
In Vitro Alpha Amylase Inhibitory Assay of the Kaurane Diterpenes
The assay was performed employing a modified protocol derived from McCue et al
18
In each tube, 100 µL of D1, D2, and D3 (0.03125, 0.0625, 0.125, 0.25, 0.5, 1.0 and 2.0 mg/mL) or acarbose (positive control, 0.003125, 0.00625, 0.0125, 0.025, 0.05, and 0.1 mg/mL) and 100 µL of 0.02 M phosphate buffer (pH 6.9 with 0.006 M sodium chloride) containing α-amylase from Aspergillus oryzae (0.5 mg/mL) were introduced. The tubes underwent incubation at 25 °C for 10 min. Following pre-incubation, 100 µL of 1% starch solution in 0.02 M sodium phosphate buffer (pH 6.9 with 0.006 M sodium chloride) was added to each tube. The reaction was terminated with 200 µL of dinitrosalicylic acid color reagent (1.0 g of 3,5-dinitrosalicylic acid, 20 mL of 2 M NaOH, and 30 g of sodium potassium tartarate in 100 mL distilled water). The test tubes were then subjected to a 5-min incubation in a boiling water bath, followed by cooling to room temperature. The reaction mixture was diluted with the addition of 1.5 mL distilled water, and absorbance at 540 nm was measured using a microplate reader (SpectraMax, USA) by transferring 200 µL into 96-well plates. The α-amylase inhibitory activity was quantified as % inhibition, and the concentrations of phytochemicals/acarbose leading to a 50% inhibition of enzyme activity (IC50) were determined.
19

In Vitro α-Glucosidase Inhibitory Activity of the Kaurane Diterpenes
The α-glucosidase inhibitory experiment utilized a modified procedure based on McCue et al
18
Alpha-glucosidase from Saccharomyces cerevisiae was procured from Sigma. In 96-well plates, 50 µL of D1, D2, and D3 (0.03125, 0.0625, 0.125, 0.25, 0.5, 1.0 and 2.0 mg/mL) or acarbose (0.1, 0.05, 0.025, 0.0125, 0.00625, and 0.003125 mg/mL) was combined with 50 µL of 0.1 M phosphate buffer (pH 6.9) containing α-glucosidase solution (1.0 U/mL) and incubated at 25 °C for 10 min. Following pre-incubation, 50 µL of 1 mM p-nitrophenyl-glucopyranoside solution in 0.1 M phosphate buffer (pH 6.9) was added to each well. The reaction mixtures underwent a 20-min incubation at 25 °C and were halted by the addition of 150 µL of 1 M Na2CO3. Absorbance readings at 405 nm were recorded using a microplate reader and compared to a control, which included 50 µL of buffer solution instead of the chemical compounds/acarbose. The α-glucosidase inhibitory activity was quantified as % inhibition, and the concentrations of the diterpenes/acarbose leading to a 50% inhibition of enzyme activity (IC50) were determined.
19

Enzyme Kinetic Studies of the Kaurane Diterpenes
The kinetic parameters (Km, Vmax) of D1, D2, and D3 were calculated using enzyme inhibition assays as described above using varying concentrations of the respective substrates (for the α-amylase and α-glucosidase inhibitory experiments) at a fixed concentration (2 mg/mL) of D1, D2, and D3. The assays were carried out at five substrate concentrations (0.3125, 0.625, 1.25, 2.5 and 5 mM of starch and p-nitrophenyl-glucopyranoside for α-amylase and α-glucosidase respectively). The kinetic parameters were obtained from the non-linear regression fit of the Michaelis-Menten plot and Lineweaver-Burk plot using Graph Pad Prism 5.0. The median inhibitory concentration of isolated compounds (IC50) against α-amylase and α-glucosidase were calculated using simple regression plots constructed with the % inhibition against test sample concentration of three replicate experiments.
Protein and Ligand Preparation
From the receptor data bank (www.rcsb.org), the three-dimensional crystallographic structures of α-amylase and α-glucosidase, denoted by PDB IDs 4GQR and 3L4Y, were obtained. To get the α-amylase and α-glucosidase receptors ready for docking, the amino acid residues in the binding sites of these enzymes were identified and visualized using PyMOL by considering residues with 5 Å (Supplemental material, Table S1). Later on, water molecules, co-crystallized ligand, ions, and co-factors were removed from each enzyme to obtain a stripped-down protein. Subsequently, PDB format was used to store the clean protein.
The 3D chemical structures of standard drugs acarbose (standard drug) was downloaded from the PubChem database while those of the D1, D2 and D3 previously isolated from X. aethiopica by Famuyiwa et al 14 was built with Spartan 14 software. The energy minimization of the ligands was executed using the in-built Open Babel GUI plugin of the PyRx 0.8 software. All minimized chemical structures were converted and saved in PDB format.
Validation of Docking Methodology and Molecular Docking Studies
The molecular docking protocol was first validated before docking studies was performed. In validating the docking method, the co-crystallized ligand of α-amylase and α-glucosidase enzymes was re-docked into the binding pocket of each enzyme. RMSD values of the resulting re-docked and co-crystallized ligand were estimated using PyMol software.
In order to perform the virtual screening, the PDB files of the individual target proteins were loaded on MGL Tool where polar hydrogen atoms were added to each protein and non-polar hydrogen atoms were merged and the resulting proteins were saved in PDBQT format. Each protein was thereafter loaded in PyRx 0.8 software and the grid box center and the dimension of the enzyme binding site was set (Supplemental material, Table S2). Docking runs for each ligand was carried out using the built-in Autodock Vina tool 17 with an exhaustiveness value of 50. Upon completion of the docking procedure, each protein-ligand complex's nine binding poses were ranked according to their Root Mean Square Deviation (RMSD) values after the docking process was completed, and the best complex was determined to be the pose having the smallest RMSD score. Subsequently, hydrogen bond, pi, and hydrophobic interactions were examined using Discovery Studio software 2020.
Molecular Dynamics Simulations and MM-PBSA Calculations
The complexes of α-amylase and α-glucosidase with kaurene-type diterpenoids (D1, D2, and D3) and their corresponding cocrystal ligand complexes underwent a 100 ns MD simulation study. Additionally, MD simulations were conducted on the apo structures of α-amylase and α-glucosidase for comparison. The Gromacs Version 2020.4 program 20 was employed for the MD simulations, utilizing the HPC cluster provided by the “Bioinformatics Resources and Applications Facility (BRAF), C-DAC, Pune.”
Briefly, the MD simulation steps included the preparation of protein and ligand topologies, solvation, neutralization, equilibration, and the production phase of MD simulations. Protein topologies were generated using the CHARMM-36 force field parameters,21,22 while ligand topologies were generated from the CGenFF server.22,23 The resulting complexes, including apo proteins, were placed in a dodecahedron unit cell, maintaining a 1 nm distance between the edges of systems and the box. Water molecules were added using the TIP3P water model, 24 and the systems were neutralized with sodium and chloride counter-ions to achieve a molar concentration of 0.15.
The resulting systems were energy minimized to release the steric clashes if any where the steepest descent algorithm was used with the cut-off of force-constant threshold of 100 kJ mol−1 nm−1. Two step equilibration was performed on resulting system, where the initial equilibration was performed at constant temperature condition (NVT) of 300 K temperature and later at constant pressure conditions (NPT) at 1 atm pressure. During equilibration steps, the constant temperature conditions were achieved using a modified Berendsen thermostat 25 and the constant pressure conditions were achieved using the Berendsen barostat, 26 for 1 ns each. The final 100 ns production phase MD simulation were performed where the temperature conditions of 300 K were achieved with a modified Berendensen thermostat and pressure conditions of 1 atm were achieved with the Parrinello-Rahman barostat. 27 The restrain on covalent bonds was achieved with LINCS algorithm. 28 The long-range electrostatic energies were computed with Particle Mesh Ewald (PME) method 29 with a cut-off of 1.2 nm.
The output trajectories were treated for periodic boundary conditions before MD analysis. The root mean square deviations (RMSD) in the backbone atoms, the root mean square fluctuation (RMSF) in the side chain atoms, radius of gyration (Rg), and the analysis of solvent accessible solvent area (SASA) of each system was analyzed. The hydrogen bond analysis between the ligands and α-amylase and α-glucosidase was also carried out. Further insights of the ligand conformations and hydrogen bonds formed were obtained from the trajectory analysis where the trajectories extracted at equilibrium state, 25, 50, 75, and 100 ns simulation period were used. The major path of motions in each, α-amylase and α-glucosidase complexes, was studied through the principal component analysis (PCA), 30 where the covariance matrix for the backbone atom was constructed and diagonalized to obtain the eigenvectors and eigenvalues. Here, the eigenvectors represented the path of motion, while eigenvalues represented the mean square fluctuations. The first two eigenvectors, principal components (PC1 and PC2) were further used as a reaction coordinates in the Gibb's free energy landscape 31 analysis and the lowest energy meta-stable conformations were interpreted. Molecular mechanics energies combined with Poisson Boltzmann surface area continuum solvation (MM-PBSA) calculations were performed with gmx_MMPBSA tool 32 on the trajectories sampled at 1 ns each from the 75 ns to 100 ns simulation period.
ADMET Studies
The ADMET profiling of the top-ranked kaurane-type diterpenoids were evaluated using the admetSAR 2 online server (http://lmmd.ecust.edu.cn/admetsar2). The ADMET properties studied for the selected α-amylase and α-glucosidase inhibitors include solubility, human intestinal absorption (HAI), human oral bioavailability (HOB), blood-brain barrier penetration, hepatotoxicity and carcinogenicity.
Results and Discussion
In Vitro Alpha Amylase Inhibitory Activity of the Diterpenes
The inhibition of α-amylase is important in the treatment of type II diabetes mellitus because its digestive activity on food substances correlates to an increase in postprandial glucose levels. 33 Alpha amylase inhibitors prevent the breakdown of carbohydrate and are therefore effective means of lowering postprandial hyperglycemia. It therefore impairs glucose metabolism without promoting insulin secretion in non-insulin dependent diabetes mellitus. The % alpha amylase inhibition of kaurane-type diterpenoids is shown in Table 1.
Percentage Alpha Amylase Inhibition and IC50 Values of Kaurane-Type Diterpenoids and Acarbose.
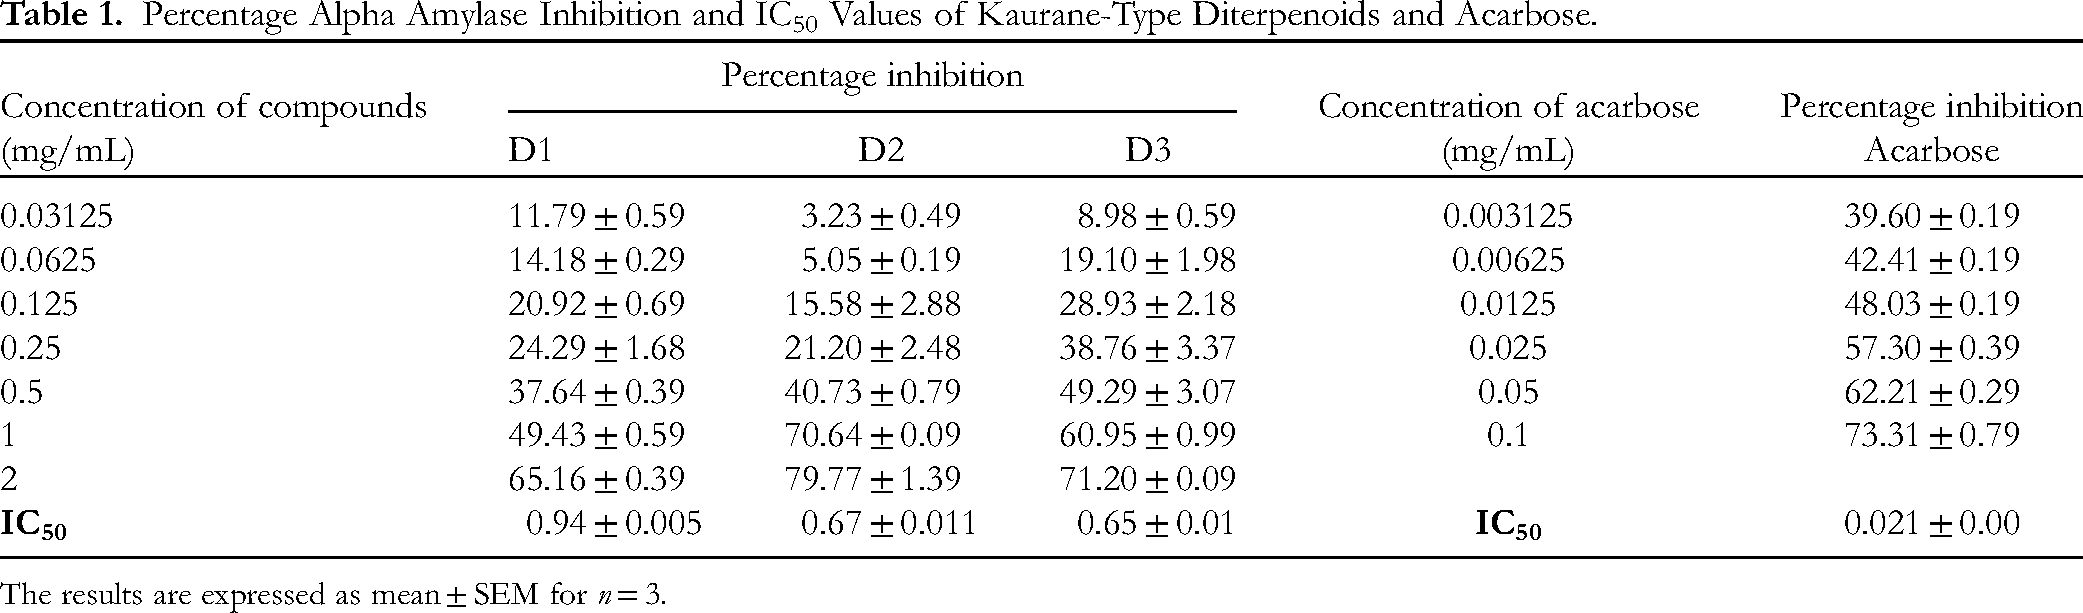
The results are expressed as mean ± SEM for n = 3.
The % inhibition of the compounds was linearly dependent on the concentrations as increasing concentrations yielded an increase in percentage inhibition of the enzymes. D1, D2 and D3 elicited a percentage inhibition of 65.16 ± 0.39, 79.77 ± 1.39 and 71.20 ± 0.09 at 2 mg/mL, while acarbose at 0.1 mg/ml had a percentage inhibition of 73.31 ± 0.79. The IC50 value for D1, D2, D3 and acarbose was also obtained as 0.94 ± 0.005, 0.67 ± 0.011, 0.65 ± 0.01 and 0.021 ± 0.001 mg/mL, the alpha amylase inhibitory activity of the diterpenes is in the order of acarbose > D3 > D2 > D1. Though the chemical structures of the phytochemicals are similar, they have different substituents which account for the results obtained in the in vitro activity. Carboxylic acid and hydroxyl groups are known to contribute to the inhibitory properties of phytochemicals against diabetes enzymes. 11 Adeyeoluwa et al 37 evaluated the inhibitory potential of ethanol and hot water extracts of X. aethiopica fruit and obtained IC50 values of 1433.23 ± 10.60 and 3640.07 ± 52.90 µg/mL. D3 gave better inhibitory activity than the ethanol and hot water extract indicating that purification of the compound may have increased its activity. Also, it can be inferred that D3 is among the active chemical constituents in the extract. The finding from the study is in line with result previously reported for a highly oxygenated methoxy flavone and vernoamyloside E which had IC50 values higher than all the kaurane diterpenes tested.38,39
Alpha-Glucosidase Inhibitory Activity of Isolated Compounds
The digestion of food particles into simple, smaller and absorbable is important in the digestive system of humans and this may result in elevated blood glucose level in hyperglycaemic subjects. 33 The alpha glucosidase is another enzyme that breaks down food substances and is located at the small intestine's brush border. Hence, its inhibition is a major strategy to manage type-2 diabetes. In this study, the in vitro alpha-glucosidase inhibitory activity of D1, D2, D3 and Acarbose was evaluated and presented in Table 2.
Percentage Alpha Glucosidase Inhibition and IC50 Value of Kaurane-Type Diterpenoids and Acarbose.

The results are expressed as mean ± SEM for n = 3.
All compounds assayed in the study had progressive percentage inhibition with D3 eliciting the highest inhibition value at all tested concentrations (0.03125, 0.0625, 0.125, 0.25, 1 and 2 mg/mL). Similarly, D3 elicited the lowest IC50 value of 0.17 ± 0.01 mg/mL compared to D2 at 0.45 ± 0.01 mg/mL and D3 at 0.46 ± 0.01 mg/mL compared to acarbose with IC50 value of 0.07 ± 0.01 mg/mL. The presence and position of the hydroxyl group on D3 may contribute to its lower IC50 value compared to the structural features of D1 and D2. Previous studies on the alpha glucosidase inhibitory property of X. aethiopica ethanol and aqueous extracts showed that the plant had considerable activity with IC50 value of 892.44 ± 37.60 and 1243.67 ± 42.60 µg/mL. 37 However, D1, D2 and D3 elicited better inhibitory potential than the extracts due to their purification from the pool of phytochemicals present in the extracts. Furthermore, the results obtained in this study showed that the phytochemicals elicited better IC50 values compared to jaceosidin (0.78 mg/mL) isolated from Wedelia chinensis. 39
Enzyme Kinetic Studies of the Kaurane Diterpenes

Mode of Inhibition of α-Amylase by D1(a) Michaelis-Menten Plot and (b) Lineweaver-Burk Plot

Mode of Inhibition of α-Amylase by D2 (a) Michaelis-Menten Plot and (b) Lineweaver-Burk Plot

Mode of Inhibition of α-Amylase by D3 (a) Michaelis-Menten Plot and (b) Lineweaver-Burk Plot
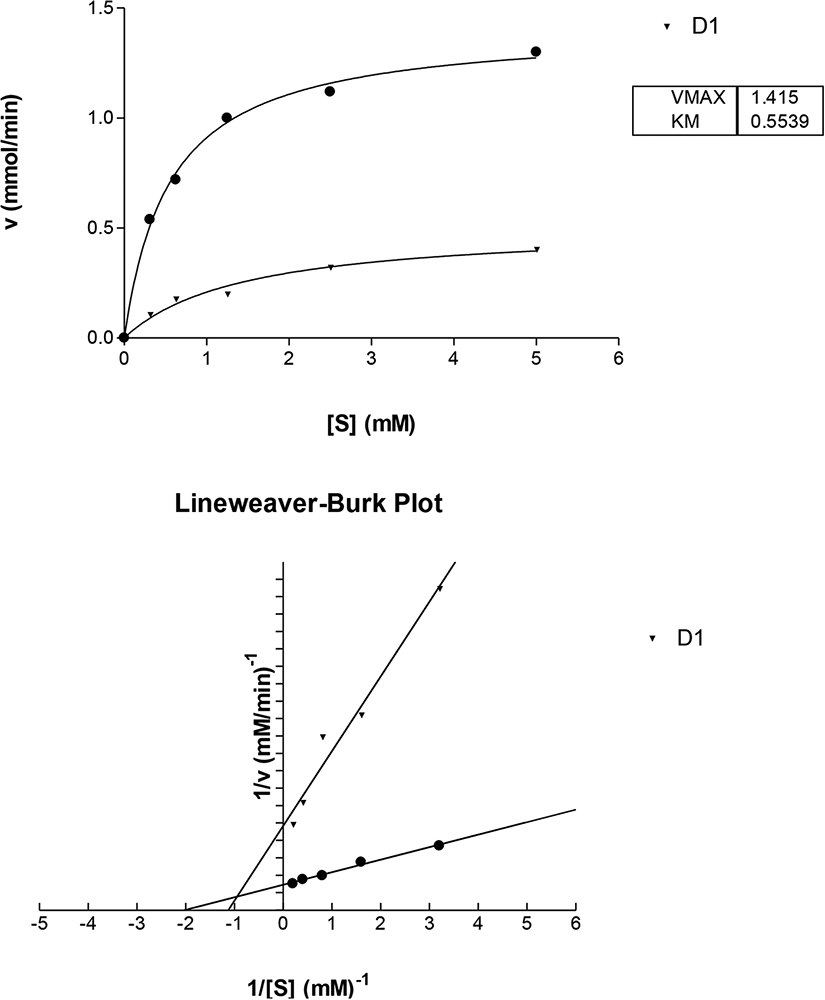
Mode of Inhibition of α-Glucosidase by D1 (a) Michaelis-Menten Plot and (b) Lineweaver-Burk Plot

Mode of Inhibition of α-Glucosidase by D2 (a) Michaelis-Menten Plot and (b) Lineweaver-Burk Plot

Mode of Inhibition of α-Glucosidase by D3 (a) Michaelis-Menten Plot and (b) Lineweaver-Burk Plot
The decrease in velocity observed in the Michealis-Menten plot of both α-amylase and α-glucosidase indicates that the D1, D2, D3 decreased the enzyme activity. This further suggests that the compounds are inhibitors of alpha amylase and alpha glucosidase.
In both alpha amylase and alpha glucosidase inhibition study, D1 and D2 show competitive type of inhibition. The Lineweaver-Burk plot and the kinetic parameters obtained, indicates that Vmax of the 2 compounds and the no inhibitor remains approximately the same while the Km of the compounds (D1 and D2) increased. This is a characteristic of competitive inhibition. The standard drug, acarbose, is a competitive inhibitor of α- amylase and α-glucosidase. Competitive inhibitors are effective because they are structural analogues of the substrate and thus can bind to the active site of the enzyme. When they bind, they form an EI complex instead of ES complex, which prevents the enzyme from acting on its substrate (starch) and thus prevents it breakdown to smaller molecules and ultimately prevents the breakdown to glucose.43,44
The Lineweaver-Burk plot for D3 shows non-competitive type of inhibition in alpha amylase inhibition study. Which means that the D3 inhibitor binds to the alpha amylase enzyme at a site that is distinct from the substrate binding site; therefore, it can bind to both the free enzyme and the enzyme–substrate complex. Also, the binding of this inhibitor (D3) has no effect on the substrate binding, and vice versa. Because the inhibitor does not interfere with the formation of enzyme-substrate ES, non-competitive inhibition cannot be reversed by increasing the substrate concentration. 45
However, D3 shows uncompetitive inhibition for α-glucosidase study. This implies that D3 inhibitor does not bind to the free enzyme; instead, it binds reversibly to the enzyme–substrate complex to yield an inactive ESI Complex. Again, because the inhibitor does not interfere with the formation of ES, uncompetitive inhibition cannot be reversed by increasing the substrate concentration. 42
Analysis of Molecular Docking of Kaurane—Type Diterpenes Against α-Amylase and α-Glucosidase
The molecular docking method adopted for the study was validated and the RMSD value between the co-crystallized and re-docked ligand was less than 2 indicating the docking procedure adopted for the study is reproducible.
The previously isolated kaurane-type diterpenes were docked into the active site of the α-amylase enzyme and their binding energies were ranked in comparism with that of acarbose (standard drug). All the diterpenes elicited considerably better binding affinity than that of acarbose (7.1 kcal/mol) (Table 3).
Interaction Analysis of D1, D2 and D3 Against α-Amylase Enzyme.

Interaction analysis of D3, D2 and D1 against α-glucosidase enzyme.

The best kaurane-type diterpene selected is D3 with a binding energy of −8.8 kcal/mol. An oxygen atom on the D3 moiety established hydrogen bonding interaction with Thr163 at a bond distance of 2.44 Å. It further participated in four hydrophobic interactions with Trp58, Trp59, Tyr62 and Leu165, while pi-interactions were established between D3 and Trp58, Trp59 and Tyr62 (Figure 2A)

Interaction diagram of D3 (A), D2 (B) and D1 (C) against α-amylase enzyme.
The second best ligand identified against α-amylase receptor is D2 with a binding energy of −8.7 kcal/mol. It established hydrophobic interactions with Trp58, Trp59, Tyr62, Leu162 and Leu165 (Figure 2B). The phytochemical also formed pi-interactions with Trp58, Trp59 and Tyr62. However, the ligand did not form hydrogen bonding interaction with the amino acid residues at the active site of the enzyme.
The third best binder against α-amylase enzyme was D1 with binding energy of −8.6 kcal/mol. The ligand participated in hydrophobic interactions with Trp59, Tyr62, Leu162, Leu165 and Ala198. It was further stabilized at the binding pocket of the receptor by forming pi-interactions with Trp59 and Tyr62. No hydrogen bonding interaction was observed between D1 and the α-amylase receptor (Figure 2C).
The inhibitory property of the ligands against α-glucosidase was studied and the results are presented in Tables 2 and 4 . The binding energy obtained for acarbose (−6.1 kcal/mol) was set as the cut-off point to select phytochemicals identified as the best binder against α-glucosidase enzyme.
The best kaurane-type diterpene selected against the receptor is D3 at −6.7 kcal/mol. The phytochemical participated in both hydrophobic and pi-interactions with Phe450 and Lys480. However, no hydrogen bonding interaction was formed between the ligand and the amino acid residues at the binding pocket of α-glucosidase (Figure 3A).

Interaction diagram of D3 (A), D2 (B) and D1 (C) against α-glucosidase enzyme.
The second best binder selected against the α-glucosidase enzyme was D2 with a binding energy of −6.8 kcal/mol. The hydrogen and oxygen atoms on the kaurene-type diterpene participated in hydrogen bonding interaction with Asp203 at 2.41 Å and Thr205 at 2.61 Å. Furthermore, the ligand was stabilized during the docking study by forming hydrophobic and pi-interactions with Trp406, Lys480, Phe575 and Lys480, Phe575 (Figure 3B).
A binding energy of −7.0 kcal/mol was obtained for D1 which was selected as the best binder against the enzyme. A hydrogen atom on the ligand formed one hydrogen bonding interaction with Asp203 at a bond distance of 1.92 Å. The kaurane-type diterpene was stabilized at the binding pocket of α-glucosidase by forming hydrophobic and pi-interactions with Trp40, Phe57 and Tyr60 (Figure 3C).
The inhibition of α-amylase and α-glucosidase enzymes remains a major strategy to manage diabetes due to the possibility of postprandial hyperglycaemia reduction in diabetic subjects. The top-ranked kaurane-diterpenes selected in this study elicited good binding energy that position them as promising α-amylase and α-glucosidase inhibitors. The ligands established key interactions like hydrogen bonding, hydrophobic and pi-interactions which are known to contribute to their stability during inhibition of the enzymes. 33 The presence of the functional groups such as carboxylic acid, allyl and hydroxyl groups are known to enhance the inhibitory property of phytochemicals against α-amylase and α-glucosidase.34,35 The hydroxyl group on D1, carboxylic acid group on D2 and ester functional group on D3 moiety contributed to the good binding energy and may as well influence their activity when assays with in vitro method. All the three top-ranked phytochemical elicited better binding energy than oleanolic acid (−0.9 and −1.2 kcal/mol) isolated from X. aethiopica and docked against α-amylase and α-glucosidase enzymes. 36 Hence, D3, D2 and D1 may be among the phytochemicals responsible for the α-amylase and α-glucosidase inhibitory property of X. aethiopica.
MD Simulations and MM-PBSA Calculations
The results of MD simulations of α-amylase complexes showed that the root mean square deviations in the backbone atoms of apo α-amylase is considerably higher than other α-amylase complexes (Figure 4A). The RMSD in the backbone atoms of α-amylase complexes with D2 is lowest with an average of around 0.125 nm, while with D1 is almost stable with an average of around 1.3 nm. The RMSD in backbone atoms of α-amylase with cocrystal ligand remained stable until 60 ns and rose beyond 0.15 nm thereafter until the end of simulation. The complex with D3 showed larger magnitude of deviations after around 60 ns until the end of simulation. On the other hand, the RMSD in ligand atoms showed that D3 had the lowest RMSD (Figure 4B). The RMSD in D2 atoms was quite stable throughout the simulation. D1 atoms showed deviations of magnitude of 0.05 nm intermittently during the simulation. The cocrystal ligand showed considerable deviations reaching beyond 0.2 nm throughout the simulation duration. The RMSF analysis showed that the major fluctuations in the residues in the range 100 to 200 for all the complexes (Figure 4C). However, apo α-amylase and the α-amylase complex with D2 showed more fluctuations compared to other complexes. The measurement of radius of gyration provides the information about the compactness of the systems. The Rg of α-amylase complex with D1 is more stable than the other complexes with reasonably stable Rg with an average of 2.25 nm. The Rg of α-amylase complex with cocrystal ligand is higher signifying major conformational changes in the α-amylase. Compared to the apo α-amylase the Rg of complexes with D2 and D3 also showed the reasonable stability and compact structures of α-amylase. The measurement of SASA provides the information of solvent exposed surface of protein and lower the SASA less is the solvent exposed surface and more is the stability of protein. The apo α-amylase showed high SASA, while the α-amylase complexes with D1, D2, D3, and cocrystal ligand showed lower SASA, signifying better stabilization in presence of these ligands.
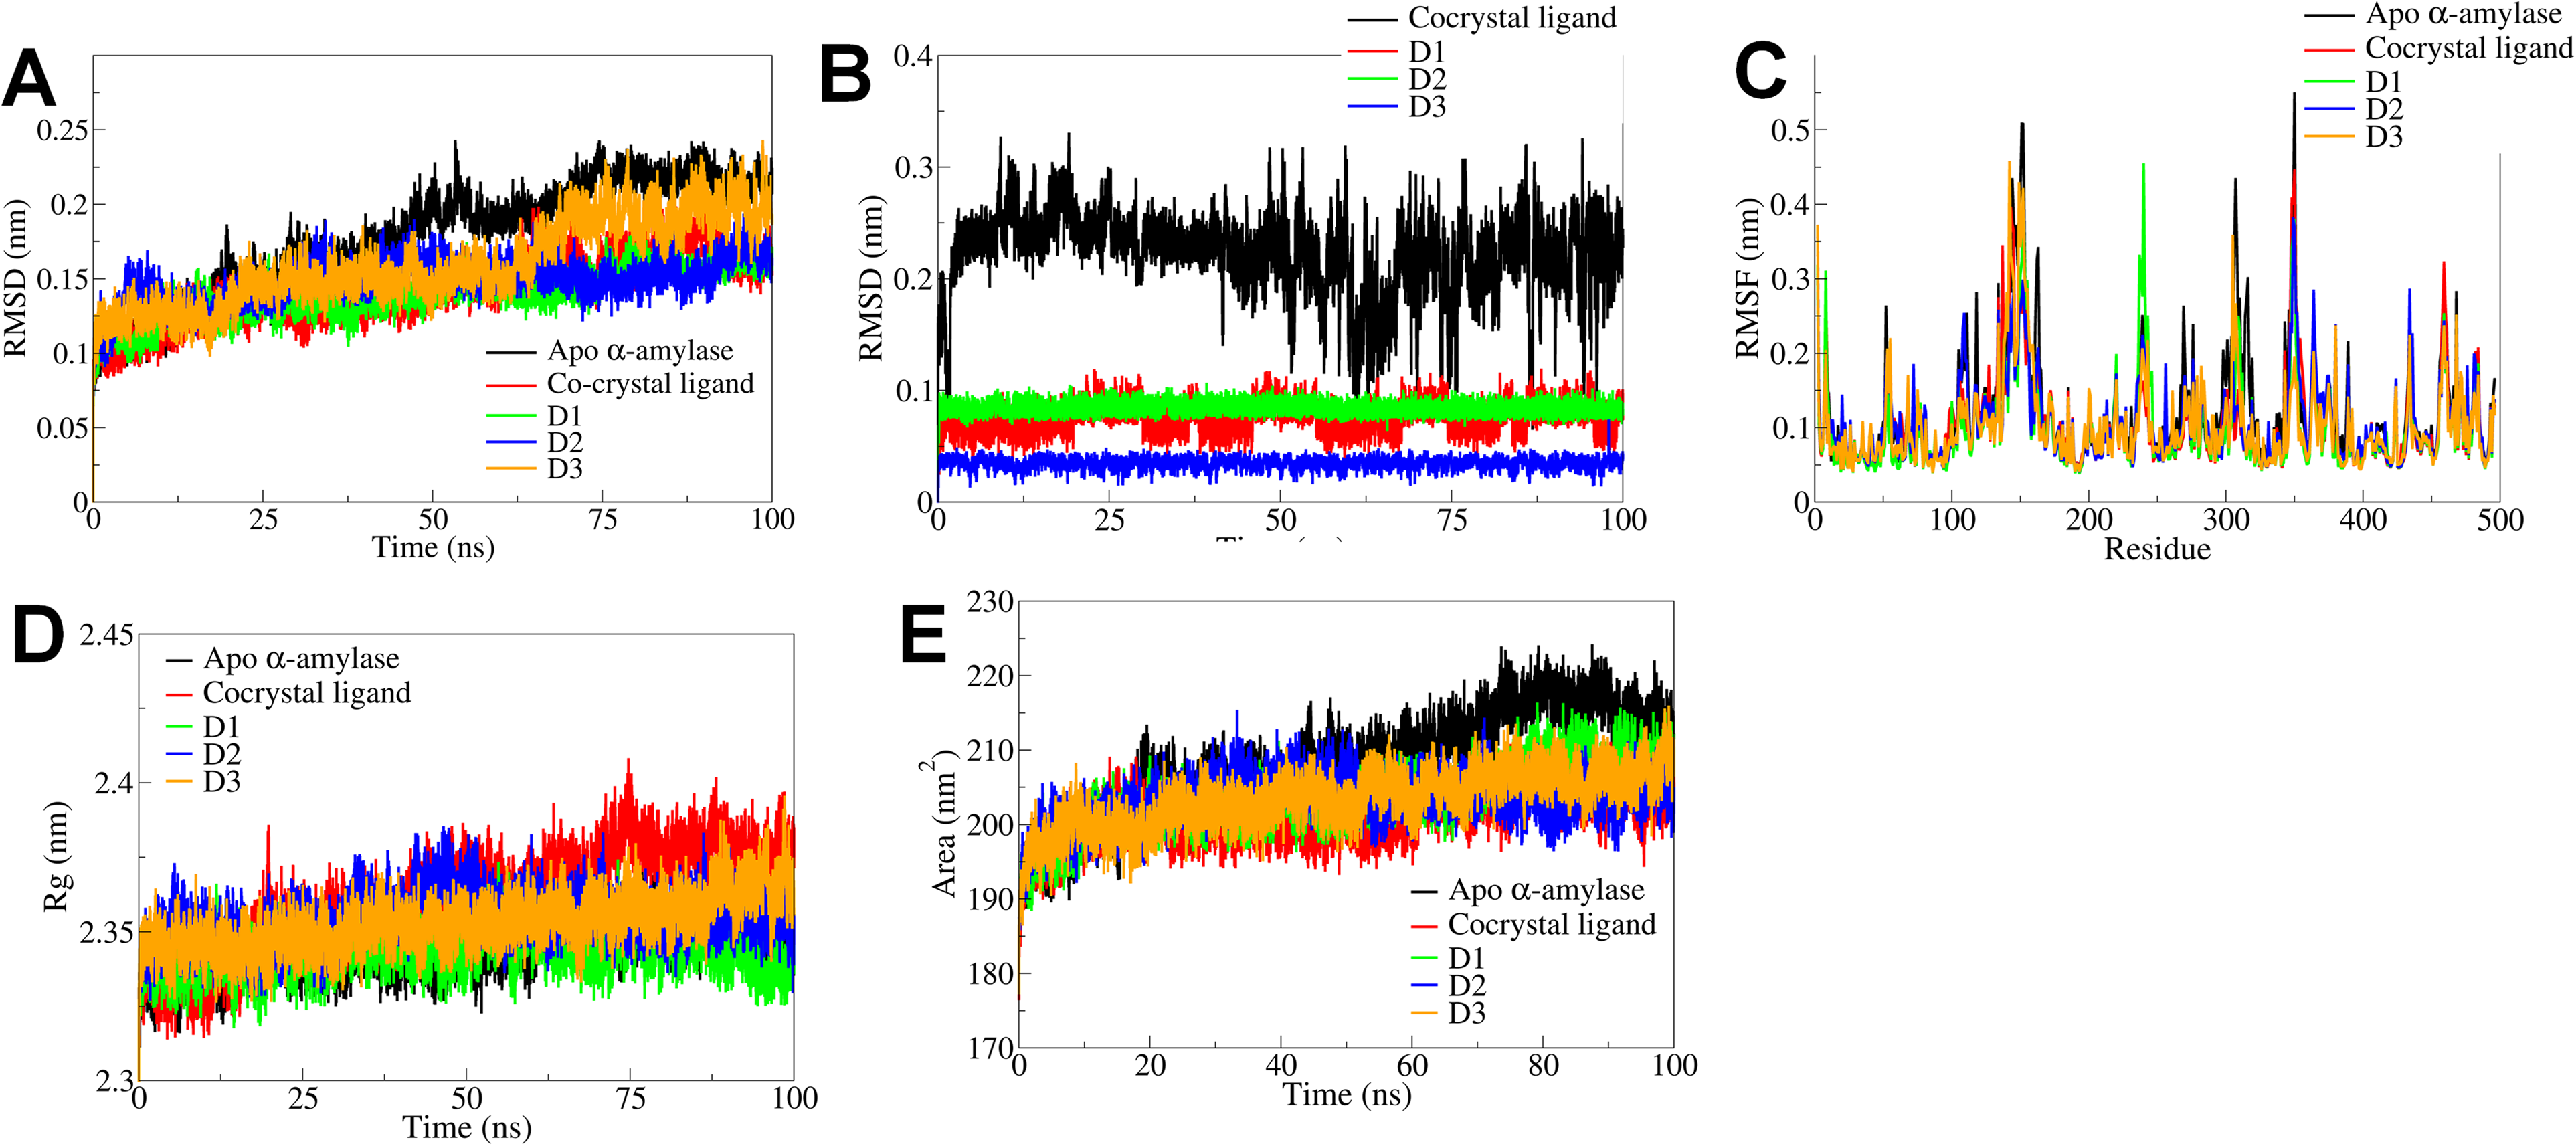
RMSD, RMSF, Rg, and SASA analysis for α-amylase complexes and apo α-amylase.
The RMSD in backbone atoms of α-glucosidase in complex with D3 was lowest with an average of around 0.125 nm, while with D2 was highest with an average of 0.175 nm (Figure 5A). The RMSD in backbone atoms of α-glucosidase complexes with D1 is reasonably stable throughout

RMSD, RMSF, Rg, and SASA analysis for α-glucosidase complexes and apo α-glucosidase.
the simulation. The complex with crystal ligand showed slightly high deviations than compared to apo α-glucosidase and complexes with D1 and D3. The RMSD in ligand atoms clearly showed that the ligands D1, D2, and D3 remained stable throughout the simulation, while the co-crystallized ligand atoms deviated considerably from the initial conformation (Figure 5B). The RMSF analysis suggested that the ligands D1 and D2 caused the major fluctuations in the α-glucosidase residues, compared to the apo α-glucosidase and α-glucosidase complexes with cocrystal ligand and D3 (Figure 5C). These fluctuations might have arisen due to the adaptation of the ligands in the binding pockets. The Rg analysis suggest that the α-glucosidase complex with cocrystal ligand is most stable and compact (Figure 5D). The α-glucosidase complexes with D1 and D3 also showed reasonable stability with lower Rg. The apo α-glucosidase and α-glucosidase complex with D2 showed slightly higher Rg indicating major conformational changes in these structures. On the other hand, the α-glucosidase complex with D3 showed lowest SASA, while complex with cocrystal ligand showed high SASA indicating that D3 stabilizing the α-glucosidase. The complexes with D1 and D2 showed slightly higher SASA than D1 which might be due to the conformational changes in the α-glucosidase while these ligands bind at the binding pocket.
In the case of hydrogen bond analysis of α-amylase complexes maximum number of consistent hydrogen bonds was formed between the cocrystal ligand and α-amylase (Figure 6). Particularly, the equilibrated trajectory showed five hydrogen bonds between cocrystal ligand and α-amylase residues Glu233, Arg195, Thr163, Asp300, and Gly104 (Figure 7A). The trajectory at 25 ns showed hydrogen bonds with Asp356, Asp197, and Gln63 residue, while trajectory at 50 ns showed hydrogen bonds with Asp197 and Asp300. The tractory at 75 ns showed hydrogen bonds with Asp300, Gln63, and Asn105, while the trajectory at 100 ns showed hydrogen bonds with Asp300, Gln63, and Asn105. Most of the residues formed stable and consistant hydrogen bonds with cocrystal ligand.

Hydrogen bond analysis for α-amylase complexes.
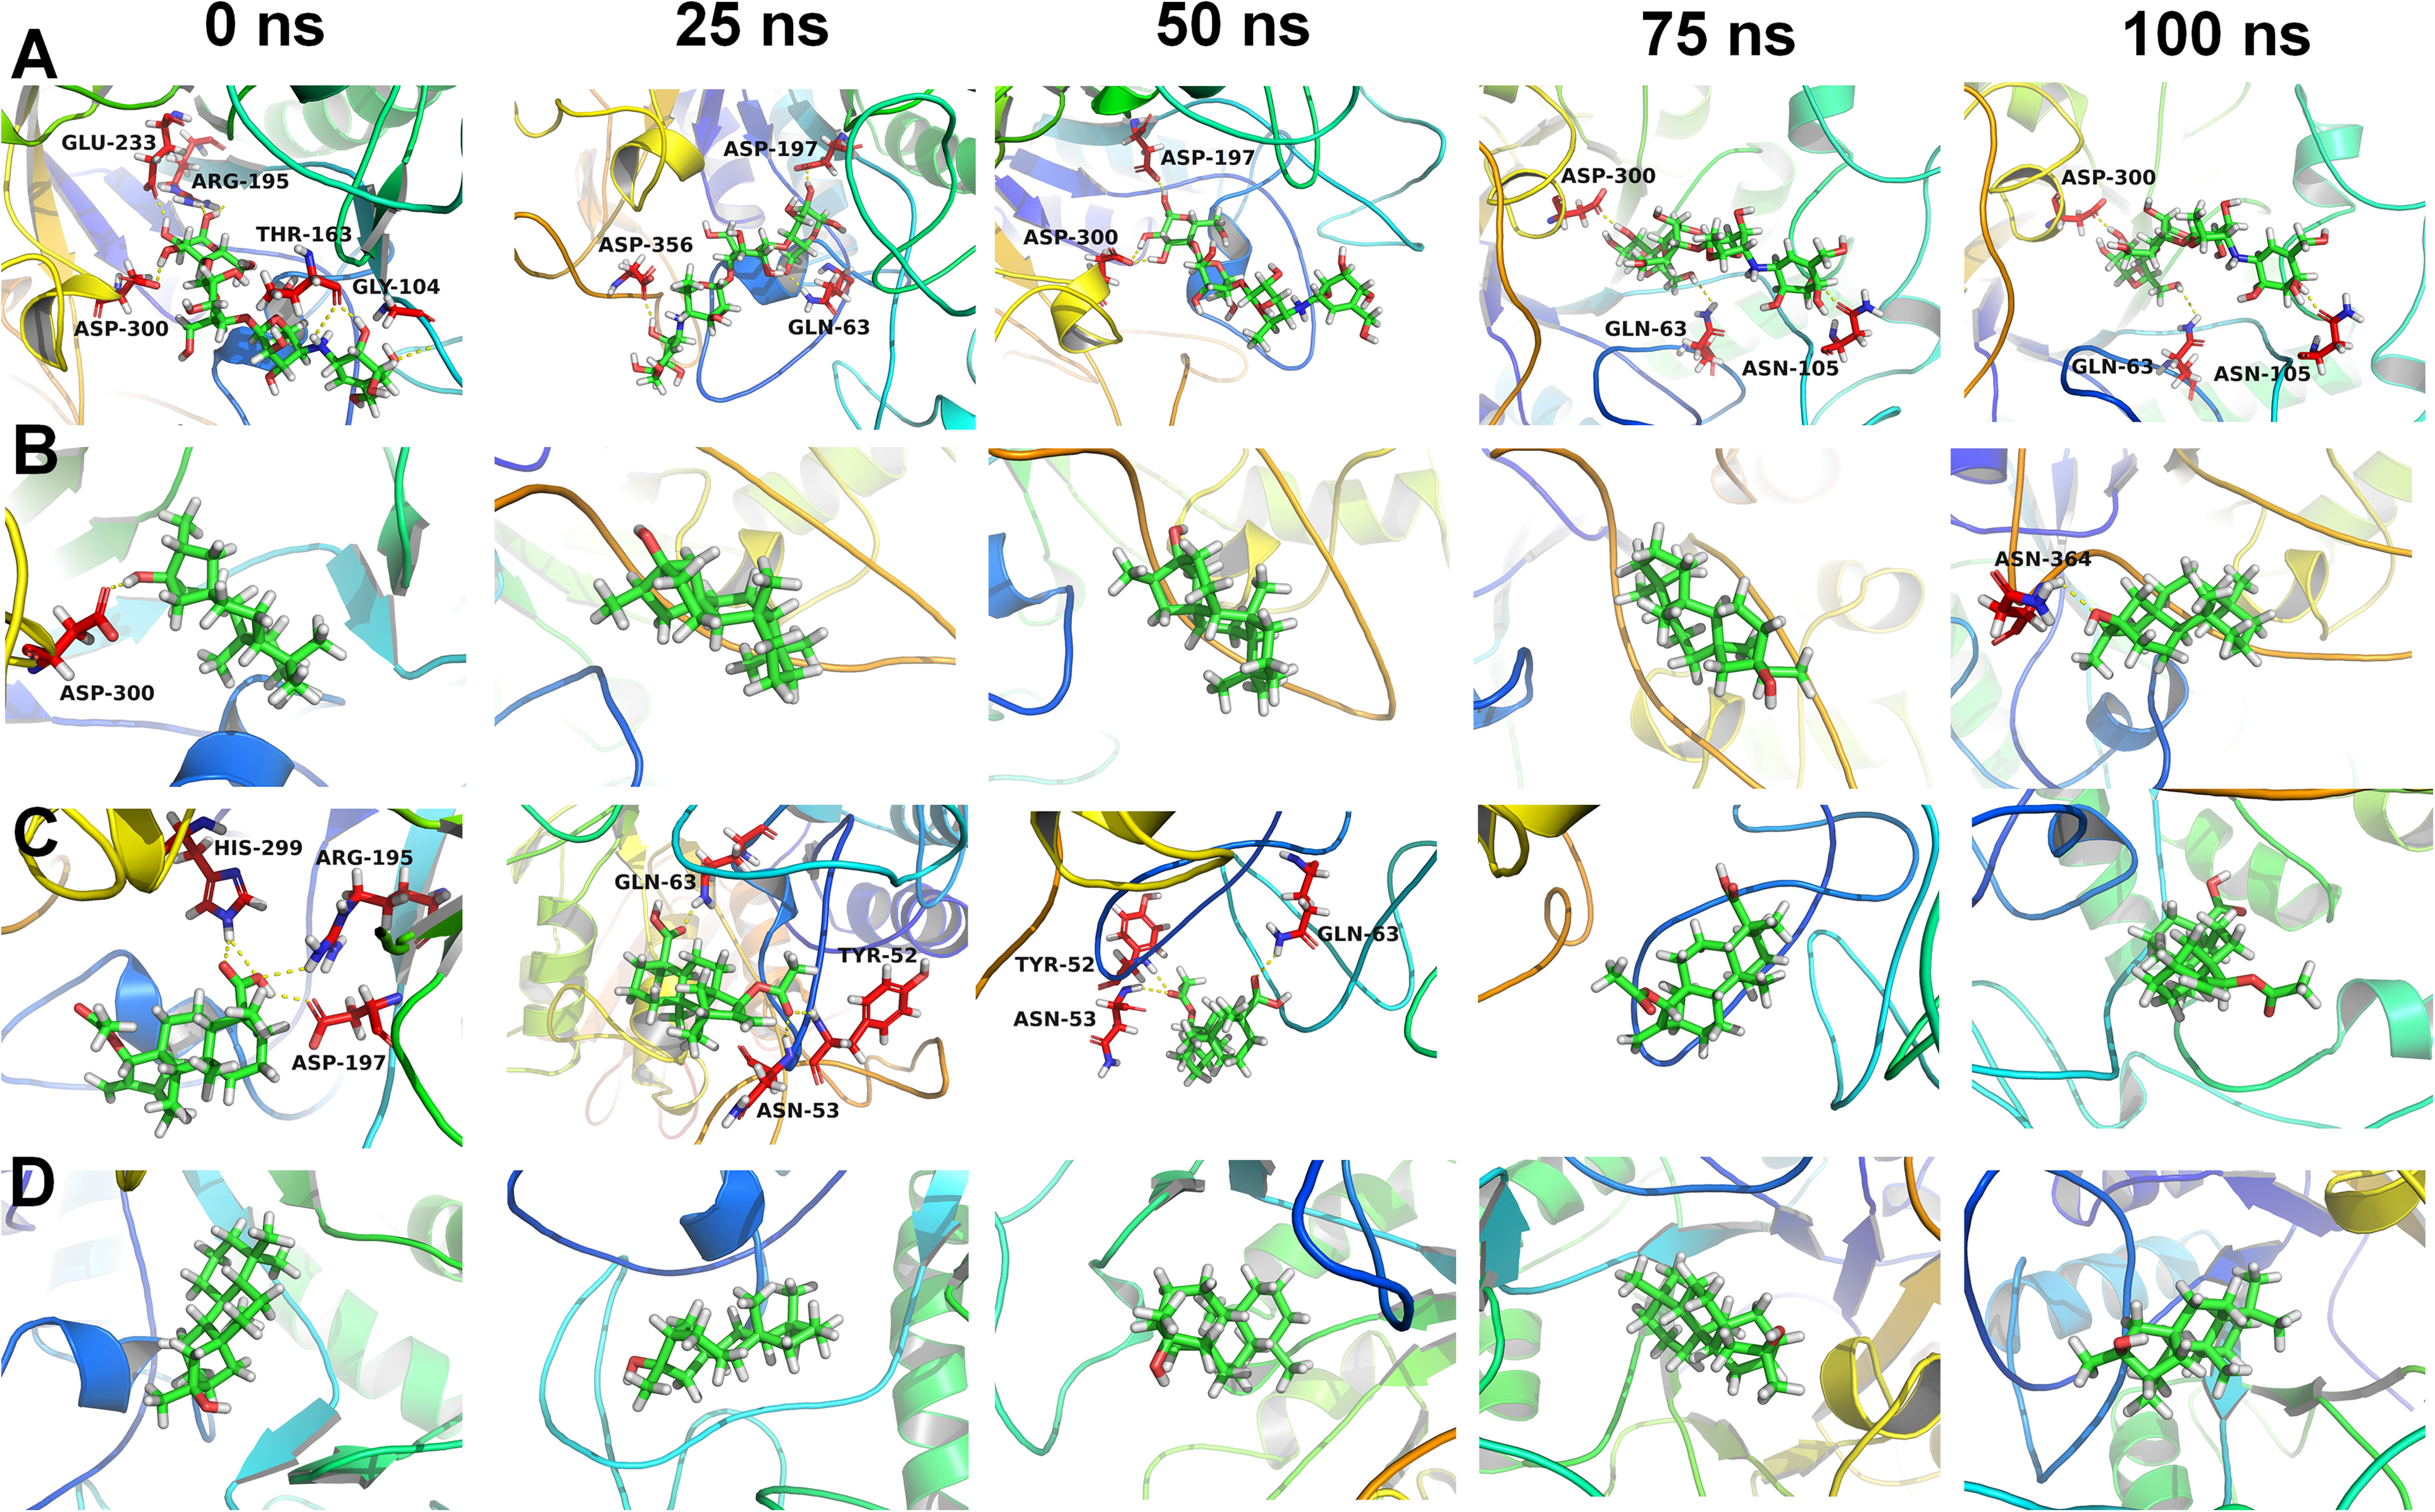
Analysis of trajectories extracted at different time steps for the α-amylase complexes with A) cocrystal ligand, B) D1, C) D2, and D) D3.
In the case of compound D1 around two hydrogen bonds were formed out of which one hydrogen bond was formed consistently throughout the simulation period. The equilibrated trajectory of compound D1 showed a hydrogen bond with residue Asp300 and the 100 ns trajectory showed a hydrogen bond with Asn364, while the trajectories at 25, 50, 75 ns simulation time step showed no hydrogen bond (Figure 7B). In the case of compound D2, around 4 hydrogen bonds were formed until the 50 ns simulation period and during subsequent MD simulation period only one hydrogen bond was seen formed occasionally. The equilibrated trajectory of compound D2 showed the hydrogen bond with His299, Arg195, Asp197. The 25 ns and 50 ns trajectories showed hydrogen bonds with Gln63, Asn53, and Tyr52 residues, while no hydrogen bonds were seen at other time steps. In the case of compound D3 very occasional hydrogen bond was formed and no hydrogen bonds were seen in the extracted trajectories at specific time intervals. The number of hydrogen bond donor and acceptor in the compounds D1, D2, and D3 might have resulted in less frequent hydrogen bonds. However, the hydrophobic interactions may have resulted in stable conformations of these compounds at the binding site.
In the case of α-glucosidase complexes the results of hydrogen bond analysis showed that cocrystal ligand formed more number of hydrogen bonds compared to D1, D2, and D3 ligands (Figure 8). The equilibrated trajectory of α-glucosidase complex with cocrystal ligand showed seven hydrogen bonds with residues Arg526, Trp406, Asp203, Asp542, Glu333, and Gly408 residues (Figure 9A). The 25 ns trajectory showed a hydrogen bond with Asp443, while 50 ns trajectory showed hydrogen bonds with Trp406 and Asp366. No hydrogen bond was formed in a trajectory at 75 ns whereas the last trajectory at 100 ns showed hydrogen bonds with Glu300 and Gln603 residues. In the case of other ligands D1 and D2 showed hydrogen bonds only in the initial equilibrated trajectory, where D1 formed a hydrogen bond with Asp203, while D2 formed hydrogen bonds with residues Arg202 and Thr205 residues. D3 showed no hydrogen bond formations in the extracted trajectories. The results for α-glucosidase suggest that the ligands could not form the key hydrogen bonds with the binding site residues of α-glucosidase. The stabilization of α-glucosidase might be resulted due to other hydrophobic interactions arising out of the hydrophobic part of the ligand and hydrophobic residues at the binding site.

Hydrogen bond analysis for α-glucosidase complexes.

Analysis of trajectories extracted at different time steps for the α-glucosidase complexes with A) cocrystal ligand, B) D1, C) D2, and D) D3.
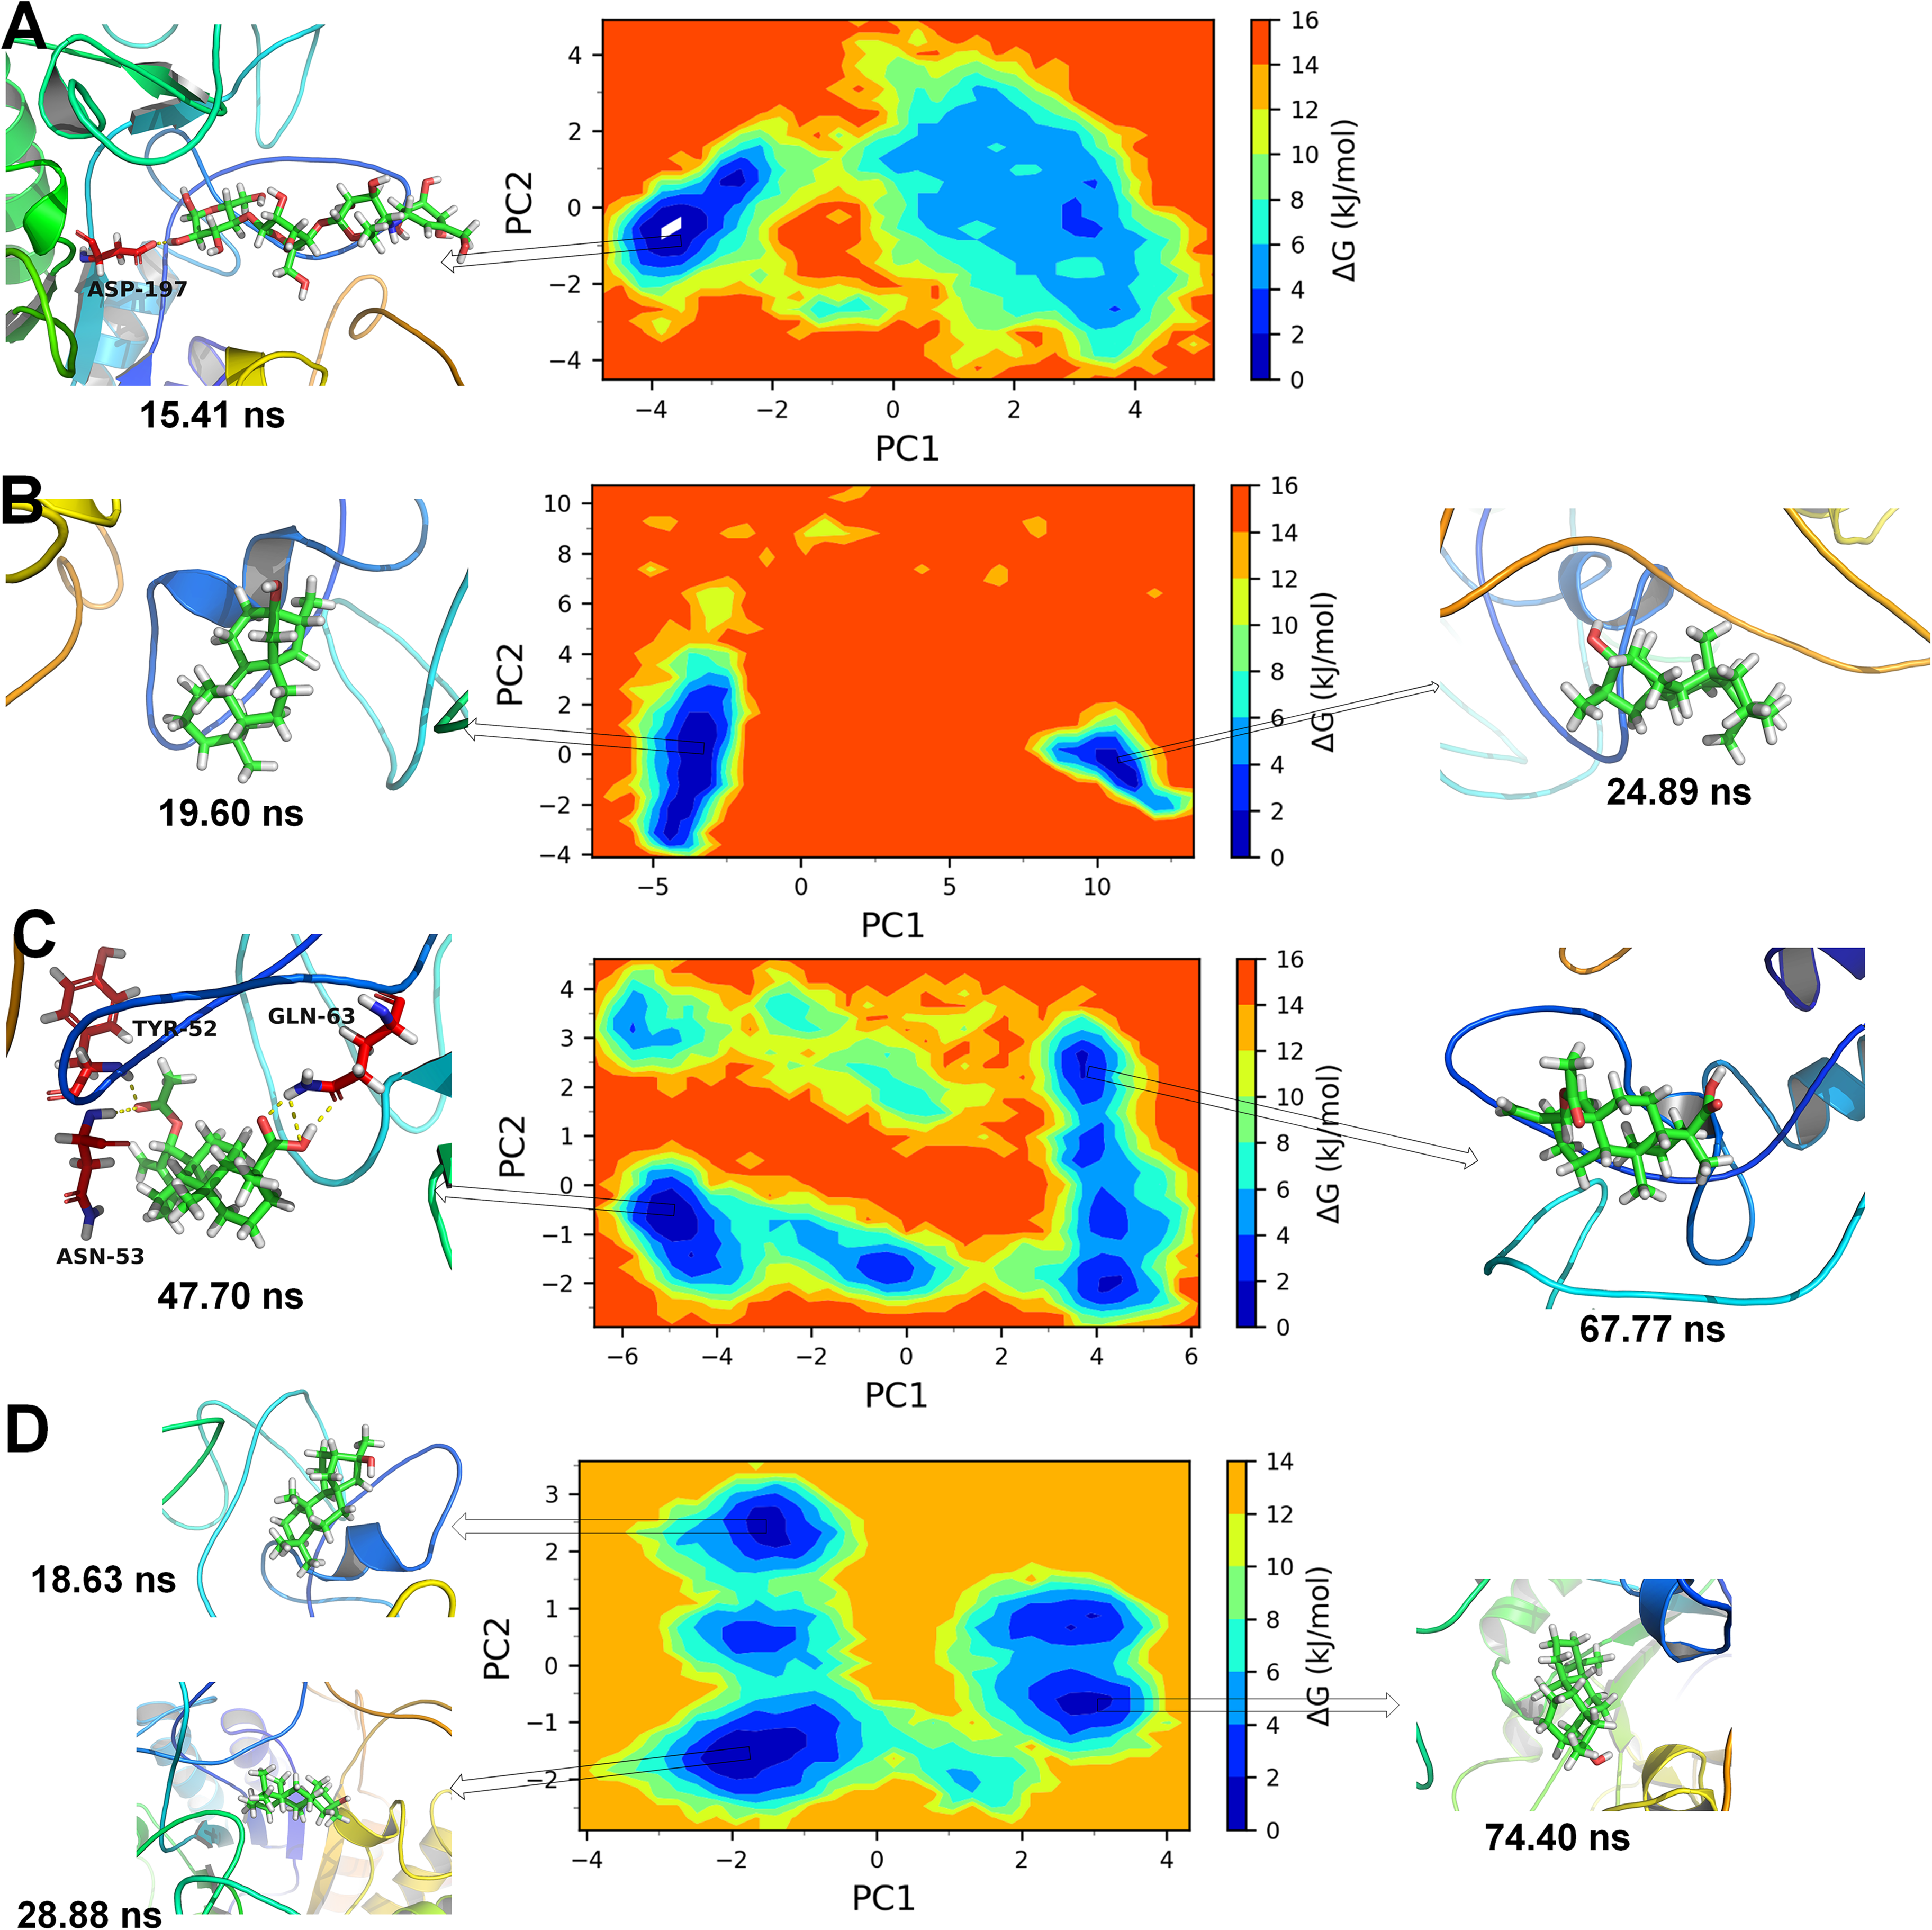
Gibb's free energy landscapes for α-amylase complexes of A) co-crystal ligand, B) D1, C) D2, and D) D3.
The results of PCA analysis and Gibb's free energy surfaces analysis for α-amylase complexes showed that the complex with cocrystal ligand exist in a metastable conformation in a unique energy basin with coefficients between −3.8 to −4.1 on PC1 and 0 to −1.9 on PC2 (Figure 9A). The representative conformations from this energy basin showed that the cocrystal ligand with hydrogen bond with Asp197 represented the metastable lowest energy conformation. The complex with compound D1 gave rise to two metastable ensembles where the larger energy basin with coefficients between −4.5 to −5 on PC1 and −4 to 2 on PC2 represented a unique conformation of D1 at 19.60 ns (Figure 9B). While, the smaller energy basin with coefficients 10 to 11 on PC1 and 0 to −2 on PC2 represented another unique lowest energy conformational state of α-amylase complex with D1. However, none of the conformations from these two metastable ensembles showed any hydrogen bonds between D1 and α-amylase. The complex of α-amylase with D2 showed three lowest energy basin along with few more intermediate energy basins (Figure 9C). The larger energy basin with coefficients −4.5 to −5.5 on PC1 and 0 to 1 on PC2 showed a unique low energy metastable conformation having hydrogen bonds with Tyr52, Gln63, and Asn53 residues. Another smaller energy basin (as shown in Figure 9C) showed no hydrogen bonds between D2 and α-amylase in the lowest energy conformation. The α-amylase complex with D3 showed three distinct low energy basins (Figure 9D). The representative metastable conformations from the larger energy basin at 28.88 ns, the intermediate size energy basin at 18.63 ns and smaller energy basin at 74.40 ns showed no hydrogen bonds (Figure 10).
The PCA and Gibb's free energy surfaces analysis for α-glucosidase complexes showed that the complex with cocrystal exist in two quinque conformations in low energy basins (Figure 11A). While, very few conformations of complexes of D1, D2, and D3 with α-glucosidase were found occupying the lowest energy basins. None of the metastable conformations found to form any hydrogen bonds with α-glucosidase, including the cocrystal ligand. Overall, the results of Gibb's free energy analysis suggested that the compounds D1, D2, and D3 have better binding affinity with α-amylase than the α-glucosidase.

Gibb's free energy landscapes for α-glucosidase complexes of A) co-crystal ligand, B) D1, C) D2, and D) D3.
The results of MM-PBSA calculations performed on α-amylase complexes showed that the compound D3 has highest binding affinity in terms of ΔTOTAL of −16.78 kcal/mol (Table 5). Comparably, compound D2 also has good binding affinity with ΔTOTAL of −16.26 kcal/mol. Compound D1 has less binding affinity than the cocrystal ligand where the ΔTOTAL for compound was −13.16 kcal/mol, while the ΔTOTAL for cocrystal ligand was −14.85 kcal/mol, which is higher than compound D2 and D3. The better binding affinity of compound D3 is due to the lower total van der Waals energy and slightly higher polar solvation energy, compared to compound D1 and D2. The cocrystal ligand on the other hand has significantly lower total electrostatic energies and high polar solvation energies, which resulted in slightly higher total binding energy of −14.85 kcal/mol.
MM-PBSA calculations for α-amylase complexes.
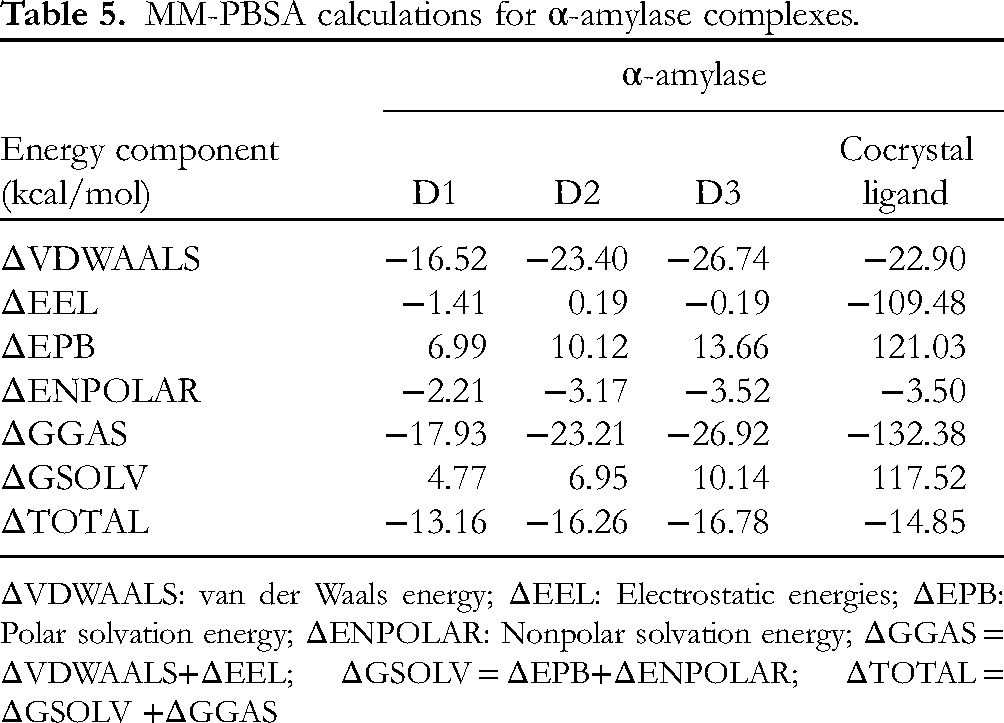
ΔVDWAALS: van der Waals energy; ΔEEL: Electrostatic energies; ΔEPB: Polar solvation energy; ΔENPOLAR: Nonpolar solvation energy; ΔGGAS = ΔVDWAALS+ΔEEL; ΔGSOLV = ΔEPB+ΔENPOLAR; ΔTOTAL = ΔGSOLV +ΔGGAS
The results of MM-PBSA calculations for α-glucosidase complexes clearly indicated that compound D1, D2, and D3 has higher binding free energies compared to the cocrystal ligand (Table 6). The cocrystal ligand has binding free energy of −14.18 kcal/mol, which might be due to very low total electrostatic energy contributions and significantly higher polar solvation energy contribution. Among compound D1, D2, and D3, compound D3 showed reasonably good binding free energy with ΔTOTAL of −8.47 kcal/mol, while compound D1 showed ΔTOTAL of −2.26 kcal/mol. Compound D2 has highest binding free energy with ΔTOTAL of −0.46 kcal/mol, which suggest its poor binding affinity.
MM-PBSA calculations for α-glucosidase complexes.

The results of MM-PBSA calculations indicated that the compounds D1, D2, and D3 have favorable binding affinities for α-amylase, while only compound D3 have favorable binding affinity for α-glucosidase.
ADMET Studies
A suitable pharmacokinetic profile of chemical compounds positions them as potential antidiabetic agent. The adsoption, metabolism and toxicity profile of phytochemicals identified from virtual screening can be used to extrapolate their drug-likeness property. In this study, the solubility, blood brain barrier (BBB) permeability, HAI, HOB, hepatotoxicity, oral acute toxicity and carcinogenicity profile of the kaurane-type diterpenes were examined and presented in Table 7.
ADMET Properties of Selected Kaurane-Type Diterpenes.
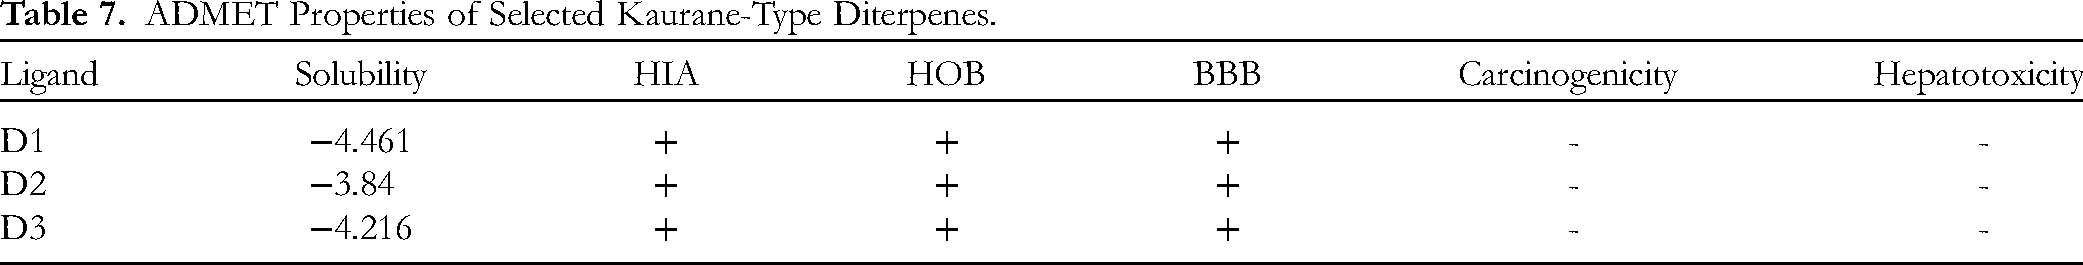
Solubility, HOB and HAI property of a drug candidate plays a crucial role on its extent of absorption into the metabolic pathway of a diabetic subject while the BBB permeability property gives information on the possible passage of the phytochemical through the blood-brain barrier layer.39,40 The hepatotoxicity, carcinogenicity and oral acute toxicity property of chemical compounds elucidates their safety when administered as antidiabetic agents. 41 All the selected molecules have solubility values within the acceptable range of −6.0 to 0.5. Hence, they can be categorized as phytochemicals with good solubility property. Also, the compounds showed excellent HAI property and are able to cross the BBB layer, indicating that they can be useful in CNS drug development. In terms of toxicity, all the kaurane-type diterpenes are non-carcinogenic, non-toxic to the liver and are safe when administered as α-amylase and α-glucosidase inhibitors.
Conclusion
The study evaluated the alpha amylase and alpha glucosidase inhibitory potential of kaurane diterpenoids previously isolated from the fruit of X. aethiopica in vitro and in silico. The in vitro studies showed that D3 elicited the best inhibitory property against the diabetes enzymes compared to other studied phytochemicals. However, the IC50 value of the best inhibitor was higher than that of acarbose. The molecular docking studies identified D1, D2 and D3 as the probable inhibitor of alpha amylase and alpha glucosidase and also gave useful information on their interactions with the residues of the enzymes. The MD studies showed that the compounds have favorable binding affinities compared to the cocrystal acarbose for α-amylase, while compound D3 having favorable binding affinity for α-gluocosidase. Also, the ADMET properties of the studied diterpenes showed the exhibit good druggable properties and could act as a potential inhibitor against alpha amylase and alpha glucosidase enzymes. The results of MD simulations and MM-PBSA calculations support the in vitro studies.
Supplemental Material
sj-docx-1-npx-10.1177_1934578X241283555 - Supplemental material for Kaurane Diterpenoids from Xylopia aethiopica Inhibits Alpha-Amylase and Alpha-Glucosidase: A Combined in Silico and in Vitro Approach
Supplemental material, sj-docx-1-npx-10.1177_1934578X241283555 for Kaurane Diterpenoids from Xylopia aethiopica Inhibits Alpha-Amylase and Alpha-Glucosidase: A Combined in Silico and in Vitro Approach by Funmilayo G. Famuyiwa, Rajesh B. Patil, Samson O. Famuyiwa, Idowu J. Olawuni, Uduak I. Olayemi, Ibukun O. Oyeleke, Iyanu O. Awotuya, Jaiprakash N. Sangshetti, Esther O. Shalom and Kolade O. Faloye in Natural Product Communications
Footnotes
CRediT Authorship Contribution Statement
Declaration of Conflicting Interests
The authors declared no potential conflicts of interest with respect to the research, authorship, and/or publication of this article.
Ethical Approval
Not applicable.
Funding
The authors received no financial support for the research, authorship, and/or publication of this article.
Statement of Human and Animal Rights
Not applicable.
Statement of Informed Consent
There are no human subjects in this article and informed consent is not applicable.
Supplemental Material
Supplemental material for this article is available online.
References
Supplementary Material
Please find the following supplemental material available below.
For Open Access articles published under a Creative Commons License, all supplemental material carries the same license as the article it is associated with.
For non-Open Access articles published, all supplemental material carries a non-exclusive license, and permission requests for re-use of supplemental material or any part of supplemental material shall be sent directly to the copyright owner as specified in the copyright notice associated with the article.