
Abstract
The resin purification condition of polysaccharides from Amomum tsaoko Crevost et Lemarie (ATPs) was optimized using response surface method (RSM) and analytic hierarchy process (AHP): elution volume of 2 BV, flow rate of 2 BV/h, sample concentration of 2 mg/mL, sample volume of 0.4 BV, the comprehensive score of actual purification effect was 73.45 ± 0.32% (n = 3). Then, a homogenous polysaccharide (ATP-1-1) was isolated by DEAE-52 cellulose and Sephadex G-200 column. The structure of ATP-1-1 was characterized by the Fourier transform infrared spectroscopy, high-performance liquid chromatography, high-performance gel permeation chromatography, Congo red test, scanning electron microscopy, and thermogravimetric analysis, which showed that ATP-1-1 was composed of mannose, rhamnose, glucose, galactose, and arabinose in a molar ratio of 1.3:1.0:6.2:4.8:1.1 with molecular weight of 845.21 kDa, and had a triple-helix conformation, blocky microstructure, and good thermal stability. The evaluation of anti-complementary activity showed that ATP-1-1 possessed stronger anticomplementary activity than positive drug, significantly inhibited complement activation through both classical (CH50 = 6.28 ± 0.23 μg/mL) and alternative pathways (AP50 = 45.33 ± 0.16 μg/mL), and interacted with C2, C4, and factor B components in the activation cascade of the complement system.
Introduction
Amomum tsaoko Crevost & Lemarié is a perennial herb that belongs to the Zingiberaceae family, which is distributed in the tropical and subtropical regions of Asia. 1 The dried fruits of A. tsaoko serve as a traditional Chinese spice and food condiment, offering unique special spicy that enhance food aroma and stimulate appetite in Chinese folk cuisine. 2 Additionally, it is recognized as a “medicine-food homology” in the traditional Chinese medicine and is extensively used to treat malaria, diarrhea, abdominal pain, vomiting, and stomach disease. 3 Studies have demonstrated that A. tsaoko fruits exhibit multiple pharmacological activities, such as anti-tumor, anti-inflammatory, and anti-microbial activities.4–6 Also, the fruits of A. tsaoko contain various chemical constituents, including polysaccharides, flavonoids, fatty acids, polyphenols, and sterols.7–9 Among these, polysaccharides with diverse pharmacological effects are essential components of A. tsaoko fruits, while proteins and pigments in polysaccharides from plant fruits severely restricted their application and development. Therefore, developing purification techniques for polysaccharides are crucial for in-depth studies. 10 Several purification methods exist for removing proteins and pigments from polysaccharides, including macroporous resin, activated carbon adsorption, hydrogen peroxide, Sevag, and trichloroacetic acid method.11–14 Macroporous resin is a widely used and effective purification method commonly used for polysaccharides, offering simultaneous deproteinization and decolorization capabilities. 15 Nonetheless, there have been no reports on the resin purification process of polysaccharides from A. tsaoko fruits (ATPs), and their isolation, characterization, and biological activity.
Since multiple purification metrics need to be considered simultaneously in optimization of resin purification process of polysaccharides, including polysaccharides recovery, deproteinization, and decolorization rates, this can be treated as a multi-criteria decision-making problem. The analytic hierarchy process (AHP) is a modeling technique that addresses complex multi-criteria decision-making issues using numerical scale measurement, pairwise comparisons, and hierarchical structure construction.16,17 Concurrently, the response surface method (RSM) is a statistical technique for process design, optimization, and analysis that establishes a functional relationship between factors and response values through multiple quadratic regression equation to determine the optimal process parameters, and provide the interaction of relevant variables in the optimization process. 18 Hence, the combination of RSM and AHP offers a reliable and effective strategy for optimizing purification processes.
The complement system is a crucial component of the innate immune defense. To avoid damage to host tissues, cell surface regulators tightly control the complement system, maintaining homeostasis in the body. An unregulated complement system can lead to excessive inflammation 19 and various diseases, such as complement-mediated immune complex diseases, 20 neurodegenerative diseases, 21 and cancer. 22 Recently, researchers have discovered numerous anti-complement active substances from natural products, which have emerged as important sources for developing new complement inhibitors due to their high efficiency, low toxicity, and minimal side effects. Notably, natural polysaccharides with potent anti-complementary activity have been reported in multiple studies, demonstrating the advantages of multi-targeting, multi-pathway, and long-lasting effects.23–25
In this study, the ATPs purification process was optimized using RSM combined with AHP. Subsequently, the novel ATP-1-1 was isolated by DEAE-52 cellulose and Sephadex G-100 column chromatography, and its structural characteristics were investigated using various analytical techniques (Fourier transform infrared spectroscopy [FT-IR], high-performance liquid chromatography [HPLC], high-performance gel permeation chromatography [HPGPC], scanning electron microscopy [SEM], and thermogravimetric analysis [TGA]). Furthermore, the anticomplement activity and its action complement components were also determined in vitro. This research establishes a theoretical foundation for the further development and utilization of ATPs resources.
Materials and Methods
Materials and Chemicals
The dried fruits of Amomum tsaoko Crevost et Lemaire were purchased from Bozhou traditional Chinese medicine trading center (Anhui, China), and authenticated by Prof. Gao Li. The voucher specimen (voucher number: YB-AT-202009) has been deposited at Yanbian University. Different types of macroporous adsorption resins were purchased from Tianjin Yunkai Resin Technology Co., Ltd (Tianjin, China).
Extraction of Polysaccharides
The crude polysaccharides from A. tsaoko fruits (ATPs) were extracted by water extraction and alcohol precipitation. The A. tsaoko fruits were crushed by the pulverizer, and sifted through a 20-mesh sieve. Subsequently, the powder samples were refluxed by hot water under the conditions of liquid to material ratio of 30 mL/g, extraction time of 90 min, and temperature of 85 °C. The extraction solution was concentrated, the precipitate was obtained by adjusting the ethanol to a final concentration of 85% ethanol. The precipitates were collected by centrifugation (4000 rpm, 10 min), dialyzed (cut-off Mw 8000-14 000 Da) and freeze-dried to obtain crude ATPs.
Purification and Optimization of Polysaccharides
Selection of the Optimal Resin
The optimal resin was selected from 8 different styles of resins (S-8, AB-8, NKA-II, D101, X-5, YKDH-5, YKDH-6, and YKDH-9) by static adsorption method.
26
The crude ATPs solution (2 mg/mL, 20 mL) was added to the resin (3 g) and shaken at 35 °C for 30 min in a constant temperature shaker, and the adsorption solution was collected after filtration. The distilled water was added to the resin again for desorption and shaking for 30 min, and the desorbed solution was collected. The content of polysaccharides in crude polysaccharides solution, adsorption solution, and desorption solution were determined by phenol-sulfuric acid method,
27
respectively. Further, the adsorption capacity (Ac), adsorption rate (Ae), and desorption rate (De) of different types of resins were calculated according to the following formulas:


Establishment of Analytic Hierarchy Process
The purification of ATPs is a multicriteria decision-making problem that was analyzed by AHP.
15
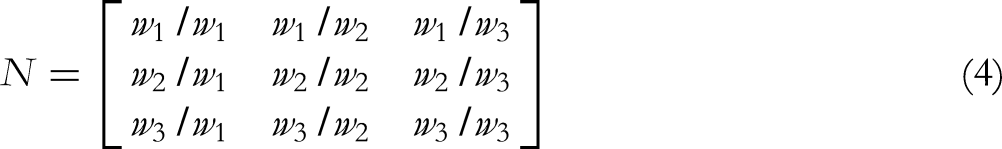
The hierarchical structure was established with the comprehensive score of purification effect as the decision goal, and the polysaccharides recovery rate (Pr), deproteinization rate (Dp), and decolorization rate (Dc) as the criteria. Then, the judgment matrix was constructed by the congruence matrix. The priority weights of Pr, Dp, and Dc were set as w1, w2, and w3 respectively, and the pairwise comparison between them was based on the 9 scale evaluation rule (Table S1). The comparison matrix formula (N) was as follows:


Dynamic Adsorption Purification of Polysaccharides
The purification of crude ATPs was carried out by dynamic adsorption method. The crude polysaccharides were dissolved in distilled water, and the solution was dropped into a resin column, and eluted with distilled water. The purification conditions of single factor test were set as elution volume (1, 2, 3, 4, and 5 BV) and flow rate (1, 2, 3, 4, and 5 BV/h), crude polysaccharides concentration (1, 2, 3, 4, and 5 mg/mL) and sample volume (0.2, 0.3, 0.4, 0.5, 0.6, and 0.7 BV). The content of polysaccharides and proteins were determined by phenol-sulfuric acid and Bradford method, respectively, and Pr and Dp were calculated. The Dc was calculated by the absorbance value at 420 nm.
26
Lastly, the comprehensive score of purification performance was calculated based on the priority weight values.


Experimental Design of Response Surface Methodology
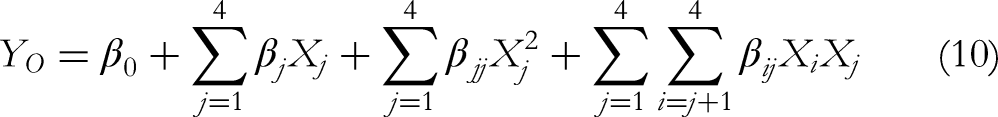
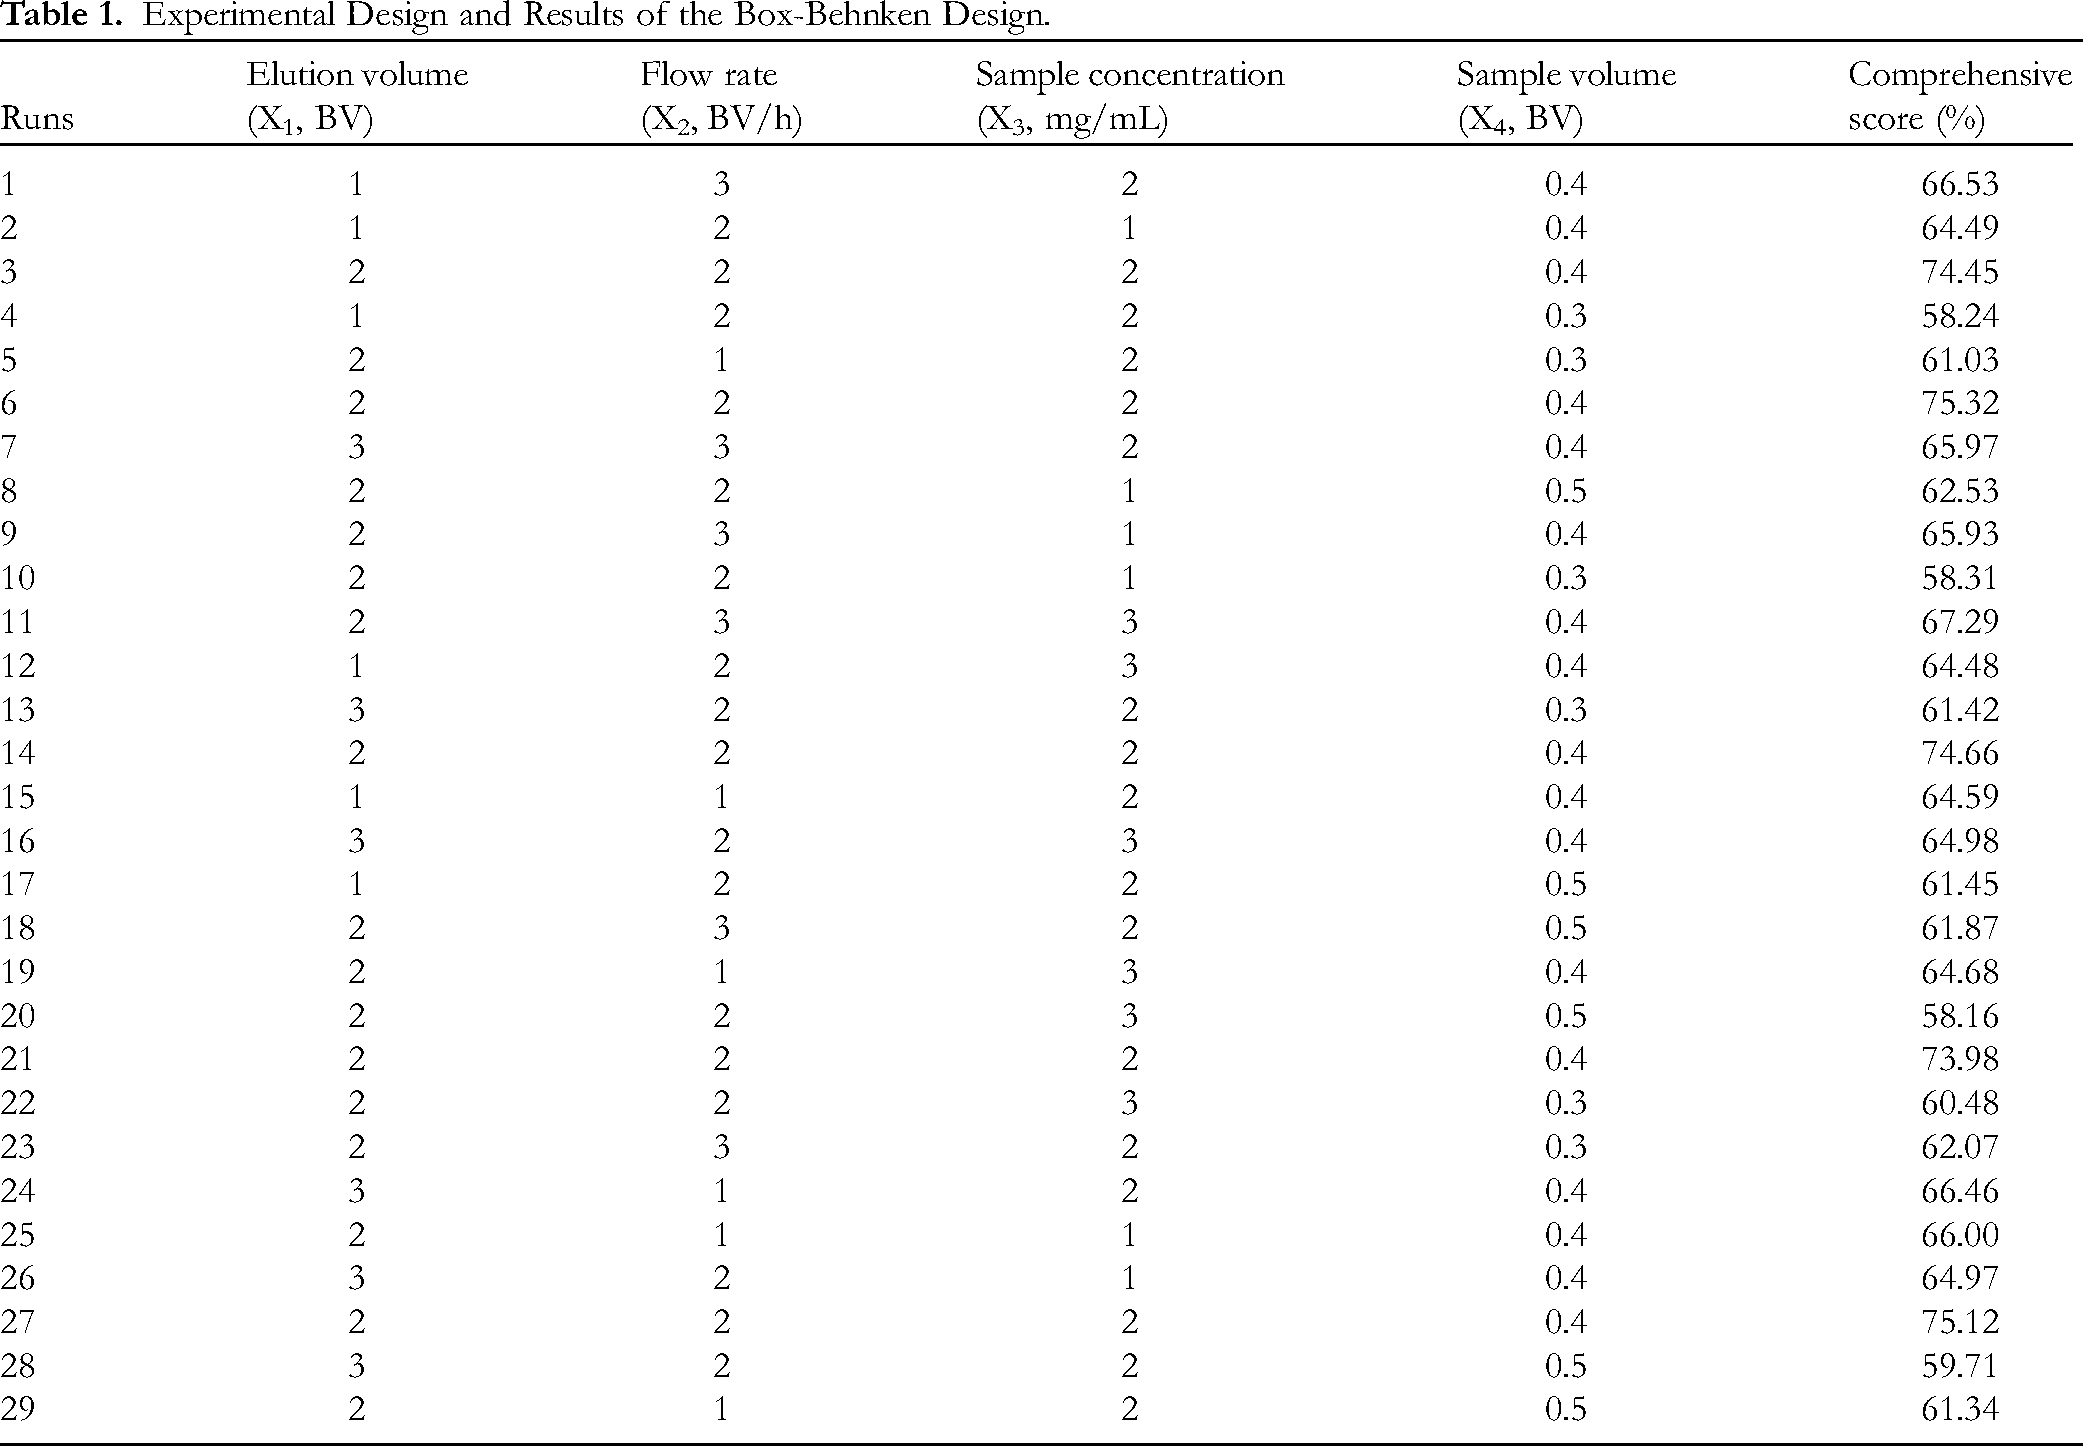
According to the single factor test results, 4 factors and 3 levels are established, and then the response surface optimization model was designed using Box-Behnken design (BBD) with 29 runs (Table 1). These 4 factors were set as X1 (elution volume, BV), X2 (flow rate, BV/h), X3 (sample concentration, mg/mL), and X4 (sample volume, BV) respectively, and the response value (Y) was taken as the comprehensive score of purification effect. The experimental results were fitted to the quadratic polynomial model as follows:
Experimental Design and Results of the Box-Behnken Design.
Where Xi and Xj denote the different independent variables. Y0 is the predicted response value. β0, βj, βjj, and βij indicate the regression coefficients corresponding to the intercept, linearity, square, and interaction, respectively.
Isolation of Polysaccharides
The purified ATPs were eluted with a flow rate of 1 mL/min in distilled water using a DEAE-52 cellulose column (2.6 cm × 30 cm). The eluent were collected (5 mL/tube), and monitored by the phenol-sulfuric acid method at 490 nm. The samples were combined according to the peak position of elution curve, and dialyzed (cut-off Mw 3500 Da) and lyophilized. Subsequently, the samples were further purified on a Sephadex G-200 column (1.5 cm × 60 cm), and eluted with ultrapure water at a flow rate of 0.3 mL/min (5 mL/tube), and samples were collected according to the peak position, centrifuged, and lyophilized to obtain pure polysaccharide.
Characterization of Polysaccharides
Physicochemical Properties
The total sugar and protein contents of the purified polysaccharide fractions were determined by the methods as described above (phenol-sulfuric acid and Bradford method). The galacturonic acid was used as the standard, and the m-hydroxydiphenyl method was used to determine the uronic acid content. 29
Fourier Infrared Spectroscopy
The dried sample (2 mg) was mixed with KBr powder (100 mg) into transparent flake, and recorded on a Nicolet iS20 FT-IR measurement (Thermo Electron Corporation, Massachusetts, USA) in the frequency of 4000 to 400 cm−1.
Molecular Weight and Monosaccharide Composition
The molecular weight of polysaccharides was determined by HPGPC with reference to our previous reported method. 26 The data of sample solution were recorded using a liquid phase system (LC-20AD, Shimadzu, Japan) equipped with a refractive index detector (RID-20A, Shimadzu, Japan) and a Shodex sugar KS-804 column (7 µm, 8.0 mm × 300 mm, Shodex, Japan) at 40 °C. The mobile phase was ultrapure water with a flow rate of 1 mL/min, and the injection volume was 50 μL. Data acquisition and analysis were carried out using LabSolutions GPC. Dextrans of different molecular weights were used to establish a standard curve.
The monosaccharide composition of polysaccharides was determined by 1-phenyl-3-methyl-5-pyrazalone (PMP) pre-column derivatization method. 26 The PMP-labeled monosaccharide derivatives were prepared by sequentially adding PMP, NaOH, and HCl solutions, and were injected into a Supersil ODS2 column (5 μm, 4.6 mm × 250 mm). The 11 standard monosaccharides with different concentrations were used to draw standard curves, and the data were recorded using HPLC equipped with 1410 UV Detector (Hitachi, Japan). Similarly, the polysaccharides were hydrolyzed through trifluoroacetic acid, and further derivatized and analyzed in accordance with the above steps. The conditions of liquid chromatography were consistent with our previous study.
Congo Red Test
The Congo red test was used to determine the triple-helix conformation of polysaccharides according to a previous report. 30 The sample solution (2 mg/mL) was mixed with an equal volume of Congo red solution (50 μmol/L), and then the maximum absorption wavelength (λmax) of the polysaccharide Congo red complex was measured at different alkaline concentrations.
Thermogravimetric Analysis
The thermal stability of polysaccharides was detected using a TGA (TG 209 F1 Libra, NETZSCH-Gerätebau GmbH, Germany) at a heating rate of 20 °C/min and a flow rate of N2 of 20 mL/min. The detection temperature range was 30 to 800 °C.
Scanning Electron Microscopy
Take the polysaccharide sample powder and place it on a metal plate sample table with an electrical adhesive. Blow off the floating sample and spray gold. The microstructure of the polysaccharide was determined by SEM (Gemini SEM 360, ZEISS, Germany).
Anticomplementary Activity Evaluation In Vitro
The anticomplementary activity was evaluated using the method reported in our previous study. 31 Accurately weigh the polysaccharide sample to be tested, and prepare it with GVB-Ca2+/Mg2+ buffer solution into different concentration gradients (3.90-2000 μg/mL) and incubated in a water bath at 37 °C for 30 min with 1:60 normal human serum pool (NHSP), followed by adding sensitized sheep red blood cells (EAs, 2 × 10⁹ cells/mL) were incubated in a water bath at 37 °C for 30 min (mixed evenly every 10 min), and centrifuged. The absorbance value of supernatant was measured at 540 nm using an enzyme marker. The half hemolysis inhibition concentration was calculated under the classical pathway (CH50). Similarly, the anticomplement activity under the alternate pathway was tested using GVB-Mg2+/EGTA buffer solution as a solvent to prepare gradient polysaccharide solutions of different concentrations. The sample solution was incubated with 1:10 NHSP in a water bath at 37 °C for 15 min, and then rabbit red blood cells (ERs, 5 × 10⁸ cells/mL) were added to continue incubating for 30 min. After incubation on ice for 5 min, the reaction was terminated, and centrifuged for 3 min in a high-speed freezing centrifuge (2000 rpm, 4 °C). Then, 30 μL supernatant was added to a 96-well plate, and 270 µL buffer was added to each well for dilution. The hemolysis rate was calculated based on the absorbance value measured at 412 nm, and the half hemolysis inhibition concentration (AP50) was obtained. The sample control group, complement group, and total hemolysis group were set up for the experiment, with heparin as the positive control.
The sample concentration close to 100% hemolysis inhibition rate was chosen as the threshold concentration for the active complement component. NHSP was mixed with sample solution, pre-incubated at 37 °C for 30 min, added complement-depleted serum (C2, C3, C4, C5, C9, Factor B, Factor D, and Factor P) with EAs/ERs and then continued to incubate in a water bath at 37 °C for 30 min, centrifuged for 10 min. The experiment was set up simultaneously with the depleted serum group, the complement component detection group, and the total hemolysis group, and the hemolysis rate was calculated by subtracting the absorbance value of the relevant control group. If the hemolysis could not be recovered in its detection group compared to the depleted serum group, the sample was considered to act on the complement-depleted component; otherwise, it was indicated that the sample did not act on the complement-depleted component.
Statistical Analysis
All data were presented as mean ± standard deviation. Statistical analyses were carried out using ANOVA as well as independent sample t-test by SPSS 19.0 and the results were considered statistically significant when P < .05.
Results and Discussion
Primary Screening of Resin
The optimal resin was screened by evaluating the properties of different types of resins. The results and comparison of adsorption capacity (Ac), adsorption rate (Ae), and desorption rate (De) of S-8, AB-8, NKA-II, D101, X-5, YKDH-5, YKDH-6, and YKDH-9 resins were shown in Table 2. The Ac of S-8, X-5, and YKDH-6 were 2.14 ± 0.13, 1.95 ± 0.12, and 2.04 ± 0.19 mg/g, respectively, which were significantly higher than those of the other resins (P < .05). Among them, the Ae of S-8 was 42.18 ± 2.12% significantly higher than that of X-5 and YKDH-6 (P < .05). Although the De of NKA-II (48.33 ± 1.34%) and YKDH-9 (44.52 ± 2.01%) were significantly higher than those of S-8 (35.74 ± 1.12%), the Ac and Ae of NKA-II and YKDH-9 were extremely low. As a polymeric sorbent polystyrene divinylbenzene (PS-DVB) copolymer with polar methylamine substituent, the polar substituent of the S-8 resin contributed to the reduction of the surface tension between the resin surface and the polysaccharides, thus the contact between them was increased, and the hydrophilicity of the resin also enhanced the Ac and Ae for ATPs.32,33 The particle size (0.3-1.25 mm) and specific surface area (0.3-1.25 m2/g) of S-8 resin were appropriate for the purification of polysaccharides. Therefore, it was concluded that S-8 is the optimal resin for the purification of ATPs based on a combination of considerations.
The Ac, Ae, and De of S-8, AB-8, NKA-II, D101, X-5, YKDH-5, YKDH-6, and YKDH-9.
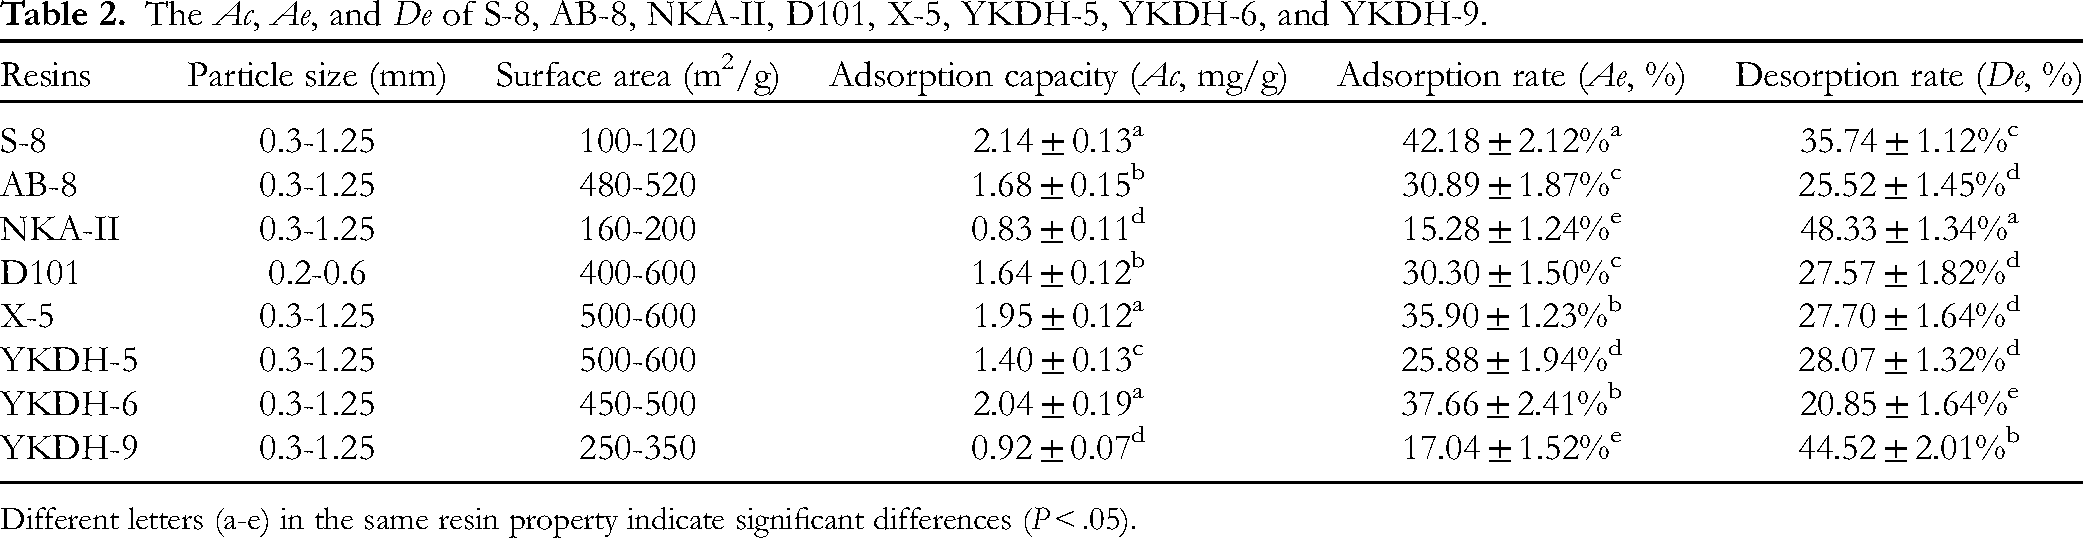
Different letters (a-e) in the same resin property indicate significant differences (P < .05).
Priority Weight of Decision Criteria
The priority weight values (w1, w2, and w3) of the decision criteria Pr, Dp, and Dc were calculated and obtained according to the following comparison matrix:
The maximum eigenvalue was 3.0059 and the CR = 0.0086 < 0.1, which suggested that the consistency test approved. The calculated initial weight coefficients were normalized to obtain the values of w1, w2, and w3 as 0.59, 0.28, and 0.13, respectively. Further, the comprehensive score of the ATPs purification effect can be calculated based on the weights of Pr, Dp, and Dc. The calculation formula was as follows: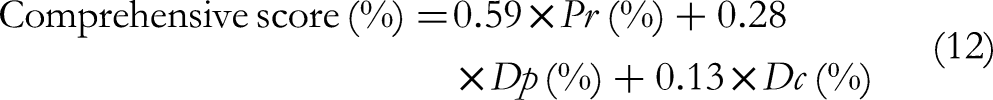
Optimization of Dynamic Adsorption Purification
Response Surface Analysis
Based on the results of single-factor experiment in Figure S1, elution volume of 1 to 3 BV, flow rate of 1 to 3 BV/h, sample concentration of 1 to 3 mg/mL, and sample volume of 0.3 to 0.5 BV were employed to further optimize the purification of ATPs via BBD. The results of the 29 runs were presented in Table 1 and analyzed by multiple nonlinear regression. The quadratic multiple regression equation between the 4 factors and the ATPs purification comprehensive score was calculated as follows:
ANOVA for Response Surface Quadratic Model.
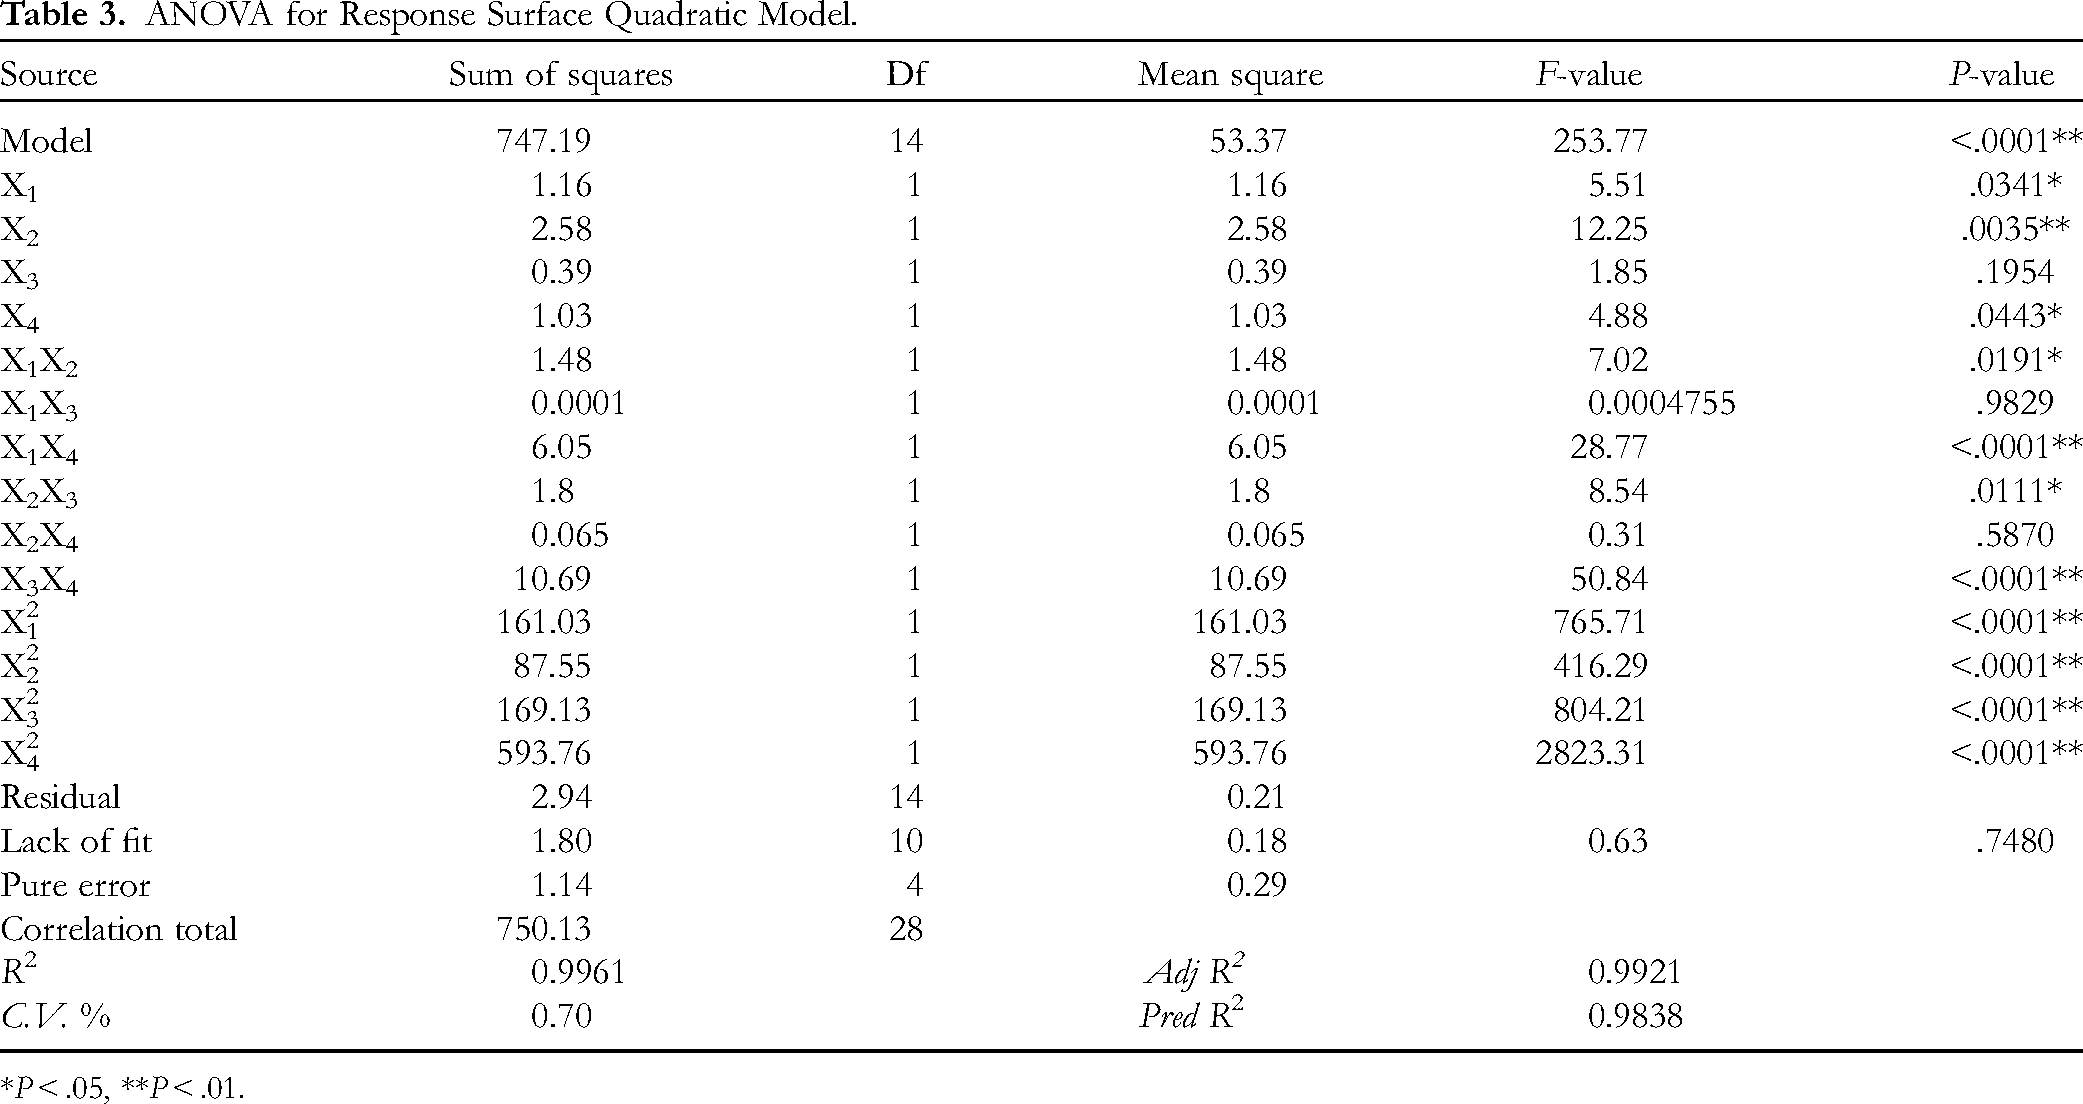
*P < .05, **P < .01.
The shapes and silhouettes of the 3-dimension (3D) response surface and 2-dimension (2D) contour plots were used to denote the variation in trend and significance of the interaction between the 2 test variables. 36 Figure 1A and G illustrated the interaction effect of elution volume and flow rate on the purification of ATPs when the sample concentration and sample volume were fixed at 0 level. The comprehensive score of purification effect increased with increased elution volume and flow rate in the range of 1 BV to 2 BV and 1 BV/h to 2 BV/h, respectively. However, the comprehensive score showed a gradual downward trend after reaching the maximum value, which was due to the fact that excessive elution volumes and fast flow rates were not favorable for protein and pigment adsorption. 15 As shown in Figure 1C and I, the interaction between elution volume and sample volume had a significant effect on ATPs purification. The sample volumes in the range of 0.3 to 0.4 BV exhibited a positive effect in the comprehensive score of the purification effect of ATPs, and the comprehensive score of purification decreased when the sample volume exceeded 0.4 BV, which was negatively influenced by the sample volume exceeding the maximum sample volume that the resin could handle. The conclusions from Figure 1D and J demonstrated that sample concentration and flow rate represented a significant effect on the purification of ATPs. The comprehensive score of purification reached to the highest when the sample concentration was 2 mg/mL, while the continued increase in sample concentration led to a significant decrease in purification. This phenomenon could be explained by the fact that a large number of impurities in a higher concentration of polysaccharides solution adsorb competitively with the polysaccharide on the resin. 37 Similarly, the interaction effect of sample concentration and sample volume on the purification of ATPs was significantly displayed in Figure 1F and L. However, the interaction surfaces of Figure 1B and E were tending to be planar and circular, which implied that the interactions between elution volume and sample concentration, and flow rate and sample volume could not contribute an obvious impact on the purification effect, and these results were consistent with ANOVA of the model.

The contour and 3-dimensional response surface plots of the effects of elution volume and flow rate (A, G), elution volume and sample concentration (B, H), elution volume and sample volume (C, I), elution flow rate and sample concentration (D, J), elution flow rate and sample volume (E, K), sample concentration and volume (F, L) on the purification of ATPs.
Validation of the Model
The desired purification conditions for maximum comprehensive score of ATPs were obtained as follows: elution volume 2.03 BV, flow rate 2.06 BV/h, sample concentration 1.98 mg/mL, sample volume of 0.4 BV, and the expected comprehensive score was 74.72%. Considering the feasibility of industrial production of polysaccharides purification, the parameters were adjusted as follows: elution volume 2 BV, flow rate 2 BV/h, sample concentration of 2 mg/mL, sample volume of 0.4 BV. Under these conditions, the Pr, Dp, and Dc were 69.4 ± 0.92%, 78.21 ± 1.12%, and 81.6 ± 1.71%, respectively, the comprehensive score of actual purification effect was 73.45 ± 0.32% (n = 3), which was close to the predicted value. The polysaccharides content of crude and purified ATPs was 26.73 ± 1.52% and 70.48 ± 2.36%, respectively, and the yield of purified ATPs was 26.31± 0.41%, which demonstrated that the purity of ATPs was significantly improved by the purification of this process. In comparison with previously reported studies on the purification of polysaccharides using resin,15,26,38 the present study allowed simultaneous deproteinization and decolorization of polysaccharides, and the optimal parameter of sample volume under this process was also determined with good Pr, Dp, and Dc of polysaccharides, which suggested that the dynamic adsorption purification process of S-8 resin obtained in this study was an effective purification technique for ATPs.
Isolation of Polysaccharides
The purified ATPs were fractionated on a DEAE-52 cellulose column, and the curve eluted by deionized water was performed in Figure 2A, ATP-1 was obtained by merging and collecting 3 to 25 tubes of eluate. Then, ATP-1 was further purified by Sephadex G-200 column, and one homogenous fraction named ATP-1-1 was obtained for characterization and anticomplementary activity evaluation (Figure 2B). The yield of ATP-1-1 was 2.08± 0.14%.

Elution curve of purified ATPs on DEAE-52 cellulose column (A) and Sephadex G-200 column (B).
Characterization of ATP-1-1
The analysis of physicochemical properties showed that the polysaccharide content of ATP-1-1 was 95.34 ± 1.27%, and no protein and uronic acid were detected, indicating that it was a neutral polysaccharide with high purity. The FT-IR characteristic absorption spectrum of ATP-1-1 was illustrated in Figure 3A, the absorption peaks observed near 3412.08 cm−1 and 2926.43 cm−1 were attributed to the stretching vibrations of O-H and C-H, respectively. 39 The absorption peaks at 1618.09 cm−1 and 1416.01 cm−1 were related to the bending vibration of C-H in the sugar ring. 40 The broad absorption band in the region of 1000 to 1200 cm−1 was attributed to the overlap of ring vibrations, stretching vibrations of C-OH side groups, and C-O-C glycosidic bond vibrations, indicating the presence of pyran rings. 41 The HPGPC of ATP-1-1 showed a single symmetric peak (Figure 3B), based on the standard curves of different dextran standards, the weight average molecular weight (Mw) and number average molecular weight (Mn) of ATP-1-1 were calculated to be 845.21 kDa and 559.06 kDa, respectively. The polydispersity index (Mw/Mn) of ATP-1-1 was 1.51 (close to 1), which indicated that ATP-1-1 was homogeneous. Compared to the HPLC chromatogram of a standard monosaccharide (Figure 3C), the monosaccharide composition of ATP-1-1 was identified as shown in Figure 3D, ATP-1-1 was composed of mannose (Man), rhamnose (Rha), glucose (Glc), galactose (Gal), and arabinose (Ara) in a molar ratio of 1.3:1.0:6.2:4.8:1.1. As shown in Figure 3E, the λmax of the Congo red complex with ATP-1-1 increased gradually with the increase of NaOH concentration, while the λmax value of the Congo red polysaccharide complex decreased with the continued increase of NaOH concentration, indicating that ATP-1-1 possessed a triple-helical conformation. The thermogravimetric (TG) and microquotient thermogravimetric (DTG) curves of ATP-1-1 were shown in Figure 3F, the thermal degradation of ATP-1-1 was mainly divided into 2 stages. In the first stage, the maximum weight loss rate and mass loss of ATP-1-1 were 88.7 °C (−1.68%/min) and 7.92%, respectively, which were related to the loss of water. 42 In the second stage, the maximum weight loss rate and mass loss of ATP-1-1 were 291.5 °C (−10.40%/min) and 57.74%, respectively, and the dramatic decrease of polysaccharide weight in this stage might be caused by the depolymerization and decomposition of polysaccharide structure. 43 The microscopic morphology of ATP-1-1 at magnifications of 200× and 10 000× was shown in Figure 3G and H. ATP-1-1 was irregularly blocky with obvious folds at the edges and a sparse surface, indicating that there was a certain degree of interaction between the molecules of polysaccharides. 44 Consistently, Sun et al reported that a neutral polysaccharide from Passiflora edulis peel (WPEP-F1) showed similar blocky microstructure. 45 All in all, ATP-1-1 was a neutral polysaccharide with abundant monosaccharides and high-molecular weight, a triple-helical conformation, good thermal stability, and blocky and sparse microscopic morphology.

Characterization of ATP-1-1: FT-IR spectrum (A). HPGPC chromatogram (B). HPLC chromatograms of standard monosaccharides (C) and polysaccharides (D). The maximum absorption wavelength of the Congo red-polysaccharides complex at various concentrations of NaOH (E). TG and DTG curves (F). The SEM images at magnifications 200× (G) and 10 000× (H).
Anticomplementary Activity
As shown in Figure 4A and B, the hemolysis inhibition rate of ATP-1-1 under the classical pathway (CP) and the alternative pathway (AP) showed a dose-dependent relationship with the concentration, and the hemolysis inhibition rate increased with the increasing concentration of the polysaccharide samples, and eventually reached 100% inhibition at concentrations 62.5 ± 3.22 μg/mL and 500 ± 2.95 μg/mL, respectively. The CH50 and AP50 values of ATP-1-1 were 6.28 ± 0.23 μg/mL and 45.33 ± 0.16 μg/mL, respectively, which were significantly lower than those of the positive control drug heparin (CH50 = 107.60 ± 1.34 μg/mL, AP50 = 122.80 ± 2.34 μg/mL) (P < .05), indicating that ATP-1-1 possessed extremely strong anticomplementary activity superior to that of the positive drug. As shown in Figure 4C and D, none of the complement-depleted serum could independently lyse EAs/ERs with a hemolysis rate of no more than 20%. After treatment with ATP-1-1, complement-depleted serum of C2 and C4 did not regain hemolysis, whereas C3, C5, and C9-depleted serum significantly regained hemolytic activity, demonstrating that ATP-1-1 is postulated to block the activation cascade of the complement system under the CP through complement components C2 and C4, but did not act on C3, C5, and C9 components. Similarly, ATP-1-1 did not restore hemolytic activity in Factor B-depleted serum (percentage of hemolysis less than 20%), whereas it significantly restored hemolysis in C3, C4, C5, C9, Factor D, and Factor P-depleted serum, suggesting that ATP-1-1 can interact with the complement component Factor B in the AP to inhibit complement overactivation.

The hemolytic inhibition rate of ATP-1 in classical pathway (A) and alternative pathway (B). Targets of components in complement activation cascade (C and D).
Conclusions
In the present study, a resin purification method was developed for the simultaneous deproteinization and decolorization of A. tsaoko fruit polysaccharides (ATPs), and its dynamic adsorption process parameters were optimized as S-8 resin, elution volume 2 BV, flow rate 2 BV/h, sample concentration 2 mg/mL, sample volume 0.4 BV. Then, a homogenous polysaccharide from A. tsaoko fruit (ATP-1-1) with high-purity was isolated and characterized, and verified to exhibit anticomplementary ability by blocking C2, C4, and Factor B complement components having stronger than positive drugs in CP and AP. This study provided a scientific basis for the utilization of ATPs and a theoretical basis for their development as drug candidates for the treatment of diseases related to complement hyperactivation.
Supplemental Material
sj-docx-1-npx-10.1177_1934578X231182254 - Supplemental material for Purification, Characterization, and Anticomplementary Activity of Polysaccharides From the Fruits of Amomum tsaoko Crevost & Lemarié
Supplemental material, sj-docx-1-npx-10.1177_1934578X231182254 for Purification, Characterization, and Anticomplementary Activity of Polysaccharides From the Fruits of Amomum tsaoko Crevost & Lemarié by Zhengyu Hu, Long Jin, Tieqiang Zong, Yuanqi Duan, Xiaohui Zhang, Pengcheng Yang, Jinfeng Sun, Wei Zhou and Gao Li in Natural Product Communications
Footnotes
Declaration of Conflicting Interests
The author(s) declared no potential conflicts of interest with respect to the research, authorship, and/or publication of this article.
Funding
The author(s) disclosed receipt of the following financial support for the research, authorship, and/or publication of this article: This work was supported by the Jilin Provincial Science and Technology Department [grant numbers 20230508170RC, grant number 20220508073RC].
Ethical Approval
All of the experimental procedures and protocols in this study were approved by institution research Ethics Committee of Yanbian University (approval NO. YBU-2018-090401), China.
Statement of Human and Animal Rights
This article does not contain any studies with human or animal subjects.
Statement of Informed Consent
There are no human subjects in this article and informed consent is not applicable.
Supplemental Material
Supplemental material for this article is available online.
References
Supplementary Material
Please find the following supplemental material available below.
For Open Access articles published under a Creative Commons License, all supplemental material carries the same license as the article it is associated with.
For non-Open Access articles published, all supplemental material carries a non-exclusive license, and permission requests for re-use of supplemental material or any part of supplemental material shall be sent directly to the copyright owner as specified in the copyright notice associated with the article.