
Abstract
Introduction
Diabetes mellitus (DM), mainly caused by genetic and environmental factors, is one of the most common metabolic diseases in our society.1 Diabetes includes type 1 DM (T1DM) and type 2 DM (T2DM), the latter, being the most common type of diabetes. According to a previous report, approximately 170 million people were affected by T2DM worldwide, and the number of T2DM patients were expected to exceed 365 million by 2030.2,3 Insulin resistance (IR) is the most common characteristic of T2DM, which is caused by high-calorie diet, high-fat diet, and a sedentary lifestyle. 4 In recent years, the urbanization of society, the ageing of the population, and the rise of obesity-related morbidity have significantly increased the prevalence of T2DM. 5
Several insulin sensitizers are commonly used, including thiazolidinediones and biguanides. These agents decrease blood glucose by improving IR and increasing peripheral utilization of insulin. Despite their benefits, these drugs are reported to have a series of side effects. The most common side effects of thiazolidinediones are bladder cancer, bone fractures, and cardiovascular disease. 6 Furthermore, the biguanides may produce gastrointestinal side effects. In addition, in clinical practice, we often have difficulty in using effective insulin sensitizers in some T2DM patients, especially those who cannot tolerate biguanides. 7
Traditional Chinese medicine (TCM) has a long history of treating T2DM because of its low toxicity and high efficiency. 8 Taraxasterol is a pentacyclic-triterpene, which is highly present in taraxacum roots throughout the year. It is common in edible plants such as legumes, cereals, nuts, and seeds, as well as plant oils. 9 Taraxacum provides numerous therapeutic benefits and is usually used for the treatment of T2DM, blisters, spleen, and liver complications, and is also a popular traditional medicine in China, Turkey, and Mexico for the control of T2DM.10,11 However it has not been elucidated whether the effective substances of taraxacum (Taraxasterol) can ameliorate IR and down-regulate the liver glucose level. Therefore, in this study, we intended to evaluate the role of taraxasterol in gluconeogenesis and glycogen synthesis in hepatocytes as well as its underlying mechanism. The research procedures followed in this study are shown in Figure 1.

Research procedures used in the study investigating the mechanism of taraxasterol in regulating blood glucose in hepatocytes.
Results and Discussion
Molecular Docking Simulation
T2DM patients are usually accompanied by IR. 12 Insulin and insulin receptor (INSR) play important roles in the regulation of glucose. 13 Therefore, drug interaction with the INSR is one of the first and important step in the drug treatment of diabetes. To investigate the interaction of key targets of taraxasterol in the treatment of diabetes, we performed a docking simulation of taraxasterol with the key target INSR. As seen in Figure 2C and D, taraxasterol showed good interaction with the target INSR based on the parameter scores and the H bond information. To analyze this in more detail, we visualized the docked structure by using Discovery Studio software.

Docking simulation. (A) The 2D structure of taraxasterol. (B) The 3D structure of the INSR protein. (C) The 3D structure of taraxasterol binding to INSR. (D) The 2D structure of taraxasterol binding to INSR. Abbreviations: 2D, two-dimensional; 3Dthree-dimensional; INSR, insulin receptor.
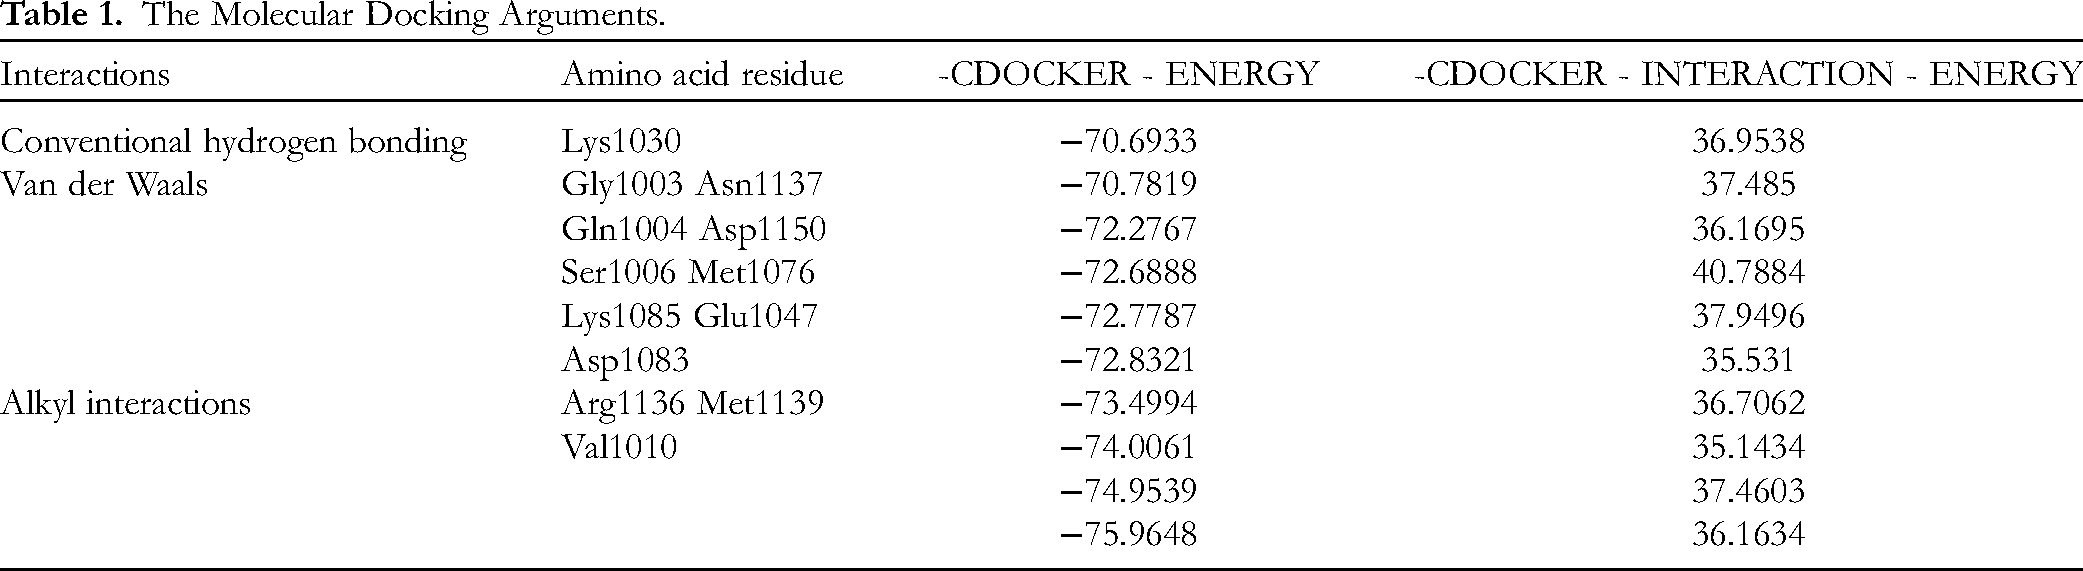
The docking results of the taraxasterol ligand and INSR protein revealed that the key amino acid residue involved in interactions was Lys1030 (Figure 2C and D). Conventional hydrogen bonding formed the interactions with Lys1030 and the other interactions exhibited by the INSR were van der Waals interactions with Gly1003, Ser1006, Gln1004, Lys1085, Ser1086, Asp1083, Asn1137, Asp1150, Met1076, and Glu1047, as shown in Table 1. The other interactions exhibited by the taraxasterol were alkyl interactions with Arg1136, Met1139, and Val1010. A molecular docking score greater than 20 indicates that the ligand molecule and the receptor molecule have good binding energy. The docking score of taraxasterol and INSR was 35.531, and it indicated that taraxasterol and INSR had good binding energy.
The Molecular Docking Arguments.
Taraxasterol Improved Glucose Consumption in Insulin-Resistant Hepatocytes
Firstly, we studied the cytotoxic effect of taraxasterol on hepatocytes, and the cell viability was examined by using a microculture tetrazolium (MTT) assay. Compared to the normal group (NC), the results showed that the concentration of taraxasterol (0.1, 1, 10 µM) had no cytotoxic effect on HepG2 cells. Furthermore, cell viability was significantly reduced at high doses (100 μM taraxasterol). Moreover, the positive drug (metformin, 10−4 mol/L) had no cytotoxic effect on the HepG2 cells as shown in Figure 3A.

Effects of different concentrations of taraxasterol on glucose consumption in HepG2 cells with insulin resistance. (A) MTT assay. (B) Glucose consumption analysis. n = 4 for each group. Values are mean ± SD. *P < 0.05, **P < 0.01 versus IR group (18 mM GlcN stimulated). #P < 0.05, ##P < 0.01 versus normal group. Abbreviations: MTT, microculture tetrazolium; GlcN, glucosamine; IR, insulin resistance.
Then we evaluated the potential roles of taraxasterol on glucose consumption in HepG2 cells. The cellular glucose consumption was significantly decreased in the IR group (18 mM glucosamine [GlcN]). However, glucose consumption was obviously increased in insulin-resistant HepG2 cells when treated with taraxasterol in a dosage-dependent manner in insulin-resistant HepG2 cells (P<0.05; Figure 3B). Furthermore, the effect of taraxasterol at a high dose (10 μM) was stronger than that of the positive drug (metformin, 10−4 mol/L). These results indicated that taraxasterol could improve glucose consumption in HepG2 cells with IR.
Taraxasterol Increased Glucose Uptake in Hepatocytes with Insulin Resistance
IR in the liver is an important factor causing fasting hyperglycemia and T2DM. To evaluate the potential roles of taraxasterol on HepG2 cells with IR, the cellular glucose uptake was assessed in HepG2 cells treated with GlcN (18 mM) to induce IR. Next, the HepG2 cells were disposed with taraxasterol at different concentrations (0.1, 1, 10 µM), and fluorescent 2-(N-(7-nitrobenz-2-oxa-1,3-diazol-4-yl) amino)-2-deoxy-D-glucose (2-NBDG) was added as fluorescent indicators and incubated cells for 60 min. As seen in Figure 4A, B, and G, compared to the normal group, the fluorescence density and area were significantly decreased when HepG2 cells were treated with GlcN (18 mM), which represents significantly decreased glucose uptake in HepG2 cells with IR. However, taraxasterol (0.1, 1, 10 µM) significantly improved glucose uptake in HepG2 cells with IR, as shown in Figure 4C to E and G. When the concentration of taraxasterol was 10 µM, the glucose uptake was the same as that of the positive drug group (metformin, 10−4 M). These results indicated that taraxasterol could improve glucose uptake in HepG2 cells with IR.

Effects of taraxasterol on glucose uptake in HepG2 cells with insulin resistance. (A) Normal group (NC). (B) Insulin-resistant model group (M). (C to E) Different concentrations of taraxasterol (0.1, 1, and 10 μM). (F) Metformin group (Met, 10−4 M). (G) Glucose uptake column Chart. 100×magnification. n = 3 for each group. Values are mean ± SD. *P < 0.05, **P < 0.01 versus IR group (18 mM glucosamine [GlcN] stimulated). #P < 0.05, ##P < 0.01 versus normal group.
Taraxasterol Significantly Reduced the Lipid Content in Insulin-Resistant Hepatocytes
To study the lipid regulation of taraxasterol on GlcN-induced insulin-resistant HepG2 cells, oil-red-O staining was used. The number and size of lipid droplets were accumulated in the IR group (Figure 5A, B, and G). After taraxasterol (0.1, 1, 10 µM) treatment, lipid accumulation was decreased in a dose-dependent pattern, and the cells’ state was significantly improved. When the concentration of taraxasterol was 10 μM, the lipid accumulation was less than that of the positive drug group (metformin, 10−4 M), as shown in Figure 5C to F and G. These results suggested that taraxasterol might reduce lipid accumulation in hepatocytes with IR.

Effects of taraxasterol on the lipid profile in HepG2 cells with insulin resistance. (n = 3). (A) Normal group (NC). (B) Insulin-resistant model group(M). (C-E) Different concentrations of taraxasterol (0.1, 1, and 10 μM). (F) Metformin group (Met) (10−4 M). (G) Lipid accumulation column Chart. 100×magnification. n = 3 for each group. Values are mean ± SD. *P < 0.05, **P < 0.01 versus IR group (18 mM glucosamine [GlcN] stimulated). #P <0.05, ##P <0.01 versus normal group.
Taraxasterol Stimulated Glycogen Synthesis via the PI3K/Akt/GSK-3β Pathway
When INSRs are activated, they usually bind to IRS-1 to activate the downstream glucometabolic-related protein PI3K/Akt. To assess the effect of taraxasterol on the IRS-1/PI3K/Akt/GSK-3β pathway, we examined the expression of PI3K/Akt/GSK3β-related protein in GlcN-treated HepG2 cells. As expected, we found that the expression of phosphorylation of IRS-1 at Ser307 was significantly up-regulated when treated with 18 mM GlcN. However, the expression of phosphorylation of IRS-1 at Ser307 was decreased in a dose-dependent manner when HepG2 cells were treated with taraxasterol (0.1, 1 10 μM) (P < 0.05; Figure 6A). Moreover, the p110α subunits of PI3K were decreased but taraxasterol could improve PI3K expression in GlcN-treated HepG2 cells (P < 0.05; Figure 6B). Furthermore, compared with the normal group, the expression of p-Akt (Ser473) and p-GSK-3β (Ser9) were obviously decreased in GlcN-treated HepG2 cells, while taraxasterol could significantly restore the expression of the phosphorylation levels of Akt and GSK-3β in GlcN-treated HepG2 cells, as shown in Figure 6C and 6D (P < 0.05). At the same time, to explore the potential bio-synergy by which taraxasterol affects glycogen synthesis, we also determined the protein expression of p-GS (Ser645) and GS were also determined. We observed that the protein expression of p-GS (Ser645) was significantly enhanced. Nevertheless, taraxasterol could significantly down-regulate the expression of p-GS (Ser645) and up-regulate the expression of GS (P < 0.05, Figure 6E). These results indicated that taraxasterol could regulate hepatic glycogen synthesis by the PI3K/Akt/GSK-3β signal pathway in HepG2 cells with IR.

Effect of taraxasterol on glycogen synthesis in HepG2 cells with insulin resistance. (A) The expression levels of IRS1 and p-IRS1, and the ratios of p-IRS-1/IRS-1. (B) The expression levels of PI3K; GAPDH were used as a loading control. (C) The expression levels of p-Akt, Akt, and the ratios of p-Akt/ Akt. (D) The expression levels of GSK-3β and p-GSK-3β, and the ratios of p-GSK-3β/GSK-3β. (E) The expression levels of GS and p-GS, and the ratios of p-GS/GS. Data are expressed as mean ± SD For each group, n = 3. *P < 0.05, **P < 0.01 versus IR group (18 mM GlcN stimulated). #P < 0.05, ##P < 0.01 versus normal group.
Taraxasterol Inhibited Gluconeogenesis via the PI3K/Akt/FoxO1 Pathway
FoxO1 and its downstream targets, including G6Pase and PEPCK, are important transcription factors in regulating gluconeogenesis. 14 To further study the effect of taraxasterol to regulate gluconeogenesis in insulin-resistant HepG2 cells, we evaluated the protein FoxO1 and its downstream targets (G6Pase and PEPCK). Compared with the normal group, the p-FoxO1/FoxO1 ratio was down-regulated (P < 0.01; Figure 7A), while the expression of PEPCK and G6Pase were up-regulated in HepG2 cells with IR (P < 0.01; Figure 7B and C). After treatment with taraxastero (0.1, 1, 10 µM) l, the p-FoxO1/FoxO1 ratio was elevated (P < 0.01; Figure 7A), whereas the expression of PEPCK and G6Pase were markedly decreased (P < 0.01; Figure 7B and C). These results suggested that taraxasterol could inhibit gluconeogenesis by regulating the PI3K/Akt/FoxO1 signal pathway in insulin-resistant HepG2 cells.

Effect of taraxasterol on gluconeogenesis in cells with insulin resistance. (A) The protein expression levels of FoxO1 and the ratios of p-FoxO1/FoxO1. (B) The protein expression levels of PEPCK and the ratios of PEPCK/GAPDH. (C) The protein expression levels of G6Pase and the ratios of G6Pase/GAPDH. All data are expressed as mean ± SD. For each group, n = 3. *P < 0.05, **P < 0.01 versus IR group (18 mM GlcN stimulated), #P < 0.05, ##P < 0.01, versus normal group.
Discussion
IR, hyperglycemia, and hyperinsulinemia are the most common characteristics of T2DM. 15 IR is a pathological state in which cells fail to respond adequately to the normal action of insulin hormones. Although insulin is produced in vivo, the cells use insulin inefficiently, leading to hyperglycemia.16,17 Hyperglycemia can induce oxidative stress and aggravate IR in surrounding tissues, leading to metabolic syndrome. This can result in retinopathy, nephropathy, and neuropathy. Therefore, it is important to find a way to better treatment and adopt precautionary strategies for T2DM.18,19
TCM and natural compounds have activity in the treatment of diabetes, which can significantly enhance the therapeutic effect when combined with clinical drugs.20,21 Taraxasterol is a natural compound extracted from dandelion, legumes, cereals, nuts, and seeds as well as plant oils. It has been reported that taraxasterol has a hypoglycemic effect.10,11,22 However, the unique mechanism of taraxasterol in the treatment of T2DM is not well understood. Therefore, in order to further study the mechanism of action of taraxasterol in the treatment of T2DM, we initially predicted the key targets of taraxasterol in the treatment of T2DM by molecular docking, and the mechanism of action was verified by in vitro experiments. In the present study, taraxasterol had a good binding property to the INSR, indicating that taraxasterol may treat diabetes by improving IR. We also observed a dose-dependent improvement in glucose uptake and consumption, and the inconspicuous difference in cell viability was observed in HepG2 cells after treatment with taraxasterol. Moreover, the oil-red-O staining results showed that the lipid accumulation in HepG2 cells was significantly reduced when taraxasterol was added. These results indicated the positive effects of taraxasterol on relieving hyperglycemia and IR in HepG2 cells.
IR is the core pathogenesis of T2DM which is characterized by hyperglycemia.23,24 Many studies have shown that the IRS-1/PI3K/Akt signaling pathways are the most important insulin signal pathways and are also an important signaling pathway for blood glucose regulation.25–28 After connecting with insulin, INSRs and IRS-1 are activated, and then the downstream glucometabolic-related protein PI3K is also activated. Subsequently, PI3K recruits signaling proteins, including Akt (PKB), which affects both glucose and lipid metabolism by regulating its downstream proteins such as FoxO1 and GSK-3β. 29 Our results showed that the phosphorylation of IRS-1 was significantly increased in the IR group. However, the expression of p-IRS1 was decreased in a dose-dependent manner when treated with taraxasterol. Moreover, compared with the normal group, the expressions of PI3K and p-Akt were down-regulated in HepG2 cells with IR, while taraxasterol could improve the expression of PI3K and p-Akt in HepG2 cells with IR. Furthermore, the expression of p-Akt was decreased in HepG2 cells with IR. Our results indicate that taraxasterol could activate the IRS-1/PI3K/Akt signaling pathways by regulating the key proteins.
Undoubtedly, GSK-3 β and glycogen synthase (GS) are the main proteins of glycogen synthesis in humans. In the state of IR, the phosphorylation of GSK-3β is inhibited. Subsequently, GS is inactivated by phosphorylation and glycogen synthesis is restrained.30,31 Previous studies have shown that Sonchus oleraceus Linn extract containing phenolic compounds improves hepatic IR by promoting the phosphorylation of GSK-3β in diabetic rats and HepG2 cells. 32 Our results show that the expression of p-GSK-3β protein in HepG2 cells with IR was depressed, and p-GS protein expression were increased. However, taraxasterol restored the normal expression of both proteins. Taken together, these results implied that taraxasterol increases glycogenesis via PI3K/Akt/GSK-3β-mediated GS activation in HepG2 cells with IR.
Hepatic gluconeogenesis, which plays an important role in supplying energy to the body, is also the principal source of endogenous glucose production, especially in the fasting state. Gluconeogenesis-related genes, namely G6pase and PEPCK, are over-expressed and further elevated under IR conditions. 33 FoxO proteins, especially FoxO1, activated by phosphorylation, are closely associated with the modulation of insulin sensitivity. 34 Inhibition of FoxO1 dephosphorylation likely motivates the development of diabetes and fatty liver. 35 The present study has shown that the expression of phosphorylated FoxO1 was depressed while the expression of PEPCK and G6Pase depressed after treatment with taraxasterol in HepG2 cells with IR. Ultimately, taraxasterol could inhibit the gluconeogenesis in HepG2 cells with IR by the PI3K/Akt/FoxO1 pathway Ultimately, the gluconeogenesis in HepG2 cells with IR can be reduced.
In conclusion, taraxasterol increases glycogenesis by PI3K/Akt/GSK-3β pathway and decreases gluconeogenesis by the PI3K/Akt/FoxO1 pathway in human HepG2 cells with IR. The effects of taraxasterol on gluconeogenesis and glycogen synthesis at least partially contribute to reduce glucose production and improve IR in type 2 diabetes, and show similar effects to insulin in the regulation of blood glucose. Therefore, taraxasterol may offer an effective therapeutic strategy for type 2 diabetes. As shown in Figure 8.

Schematic diagram showing the downstream signal mechanism of taraxasterol in modulating gluconeogenesis and glycogen synthesis in hepatocytes. HGP indicates indicate hepatic glucose production. The red arrow represents the regulation of glucosamine, and the green arrow represents the regulation of taraxasterol.
Materials and Methods
Materials and Reagents
Molecular Docking Studies
The chemical structure of taraxasterol was plotted by using ChemDraw software. The Discovery Studio (2019) software package was used to pretreat the small molecule. The small molecule was optimized using the “Prepare Ligands” module. Ligand 2D is shown in Figure 2A.
The crystal structure of the target protein (INSR) was downloaded from UniProt and saved in the Protein Data Bank format, which is shown in Figure 2B. In Discovery Studio software, the protein was optimized by the “Clean Protein” and “Prepare Protein” modules to remove crystal water molecules and add hydrogens.
CDOCKER is a CHARMM-based semiflexible docking program for flexible docking calculations of the protein-immobilized ligand, with energy selected as the scoring function in Discovery Studio. The CDOCKER parameters used the default value. The lower the CDOCKER interaction energy value, the stronger the binding ability of the receptor to the ligand.
Cell Culture and Treatment
HepG2 cells were kindly provided by Stem Cell Bank, Chinese Academy of Sciences. HepG2 cells were seeded in an incubator (37 °C, 5% CO2), and DMEM with low glucose was used as a culture solution, which contained 10% FBS and 1% penicillin–streptomycin. The passage was conducted when HepG2 cells had reached 80% confluence. In order to induce IR model in vitro, HepG2 cells were incubated with 18 mM GlcN for 18 h in a serum-free medium.
MTT Assay
An MTT-based assay kit was used to determine the effects of taraxasterol on the viability of HepG2 cells. The cells (1×10⁴ cells/mL) were cultured in a flat-bottomed 96-well plate. After 18 mM of GlcN was added, treatment for 18 h to induce an insulin-resistance model, we removed the medium and treated the cells with taraxasterol (0.1, 1, 10 µM) for 24 h. After incubation, we added 20 μL of MTT solution (5 mg/mL) to each well and culture in an incubator (37 °C, 5% CO2). After 4 h incubation, to dissolve the formazan crystals, we removed the supernatant and 100 μL of DMSO was added to each well. Then a microplate reader was used to detect the absorbance at 490 nm. We regarded the absorbance of the control group as 100%.
Glucose Consumption Assay
The glucose concentrations of HepG2 cells were measured using a glucose assay kit. The cells were treated in the same way as described above. Taraxasterol at different concentrations was added and incubated for 24 h. On the next day, a glucose reagent was added and incubated at 37 °C for 15 min, and the culture medium was collected. The OD values at 505 nm were measured using a microplate, and glucose concentration in the supernatant was determined by glucose determination kit as shown in Table 2.
The Materials of This Study.
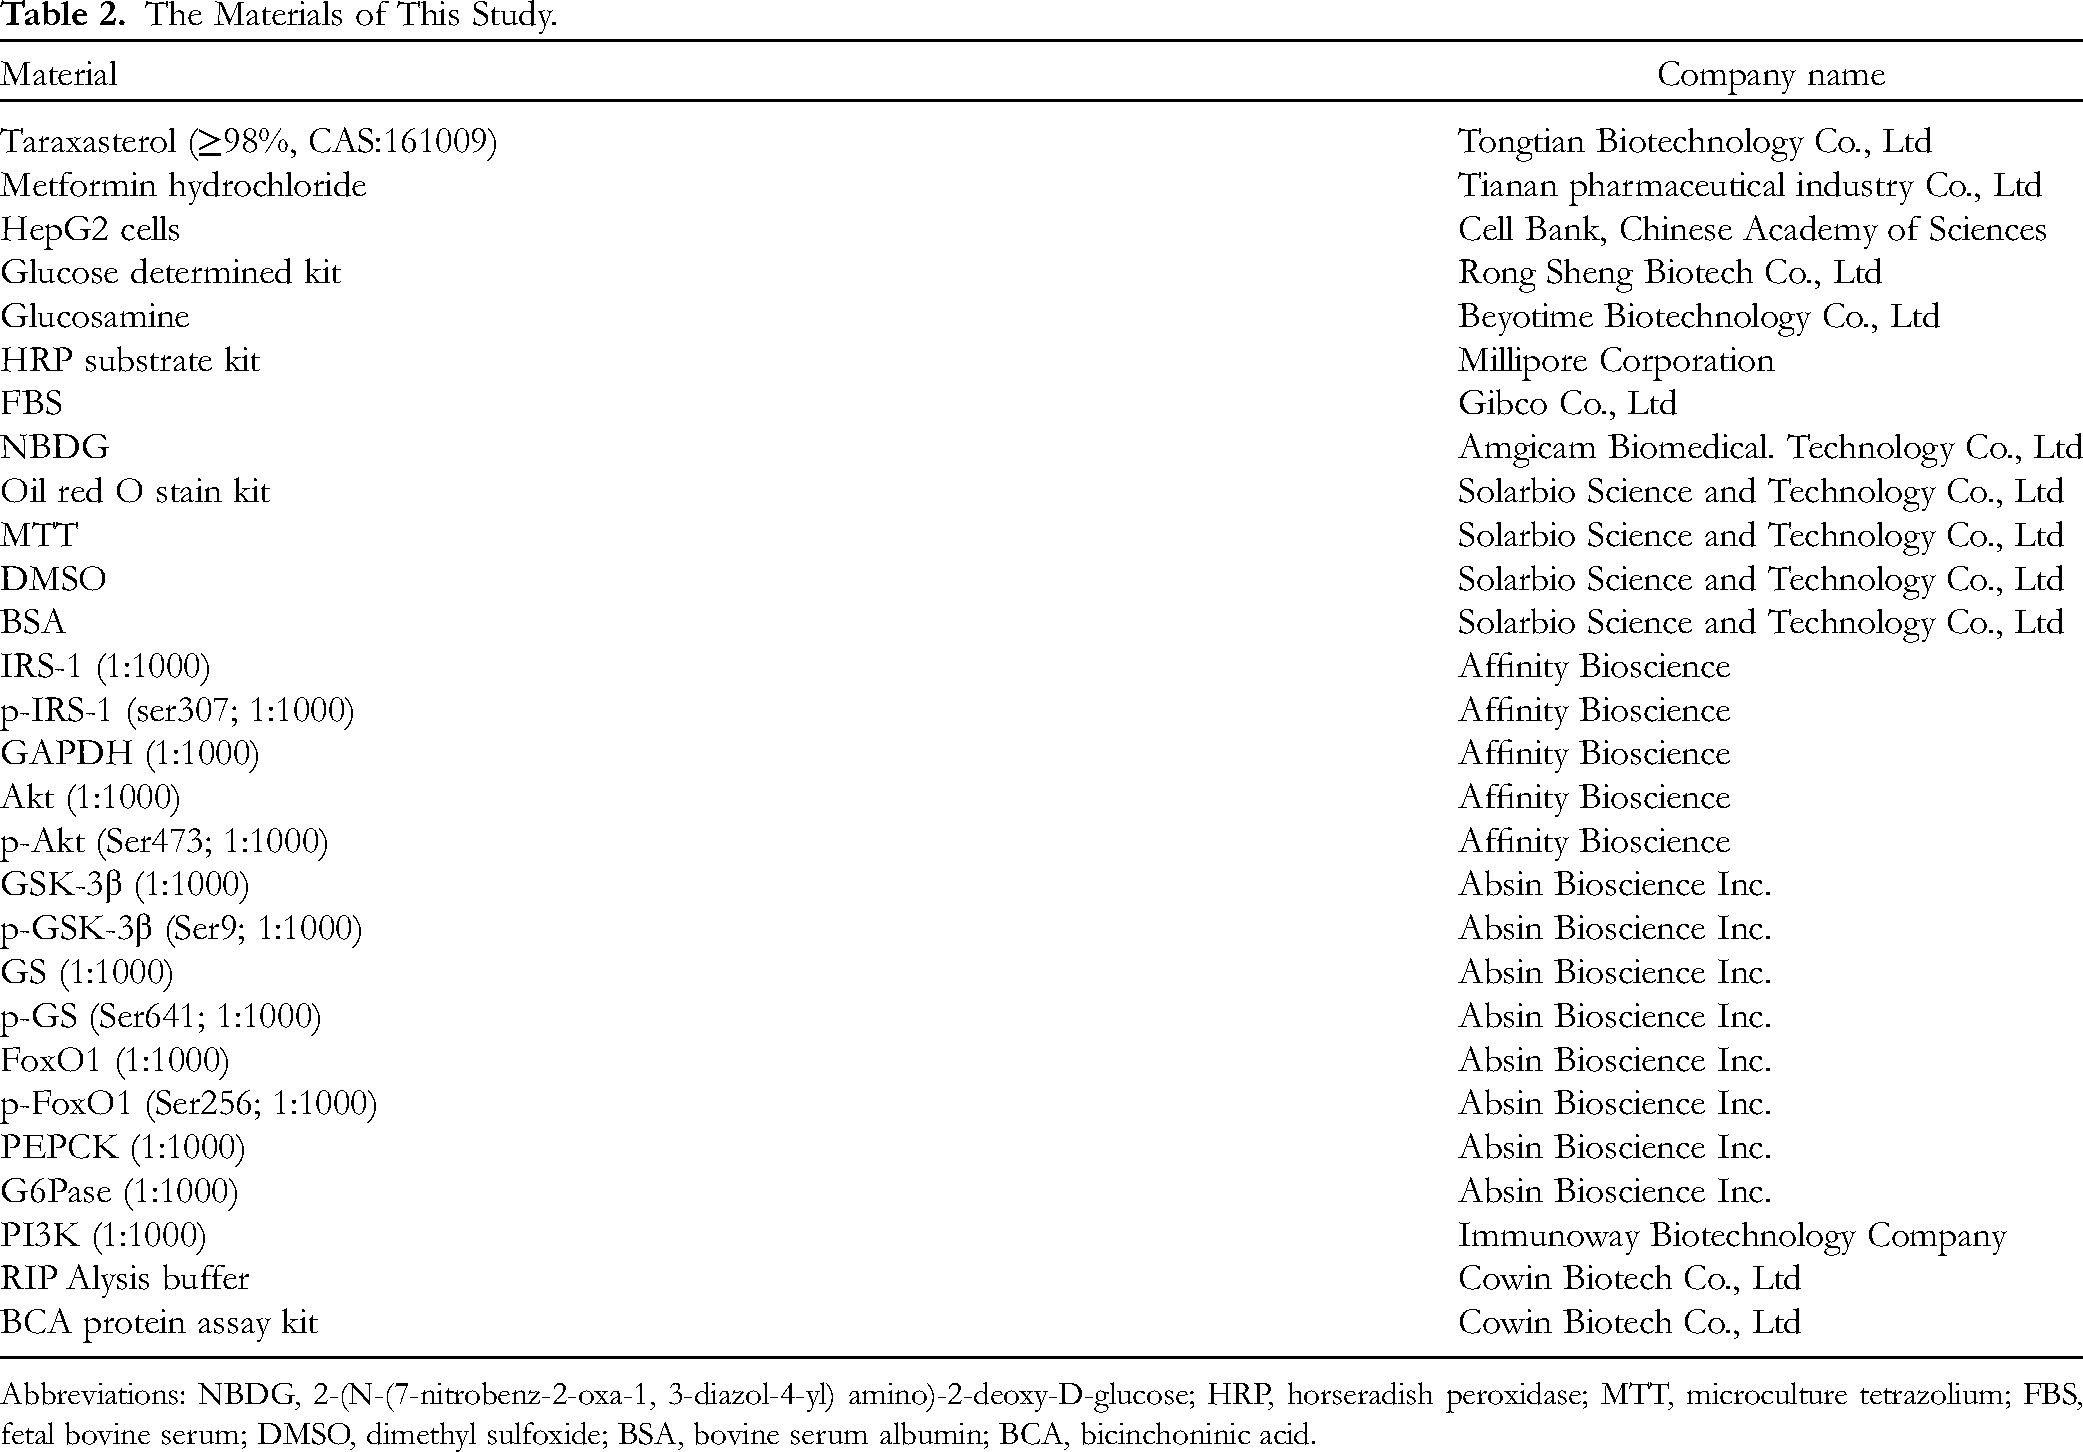
Abbreviations: NBDG, 2-(N-(7-nitrobenz-2-oxa-1, 3-diazol-4-yl) amino)-2-deoxy-D-glucose; HRP, horseradish peroxidase; MTT, microculture tetrazolium; FBS, fetal bovine serum; DMSO, dimethyl sulfoxide; BSA, bovine serum albumin; BCA, bicinchoninic acid.
2-NBDG Glucose Uptake Assay
Cellular glucose uptake levels were assessed using the fluorescent 2-NBDG. In short, HepG2 cells (1×10⁵ cells/well) were cultured in 6-well plates. After reaching 80% confluence, we added GlcN (18 mM) and cultured for 18 h to establish an insulin-resistance model. Next, different concentrations of taraxasterol (0.1, 1, and 10 μM) were added and incubated for 24 h. Afterward, The HepG2 cells were washed 5 times with phosphate-buffered saline (PBS), and 2-NBDG (100 μM) was added to the cells, and the cells were incubated in an incubator (37 °C, 5% CO2) for 1 h. Then, PBS was used to wash the cells twice to remove the residual probe. Photographs were taken under an inverted fluorescence microscope. "Image J" analysis software was used to quantitatively analyze the results.
Oil red O Staining
After the HepG2 cells were cultured and treated as before, the medium was discarded, and PBS was used to wash the cells twice. Oil red O (ORO) staining solution was added, and the cells were fixed for 20 to 30 min. Then, distilled water was used to wash the cells, which were soaked with 60% isopropyl alcohol for 5 min, and staining with the ORO stain solution (B1:B2 = 3:2) for 10 min. Excess dye was removed by washing, and Mager hematoxylin staining solution was added. After 10 min, we washed the cells 3 times with triple-distilled water. Then, ORO buffer was added for 5 min and the microscope was used to observe the state of the HepG2 cells. "Image J" analysis software was used to quantitatively analyze the results.
Western Blot Assay
The HepG2 cells were cultured and treated as before, metformin (10−4 M) and different concentrations of taraxasterol (0.1, 1, and 10 μM) were treated for 1 h, RIPA buffer was used to lyse the cells. After 15 min, the cell mixture was collected and centrifuged at 12,000 r/min for 10 min. Then, a BCA assay kit was used to measure the concentrations of proteins according to the specification. Next, 25 µL of RIPA lysis buffer was mixed with 100 µL of total protein and denatured at 80 °C for 8 min. Then all the processed proteins were stored in the refrigerator at −20 °C. Before they were transferred to a polypropylene fluoride membrane, samples containing 30 µg of protein were separated by 10% SDS-PAGE, which was transferred to PVDF membranes. The membranes were washed 3 times, every 5 min, with TBST (0.1% Tween 20 in TBS). Then, they were incubated in BSA (5% bovine serum albumin in TBST) for 2 h and incubated with a specific primary antibody at 4 °C. After 24 h, we washed the membranes 3 times with TBST. Then, an HRP-conjugated secondary antibody was used to incubate these membranes at room temperature for 3 h. Finally, these membranes were treated with chemiluminescence. "Image J" analysis software was used to quantitatively analyze the results.
Statistics
All data in this study were given as the mean ± SD. Differences between groups were distinguished by one-way analysis of variance using GraphPad prism 8.0. The student's t-test was used to differentiate between the 2 groups. When P < 0.05 was regarded as significant.
Footnotes
Acknowledgments
A special acknowledgment should be given to Professor Wenwen Jang, from whose lectures we benefited greatly.
Declaration of Conflicting Interests
The authors declared no potential conflicts of interest with respect to the research, authorship, and/or publication of this article.
Funding
The authors disclosed receipt of the following financial support for the research, authorship, and/or publication of this article: This work was supported by the Science and Technology Project of Guizhou Province of China (grant number No.[2019] 1120).