
Abstract
Spatholobus suberectus Dunn (SSD) possesses potential antitumor activity; however, the mechanism underlying its anti-proliferative effect on breast cancer is unclear. In this study, we explored potential SSD targets for breast cancer treatment through a network pharmacology approach. First, by integrating multiple databases, a total of 16 potential bioactive compounds and 252 targets were screened. Differentially expressed genes (DEGs) were screened by analyzing breast cancer gene chip data from The Cancer Genome Atlas and Gene Expression Omnibus databases. By overlapping drug targets and DEGs, 33 common targets were found; their functions were further analyzed with Gene Ontology and KEGG analysis. A network of 16 compounds and 33 common targets was constructed, from which 10 hub targets were identified using CytoHubba. Based on the KEGG result and network analysis, the 33 common targets were mainly enriched in the peroxisome proliferator-activated receptor (PPAR) signaling pathway and PPARγ was identified as the potential target of SSD. Moreover, the 10 hub targets were correlated with prognosis and immune infiltration in breast cancer via bioinformatic analysis. Finally, molecular docking and experiments in vitro further verified the targeting ability and anti-breast cancer activity of SSD. SSD is promising in the treatment of breast cancer; PPARγ may be its potential therapeutic target.
Introduction
The latest global cancer data from the International Agency for Research on Cancer of the World Health Organization indicate that breast cancer has surpassed lung cancer as the most commonly diagnosed cancer worldwide, with a global incidence of 2.26 million new cases in 2020 (https://gco.iarc.fr/). Chemotherapy is one of the main treatments for breast cancer; however, many chemotherapeutic drugs can cause toxicity, leading to myelosuppression and immunosuppression. Moreover, the long-term use of chemotherapeutic agents can easily result in drug resistance. 1 Therefore, it is necessary to find a safer and more effective approach for the treatment of breast cancer.
The multi-component and multi-target nature of the compounds used in traditional Chinese medicine (TCM) offer unique advantages in the treatment of diseases. There has been an increased focus on investigating TCM agents that are more effective and less toxic. 2 Spatholobus suberectus Dunn (SSD) is a classical TCM that has been widely used in the treatment of blood stasis syndrome, abnormal menstruation, and rheumatism. 3 It contains components such as licochalcone a, calycosin, butin, and formononetin.4-7 In recent years, an increasing number of experimental studies have shown that SSD displays antitumor effects on breast cancer.8-12 However, the anti-cancer mechanism of SSD requires further exploration.
Network pharmacology is based on multidisciplinary theories, such as systems biology and multidirectional pharmacology and is well suited for analyzing multi-targeted agents and TCM. 13 The construction and visualization of drug–disease–target networks are key steps in network pharmacology that aid in uncovering the complex network relationships between TCM and diseases. Since network pharmacology methods exhibit a potent capacity to explore pharmacological mechanisms, they may serve as appropriate tools for identifying the complex mechanisms of SSD in breast cancer.
Here, drug target prediction databases and public microarray databases were used to analyze the targets of SSD against breast cancer. A drug–common target interaction network was subsequently constructed and the dominating biological functions and signaling pathways were identified. Among all the enriched pathways revealed by network pharmacology, peroxisome proliferator-activated receptor-gamma (PPARγ) was identified and further explored using in vitro experiments. The findings might provide new reference information for the development and application of SSD.
Results
Orally Active Components of SSD and Target Prediction
The network pharmacology approach used in this study is summarized in Figure S1. To identify the orally active compounds in SSD, we first searched for the constituents of SSD in the TCM systems pharmacology (TCMSP) database. Sixteen compounds were filtered out using cut-offs of oral bioavailability > 40% and drug-likeness > 0.18. To identify the bioactive compounds present in SSD, we performed ultra-high performance liquid chromatography-quadrupole time-of-flight mass spectrometry (UPLC-Q-TOF-MS) analysis. The MS spectra of SSD were detected in the positive mode. As shown in Figure S2 and Table S1, these 16 SSD compounds included catechin, 3,7-dihydroxy-6-methoxy-dihydroflavonol, calycosin, aloe-emodin, suberectin, cajinin, psi-baptigenin, formononetin, 8-o-methylreyusi, vestitol, medicagol, lupinidine, licochalcone, (Z)-3-(4-hydroxy-3-methoxy-phenyl)-N-[2-(d-hydroxyphenyl)ethyl]acrylamide, 3-hydroxystigmast-5-en-7-one, and stigmasterol.
After retrieving the 16 compounds, the PharmMapper database was used to predict drug targets for these compounds. 14 The top 100 predicted targets for every compound were identified and ranked according to the normalized fit score (Figure S3). There were 252 potential targets identified for the 16 compounds, suggesting that these compounds may have shared bioactive targets and connection networks.
Network Construction
To explore the targets for breast cancer treatment, we screened differentially expressed genes (DEGs) between breast cancer and normal breast tissues using the Gene Expression Omnibus (GEO) and The Cancer Genome Atlas (TCGA) databases. We obtained a total of 3560 DEGs from TCGA, including 1421 upregulated genes and 2139 downregulated genes (Figure S4). A volcano map of these DEGs is shown in Figure 1A. A total of 2107 DEGs were retrieved from GEO (GSE42568 and GSE124646 datasets). Volcano maps of DEGs from GSE42568 and GSE124646 are shown in Figure 1B and 1C, respectively. Venn diagram analysis identified 33 common targets (Figure 1D). Based on these 33 common targets, a drug–common target interaction network was constructed (Figure 1E). These 33 common genes were considered potential therapeutic targets of SSD against breast cancer. They comprised PLAU, TYMS, AURKA, AHCY, RBP4, PPARG, PLK1, PCK1, RAC2, PLA2G2A, C1R, ADH1C, MIF, NR3C2, KIT, KIF11, ITGAL, GALE, FGFR1, FABP5, FABP4, F10, EGFR, DUSP6, CMA1, CFD, CTSG, CTSD, BMP2, MAOB, AKR1C1, ADH1B, and SRPINA1. The network consisted of 49 nodes (16 compounds, 33 targets) and 199 interactions, resulting in an average degree of 8.122. In the drug–common target network, targets such as PPARγ were hit by most of the 16 compounds. Moreover, PPARγ and endothelial growth factor receptor (EGFR) were considered to play a central role in mediating two different pathways with a higher degree in the protein–protein interaction (PPI) network of the 33 common targets (Figure S5). Furthermore, we screened the top 10 hub targets in the drug–common target network using the Matthews correlation coefficient method. The hub targets included EGFR, KIF11, F10, FGFR1, MIF, NR3C2, MAOB, CFD, PPARG, and TYMS. These results suggested that the constituents of SSD acted on multiple targets, and that targets such as PPARγ may play key roles in the anti-breast cancer effect of SSD.

Network construction. Volcano plots show the number of DEGs in TCGA (A), GSE42568 (B), and GSE124646 (C). Red dots indicate upregulated DEGs, while blue dots indicate downregulated DEGs. (D) Venn diagram depicting overlaps among the DEGs in TCGA and GEO databases, and common targets between DEGs and drug targets. (E) The drug–common targets interconnection network. The diamond-shaped nodes represent compounds, while circular nodes represent targets. The top 10 hub targets in the network are represented using a column graph; the horizontal axis represents the degree of drug–common gene interaction.
GO and KEGG Enrichment Analysis
To elucidate the integral role of SSD in the treatment of breast cancer, 33 common targets were selected for GO and KEGG pathway enrichment analysis using DAVID. GO annotation was performed including three aspects of biological content: biological process, cellular component, and molecular function. The top 10 significantly enriched GO terms are shown in Figure 2A–C. In the biological process, terms such as positive regulation of mitogen-activated protein kinase (MAPK) activity and extracellular signal-regulated kinase (ESK) 1 and 2 cascade were associated with breast cancer, with high enrichment scores (Figure 2A). The high-ranked molecular function terms included serine-type endopeptidase activity, oxidoreductase activity, and Ras guanyl-nucleotide exchange factor activity (Figure 2B). The top-ranked cell composition enrichment results consisted of the extracellular exosome, extracellular region, and cytosol (Figure 2C). The top 10 pathway enrichment results are presented in Figure 2D. Among them, multiple signaling pathways were identified, including the PPAR, Rap1, and Raf signaling pathways. These results indicated that the active ingredients of SSD regulate multiple signaling pathways, and that signaling pathways such as PPAR may be responsible for the SSD-induced growth inhibition in breast cancer cells.

GO and KEGG analyses of 33 common targets. Top 10 enriched GO terms for (A) biological process, (B) molecular function, and (C) cellular components. (D) Top 10 enriched KEGG terms. The color of each bubble represents the P-value, while the bubble size represents the gene number.
DNA Methylation and Gene Expression Analysis for the hub Targets
To further demonstrate the reliability of the screened hub targets, bioinformatic analyses were performed. First, we identified the DNA methylation and gene expression of the hub targets using the UALCAN database (http://ualcan.path.uab.edu/). As shown in Figure 3, most hub targets showed a significant increase in DNA methylation levels, including EGFR, PPARG (PPARγ), FGFR1, F10, NR3C2, and CFD. Only MIF was found to be downregulated. Moreover, the 10 hub targets showed different gene expression levels in breast cancer tissues and normal tissues. TYMS, MIF, and KIF11 were upregulated, while the seven other hub targets, which included PPARγ, were downregulated (Figure 4A–J). Similar results were also verified using the GSCALite and GEPIA databases (Figure 4K and S6).

Gene methylation status of 10 hub genes was validated using UALCAN database. (A) EGFR, p < 0.05; (B) KIF11, ns; (C) FGFR1, p < 0.0001; (D) F10, p < 0.0001; (E) NR3C2, p < 0.0001; (F) CFD, p < 0.0001; (G) MAOB, ns; (H) TYMS, ns; (I) MIF, p < 0.0001; (J) PPARG, p < 0.0001. p < 0.05 indicates statistical significance and ns denotes no significant difference.

The mRNA expression levels of 10 hub targets in breast cancer were identified via the UALCAN database. The mRNA expression of (A) PPARG, p < 0.0001; (B) FGFR1, p < 0.0001; (C) NR3C2, p < 0.0001; (D) F10, p < 0.0001; (E) MAOB, p < 0.0001; (F) TYMS, p < 0.0001; (G) EGFR, p < 0.0001; (H) CFD, p < 0.0001; (I) KIF11, p < 0.0001; (J) MIF, p < 0.0001. (K) Regulation of expression of the hub targets in breast cancer were validated using the Gene Set Cancer Analysis database. The upregulated genes are shown in red and the downregulated genes are shown in blue.
Verification of Survival Outcomes of the hub Targets
Next, we further explored the correlation between the mRNA expression of hub targets and the overall survival rate of patients with breast cancer using the Kaplan–Meier Plotter. As shown in Figure 5, high mRNA expression of most hub targets, such as PPARγ, was associated with improved overall survival rates (Figure 5A–F). MIF, TYMS, and KIF11 predicted a poor prognosis in the overall survival of breast cancer patients (Figure 5H–J).
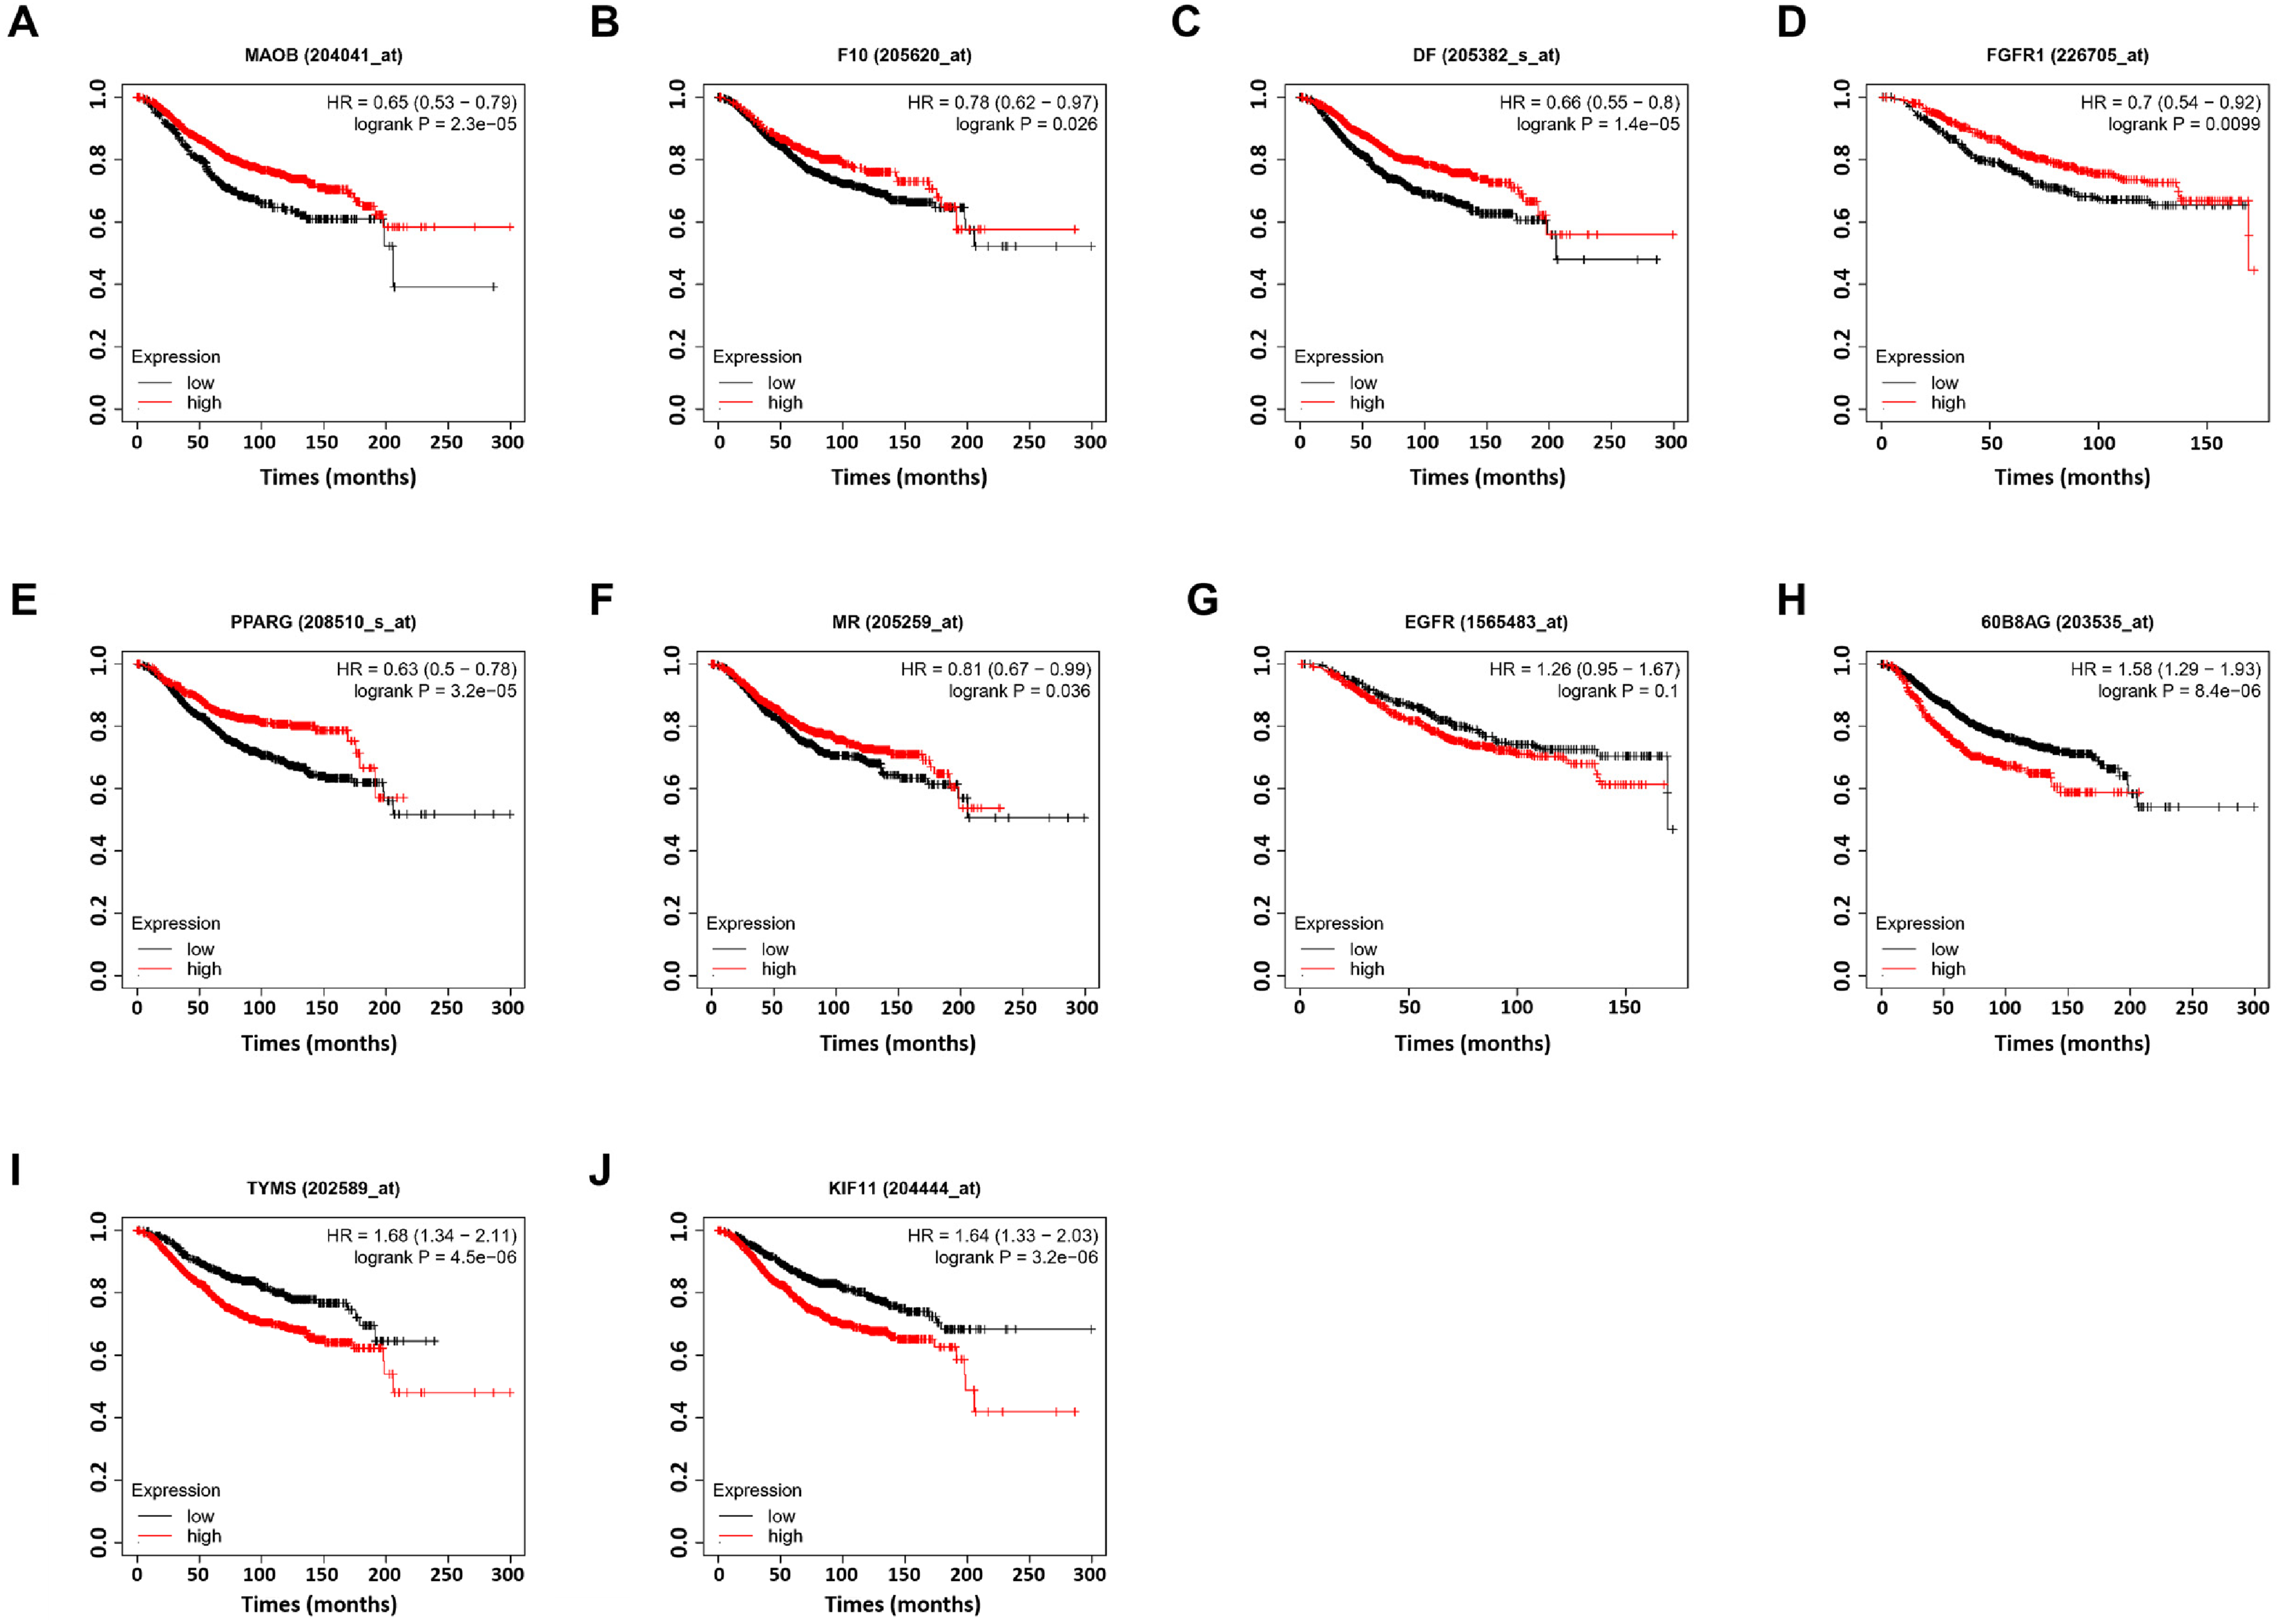
Overall survival values of hub genes in breast cancer. (A) MAOB, (B) F10, (C) CFD, (D) FGFR1, (E) PPARG, (F) NR3C2, (G) EGFR, (H) MIF, (I) TYMS, (J) KIF11. Survival curve comparing patients with high (red) and low (black) expression in breast cancer. p < 0.05 was considered statistically significant.
Correlation Between Expression of hub Targets and Immune Infiltration Level in Breast Cancer
Spearman's correlations between hub targets and lymphocytes/immunomodulators in breast cancer were performed using the TISIDB database (Figure 6). As shown in Figure 6A, the expression of PPARγ and EGFR positively correlated with the infiltration degree of most tumor-infiltrating lymphocytes (TILs). The top four positive correlations between PPARγ expression and TILs, which consisted of eosinophils, macrophages, mast cells, and Th1, are shown in Figure 6C. Other hub targets, including MIF, KIF11, TYMS, FGFR1, and MAOB, were inversely correlated with most TILs. Moreover, the expressions of PPARγ and EGFR were positively correlated with many previously collected immunomodulators, 15 as shown in Figure 6B. These results suggest that the regulation of these hub targets in breast cancer may affect the tumor immune microenvironment.

The relevance of the expression of hub targets and immune infiltration level. (A) Heatmap of Spearman's correlations between hub genes and tumor-infiltrating lymphocytes (TILs) in breast cancer. (B) Heatmap of Spearman's correlations between hub targets and immunoinhibitors in breast cancer. (C) Top 4 positive correlations between PPARγ expression and TILs. p < 0.05 was considered statistically significant.
Molecular Docking of Compounds to hub Targets
To further verify the binding capacity between the active compounds and key targets, we conducted molecular docking using AutoDock Vina. We selected representative co-crystal structures of the 10 hub targets, as described in the Methods section. The docking results were displayed in the form of a bee colony graph, for a more comprehensive representation (Figure 7). The X-axis represents the different targets and the Y-axis represents the docking scores (kcal/mol). We performed redocking of the 10 hub targets with their co-crystallized small molecules (labeled by gold dot and gold arrow) to compare with the 16 components on the proteins. According to the docking results, most of the 16 compounds showed good binding affinity with all targets, except for CFD (average docking score < − 7 kcal/mol). The docking score of some compounds was better than that of positive co-crystallized inhibitors. The binding mode between the active constituents with the best docking score and the related targets is shown in the Supplemental material (Figure S7). Collectively, the docking results indicated that the 16 compounds of SSD may bind to these key targets.

Docking scores of 10 hub targets with the 16 active compounds.
SSD Inhibits Growth of Breast Cancer Cells via PPARγ Activation
To identify the anti-cancer activity of SSD, we obtained the crude alcoholic extract of SSD. BT-549 and MCF-7 cells were treated with a total fraction of SSD at various concentrations, and cell viability was detected by the 3-(4,5-dimethylthiazol-2-yl)-2,5-diphenyltetrazolium bromide (MTT) assay. As shown in Figures 8A and 8B, the SSD extract effectively suppressed the proliferation of the breast cancer cells in a dose-dependent manner. Flow cytometry was used to detect whether SSD induced apoptosis and cell cycle arrest in BT-549 and MCF-7 cells. After a 48-h treatment with SSD extract, apoptosis was observed in BT-549 and MCF-7 cells (Figure 8C and 8D). SSD also induced cell cycle arrest in the G2 phase (Figure 9A and 9B). Network pharmacology analyses identified PPARγ as one of the potential targets of SSD. Western blotting results showed that SSD extract efficiently increased the expression of PPARγ both in BT-549 cells and MCF-7 cells (Figure 9C). Additionally, the significant inhibition of phosphoinositide 3-kinase/protein kinase C (PI3K/AKT) signaling pathway indicated that the expression of PI3K and phosphorylation of AKT were decreased. Collectively, these results demonstrated that SSD extract effectively impedes the growth of BT-549 and MCF-7 cells by activating PPARγ.

SSD extract inhibits the growth of breast cancer cells and induces apoptosis. The MTT assay was conducted to detect cell viability of BT-549 (A) and MCF-7 (B) cells treated with SSD extract. BT-549 (C) and MCF-7 (D) cells were treated with SSD extract (0, 100, and 200 μg/mL) for 48 h, then apoptosis was determined by flow cytometry. * p < 0.05, ** p < 0.01 and *** p < 0.001 compared to the control group.

SSD extract induces cell cycle arrest in breast cancer cells and activates PPARγ. BT-549 (A) and MCF-7 (B) cells were treated with SSD extract. Cell cycle distribution was analyzed using flow cytometry. (C) Representative western blot images and quantitative analysis of PPARγ, PI3K, phosphorylated AKT (p-AKT), and AKT proteins. Glyceraldehyde 3-phosphate dehydrogenase (GAPDH) was used as a control. * p < 0.05, ** p < 0.01, and *** p < 0.001 compared to the control group.
Discussion
SSD is a TCM that is widely used in Asia to treat anemia, menoxenia, and rheumatism. 16 In recent years, increasing evidence has emerged indicating that SSD possesses antitumor properties, especially in breast cancer.17,18 In this study, we explored the mechanisms that underlie the effects of SSD against breast cancer using network pharmacology analysis and validated the findings by in vitro experiments.
Compounds lacking appropriate pharmaceutical properties, especially oral bioavailability, cannot easily reach cellular targets to further exert their pharmacological activity. 19 The most important form of administration of medicinal plants is a decoction. Thus, evaluation of oral bioavailability is indispensable to determine the active constituents of SSD. We screened 16 compounds of SSD with high oral bioavailability and good drug-likeness properties from the TCMSP database, and predicted their potential targets using PharmMapper. Most of these 16 compounds are present in SSD,4-7 which was supported by our UPLC-Q-TOF-MS result. By overlapping the drug targets and DEGs from TCGA and GEO databases, 33 common targets were identified. These common targets were considered potential therapeutic targets of SSD against breast cancer. KEGG analysis of the 33 common targets revealed that the PPAR signaling pathway was most significantly enriched. Network construction determined 10 hub targets, including EGFR, KIF11, FGFR1, F10, MIF, NR3C2, CFD, MAOB, TYMS, and PPARG (PPARγ). In mammals, a primary function of DNA methylation is to suppress gene expression through increased promoter DNA methylation. 20 According to our bioinformatic results, most of the hub targets showed a significant increase in DNA methylation level and a decrease in gene expression level. We observed that PPARγ was downregulated in patients with breast cancer; high expression of PPARγ was associated with a better prognosis and related with immune infiltration. These findings indicate that restoring PPARγ expression may be a promising therapy for the treatment of breast cancer.
Based on the above results, among the identified hub targets, PPARγ merits particular attention. PPARγ are a subgroup of ligand-activated nuclear receptors that play critical roles in cell cycle regulation, differentiation, apoptosis, and invasion. 21 Recently, an increasing number of pan-PPAR agonists have been developed for different disease treatments, such as cancer.22-24 Both natural and synthetic PPARγ agonists have been implicated in the negative regulation of breast cancer growth and progression. 25 Several previous reports have demonstrated that natural products, including catechin and formononetin, can promote fatty acid catabolism by activating PPARα and PPARγ.26,27 In addition, activation of PPARγ within aberrant breast cancer tumor microenvironment can re-establish antitumor function by enhancing fatty acid catabolism of macrophages. 28 Given that the most of the 16 compounds from SSD have the potential to activate PPARγ, SSD extract may inhibit the growth of breast cancer by targeting PPARγ. To assess this, we first identified that SSD extract can inhibit cell proliferation and induce both apoptosis and G2 cell cycle arrest in breast cancer cells. The PI3K/AKT signaling pathway is a classic pathway involved in the proliferation and differentiation of cells. PPARγ activation can suppress the PI3K/AKT signaling pathway and further exert antitumor effects. 29 The PPARγ agonist pioglitazone reportedly intensified the effects of arsenic trioxide in acute promyelocytic leukemia by suppressing the PI3K/AKT pathway. 30 Based on this, we performed further experimental validation. The findings suggested that the SSD extract can activate PPARγ and inhibit the PI3K/AKT pathway, consistent with the results of our network pharmacology analysis.
Conclusion
In the present study, we used a network pharmacology approach to explore the potential mechanisms of SSD in breast cancer. The findings indicate that the SSD extract might interfere with the progression of breast cancer through multiple signaling pathways, such as PPARγ. This idea was validated by experiments in silico and in vitro. Our results suggest that SSD extract can activate PPARγ, inhibit the PI3K/AKT pathway, induce apoptosis, and induce G2 phase arrest in breast cancer cells. SSD thus has therapeutic potential for the treatment of breast cancer. The applications of network pharmacology are promising in the discovery of targets from medicinal plants.
Materials and Methods
Collection of Compounds and Potential Targets
The compounds in SSD were acquired from the TCMSP database (https://tcmsp-e.com/). 31 They were filtered using cut-offs of oral bioavailability > 40% and drug-likeness > 0.18. Potential targets of the orally active compounds were predicted using PharmMapper (http://www.lilab-ecust.cn/pharmmapper/).14 The top 100 targets of every orally active compound were ranked based on normalized fit score. Only human protein targets were chosen and other arguments were set to default values.
UPLC-Q-TOF-MS Analysis
The dried sample extracts (1 mg/mL) were dissolved in aqueous methanol for UPLC-Q-TOF-MS analysis using an LTQ IT mass spectrometer (Thermo Fisher Scientific, Waltham, MA, USA) equipped with an electrospray interface, RS column compartment, and RS pump (Dionex Corporation, Sunnyvale, CA, USA). Chromatographic separation was performed on a Thermo Fisher Scientific Syncronis C18 UHPLC column (100 × 2.1 mm internal diameter; 1.7-μm particle size), with an injection volume of 2 μL. The mobile phase comprised water (solvent A) with 0.1% formic acid (v/v) and acetonitrile (solvent B) with 0.1% formic acid (v/v) at a flow rate of 0.4 mL/min; the column temperature was 35 °C. The solvent gradient was 5% B for 1 min, increased to 100% B for 20 min, maintained for 2.5 min, decreased to 5% B for 1 min, and maintained at 10% B for the final 3 min. The total run time was 25 min. The mass spectra and photodiode array range in positive mode were tuned for m/z 50–1200 and 200–600 nm, respectively. The collision voltage was 4 V and the source voltage was ± 1 kV.
Identification of DEGs
DEGs were obtained from the GEO database (https://www.ncbi.nlm.nih.gov/geo/) and TCGA database (https://portal.gdc.cancer.gov/).32,33 For the 1097 TCGA breast cancer patients, tumoral RNA-seq data were downloaded from the Genomic Data Commons data portal (TCGA). One hundred thirteen of the tumors also had mRNA expression data of paired normal tissue samples. All data of normal tissue samples were also obtained from GTEx (459 samples). A complete description of the donor genders, multiple ethnicity groups, wide age range, the biospecimen procurement methods and sample fixation is provided in the GTEx and TCGA official annotation. The GSE42568 (GSM1045191-GSM1045311, 17 normal breast samples and 104 breast cancer samples) and GSE124646 (GSM3538397, GSM3538406, GSM3538407, GSM3538416, GSM3538417, GSM3538426, GSM3538427, GSM3538436, GSM3538437, GSM3538446, GSM3538447, GSM3538456, GSM3538457, GSM3538466, GSM3538467, GSM3538476, GSM3538477, GSM3538486, GSM3538487, GSM3538496, 10 normal breast samples and 10 breast cancer samples) datasets were downloaded from the GEO database. The GEO2R online analysis tool (https://www.ncbi.nlm.nih.gov/geo/geo2r/) was used to evaluate DEGs between breast cancer and normal tissue samples. Full details of patients can be found in the original publication of datasets.34,35 ANOVA was used to compare the gene expression levels, and log2 (fold change) > 1 or log2 (fold change) < − 1 (p < 0.05) was considered statistically significant. Venn diagram analysis was used to identify common DEGs between TCGA and GEO datasets.
GO and KEGG Enrichment Analysis
The DAVID database (https://david.ncifcrf.gov/) was used to perform GO enrichment and KEGG pathway analysis.36,37 The top 10 enrichment results were extracted from DAVID. All plots were generated using clusterProfiler. 38
Network Construction
For the compounds-targets network, 16 compounds and 252 potential targets were inputted and visualized using Cytoscape. 39 For the PPI network, 33 common targets were inputted and were constructed using STRING version 11.5 (https://string-db.org/), 40 with the species of the organism limited to “Homo sapiens” and a confidence score > 0.4. For the drug–common target network, the information of PPI and compounds–targets was integrated and visualized by Cytoscape. Compounds and targets are indicated using diamonds and circles, respectively. The CytoHubba plugin of Cytoscape was used to identify targets possessing higher degrees, using the Matthews correlation coefficient method. 41
mRNA Expression and DNA Methylation Level Analyses
The expressions of hub genes in breast cancer were analyzed using GEPIA (http://gepia.cancer-pku.cn/) and UALCAN (http://ualcan.path.uab.edu/) databases. 42 The latter database was also used for the methylation level analysis. The upregulated and downregulated hub genes in breast cancer were further plotted using the GSCALite database (http://bioinfo.life.hust.edu.cn/web/GSCALite/). 43
Kaplan–Meier Plotter Database Analysis
The Kaplan–Meier Plotter (https://kmplot.com/analysis/) web service was used to analyze the association between hub gene expression and survival in patients with breast cancer. 44 The patients were split using auto selection, following which the hazard ratio with 95% confidence intervals and log-rank p-values were computed.
Immunological Analysis
TISIDB (http://cis.hku.hk/TISIDB/) is a web portal that integrates multiple heterogeneous data types to identify the tumor and immune system interactions. 15 The enrichment data of 28 immune cells and 24 immunoinhibitors provided by TISIDB were assessed to ascertain its relationship with the expression of hub genes in breast cancer.
Molecular Docking
Molecular docking studies were performed using AutoDock Vina. 45 The crystal structures of 10 hub targets were downloaded in PDB format from the RCSB Protein Data Bank (http://www.rcsb.org/). 46 The PDB IDs are 6fuj (CFD), 5d41 (EGFR), 4y76 (F10), 4zsa (FGFR1), 3cjo (KF11), 6rkb (MAOB), 6cbf (MIF), 3vhv (NR3C2), 6d3e (PPARG), 5j7w (TYMS), respectively. All ligands and receptors were prepared using AutoDock Tools. 47 The docking box was defined as the center based on the original ligands, with a radius of approximately 10–50 Å. The best docking scores of each compound to the hub targets were ranked and plotted as a beeswarm plot. The poses of the compounds with the best binding affinity to the hub targets were generated using PyMOL (http://pymol.org).
MTT Assay
The cell viability of BT-549 and MCF-7 cells was assessed by the MTT assay. Cells (5000 cells/well in 96-well plates) were treated with different concentrations of crude alcoholic extract of SSD and incubated at 37 °C for 48 h. The thiazolyl blue (MTT) solution was added and incubated with cells for another 4 h. Cell viability was detected using a model DTX880 spectrophotometer (Beckman Coulter, Brea, CA, USA) at 490 nm.
Cell Apoptosis
The FITC (fluorescein isothiocyanate) Annexin V Apoptosis Detection Kit (BD Biosciences, San Jose, CA, USA) was used for apoptosis analysis. Cells treated with SSD extract were harvested and resuspended in 1 × Binding Buffer. The cell suspension was incubated with propidium iodide (PI) and FITC Annexin V. After 15 min, staining was terminated with 400 µL of 1 × Binding Buffer. Cells were analyzed using flow cytometry (BD Biosciences, Franklin Lakes, NJ, USA).
Cell Cycle Distribution Analysis
Cells were cultured in 6-well plates and treated with SSD extract for 48 h. The cells were harvested and fixed with 70% ethanol at 4 °C for 24 h. Next, the cells were washed with PBS and incubated with RNase solution for 30 min at room temperature. The cell cycle distribution was assessed using PI staining and detected by a FACSalibur flow cytometer (BD Biosciences).
Western Blot
After being treated with SSD extract for 48 h, the cells were lysed and boiled for 10 min. Subsequently, proteins were separated by SDS-PAGE then transferred to a polyvinylidene fluoride (PVDF) membrane. After being blocked in 5% dry milk in Tris-buffer saline Tween (TBST) for 1.5 h and washed with 1 × TBST, the PVDF membrane was treated with the following primary antibodies purchased from Beyotime (Shanghai, China) or Cell Signaling Technologies (Danvers, MA, USA): PPARγ, PI3K, p-AKT, AKT, and glyceraldehyde 3-phosphate dehydrogenase. The ECL western blotting detection reagents were purchased from Thermo Fisher Scientific, and further analysis was conducted in ChemiDoc MP (Bio-Rad, Hercules, CA, USA).
Statistical Analysis
Data were analyzed using a 2-tailed, unpaired Student's t-test. The p-values are indicated in the figures (* p < 0.05; ** p < 0.01; *** p < 0.001).
Supplemental Material
sj-docx-1-npx-10.1177_1934578X221077820 - Supplemental material for Network Pharmacology-Based Strategy to Investigate the Anti-Breast Cancer Mechanisms of Spatholobus suberectus Dunn
Supplemental material, sj-docx-1-npx-10.1177_1934578X221077820 for Network Pharmacology-Based Strategy to Investigate the Anti-Breast Cancer Mechanisms of Spatholobus suberectus Dunn by Bo Fang, Guijae Yoo, Phil Jun Lee, Yinda Qiu, Sung Hoon Lee and Ji Shin Lee, Hee Min Yoo, Namki Cho in Natural Product Communications
Footnotes
Declaration of Competing Interest
The authors declare no conflict of interest.
Acknowledgments
The authors are grateful to the Center for Research Facilities at Chonnam National University for their assistance in the analysis of the organic structure (FT-NMR, HRTOFMS).
Funding
This research was supported by a grant (HCRI21014) Chonnam National University Hwasun Hospital Institute for Biomedical Science, funded by Chonnam National University (Grant number : 2020-3844). It was also supported by the Main Research Program (E0210300) of the Korea Food Research Institute (KFRI), funded by the Ministry of Science.
Ethical Approval
Ethical Approval is not applicable for this article.
Statement of Human and Animal Rights
This article does not contain any studies with human or animal subjects.
Statement of Informed Consent
There are no human subjects in this article and informed consent is not applicable.
Trial Registration
Not applicable, because this article does not contain any clinical trials.
Supplemental Material
Supplemental material for this article is available online.
References
Supplementary Material
Please find the following supplemental material available below.
For Open Access articles published under a Creative Commons License, all supplemental material carries the same license as the article it is associated with.
For non-Open Access articles published, all supplemental material carries a non-exclusive license, and permission requests for re-use of supplemental material or any part of supplemental material shall be sent directly to the copyright owner as specified in the copyright notice associated with the article.