
Abstract
Houttuynia drugs, including sodium houttuyfonate (SH) and sodium new houttuyfonate (SNH), are derivatives of the active ingredient of Houttuynia cordata, which can be used as both a vegetable and medicine in China. We aimed to explore the regulation effects of SH and SNH on the gut microbiota and production of inflammatory factors in mice. Here, we found that SH and SNH led to an increase in the production of interferon gamma and nuclear factor κ, and decreased the production of lipocalin-2 in the mice. The alpha diversity results of gut microbiota of the mice showed that the gut microbiota of the SH, SNH, and azithromycin treatment groups were significantly different from the control group, but the effects of reduced abundance and diversity of the SH and SNH groups were relatively lower than that of the azithromycin group. The beta diversity results indicated that the samples of each group were significantly grouped, and distribution of SH and SNH groups was more similar to the control group than the azithromycin group. Furthermore, SH and SNH groups had significant differences in the abundance of specific bacteria such as Escherichia–Shigella and Odoribacter, which might be associated with the increase of inflammatory factors. Therefore, our results suggested that SH and SNH may significantly affect the gut microbiota and production of inflammatory factors in the mice.
Recently, the study of gut microbiota is attracting a lot of attention in the field of disease occurrence and drug action mechanism. 1 According to current progress on intestinal flora, the largest microbial inventory is found in the distal gastrointestinal tract, where intestinal microorganisms interact with host immune cell populations on the mucosal surface. 2,3 Numerous studies have found that more than 30 diseases are associated with intestinal flora, such as obesity, diabetes, intestinal inflammation, and colorectal cancer. 4 -6 Furthermore, the focus of previous studies has been gradually shifted from individual bacteria (pathogens), such as Lactobacillus, Bifidobacteria, and Escherichia coli, to the overall situation of intestinal flora. 4,5 As a natural barrier to prevent intestinal flora from entering the body, the intestinal mucosa is the body’s first line in its immune defense system. 7 Several studies have concluded that oral administration of antibiotics and other drugs can cause intestinal mucosal injury and subsequently inflammation. Resistance of pathogens to commonly applied antibiotics also keeps emerging. 8,9
Houttuynia cordata Thunb. (Saururaceae) is a vegetable with a fishy taste, which is widely consumed in southern China, and is also a traditional Chinese medicine for antimicrobial, anti-inflammatory, cough-relieving, and immune-enhancing medical applications. 10 Sodium houttuyfonate (SH) is a monomeric drug (Figure 1(A)) chemically synthesized from sodium sulfite and houttuyfonate, which is the active ingredient of H. cordata. 11,12 Due to the unstable chemical structure of SH, its derivative, sodium new houttuyfonate (SNH) (Figure 1(A)), has been synthesized with improved stability by adding 2 extra -CH2 groups. SH and SNH are commonly applied for antimicrobial and anti-inflammatory treatment in China. Previous studies by our research group found that SH had antibacterial and antifungal effects in vivo and in vitro, 13,14 and had a promising inhibitory effect on the biofilm formation of Pseudomonas aeruginosa and Candida albicans. 15,16 Both SH and SNH were found to have mild antimicrobial activities with relatively high antibacterial minimum inhibitory concentration values in vitro. 15,16 In addition, floating bed cultivation with H. cordata can significantly alter the gut microbiota of tilapia and enhance the immune response. 17 The possible therapeutic effect of SH and SNH and the effect of H. cordata on human health might be involved with immunity regulation by affecting intestinal flora, which may be worth further investigation.

Effects of SH and SNH on weight and production of IFN-γ, NF-κB, and LCN2 in mice. (A) Chemical structure of SH and SNH; (B) comparison of body weight of different drug treatment groups; (C), (D), (E) comparison of concentration of IFN-γ, NF-κB, and LCN2 in serum; (F) comparison of concentration of LCN2 in colon supernatant. K group represents the control group without any drug treatment. *P < .05, **P < .01, and ***P < .001 mean significance of drug treatment groups compared with the control group. AZM, azithromycin; IFN-γ, interferon; LCN2, lipocalin-2; NF-κB, nuclear factor κB; SH, sodium houttuyfonate; SNH, sodium new houttuyfonate.
Here, we investigated the effects of SH and SNH on the composition of intestinal bacterial flora and production of inflammatory factors of mice to explore the effects of SH and SNH on gut microbiota and the immune system.
Results and Discussion
Body Weight Changes of Mice
After drug treatment, the diet intake and excretion of mice in each group were not found to be significantly different. With the increase of feeding time, the body weight of the mice in each group showed a slight upward trend (Figure 1(B)). Compared with the control group, body weight in the drug treatment groups was not significantly changed (Figure 1(A)). Thus, there were no significant differences in the general conditions between the SH, SNH, azithromycin (AZM), and control groups.
Production of IFN-γ and NF-κB
The production of interferon gamma (IFN-γ), nuclear factor κB (NF-κB) and lipocalin-2 (LCN2) by mice was determined by enzyme-linked immuno sorbent assay (ELISA). The results showed (Figure 1(C) and (D)) that compared with the control group, the production of IFN-γ was significantly increased in the drug treatment groups, especially in the SH and SNH groups. The production of NF-κB in the SH group was significantly higher than that in the control group, but there was no significant difference between the SNH and control groups. In addition, we found that production of LCN2 in serum of the drug treatment groups was lower than that of the control group. Comparing with the control group, only LCN2 content in the colon supernatant samples of SH group was significantly lower. Thus, SH and SNH, especially SH, can effectively increase the production of IFN-γ and NF-κB, and decrease the production LCN2 in mice.
IFN-γ is one of the key factors in the inflammatory response. 18 Activated antigenic presenting cells (APC) and Th1 cells can produce IFN-γ, which can continue the promotion of the proliferation and differentiation of Th1 cells, thereby amplifying the immune effect. Meanwhile, IFN-γ can enhance the expression of major histocompatibility antigen and other molecules in APC to promote the presentation of antigens, and act on B cells for humoral immunity. The nuclear transcription factor, NF-κB, responds to harmful cellular stimuli, and is involved in the regulation of the early inflammatory response. 19 Most infectious bacteria can bind to receptors such as Toll-like receptors, activating the NF-κB pathway to change gene expression for inducing an inflammatory response. Here, we found that SH and SNH, especially SH, had a positive regulatory effect on the production of IFN-γ and NF-κB. LCN2 in the intestinal tract regulates the composition of the gut microbiota and shows anti-inflammatory activities. 20,21 However, our present results indicate that SH and SNH might repress the production of LCN2.
Analysis of Alpha Diversity Index
The microbial diversity of mouse feces was examined by high-throughput 16 s rDNA sequencing assay, and the whole Taxon number was counted as follows: Domain:1, Kingdom:1, Phylum: 11, Class: 21, Order: 32, Family: 53, Genus: 128, Species: 231, Operational taxonomic unit (OTU): 641. According to the analysis of the alpha diversity index among the groups as shown in Figure 2(A) and (B), the Sobs diversity index had a significant difference between the drug treatment groups and the control group. The Sobs index of all the drug treatment groups was significantly lower than that of the control group. However, the Sobs index of AZM was much lower than those of the SH and SNH groups suggesting that the overall influences of SH and SNH on the abundance of intestinal flora were much lower than that of AZM.

Alpha diversity analysis of gut microbiota. (A) Sobs diversity index histogram; (B) Sobs diversity test group t-test histogram. K group represents the control group without any drug treatment. **P < .01 and ***P < .001 mean significance of drug treatment groups compared with the control group. AZM, azithromycin; SH, sodium houttuyfonate; SNH, sodium new houttuyfonate.
Analysis of Beta Diversity Index
Partial least-squares discriminant analysis (PLS-DA) can be used to analyze the beta diversity of gut microbiota. 22,23 The PLS-DA results of beta diversity index (Figure 3) showed that the samples of AZM, SH, SNH, and control groups were clearly distinguished, indicating that the composition of intestinal flora of the 4 groups was significantly different. In addition, in levels of Component 2 (9.83%) and Component 1 (7.78%), the samples of the control group were arranged more closely to those of the SH and SNH groups, while the samples of the AZM group were distributed more distantly from these 3 groups. Thus, the beta diversity analysis results suggested that the overall composition of intestinal flora of SH and SNH groups was different from the control and AZM groups, and was closer to the control group than the AZM group.

Partial least-squares discriminant analysis of beta diversity of gut microbiota. K group represents the control group without any drug treatment. Each dot represents fecal samples of different treatments. K group represents the control group without any drug treatment. AZM, azithromycin; SH, sodium new houttuyfonate; SNH, sodium new houttuyfonate.
Analysis of Species Composition of Gut Microbiota
To explore further the species composition changes of gut microbiota, we analyzed the phylum and genus level of bacterial compositions of the different groups. The Venn diagram (Figure 4(A)) showed that the compositions of the 4 groups of bacteria at the genus level are different. Compared with the control group (117 species), the species diversity levels in the 3 drug treatment groups were all decreased, but the AZM group (98 species) showed a more significant decline compared with the control group, while the SH (106 species) and SNH groups (106 species) showed a relatively smaller decline. The community bar diagram (Figure 4(B)) showed that the dominant bacterial groups of the 4 groups were equal at the phylum level, which were Firmicutes and Bacteroidetes, respectively. The phylum composition results indicated that the detailed composition of the gut microbiota of the SH and SNH groups was closer to the control group than the AZM group.

Analysis of species composition of gut microbiota. (A) Venn diagram; (B) community bar histogram at phylum level; (C) community bar histogram at genus level; (D) circos diagram of sample and species relationship. K group represents the control group without any drug treatment. AZM, azithromycin; SH, sodium new houttuyfonate; SNH, sodium new houttuyfonate.
The community bar diagram at the genus level (Figure 4(C)) and circos diagram of sample and species relationship (Figure 4(D)) showed that the top 10 dominant bacteria in the community of the fecal sample (genus level) were Norank_f_bacteroidales_S24-7_group, Lactobacillus, Bacteroides, Prevotellaceae_UCG_001, Lachnospiraceae_NK4A136_group, Alloprevotella, unclassified_f_Lachnospiraceae, norank_f_Lachnospiraceae, Candidatus_Saccharimonas, and Alistipes. The genus composition results (Figure 4(D)) also consistently indicated that the detailed composition of gut microbiota of the SH and SNH groups was more close to that of the control group than the AZM group at the genus level. Combining these results, we found that the effects of SH and SNH on the composition of gut microbiota were less than those of AZM.
Analysis of Species Abundance Differences
By combining the community bar histogram and the multispecies comparison histogram, the differences in each flora from phylum to genus level are shown in Figure 5. Multispecies comparison at the phylum level (Figure 5(A)) showed that among all 11 phyla, 5 in all the 4 groups had a relative abundance greater than 0.1%, while Proteobacteria and Actinobacteria were found in those with significant differences between groups (P < .05). Meanwhile, compared with the control group, the relative abundance of Bacteroidetes in the SH and SNH groups was reduced, while that of Proteobacteria was increased. In order to identify further the diversity differences and related categories at the genus level and multidimensional bacteria in each group, the LEfSe (linear discriminant analysis [LDA] = 3) method was used for analysis in Figure 5(B) and (C). At the phylum level (Figure 5(C)), except for differences in Proteobacteria and Actinobacteria, there were also significant differences in the Bacteroidetes. Further analysis of the differences in each group at the genus level showed that 63 of 128 genera are more than 0.1% of abundance in the 4 groups. Combining (Figure 5(B) and (C)), there were 5 species with significant differences (P < 0.05) in the most abundant 20 genera, as follows: norank_f_bacteroidales_S24-7_group, Odoribacter, Escherichia–Shigella, Helicobacter and Rikenellaceae_RC9_gut_group. Among them, the abundance of Gram-negative bacteria Escherichi-Shigella and Odoribacter was most significant, increasing in both the SH and SNH groups (P < .001), which may be linked to the inflammatory response in mice.
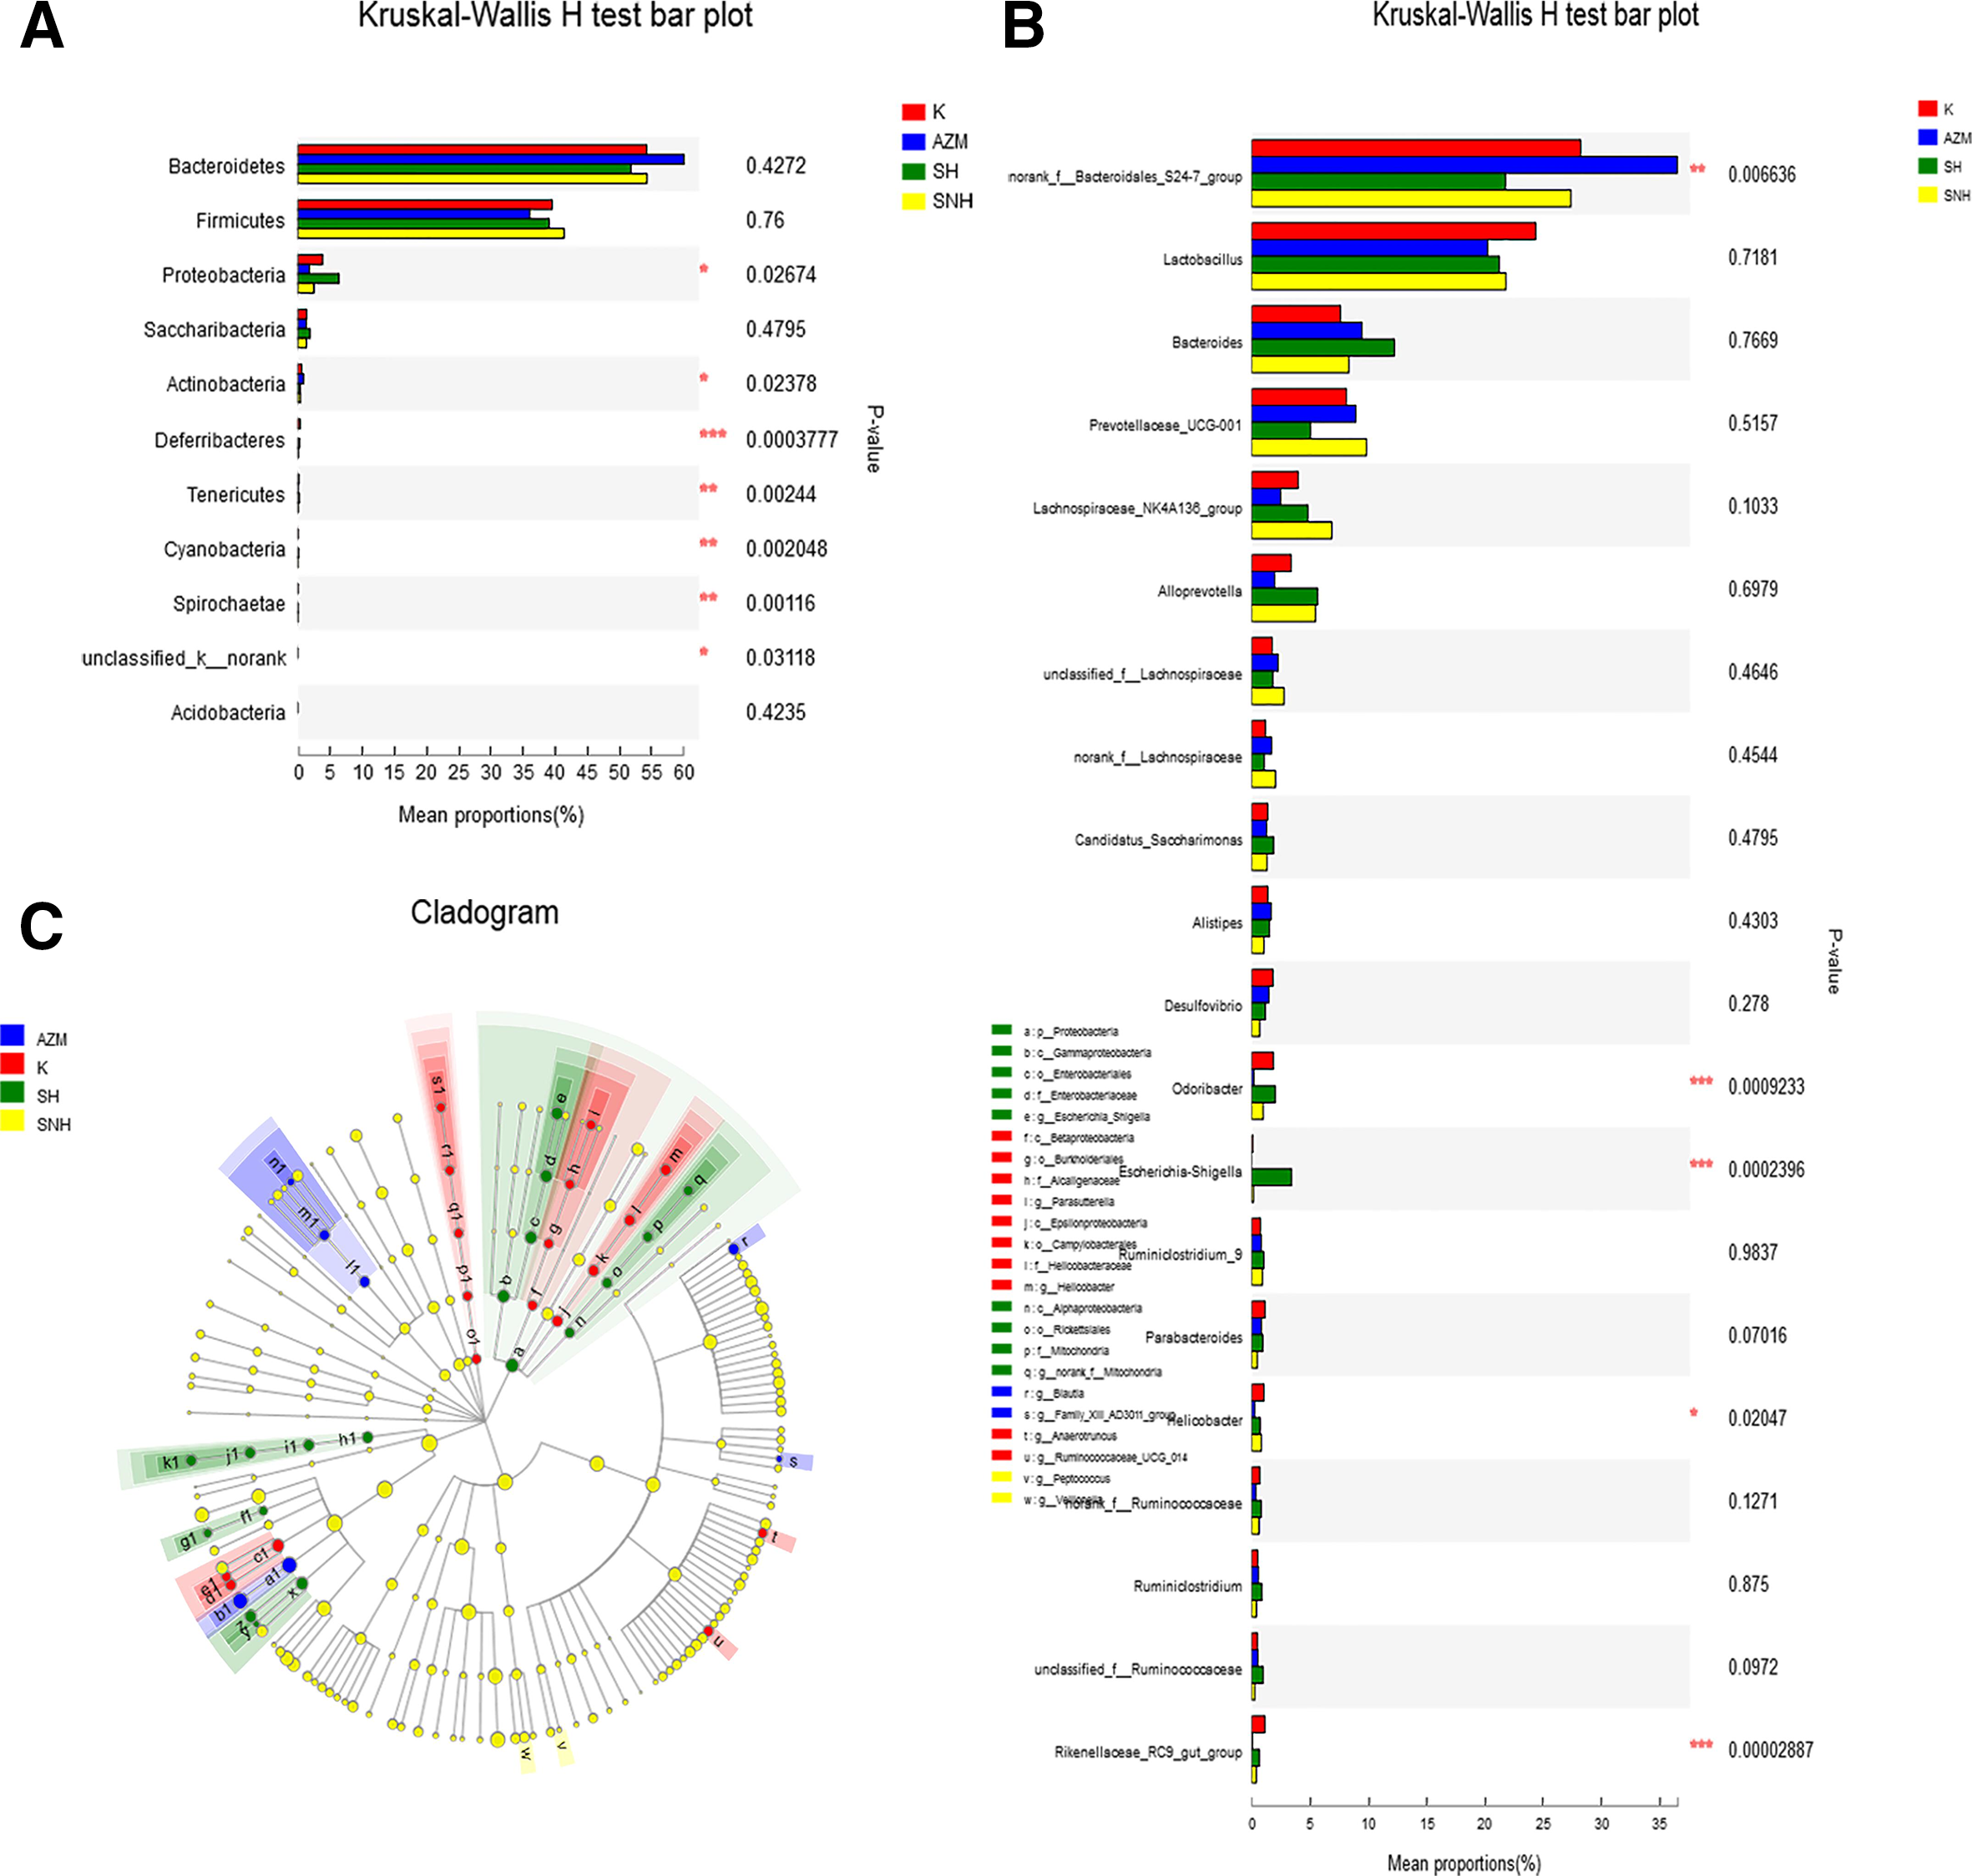
Multi-species abundance comparison of gut microbiota. (A): Phylum level comparison; (B): genus level comparison; (C): multilevel species hierarchy tree diagram for LEfSe analysis (LDA = 3). K group represents the control group without any drug treatment. *P < 0.05, **P < 0.01 and ***P < 0.001 mean significance of drug treatment groups compared with the control group. AZM, azithromycin; LDA, linear discriminant analysis; SH, sodium houttuyfonate; SNH, sodium new houttuyfonate.
Our previous studies had found that due to the similarity in the chemical structures of SH and 3-oxo-C12-HSL, which is the key signal molecule of the quorum sensing regulatory system of the Gram-negative bacterium Pseudomonas aeruginosa, SH may specifically inhibit the biofilm formation and production of virulence factors controlled by the quorum sensing system. 16 Here, we found that SH and SNH can significantly affect the abundance of specific Gram-negative bacteria such as Escherichia–Shigella and Odoribacter, which are also regulated by a similar quorum sensing system as that of P. aeruginosa. 24,25 Several studies had shown that intestinal flora can regulate the immune response of the mucosal immune system in normal physiological state and infection. 4 -6 The components of the cell wall of Escherichia–Shigella and Odoribacter might activate the APC to produce NF-κB and IFN-γ. 26,27 Notably, we found that Escherichia–Shigella and Odoribacter have the most significant difference (P < .001), with a significant increase in both the SH and SNH groups. However, we found that SH and SNH cannot upregulate the production of LCN2, which can govern the composition of gut microbiota and exhibit proinflammatory milieu. These results suggested that the regulatory effects of SH and SNH might be independent of LCN2. Therefore, we speculated that in comparison with AZM, SH and SNH had different antimicrobial mechanisms, which might be related to intestinal mucosal immune regulation.
SH and SNH are derivatives of the active compounds of Houttuynia, which is a widely consumed vegetable for its unique taste, and which has been used as a clinical antimicrobial under certain situations, in addition to the application of antibiotics in traditional Chinese medicine. Our results suggest that the anti-infection effect of SH or SNH may be due to their effect on the composition of intestinal flora, and the activation of the activity of immune cells in the gut mucosal immune tissue by producing inflammatory factors to prevent infection by enhancing the host body’s immune function. To explore the details of the effects of SH and SNH on the gut microbiota of mammals, metagenomic and metabolomic research should be performed to determine the specific bacterial species and metabolites in the gut treated by SH or SNH. Assays of intestinal pathological and immune cells may be also performed to investigate the effects of SH or SNH on the immune system. Furthermore, genetically modified mice, including IFN-γ knockout mice, are worth adopting for further investigation of this antimicrobial mechanism of SH and SNH. Our presented results may shed light on the specific mechanism of SH and SNH affecting intestinal flora to adjust the anti-infection immune function.
We have found that the production of inflammatory factors, including IFN-γ and NF-ΚB, in SH and SNH treatment groups were upregulated compared with the control group. The alpha diversity analysis results of gut microbiota showed that the gut microbiota of SH, SNH, and AZM groups were significantly different from the control group, but the effects of reducing abundance and diversity in the SH and SNH groups in comparison with the control group were lower than the AZM group. The beta diversity results of PLS-DA analysis indicated that the samples of each group were clearly grouped, and the distribution of SH and SNH groups were similar to the normal group, suggesting that SH and SNH can significantly change the composition of intestinal flora. Through species composition and difference analysis, we found that the SH and SNH groups had significant differences for several bacteria of the intestinal flora, especially Escherichia–Shigella and Odoribacter, which may lead to an increase in inflammatory factors.
In conclusion, the presented results suggest that SH and SNH can affect the intestinal flora and regulate the immune function in mice. Our findings may benefit the clarification of the effective mechanism of medicine and food plants and further promote the popularization and application of SH and SNH, and could provide a theoretical basis for further clinical application of SH and SNH.
Experimental
Animal Experiments
Animal experiments were conducted with the approval of the Experiment Animal Ethics Committee of Anhui University of Chinese Medicine. Healthy female KM mice (8 weeks old, weight of 22 ± 5 g) were obtained from Changzhou Cavens Experimental Animal Co., Ltd. (Changzhou, China), and raised in SPF environmental facilities with free diet; the animal’s drinking water was sterilized in a high-pressure steam autoclave. SH (K184524, Kailai, Xi’an, China) and SNH (S31508, Shanghai Yuanye Bio, Shanghai, China) were prepared as described previously. 15,17 AZM (R72188, Pfizer NY, USA) was dissolved in sterilized water to the needed concentration (10 mg/mL). Sixty mice were randomly divided into 4 groups: control (K group), AZM group, SH group, and SNH group, with 15 mice in each group. Adaptive feeding was performed for 5 days. Mice in the control group were given intragastric administration of 0.2 mL normal saline each time once a day. Based on the information provided by the doctor of the infection division, the doses of SH, SNH, and AZM in the human clinic are 41, 41, and 14 mg/kg, respectively. According to the pharmacological test methodology to calculate the equivalent dose in mice by multiplying by 9.1-fold of the human dose, the corresponding amounts of drug were as follows: AZM 100 mg/kg, SH 400 mg/kg, and SNH 400 mg/kg. The mice in the drug treatment groups were given the corresponding concentration of drugs once a day for 3 weeks by intragastric administration. During the drug treatment process, changes in the spirit and posture of the mice were observed every day, and their weight was measured every 5 days to observe any possible changes in body weight.
Collection and Treatment of Serum and Colon Supernatant Samples
The mice were sacrificed by cervical dislocation with 2% amobarbital sodium. The eyeballs were taken and the blood collected, allowed to stand for 2 hours, and centrifuged at 1580×g for 10 minutes. Then, the mice were dissected, the colon segment removed, and washed with normal saline. Colon tissues of mice (100 mg) were added to phosphate-buffered saline (1 mL), and centrifuged at 1580×g for 10 minutes to obtain the supernatant. The obtained serum and colon supernatant samples were stored at −80 °C for later use. According to the manufacturer’s protocol, concentrations of IFN-γ, NF-κB, and LCN2 were determined using an ELISA kit, purchased from RUIXIN Biotech (Quanzhou, China), on a microplate reader (Labserv K3, Thermo Scientific, Wilmington, DE, USA).
Collection and Treatment of Fecal Samples
The feces of mice were collected 12 hours after the last intragastric administration. The feces were precisely discharged into a sterile sampling tube to avoid urine contamination. Feces (3-5), 50‐100 mg, were taken from each mouse, and covered tightly, then frozen in liquid nitrogen and stored at −80 °C. The samples with dry ice were sent to Shanghai Meiji Biomedical Technology Co., Ltd. (Shanghai, China) for 16S rDNA sequencing.
DNA Extraction and PCR Amplification
Microbial DNA was extracted from the fecal samples using the E.Z.N.A. Soil DNA Kit (Omega Bio-Tec, Norcross, GA, USA), according to the manufacturer’s protocols. The final concentration and purity of the DNA were determined using a NanoDrop 2000 UV-vis spectrophotometer (Thermo Scientific, Wilmington, DE, USA). DNA quality was checked by 1% agarose gel electrophoresis. V3-V4 hyper variable regions of the bacterial 16S rDNA gene were amplified with primers 338F (5′-ACTCCTACGGGAGGCAGCAG-3′) and 806R (5′-GGACTACHVGGGTWTCTAAT-3′) by a thermocycler polymerase chain reaction (PCR) system (Gene Amp 9700, ABI, Wilmington, DE, USA). The PCR was conducted using the following program: 3 minutes of denaturation at 95 °C, 27 cycles of 30 seconds at 95 °C, 30 seconds for annealing at 55 °C, 45 seconds for elongation at 72 °C, and a final extension at 72 °C for 10 minutes. PCRs were performed in triplicate in 20 µL mixtures containing 4 µL of 5× Fast Pfu Buffer, 2 µL of 2.5 mM dNTPs, 0.8 µL of each primer (5 µM), 0.4 µL of Fast Pfu Polymerase, and 10 ng of template DNA. The resulting PCR products were extracted from a 2% agarose gel and further purified using an AxyPrep DNA Gel Extraction Kit (Axygen Biosciences, Union City, CA, USA) and quantified using Quanti Fluor-ST (Promega, Madison, WI, USA), according to the manufacturer’s protocol.
Illumina MiSeq Sequencing
Equimolar amounts of purified PCR amplicons were pooled and paired-end sequenced (2 × 300 bp) on an Illumina MiSeq platform (Illumina, San Diego, CA, USA) according to standard protocols of the Majorbio Bio-Pharm Technology Co. Ltd. (Shanghai, China). The raw reads have been deposited in the NCBI Sequence Read Archive (SRA) database (Accession Number: SRP212382).
Processing of Sequencing Data
Raw fastq files were demultiplexed, and quality-filtered by Trimmomatic 28 and merged by FLASH 29 with the following criteria: (i) The reads were truncated at any site receiving an average quality score <20 over a 50 bp sliding window. (ii) Primers were exactly matched allowing 2 nucleotide mismatching, and reads containing ambiguous bases were removed. (iii) Sequences whose overlap was longer than 10 bp were merged according to their overlap sequences.
OTUs were clustered with 97% similarity cutoff using UPARSE (version7.1 http://drive5.com/uparse/) and chimeric sequences were defined and removed using UCHIME. 30 The taxonomy of each 16S rRNA gene sequence was analyzed by the RDP Classifier algorithm (http://rdp.cme.msu.edu/) against the Silva (SSU123) 16S rRNA database 31 using a confidence threshold of 70%. Further analyses, ie, alpha diversity, beta diversity, species composition, and species abundance differences, were performed by online platform of Majorbio I-Sanger Cloud Platform (https://www.i-sanger.com/).
Statistical Analysis
All data were analyzed and processed by SPSS 17.0 statistical software. Student’s t-test and one-way analysis of variance test were used to compare the differences between groups. P <.05 was regarded as a statistically significant difference.
Footnotes
Acknowledgments
The authors thank Shanghai Meiji Biomedical Technology Co., Ltd. for assistance with 16S rDNA sequencing and bioinformatics analysis. The authors thank Longfei Mei for help with the animal experiment.
Statement of Human and Animal Rights
All the experimental procedures involving animals were conducted in accordance with the Experimental Animal Ethics Committee of Anhui University of Chinese Medicine approved protocols.
Declaration of Conflicting Interests
The author(s) declared no potential conflicts of interest with respect to the research, authorship, and/or publication of this article.
Funding
The author(s) disclosed receipt of the following financial support for the research, authorship, and/or publication of this article: This work was supported by the project funded by Project funded by China and Anhui Province Postdoctoral Science Foundation under Grant No. 2019M662185 and No. 2019B346, the National Natural Science Foundation of China under Grant No. 81603167, the Outstanding Talent Support Program in University (Key project) of Anhui Province under Grant No. gxyqZD2020024 and the Natural Science Foundation (Key project) of Anhui University of Chinese Medicine under Grant No.2020zrzd07.