
Abstract
Background:
Painful diabetic peripheral neuropathy (pDPN) is a debilitating complication of long-term diabetes. High-frequency spinal cord stimulation (HF-SCS) was recently shown to be an effective treatment option, but the associated healthcare resource utilization (HCRU) on real-world patient populations with pDPN is unknown.
Methods:
Using IBM MarketScan databases, we identified patients with HF-SCS implantation between January 2016 and December 2019 who had a diagnosis of diabetes or diabetic neuropathy within two years before implant. Cost data were collected for the six months before HF-SCS implantation (baseline) and for the periods of one, three, and six months post-implantation. The six-month explant rate was calculated.
Results:
A total of 132 patients met inclusion criteria. The median total cost at baseline was $19 220 and was $1356 at one month post-implant, $4858 at three months post-implant, and $13 305 at six months post-implant. The median baseline out-of-pocket cost was $1477 and was $710 at six months post-implant. The average total cost reduction from baseline to six months post-implant was $5118 (P < .001), or $853 per month. The median device acquisition cost was $35 755. The explant rate within six months was 2.1%.
Conclusions:
High frequency spinal cord stimulation significantly reduces total HCRU in patients with pDPN, and based on the average monthly cost reduction of $853, we estimate that the therapy recoups acquisition costs within 3.5 years. As policy increasingly focuses on value-based care, it will be critical to consider the cost and outcomes of innovative therapies.
Keywords
Introduction
Diabetes mellitus is a chronic disease that affects more than 8% of the US population and results in annual treatment costs of approximately $174 billion. 1 Sensorimotor neuropathy is the most common complication, 1 and approximately 23% of patients with diabetes will develop painful diabetic peripheral neuropathy (pDPN), a debilitating chronic neuropathic pain condition associated with significant increases in opioid use, 2 even though it is not a first-line treatment for pDPN. 3 Painful diabetic peripheral neuropathy patients also have increased odds of antiepileptic (ie, pregabalin, hydantoin derivative) and antidepressant (ie, serotonin norepinephrine reuptake inhibitor) use. 2 While many of these classes of medications are approved for treatment of pDPN, 4 pharmacologic treatment is often unsuccessful, with research finding that only one third of patients adequately respond to medical therapy 4 and that many patients require multiple drug regimens before finding one that provides relief.4,5
In addition, pDPN is associated with a 16-fold increase in amputation risk, an 87% increase in infections, and a 20% to 30% increase in costs compared with patients with diabetes who do not have neuropathy. 2 In addition, patients with chronic pain frequently experience insomnia, depression, and decreased functioning. 6 While treatable, many patients continue to experience insufficient relief as a result of negative attitudes toward opioid prescription, insufficient physician-patient communication, and other similar barriers. 7
While pharmacologic treatment can be effective for some, many patients experience persistent pain despite conservative management. Spinal cord stimulation (SCS) is a type of neurostimulation in which electrodes deliver electrical impulses to specific areas of the spinal cord to modulate the central nervous system’s processing of pain signals. In addition, this treatment has the benefit of lowering patients’ medication intake, 8 potentially avoiding unwanted side effects. High frequency spinal cord stimulation (HF-SCS, using frequencies around 10 kHz) is a relatively new technology that may be more effective than traditional SCS in treating certain types of chronic pain and additionally does not produce parasthesias seen with traditional SCS. 9
While SCS may provide comparable or superior pain control to conservative management and may reduce adverse medication effects, concerns remain about the technology’s healthcare resource utilization (HCRU).10,11 While existing research indicates that SCS is cost-effective over time,12,13 these studies focus on populations outside the United States and on patients with specific pain diagnoses, such as post-laminectomy syndrome or complex regional pain syndrome,14 -16 but there is very limited research on its cost-effectiveness for patients with pDPN. 17 In addition, there is a dearth of literature on the cost efficiency of HF-SCS in particular. Studies comparing the costs of HF-SCS and traditional SCS have found that high-frequency stimulation was more cost-effective, but these studies were limited to patients with failed back surgery syndrome and chronic back and leg pain.18,19 To address this knowledge gap, we present a claims-based analysis of the HCRU associated with HF-SCS therapy for pDPN in the United States.
Methods
Data Source
We used the IBM MarketScan® research databases to conduct a retrospective analysis of the HCRU for patients with pDPN before and after treatment with HF-SCS. This included information from the Commercial Claims and Encounters, Medicare Supplemental and Coordination of Benefits, and Medicaid Multi-State databases. Procedures and diagnoses were identified through a combination of Healthcare Common Procedure System (HCPCS), International Classification of Diseases, 9th and 10th revisions, and Current Procedural Terminology (CPT) codes (Supplementary Table 1) between January 1, 2016, and December 31, 2019.
Study Design and Outcomes
Patients with HF-SCS implantation were identified in the database using HCPCS code C1822. Adult patients with pDPN were identified as those patients ≥18 years old with a diabetes or diabetic neuropathy diagnosis within two years prior to HF-SCS implantation (codes in Supplementary Table 1). Since all patients underwent HF-SCS implantation, it was assumed that pDPN was the principal cause of their pain. Patients with a diagnosis of low back pain without a neuropathy diagnosis were also excluded, as this represents a distinct indication for HF-SCS therapy. 20 Other exclusion criteria included the lack of at least six-month pre-implant and one-month post-implant continuous enrollment to ensure the sample was not biased by missing data, pregnancy or cancer during the study period, use of capitated insurance plans (as these patients do not have fluctuating costs based on differential resource utilization), incomplete outpatient pharmacy data, and invalid (defined as negative aggregated cost by service/prescription date) service or pharmacy claims. A consort diagram outlining patient selection is available in Figure 1.
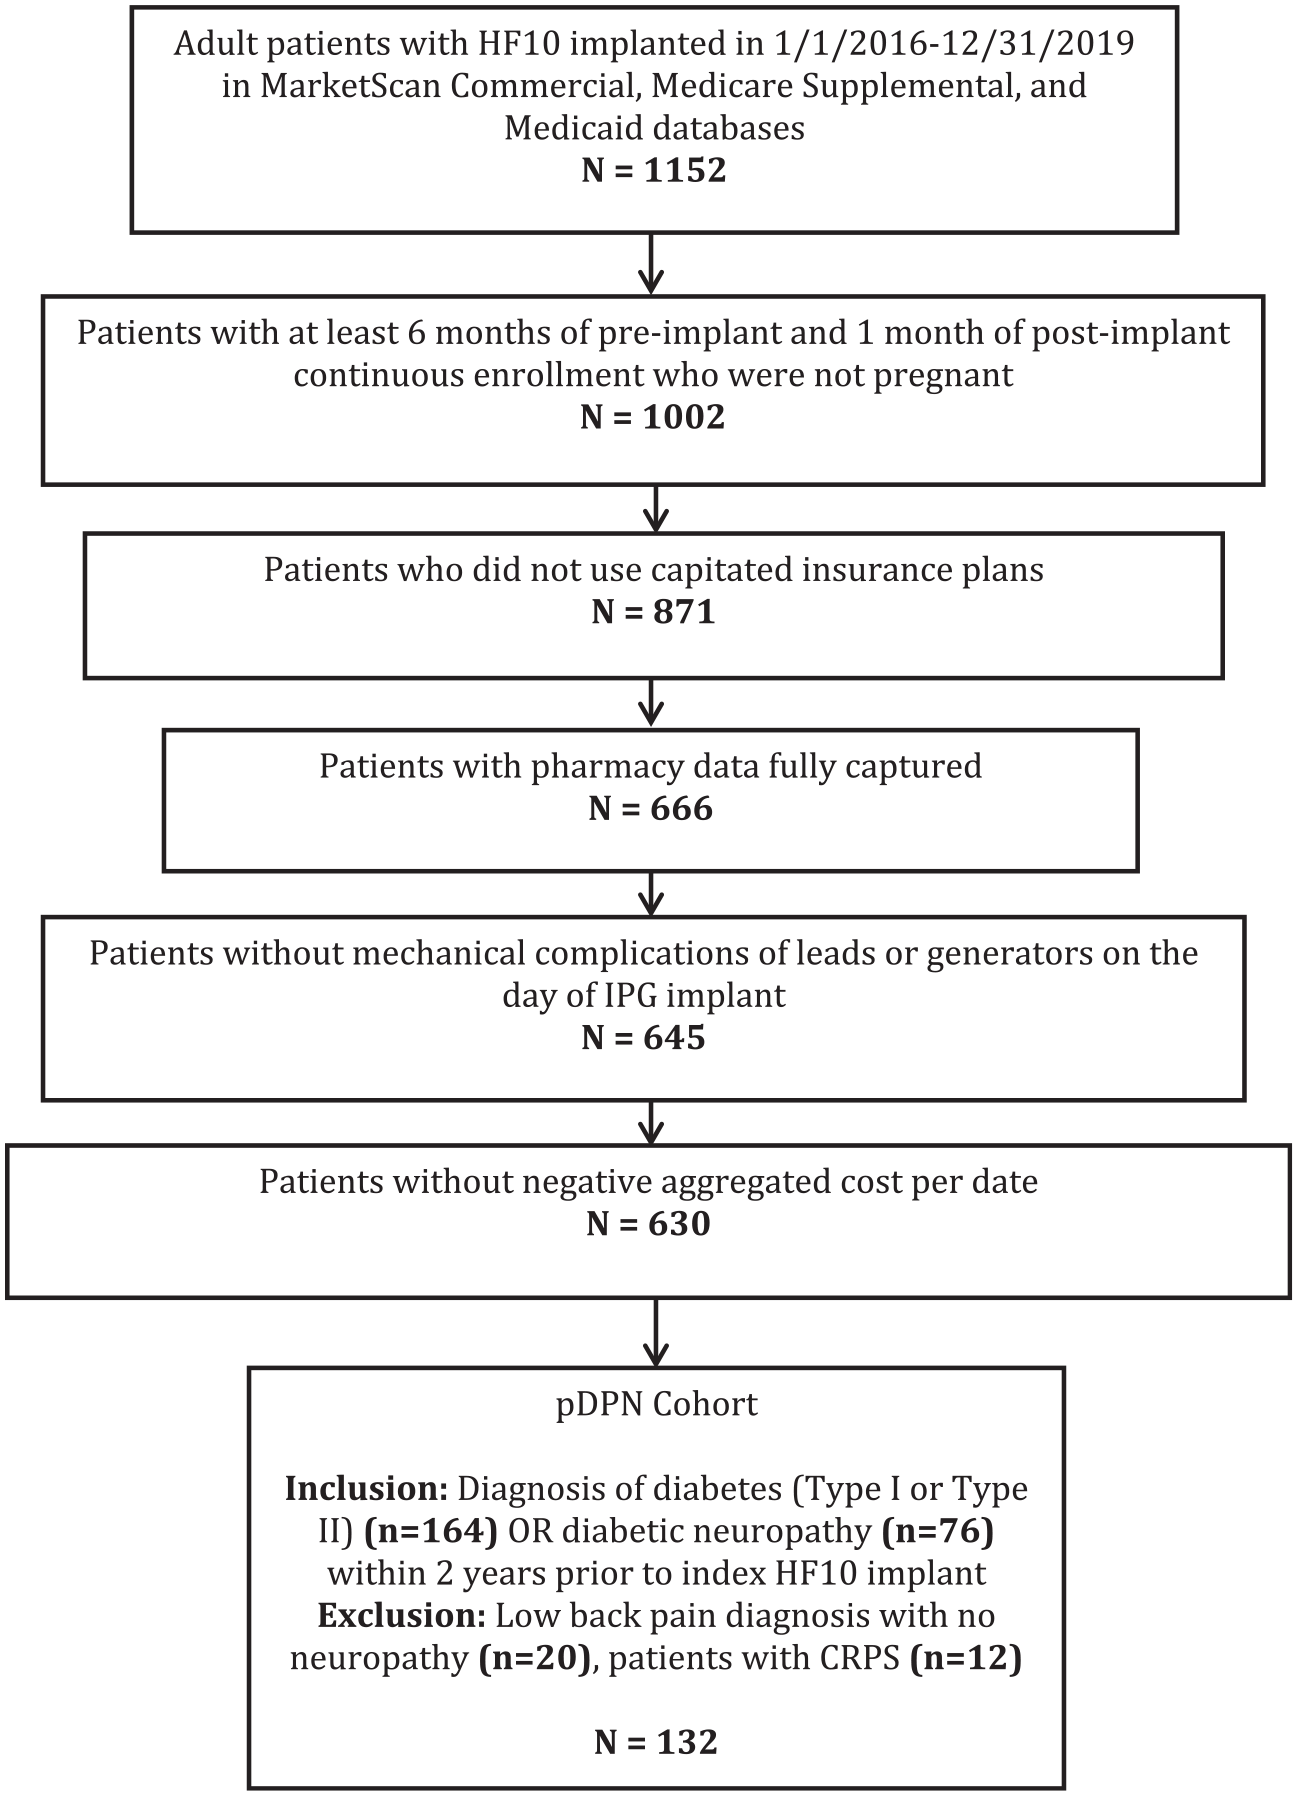
Consort diagram outlining patient selection.
Demographic data were collected, including age, sex, insurance type, and medical comorbidities. We used the HCUP Elixhauser Comorbidity Software to identify comorbidities and calculated the van Walraven Elixhauser Comorbidity Index for each patient.21-23 Healthcare resource utilization data, including total, inpatient service, outpatient service, and outpatient medication costs excluding those related to the implant, were then collected. Device acquisition costs, identified as all costs on the day of HF-SCS trial and permanent implant, were calculated separately. Costs were calculated cumulatively for the six months prior to HF-SCS implant to establish a baseline cost and for one, three, and six months post-implant, cumulative over each time period. We chose to bound the data collection to six months pre-index and post-index because beyond this time, we hypothesized that costs relating to other aspects of patients’ healthcare would create more noise in the analysis of pDPN-related costs. Finally, as inefficacy of the device would likely lead to significant cost without clinical benefit, we also calculated the six-month explant rate of the HF-SCS system among patients with six-month post-implant continuous enrollment (n = 97).
Statistical Analysis
Continuous variables were summarized with means, standard deviations (SDs), medians, interquartile ranges, and ranges. Categorical variables were summarized with frequency counts and percentages. The highest 1% of costs during each time period was considered outliers and excluded from the calculation of the summary statistics. For patients with continuous enrollment for at least six months post-implant, the total service and medication costs for the six-month periods pre-implant and post-implant were compared using the Wilcoxon signed-rank test. The cost difference was calculated by the six-month post-implant cost minus the six-month pre-implant cost, and the 95% confidence interval (CI) of the mean cost difference was constructed based on 1000 bootstrap samples. Outliers were not removed for the calculation of cost differences. All analyses were conducted using SAS 9.4 (SAS Institute Inc, Cary, NC, USA). All statistical tests were two-sided, with significance set at level α = 0.05 and without adjustment for multiple testing. All costs were adjusted for inflation based on US Bureau of Labor Statistics indices to the 2020 USD. 24
Results
Cohort Characteristics
A total of 1152 patients were identified in MarketScan with a code for HF-SCS implantation between 2016 and 2019. After applying inclusion and exclusion criteria, 132 patients met the inclusion criteria for pDPN (Figure 1).
Demographic information for our cohort is displayed in Table 1. The median age was 60 years, and there was no major difference in sex of patients (male: 52.3%, female: 47.7%). Patients were generally employed full-time (41.7%) and most had commercial insurance (66.7%).
Cohort Demographics.
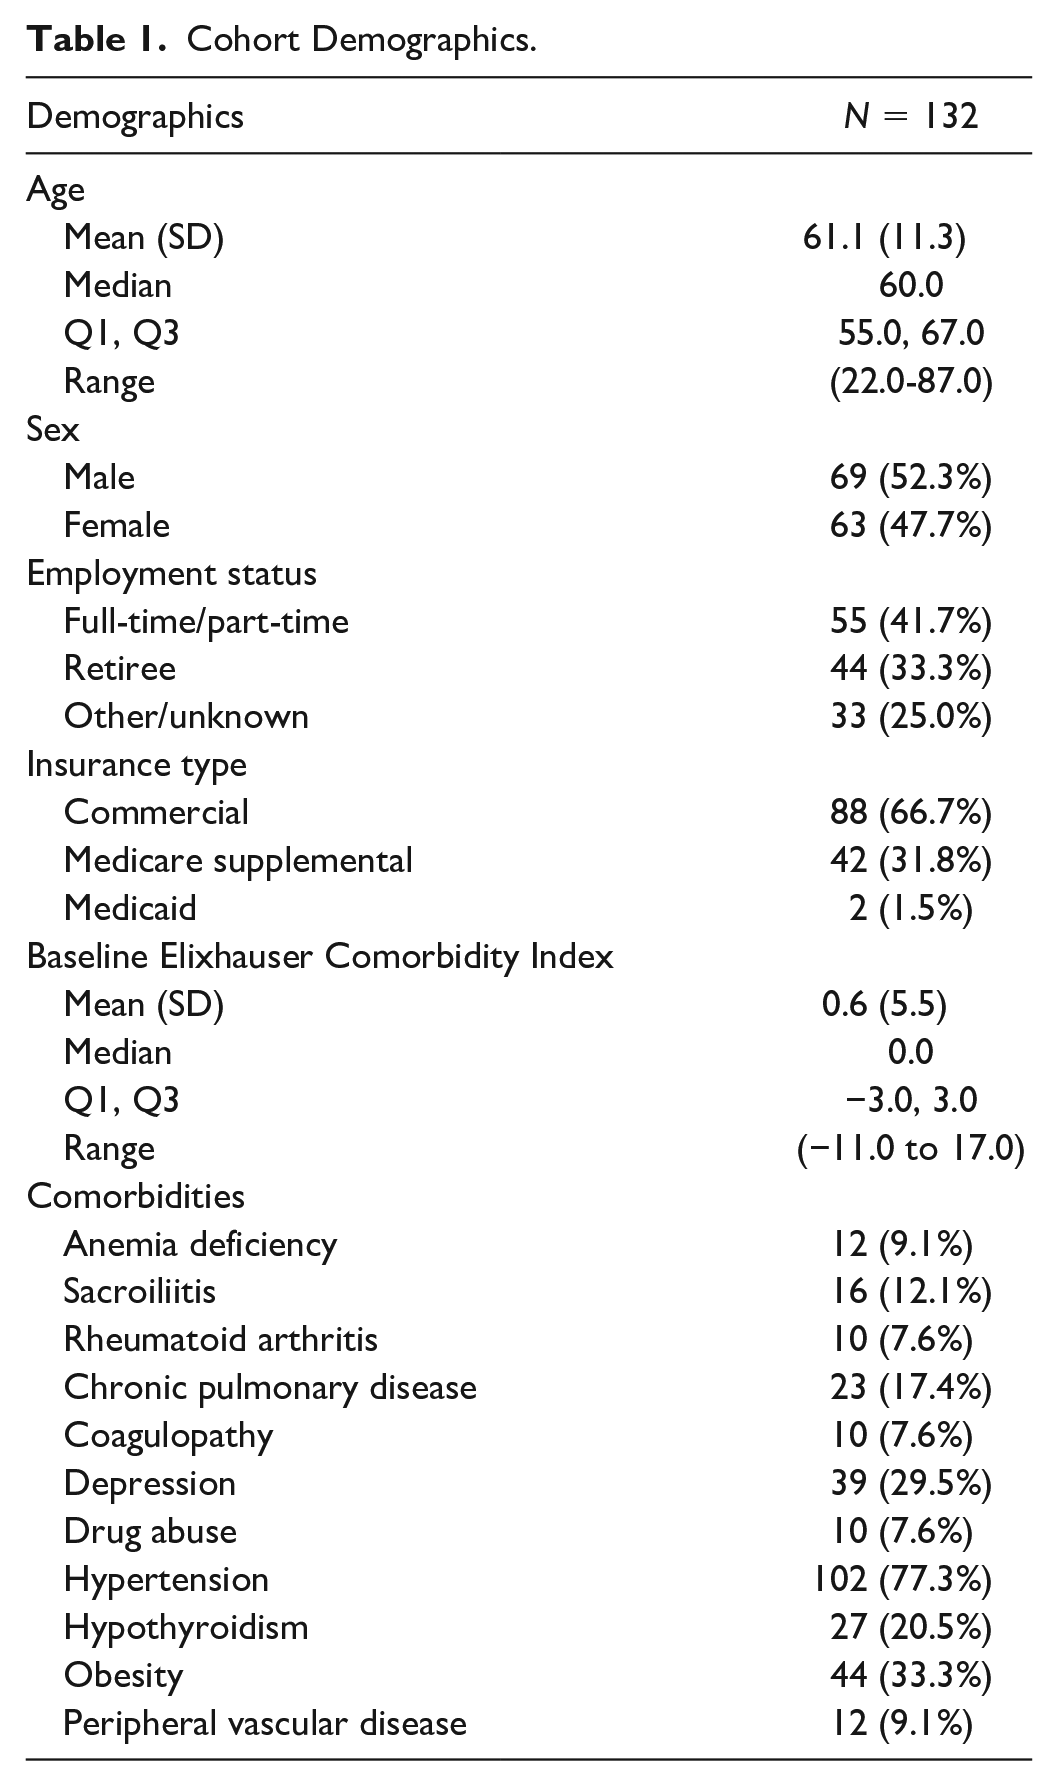
The median Elixhauser Comorbidity Index was 0 (range: −11 to 17). A high proportion of patients had hypertension (77.3%), obesity (33.3%), depression (29.5%), and hypothyroidism (20.5%).
Healthcare Resource Utilization
Total, service, and outpatient medication costs, excluding those related to device acquisition, are displayed in Figure 2 and Table 2. The median cumulative cost at six months pre-implant was $19 220 (Q1: $12 100, Q3: $30 745) and was $1356 (Q1: $535, Q3: $3713) at one month post-implant, $4857 (Q1: $2499, Q3: $13 012) at three months post-implant, and $13 304 (Q1: $6797, Q3: $25 186) at six months post-implant. The median inpatient service cost was $0 throughout the study period, whereas the median outpatient service cost decreased from $12 295 (Q1: $6787, Q3: $18 982) at six months pre-implant to $4726 (Q1: $1958, Q3: $11 626) at six months post-implant. Medication costs increased from a median of $4501 to $4751 in this same time interval. The mean total cost was reduced from $25 028 (SD: $19 300) at baseline to $20 970 (SD: $21 351) at six months post-implant. The mean reduction in total costs was $5118 (95% CI: $131-$10 105, P < .001).
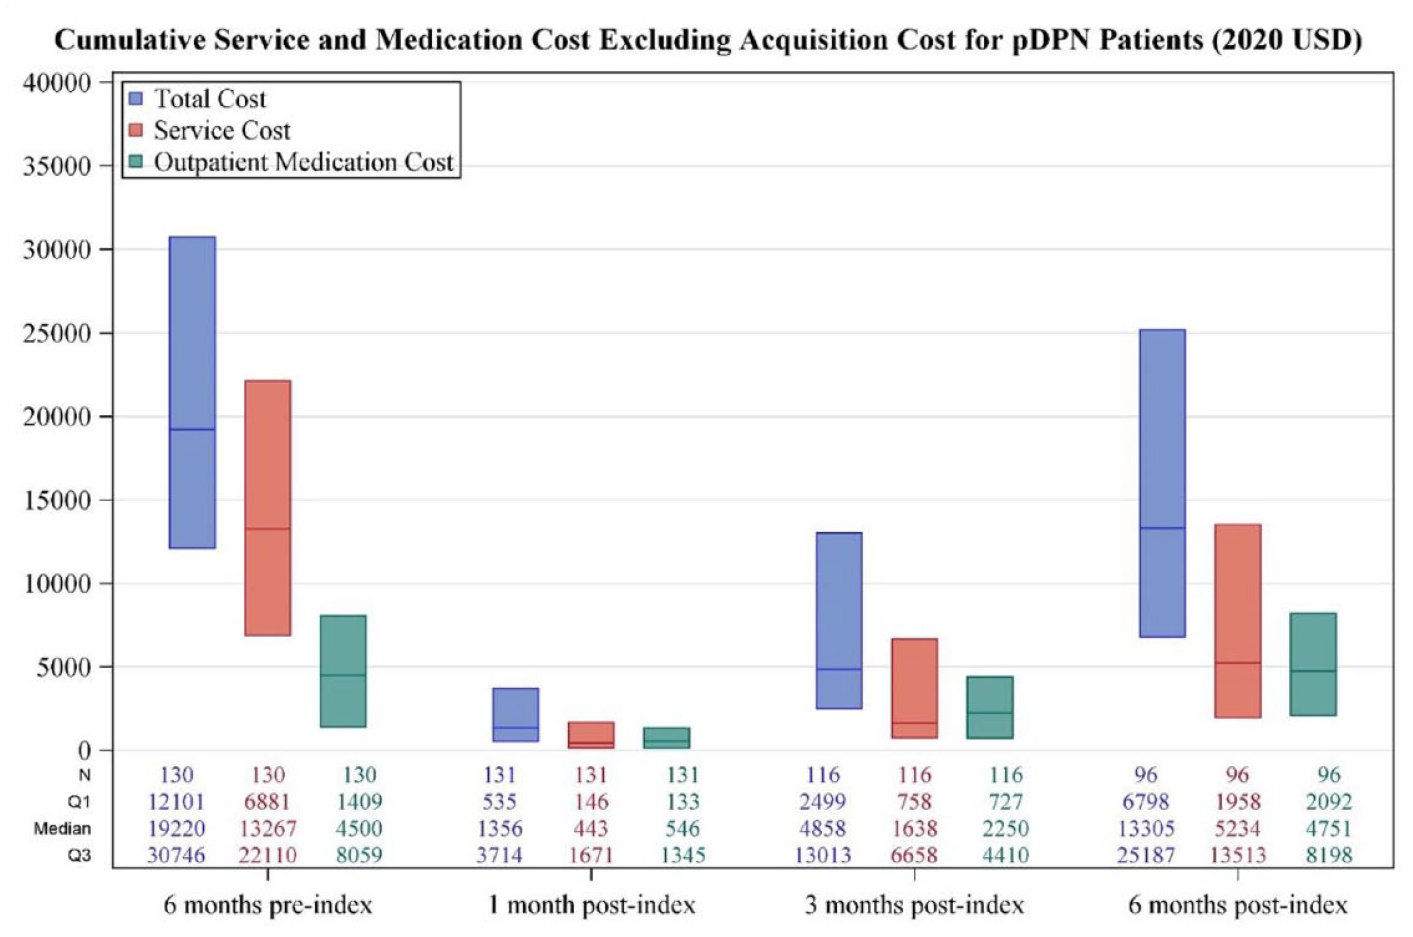
Total cost incurred.
Cumulative Total Service and Medication Cost.
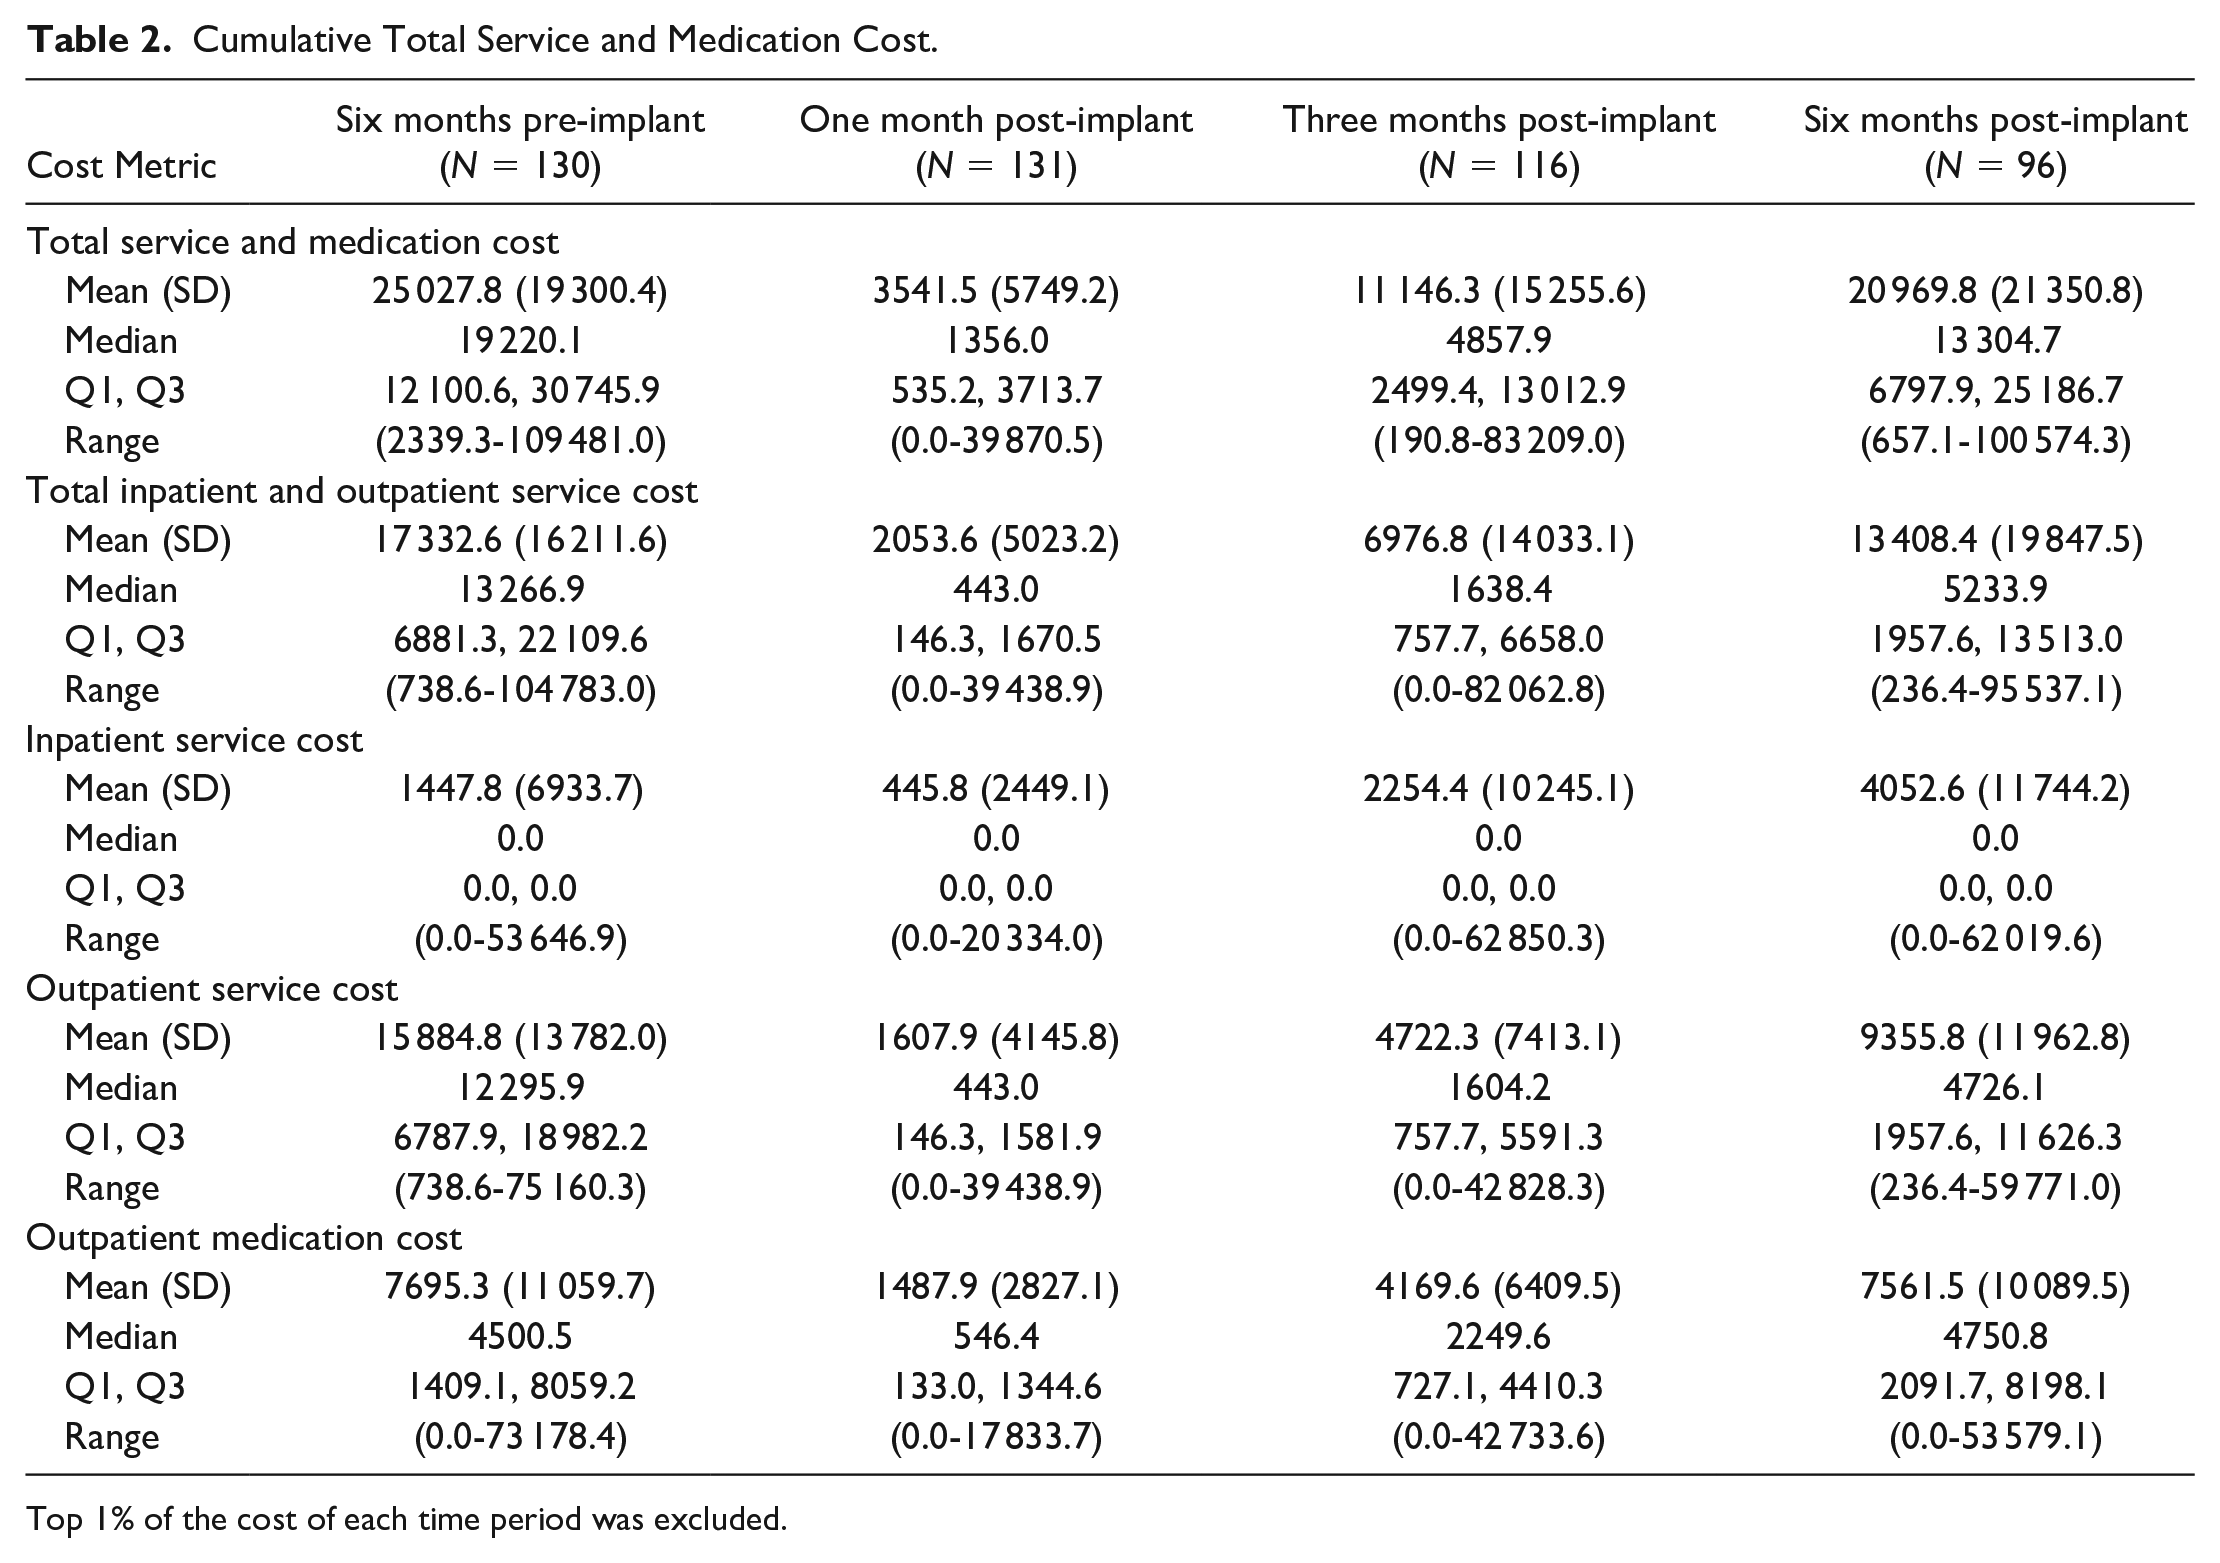
Top 1% of the cost of each time period was excluded.
Because the median cost in the zero- to six-month post-implant period was almost triple that of the zero- to three-month period, we conducted an exploratory analysis of procedures patients had in zero to three and three to six months post-implant using the HCUP Clinical Classification Software (CCS) for Services and Procedures, which classifies CPT codes into clinically meaningful categories (Supplementary Tables 2a and 2b). Costs were attributable to similar procedures in both time intervals, including outpatient consultation, laboratory fees, medications, radiology, and durable medical equipment. However, the number of patients using services or procedures in each CCS category increased in three to six months for all categories except for outpatient consultation.
Cumulative out-of-pocket costs are displayed in Figure 3. The median out-of-pocket costs six months pre-implant were $1477 (Q1: $755, Q3: $2547) which decreased to $710 (Q1: $338.40, Q3: $1631) at six months post-implant.
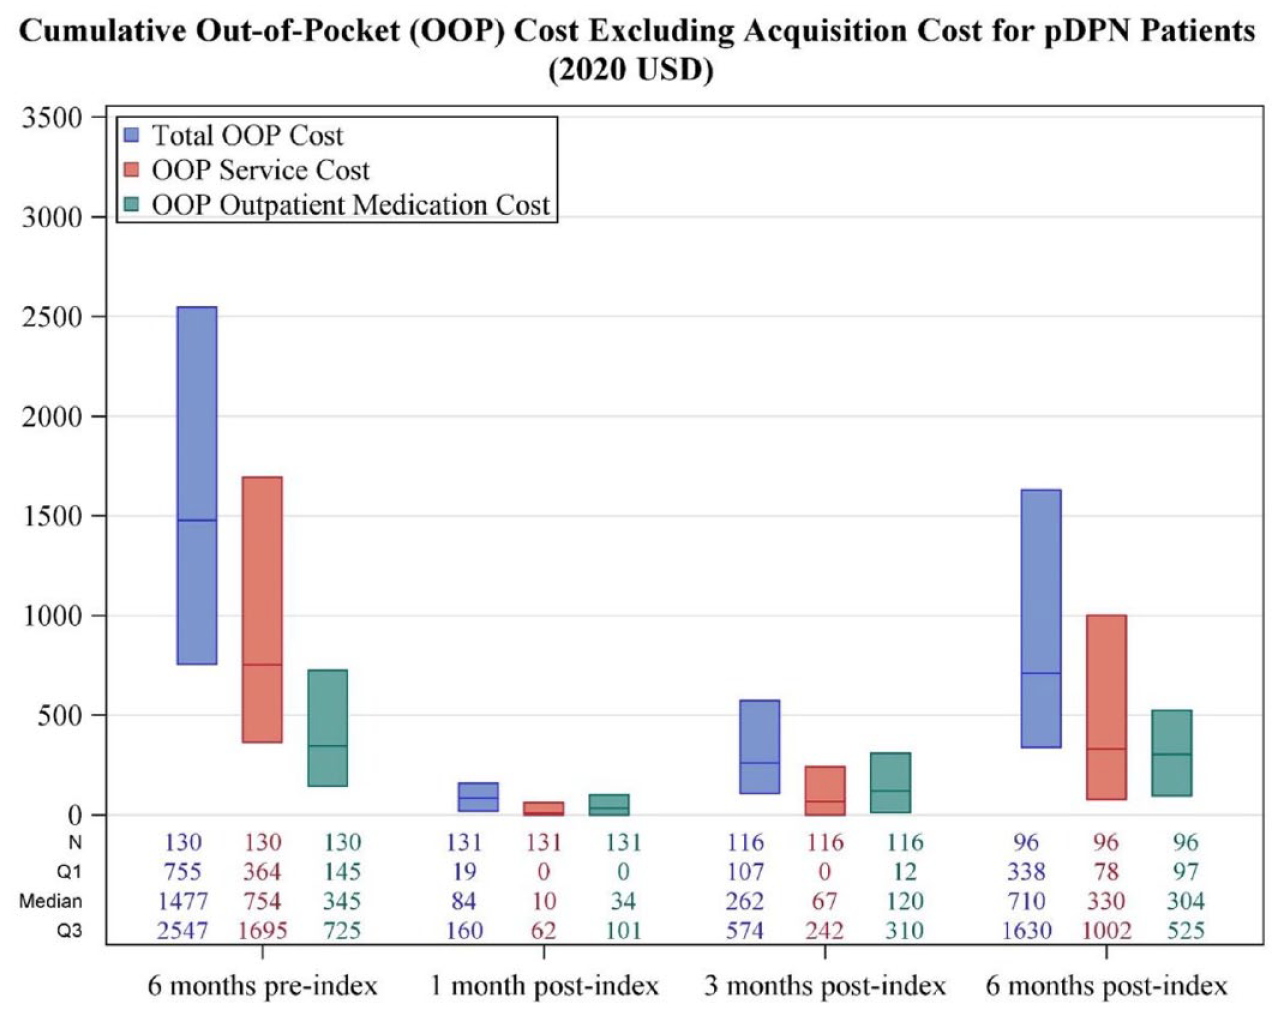
Out-of-pocket costs.
Device acquisition costs were summarized in Table 3. The median total and service-related acquisition costs were $35 755 (Q1: $27 244, Q3: 57 711), and the median total out-of-pocket costs related to device acquisition were $232 (Q1: $0, Q3: $1203). Based on this median device acquisition cost and an average monthly cost reduction of $853 ($5118 in six months/6), an approximate time to cost-neutralization can be calculated to be 42 months. We acknowledge that should total healthcare costs rise significantly after six months post-implantation, it may take longer for cost neutrality to be achieved.
Cost of Device Acquisition (Trial + IPG Implant).
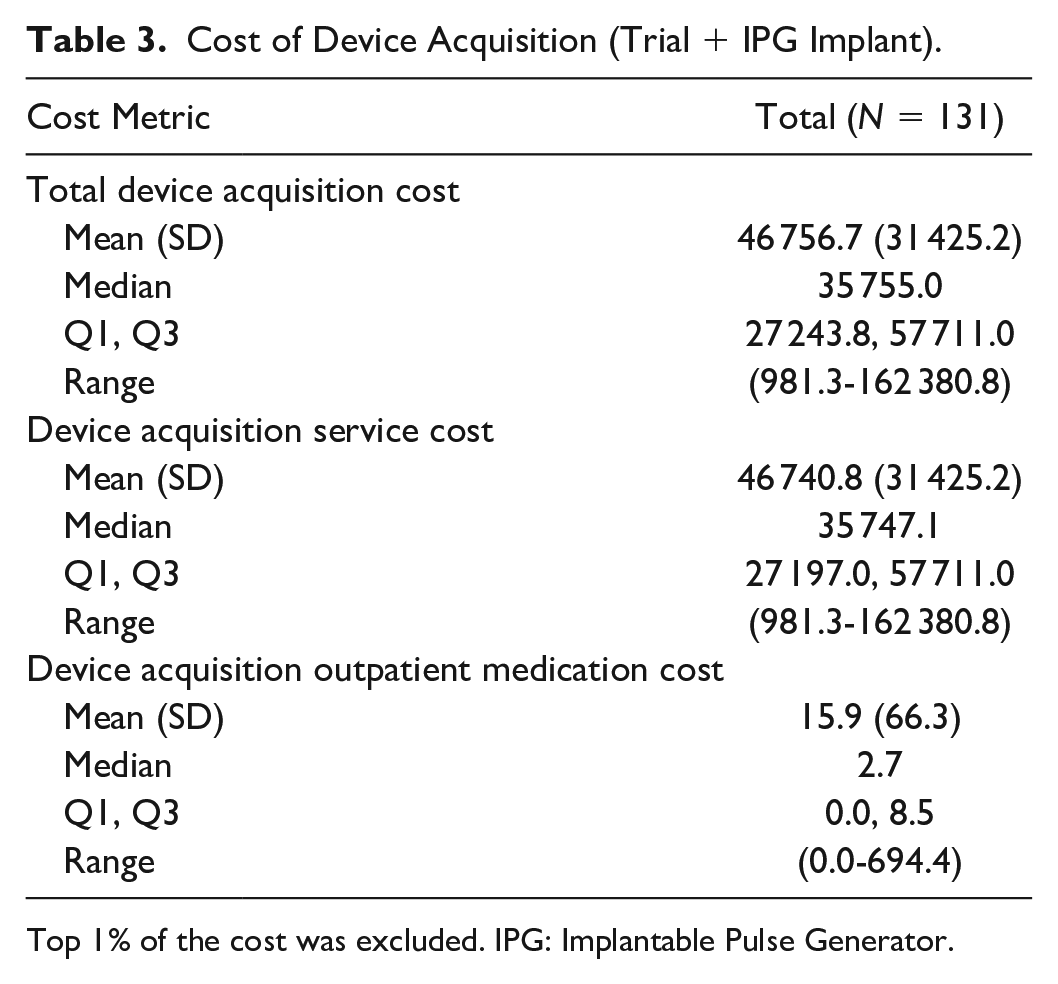
Top 1% of the cost was excluded. IPG: Implantable Pulse Generator.
Of the 97 patients who had at least six months of continuous enrollment post-implant, two experienced device explant within six months (2.1%), which occurred at 14 and 84 days after device implant.
Discussion
Key Results
The first analysis of HCRU associated with HF-SCS for the treatment of pDPN in the United States is presented here. We discovered that HF-SCS is effective at reducing HCRU, and even though mean inpatient costs increase, the overall cost of care is decreased, particularly through reduced outpatient service costs. With our calculations, the procedure’s cost savings could cover the current cost of the procedure after approximately 3.5 years in pDPN patients. As health policy increasingly focuses on value-based care, it will be critical to assess both the cost-effectiveness and clinical benefits of novel therapies.
Cohort Characteristics
Our cohort had a median age of 61 years, with the youngest patient being 22 years old and the oldest being 87 years old. Although the prevalence of hypertension (77.3%) was higher in our cohort than expected in the general population, 25 this difference may be explained in part by the higher prevalence of hypertension in patients with diabetes. 26 Similarly, depression is expected to be more prevalent in the setting of chronic pain. However, a greater proportion of patients than expected had hypothyroidism (20.5%). Another study found that 16% of patients with type II diabetes had clinical or subclinical hypothyroidism, 27 and this prevalence may be higher in the United States. Consideration of cost-effectiveness of treatments is even more critical in light of the fact that patients may have other chronic health conditions in addition to diabetes.
Healthcare Resource Utilization
Patients incurred a median cost of $19 220, or $3203 per month, six months before HF-SCS implantation, with outpatient service costs being the primary driver. This is greater than what has been reported in the literature. Sadosky and coworkers reported that patients with pDPN incur annual medical costs ranging between approximately $28 000 and $31 000, although they also found that the primary driver was outpatient costs. 28 Similarly, our group previously reported on the HCRU associated with pDPN and discovered that patients incurred approximately $24 000 in annual medical costs one year after diagnosis, with HCRU decreasing over the next four years. 2 Both were retrospective database studies with larger sample sizes than those used in this study, which may have contributed to the observed difference. Further, patients with pDPN who later receive HF-SCS may have more severe pain than those who did not require HF-SCS, and this may have also led to increased resource utilization at baseline in our cohort compared with prior studies. Given that the average age of our cohort was 61 years, management of microvascular complications of diabetes, such as retinopathy and nephropathy, likely contributed to these high baseline costs.
Mean total costs decreased significantly by $5118 when comparing the total costs six months pre-implant with the total costs six months post-implant. This cost breaks down to a savings of $853 a month. The majority of the savings came from a decrease in the cost of outpatient services, which decreased from approximately $2049 per month to $788 per month. Initially, some of this decline may have been induced by decreased resource utilization during surgical recovery. However, the recovery period for SCS implantation is typically short; therefore, our findings are likely to reflect true reductions in outpatient HCRU. In addition, optimizing stimulators necessitates an additional incremental cost for patients in our cohort; however, total costs decreased despite this new outpatient service requirement. Importantly, this total HCRU is inclusive of costs of any complications that occurred in the six months after implantation. Outpatient medication costs increased slightly over the study period, from approximately $750 to approximately $792 per month. This may be due to the management of our cohort’s other significant comorbidities, such as hypertension or hypothyroidism, but importantly shows that the reduction in total HCRU after HF-SCS was due primarily to a reduction in outpatient service use, not a reduction in medication use. Further studies are needed to determine if the type of pain medications used by patients changed from before surgery to after.
Notably, we observed that the median cost in the zero- to six-month post-implant period ($13 305) was almost triple that of the zero- to three-month period ($4858), implying that some factor occurred between three and six months post-implant that significantly increased costs during this period. In addition, we also observed that the mean inpatient service costs for patients increased from $1447.80 in the six months pre-implant to $13 408.40 in the six months post-implant. While the types of medical procedures performed by the cohort remained constant, the median cost and number of patients undergoing these procedures both increased slightly (Supplementary Tables 2a and 2b). While this is unlikely to account for the entire increase in cost, increased utilization of certain medical procedures may account for a portion of the increase, especially if these patients needed inpatient care for these procedures. Notably, the medical procedures performed are not always related to the patients’ neuropathic pain. Rather, it is possible that after achieving improved pain control with HF-SCS, patients sought care for their other health conditions, including other complications of diabetes. A more robust analysis is required to determine the precise causes of the cost increase that occurs three months after SCS implantation. Despite these increased costs, our analysis of a large claims-based data set still demonstrates a cost reduction after HF-SCS implantation in patients with pDPN, implying the therapy is less expensive than conservative medical therapy.
Our findings are consistent with several others that demonstrate a reduction in total costs when SCS is used in place of conservative management.10,29 Despite the initial cost of this implantable medical device, our claims-based analysis of a nationwide cohort demonstrates that using HF-SCS to treat pDPN helps alleviate the burden on the healthcare system. When combined with clinical evidence, this may support the standardization of neurostimulation for the treatment of patients with refractory pDPN. Out-of-pocket costs decreased in a similar fashion to total costs, from $1476 pre-implant to $710 post-implant, a 52% reduction that demonstrates that HF-SCS therapy alleviates financial strain on both the healthcare system and patients. Due to the high upfront costs associated with medical devices, it was also necessary to quantify the costs associated with device acquisition in our cohort. The median cost of acquiring a device was $35 755, with service costs accounting for the majority of this. We estimated that the time to cost-neutralization for HF-SCS in these patients is about 3.5 years; although the literature on long-term use of HF-SCS for pDPN is limited, many patients retain SCS systems for an extended period of time and up to the battery life of approximately ten years.
Explant Rate
Spinal cord stimulators may be explanted and removed for a variety of reasons, including infection, lead fracture, or ineffective pain relief. Regardless of the reason, patients whose systems are explanted shortly after implant incur the high cost of device acquisition but end up receiving no clinical benefit, likely contributing to increased HCRU. Labaran and colleagues reported a revision or removal rate of 3.4% for SCS at one year, 30 and Dougherty and colleagues reported a one-year explant rate of approximately 5%. 31 However, other studies have reported significantly higher explant rates, 32 and explant rates are also significantly higher when the analysis is extended beyond a year. 31 In our study, we reported a 2.1% explant rate at six months for HF-SCS systems in patients with pDPN, which appears to be comparable that reported in the literature for traditional SCS systems.
Limitations
This study is limited by the inherent limitations of conducting retrospective studies using large claims databases, such as human error for coding/billing protocols. We lack sufficient detail to explain why HF-SCS was chosen as a treatment option for these patients and must assume that it is secondary to their diabetes-related painful neuropathy. As HF-SCS is a relatively new treatment, despite conducting a large claims-based analysis, our sample size was limited. Importantly, our study does not explore outcomes after HF-SCS implantation, as this information is not available in billing databases.
Limitations related to our patient sample are that only 97 patients had continuous six-month follow-up data after SCS placement; thus, our study is not generalizable to patients who do not have long-term follow-up and care after HF-SCS surgery. In addition, our study included 88 patients who met our inclusion criteria who had diabetes and no competing diagnosis to receive HF-SCS, but not an official diagnosis of diabetic neuropathy; this makes an assumption that diabetic neuropathy was their reason for implantation.
Finally, our cost analysis was not sufficiently specific to include costs associated exclusively with HF-SCS treatment. While we attempted to minimize the influence of other cost variables by limiting the study period to six months pre-implant and post-implant, other costs continue to account for a considerable portion of total costs. Nevertheless, this analysis sheds new light on the HCRU of a novel therapeutic approach for patients with pDPN.
Conclusions
We present the first analysis of the HCRU associated with HF-SCS for pDPN and demonstrate that it is associated with significantly decreased total healthcare costs and reductions in out-of-pocket costs for patients. High frequency spinal cord stimulation is a cost-saving therapy that covers acquisition costs at approximately 3.5 years after implant. As public policy increasingly focuses on value-based care to offset the extremely high healthcare costs in the United States, it will be critical to consider the cost and outcomes of innovative therapies such as HF-SCS.
Supplemental Material
sj-docx-1-dst-10.1177_19322968221128321 – Supplemental material for Healthcare Economics of High Frequency Spinal Cord Stimulation for Painful Diabetic Peripheral Neuropathy
Supplemental material, sj-docx-1-dst-10.1177_19322968221128321 for Healthcare Economics of High Frequency Spinal Cord Stimulation for Painful Diabetic Peripheral Neuropathy by Shashank Rajkumar, Vishal Venkatraman, Lexie Zidanyue Yang, Beth Parente, Hui-Jie Lee and Shivanand P. Lad in Journal of Diabetes Science and Technology
Footnotes
Abbreviations
HCRU, healthcare resource utilization; HF-SCS, high frequency spinal cord stimulation; pDPN, painful diabetic peripheral neuropathy
Declaration of Conflicting Interests
The author(s) declared the following potential conflicts of interest with respect to the research, authorship, and/or publication of this article: Dr Lad is a consultant for Abbott Laboratories, Boston Scientific, Higgs Boson Health, Medtronic, Minnetronix, Nevro, and Presidio Medical.
Funding
The author(s) disclosed receipt of the following financial support for the research, authorship, and/or publication of this article: Funding for this work was supported by a grant awarded by Nevro Corp. Further support was obtained through National Center for Advancing Translational Sciences of the National Institutes of Health under Award Number UL1TR002253. The Duke CTSA award supports the infrastructure of the BERD Methods Core which makes the collaboration of this project possible.
Supplemental Material
Supplemental material for this article is available online.
References
Supplementary Material
Please find the following supplemental material available below.
For Open Access articles published under a Creative Commons License, all supplemental material carries the same license as the article it is associated with.
For non-Open Access articles published, all supplemental material carries a non-exclusive license, and permission requests for re-use of supplemental material or any part of supplemental material shall be sent directly to the copyright owner as specified in the copyright notice associated with the article.