
Abstract
Background:
Blood glucose monitoring is an essential component of diabetes management. Inaccurate blood glucose measurements can severely impact patients’ health. This study evaluated the performance of 3 blood glucose monitoring systems (BGMS), Contour® Next USB, FreeStyle InsuLinx®, and OneTouch® Verio™ IQ, under routine hospital conditions.
Methods:
Venous blood samples (N = 236) obtained for routine laboratory procedures were collected at a Spanish hospital, and blood glucose (BG) concentrations were measured with each BGMS and with the available reference (hexokinase) method. Accuracy of the 3 BGMS was compared according to ISO 15197:2013 accuracy limit criteria, by mean absolute relative difference (MARD), consensus error grid (CEG) and surveillance error grid (SEG) analyses, and an insulin dosing error model.
Results:
All BGMS met the accuracy limit criteria defined by ISO 15197:2013. While all measurements of the 3 BGMS were within low-risk zones in both error grid analyses, the Contour Next USB showed significantly smaller MARDs between reference values compared to the other 2 BGMS. Insulin dosing errors were lowest for the Contour Next USB than compared to the other systems.
Conclusions:
All BGMS fulfilled ISO 15197:2013 accuracy limit criteria and CEG criterion. However, taking together all analyses, differences in performance of potential clinical relevance may be observed. Results showed that Contour Next USB had lowest MARD values across the tested glucose range, as compared with the 2 other BGMS. CEG and SEG analyses as well as calculation of the hypothetical bolus insulin dosing error suggest a high accuracy of the Contour Next USB.
Keywords
The accuracy of blood glucose (BG) self-monitoring is an important prerequisite for the sustained success of diabetes management. Accurate BG monitoring allows for adequate bolus insulin dosing decisions and the detection of hypo- and hyperglycemic episodes.1-3 Self-monitoring of BG is often a central element of a diabetes management plan aiming to reduce glycemic variability, the risk of hypo- and hyperglycemia, and associated complications.4,5 The impact of bolus insulin dosing errors due to erroneous BG measurements can worsen over time since self-monitoring of BG and consecutive modification of insulin dosing may occur multiple times a day and ultimately impact glycated hemoglobin (HbA1c) and overall diabetes control. 6
The International Organization for Standardization (ISO) 15197:2013 guideline 7 provides the European regulatory standard accuracy assessment of BGMS. However, modeling analyses suggest that errors in insulin dosing may occur even when using BGMS that fulfill these ISO accuracy criteria. 8 Importantly, standards should specify 100% of the data, and not only define a percentage of correct measurements, 9 which is why continuous measures are preferable.
In this study, differences in accuracy between 3 common BGMS (Contour® Next USB, FreeStyle InsuLinx® and OneTouch® Verio™ IQ) were evaluated versus the reference method of the local laboratory (hexokinase method). The hexokinase method is a common laboratory method for quantitative assessment of BG levels within Europe. Moreover, this method is widely used by technical certification providers for evaluation of BGMS (such as TNO/TÜV Rheinland AG [www.tuv.com], Germany, or SKUP [www.skup.nu]). The present study was conducted under local routine conditions and did not attempt to fulfill formal methodological ISO requirements (ISO 15197:2013, section 6.3). All 3 BGMS have been designed for self-monitoring by the patient and can be used with fresh capillary or venous blood samples. All 3 BGMS are equipped with data management technology and may transfer data to a computer, either via a USB port or via cable. This permits patients, but also their physicians, a better overview of the historical, chronological development of their glycemic status.
The accuracy of each BGMS was not only assessed according to ISO 15197:2013 accuracy limit criteria, but also by additional parameters that take into account the clinical impact of erroneous measurements.
Methods
Subjects
Leftover whole-blood samples (n = 236) of patients who came to the study site independently (Hospital Clinic Barcelona, Spain) for routine testing (including hematocrit and glucose) were used. Therefore, no information on the subjects (ie, demographic, personal data or information on the medical history) was recorded or analyzed. Thus, following local regulations (local hospital regulations and Spanish Law 14/2007), patients’ informed consent was not required for use of exclusively deidentified blood samples. Testing was conducted by laboratory or health care professionals who had been trained on the protocol, the use of each BGMS, as well as the available local clinical chemistry analyzer (Dimension® EXL, Siemens AG, Erlangen. Germany) and the hexokinase method used for the comparative glucose measurement. The inaccuracy and imprecision of the hexokinase local analyzer were as low as 0.94% and 1.37% respectively, as assessed by an external quality control program (http://www.bio-rad.com/en-us/product/unity-interlaboratory-program) that compares the glucose results of the study laboratory with the results of 115 laboratories using the same method and analyzer (data not shown).
Study Design
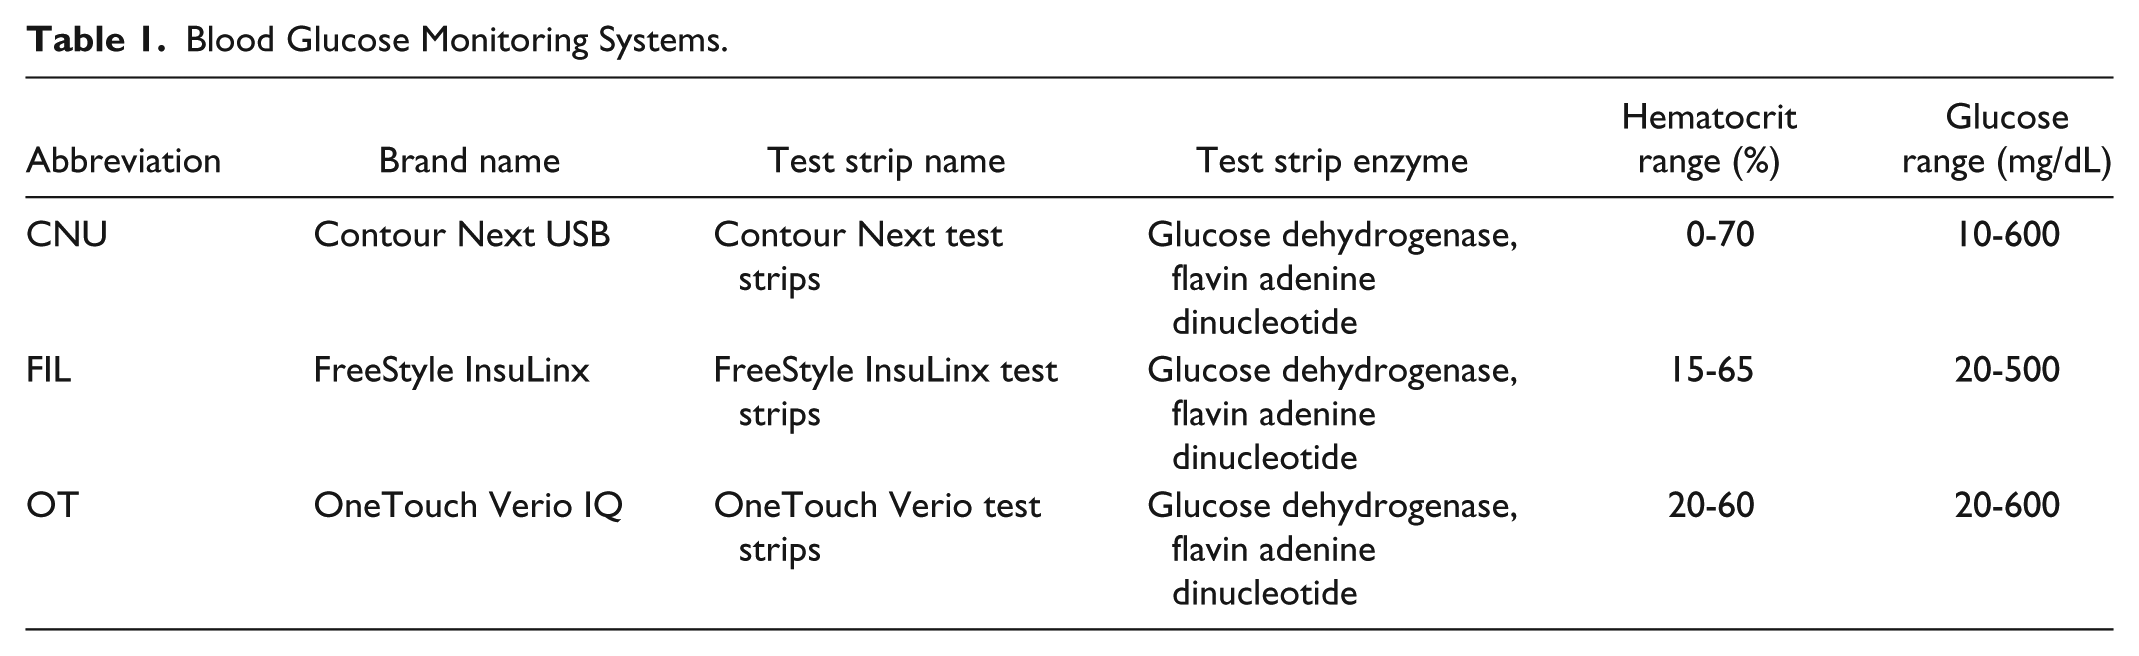
This is a single center study to investigate the accuracy of 3 BGMS under local routine hospital and laboratory conditions. Measurements were exclusively carried out by trained staff without involving any patient participation. The BGMS used were Contour Next USB (CNU; Bayer Consumer Care, Basel, Switzerland), FreeStyle InsuLinx (FIL; Abbott, Ludwigshafen, Germany), and OneTouch Verio IQ (OT; LifeScan, High Wycombe, UK). All 3 BGMS use the same enzymatic method in their test strips (glucose dehydrogenase, flavin adenine dinucleotide; see Table 1), and are equipped with a data management system as 1 of their core features. For each BGMS, 2 meters and 2 strip lots were used to test blood samples, and the order of meter testing was rotated among the BGMS. Tests were performed using venous whole blood. According to the Spanish owner’s manuals, all 3 BGMS may be used with venous blood samples. The characteristics of the 3 BGMS are displayed in Table 1.
Blood Glucose Monitoring Systems.
On every day of the study, the precision of each BGMS and of the reference hexokinase glucose analyzer were assessed using the respective control solutions. The blood samples had been collected in tubes containing lithium heparin; EDTA and other anticoagulants besides heparin were not allowed. The mean time from sample collection to glucose measurements was less than 7 minutes. Each blood sample was gently mixed and 1 drop was dispensed onto a clean glass slide immediately before each test. For each of the 3 BGMS, 2 test strip lots were used, that is, 6 measurements from 6 drops from each sample were performed. The order of meter testing was alternated among the BGMS brands in a predefined rotation, and the order of test strip lots was alternated between odd and even numbered samples. The purpose of the rotation was to ensure that the test order did not impact BG results or meter performance. Before placing the blood drop on the 3 BGMS all the strips had already been inserted in the different meters. The ensuing process of dispensing a blood drop via a Pasteur pipette to all the BGMS was therefore very fast and took no more than 20 seconds. Glucose measurements from each BGMS were compared with the mean of duplicate results obtained with the laboratory reference hexokinase method. The time from the first meter test to the time the blood was centrifuged for reference method BG analyses did not exceed 15 minutes.
Out of the total 236 collected blood samples, 204 were evaluable as defined per protocol. The 32 excluded samples had missing hematocrit values (n = 28 samples), or hematocrit values that were out of range for at least 1 BGMS used in the study (n = 3 samples). The data from 1 sample was excluded from analyses, because this sample was inadvertently a repeated measurement of the same sample. Another sample was assessed as being an outlier, as it showed for each BGMS much lower results than what would be expected from a linear regression of the other data. Thus, by performing duplicate measurements for each BGMS, 406 evaluable results were obtained in total. As no information on the patient’s history could be obtained, the presence of interfering factors, which may hamper correct glucose measurements (such as ascorbic acid, acetaminophen, etc) cannot be excluded. However, all 3 BGMS use specific (proprietary) technology to reduce possible interferences with the most common substances.
Assessment and Analyses
The accuracy of each BGMS was assessed according to ISO 15197:2013 accuracy limit criteria, meaning 95% of the results for each BGMS were to be within ±15 mg/dL (for BG levels < 100 mg/dL) or within ±15% (for BG levels ≥ 100 mg/dL) of the local laboratory reference method results. To this end, absolute and relative frequency distributions for the results of each BGMS were calculated. Bland–Altman difference plots were generated for each device to display the difference between BGMS and the reference results.
The mean of the absolute relative difference (ARD) values were calculated to obtain the MARD for each BGMS. The ARD was calculated as follows:

BG represents the meter result and H represents the hexokinase method (reference) result. Therefore, MARD refers to the average percentage deviation of the BG meter results from the laboratory reference results; lower MARD values indicate greater accuracy.
Consensus error grid (CEG, also called Parkes error grid) analyses were performed to determine the clinical relevance of the accuracy measures. 10 The CEG had been developed in 2000 and the recent ISO 15197:2013 guideline update has included this parameter, however only for patients with diabetes mellitus type 1. 7 As opposed to the other binary ISO requirements, the CEG assigns any error in BGMS measurement to 1 of 5 risk categories, based on its clinical significance. Results in zone A indicate no effect of erroneous measurements on clinical action; results in zone B indicate little to no effect on clinical action. 10
Surveillance error grid (SEG) analyses were performed for each BGMS according to the methodology described by Klonoff et al 11 using a Microsoft Excel™ VBA macro program (Microsoft Corporation, Redmond, WA, USA). SEG, a novel error grid system, displays clinical risks on a continuous color-coded scale which allows greater precision in quantifying low risk. 11
Post hoc analyses were performed to assess the hypothetical bolus insulin dosing error resulting from erroneous BGMS measurements. 8 The bolus dose calculation consisted of 2 terms:
Term 1, for bringing the patient’s BG to the target, if his or her BG was currently (premeal) above the target (to be 0 if his or her BG was already [premeal] at or below the target)
Term 2, for compensating for the amount of carbohydrates he or she was planning to consume
For each BG measurement, an appropriate premeal bolus insulin dose was calculated for a hypothetical patient, assuming a meal containing 60 g of carbohydrates and a target glucose level of 100 mg/dL. Insulin dose was calculated using a computer-based model, which adjusted the assumed insulin sensitivity and insulin-to-carbohydrate ratio by taking into account the error of meter results in comparison with the reference hexokinase method. The model consisted of assuming that the patient had previously computed his or her insulin sensitivity (sen, units per mg/dL) and insulin/carb ratio (icratio, units/g) using data generated from his or her meter. The proportion difference (pd) between meter and laboratory result was computed for each pair.

Given an assumed BG target and an assumed meal of 60 g of carbohydrates, the dose, based on the meter result was calculated as

The senmeter is the insulin sensitivity assumed to have been computed by using meter results (a priori), and icratiometer is the insulin/carb ratio assumed to have been computed using the meter (again a priori). Then, the dose that should have been used had the patient known the true BG (ie, the laboratory value) would be computed as

If meterBG (or labBG) < target, then the difference meterBG – target (or labBG – target) was set equal to 0.
The constants, sentrue and icratiotrue, were calculated as


Note that pd may be either negative or positive. The dose error was calculated as

For each meter system, the data were resampled with replacement (ie, bootstrap sampling) and the dose errors were calculated n = 1000 times. For each bootstrap sample, 20 percentiles from the 1st to 99th were computed. These 20 percentiles × 1000 simulation iterations were stacked. The 2.5th and 97.5th percentiles were then extracted from the n = 20 000 values. The model is so far restricted to the inputs of senmeter = 1/15, target = 100 mg/dL, and 60 g of carbohydrates in the meal. The distribution of dose errors was compared across meters, and differences were tested for statistical significance using the Kolmogorov-Smirnov test. Calculation of this formula was based on the formula used by the Diabetes Teaching Center at the University of California San Francisco (UCSF), USA (http://dtc.ucsf.edu/types-of-diabetes/type2/treatment-of-type-2-diabetes/medications-and-therapies/type-2-insulin-rx/calculating-insulin-dose/#mealtime).
Results
Sample Characteristics
The glucose concentration of the samples ranged between 63 to 627 mg/dL (mean 136 mg/dL) as measured by the Dimension EXL hexokinase laboratory reference method. 54 samples had glucose concentrations < 100 mg/dL. Hematocrit levels for the 204 evaluable samples ranged from 25% to 53%, with a mean of 37.9%.
All precision measurements of each of the BGMS with the respective control solutions were within target ranges provided by the respective manufacturer (data not shown).
Accuracy
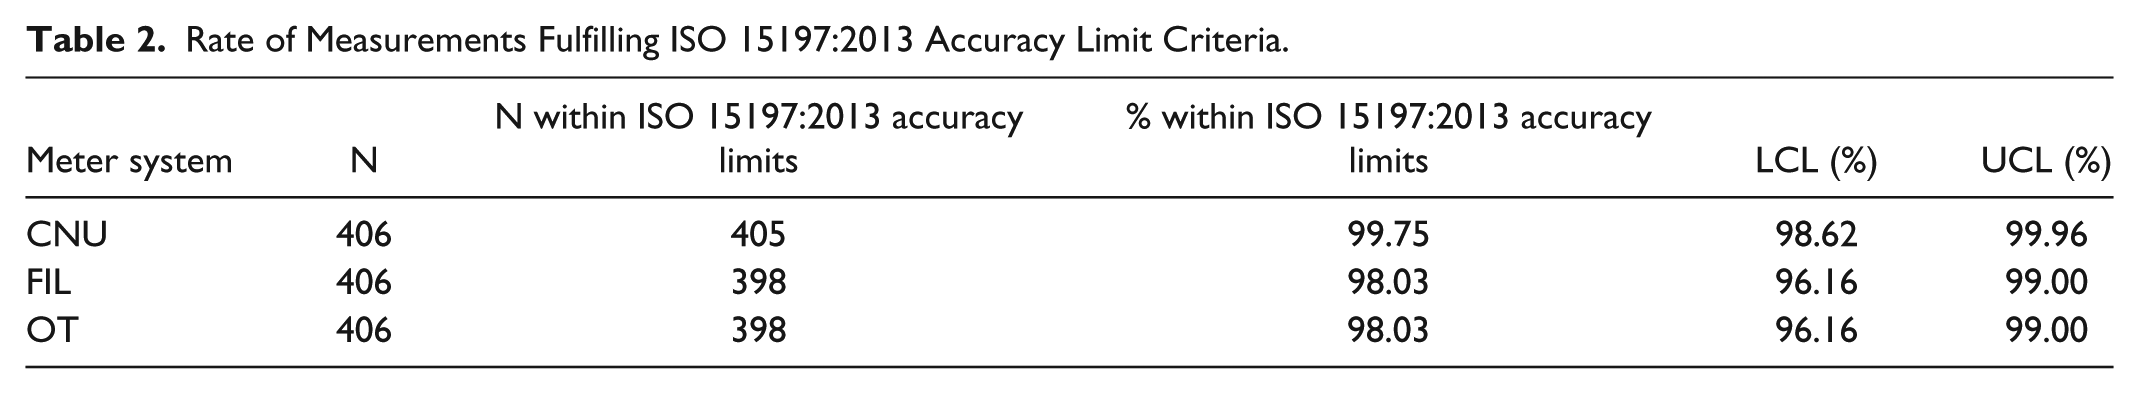
Table 2 shows the frequency and percentage of results fulfilling the ISO 15197:2013 accuracy limit criteria for each BGMS, including lower and upper limits of the 95%-confidence intervals (LCL, UCL). All 3 BGMS fulfilled the criterion that at least 95% of measurements shall be within the ISO defined accuracy limit ranges. However, the percentage was higher for measurements performed with the CNU than for the other 2 BGMS (99.75% compared to 98.03%).
Rate of Measurements Fulfilling ISO 15197:2013 Accuracy Limit Criteria.
Modified Bland–Altman plots are shown for each meter system in Figure 1. The plots depict for each BGMS the difference between BGMS and reference method result depending on BG concentration as assessed by the reference method.
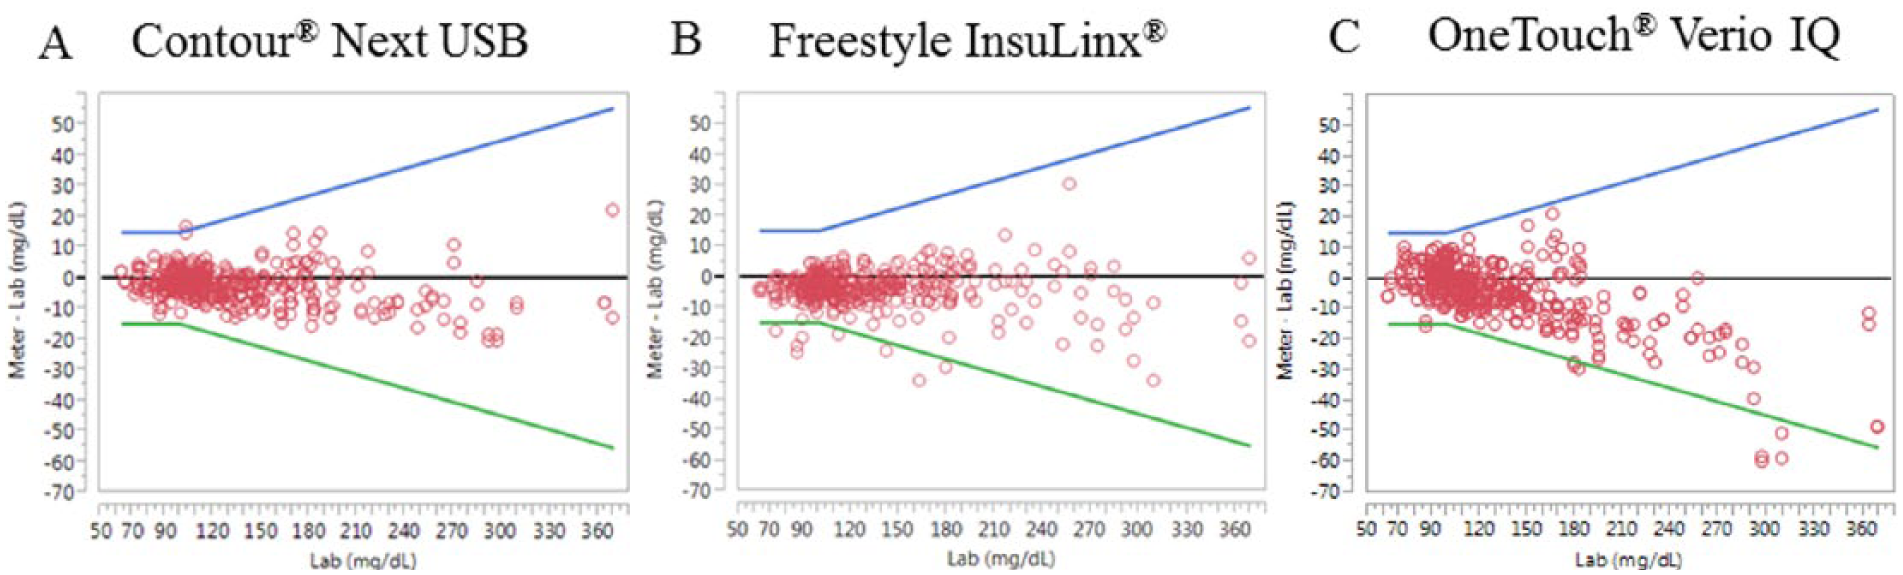
Modified Bland–Altman plots for each BGMS, CNU (A), FIL (B), and OT (C). In each plot, the y-axis depicts the difference between meter result and the reference method result (mg/dL), and the x-axis is the BG value according to the reference method (mg/dL). The lower and upper limits (LL, UL, green and blue lines, respectively) are included in the plots and are either ±15 mg/dL (hexokinase < 100 mg/dL) or ±15% of Dimension EXL hexokinase (hexokinase ≥ 100 mg/dL). These limits are calculated in accordance to ISO 15197:2013 and are expressed in mg/dL.
Relative accuracy was assessed by comparing the mean absolute relative difference (MARD) between the 3 meter systems. As this study attempted to gather real-life data, only the locally available reference (hexokinase) method was used in accordance to another publication by the same authors. 12 Lower MARD values indicate smaller difference between reference value and meter value. The MARD values for each system are plotted in Figure 2. Pairwise comparisons (Tukey’s honestly significant difference, HSD) indicate that differences in MARD between all pairs of meter systems were statistically significant (p ≤ 0.05, Figure 2). The MARD for the CNU (3.41%) was statistically significantly lower than for FIL (4.12%) or OT (5.10%).
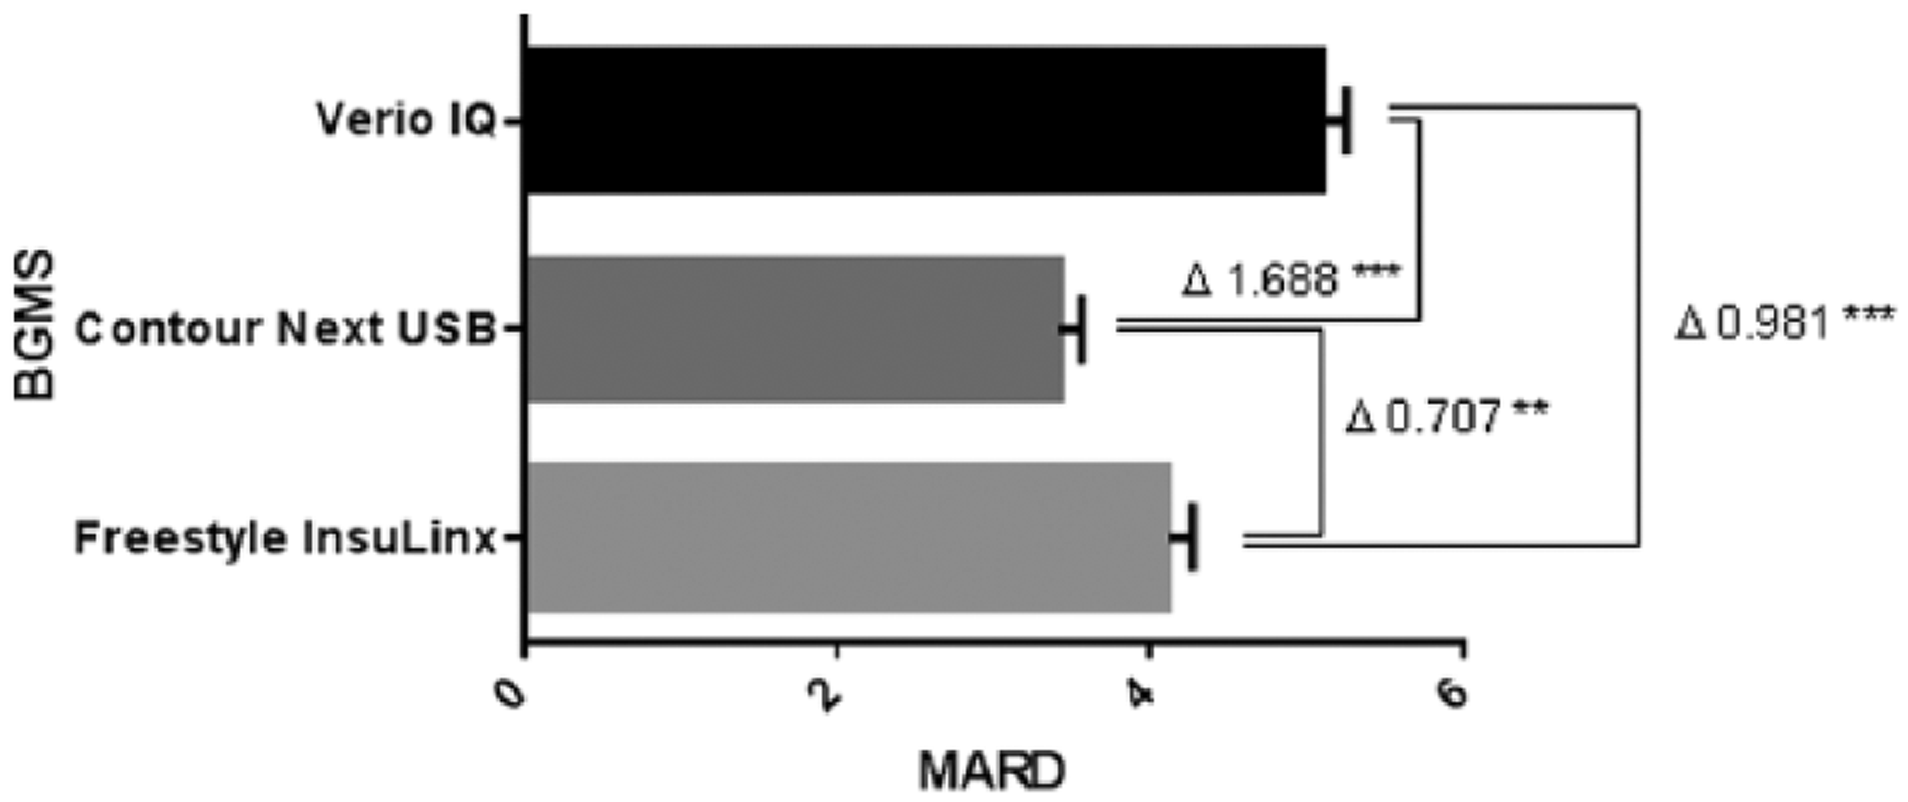
MARD among the 3 meter systems. Lower MARD values indicate smaller difference between reference value and meter value. Delta (Δ) indicates the MARD differences between the BGMS, and asterisks indicate statistical significance (**P < .01, ***P < .001) of the differences, calculated according to Tukey’s honestly significant difference (HSD).
CEG analyses 10 were performed for each BGMS independently and are displayed in Figure 3. All (100%) results obtained with the CNU were within zone A signifying that the measurement error has “no effect on clinical action.” The remaining 2 BGMS also had results in zone B (1.2% for FIL and 0.7% for OT). Zone B is defined by the risk of an erroneous measurement to have “altered clinical action with little or no effect on clinical outcome” as a consequence. There were no results in zones C, D, or E for any of the BGMS; these zones signify greater (increasing) clinical significance of measurement errors. 10
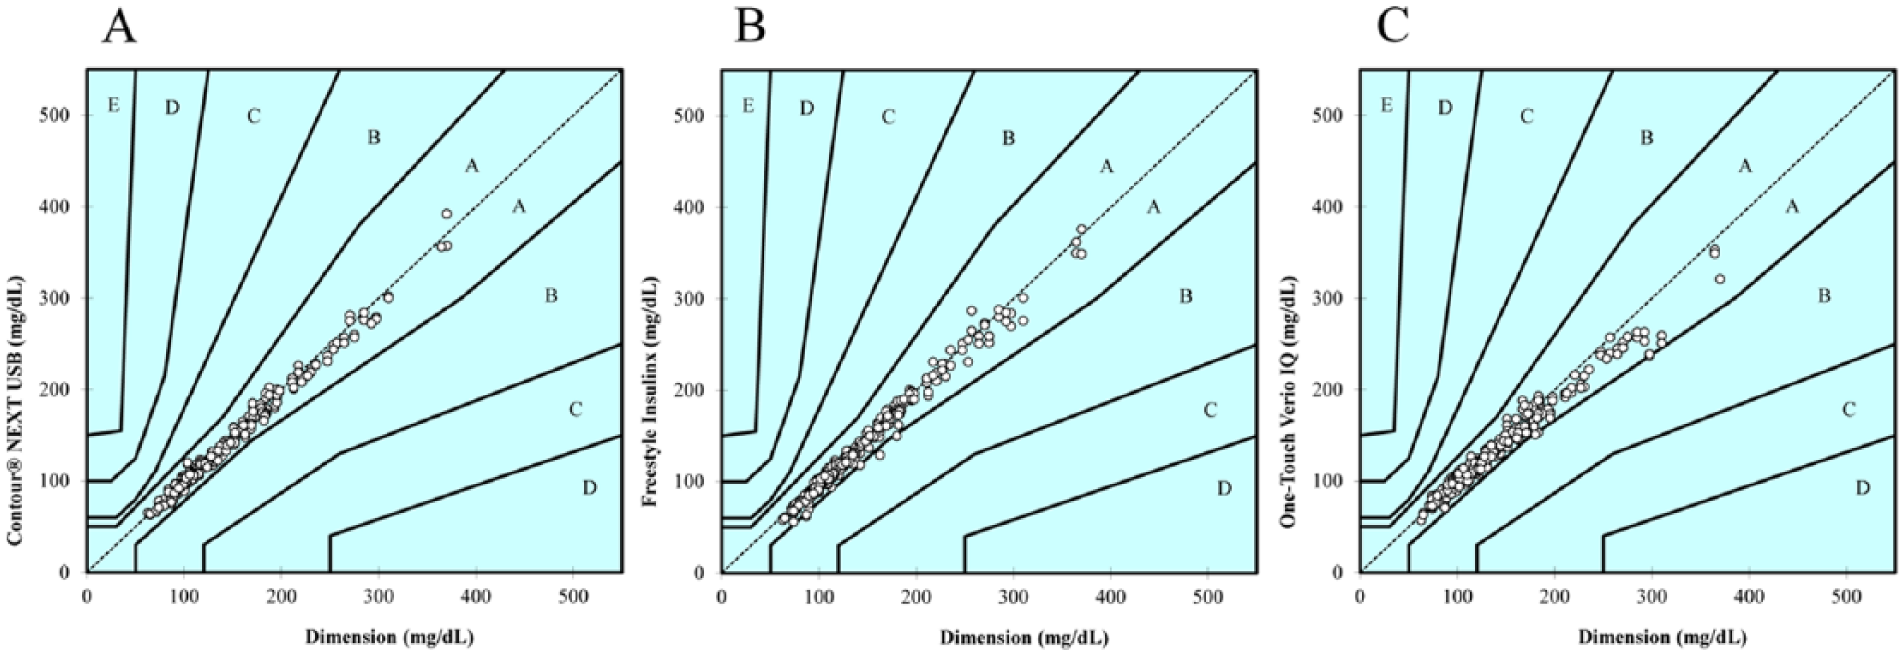
Consensus error grid analysis for the results obtained with the CNU (A), FIL (B), and OT (C). For each plot, the y-axis depicts the BGMS result, while the x-axis represents the result obtained with the reference method. The zones within each plot (A to E) indicate the increasing clinical significance of an erroneous measurement. 10
SEG analysis (Figure 4) shows that the measurements obtained with CNU and OT were mostly within the deep green zone (“no risk”; 99.51% for CNU and OT, roughly equivalent to zone A in CEG) and only 2 measurements for each of these BGMS were within the light green zone (“slight, lower risk”; 0.49% for CNU and OT, roughly equivalent to—albeit markedly smaller than—zone B in CEG). In contrast, 97.04% of measurements with the FIL BGMS were within the “no risk” zone, 2.46% were within the “slight, lower risk” zone, and 2 measurements (0.49%) fell within the yellow, “slight, higher risk” zone.
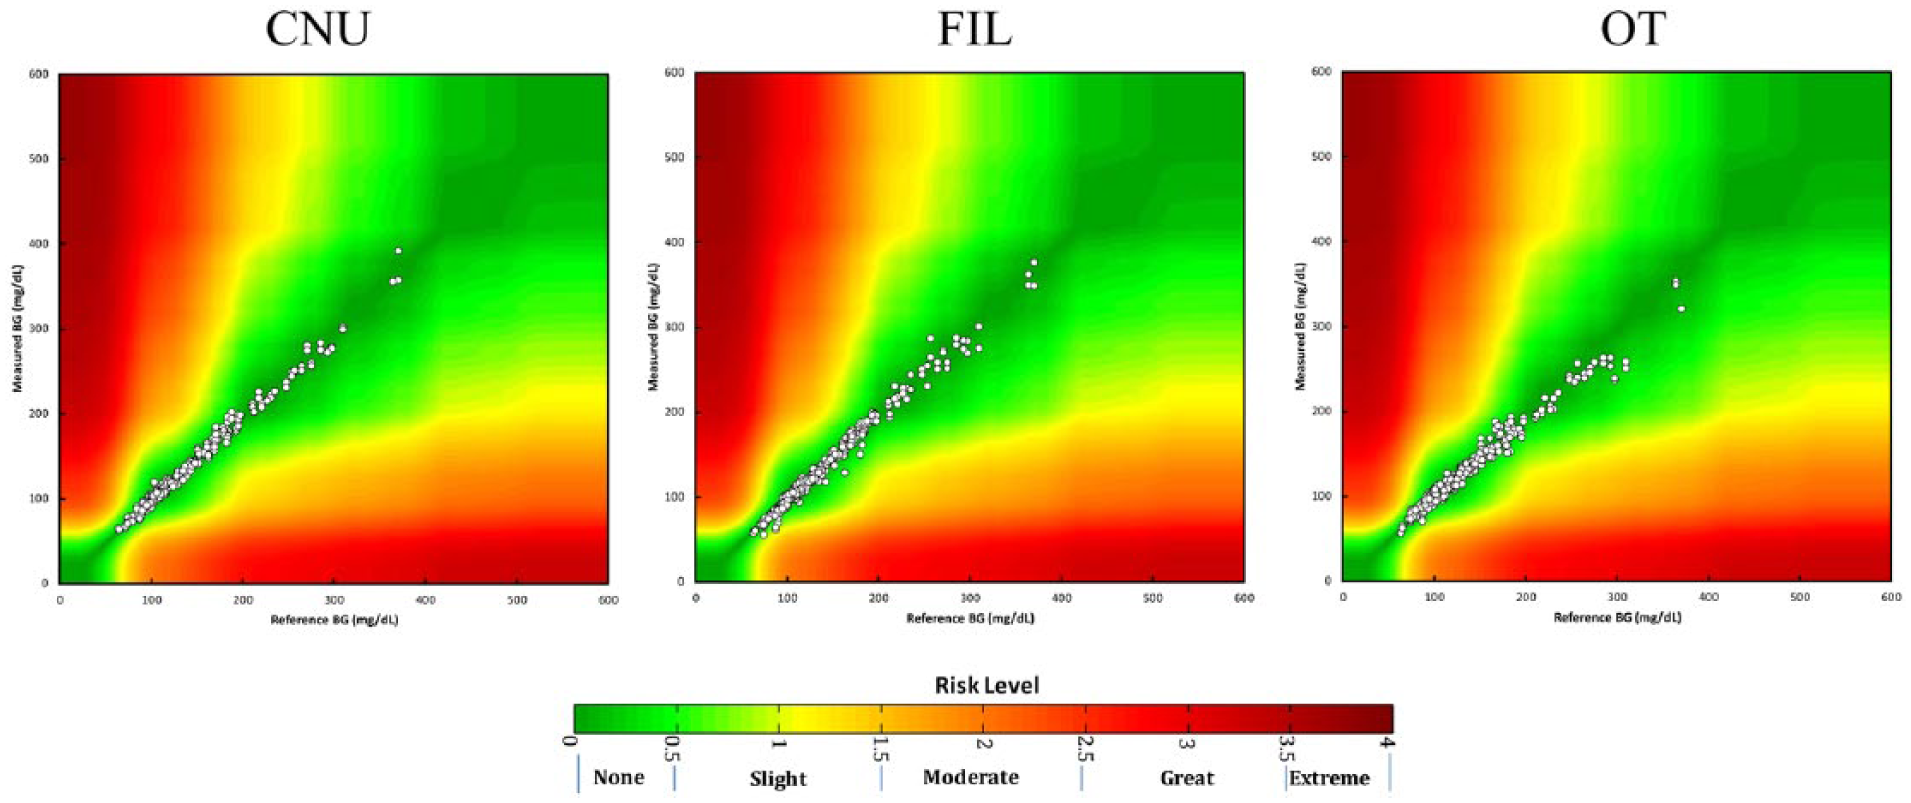
Surveillance error grid analysis for each BGMS (CNU, FIL and OT). The y-axis depicts the BGMS readings, the x-axis the reference method BG measurement. The color-coded risk zone definition is according to Klonoff et al. 11
For each BGMS, the bolus insulin dosing error was calculated resulting from the difference in the dose determined using the meter result and the dose determined using the hexokinase method (as described above). The distribution of dose errors is depicted in Figure 5. Negative dose errors represent bolus insulin underdosing, and positive dose errors represent insulin overdosing. These findings show that the insulin dose error obtained with the Contour Next USB fell significantly within a smaller range than those obtained with the 2 other BGMS.
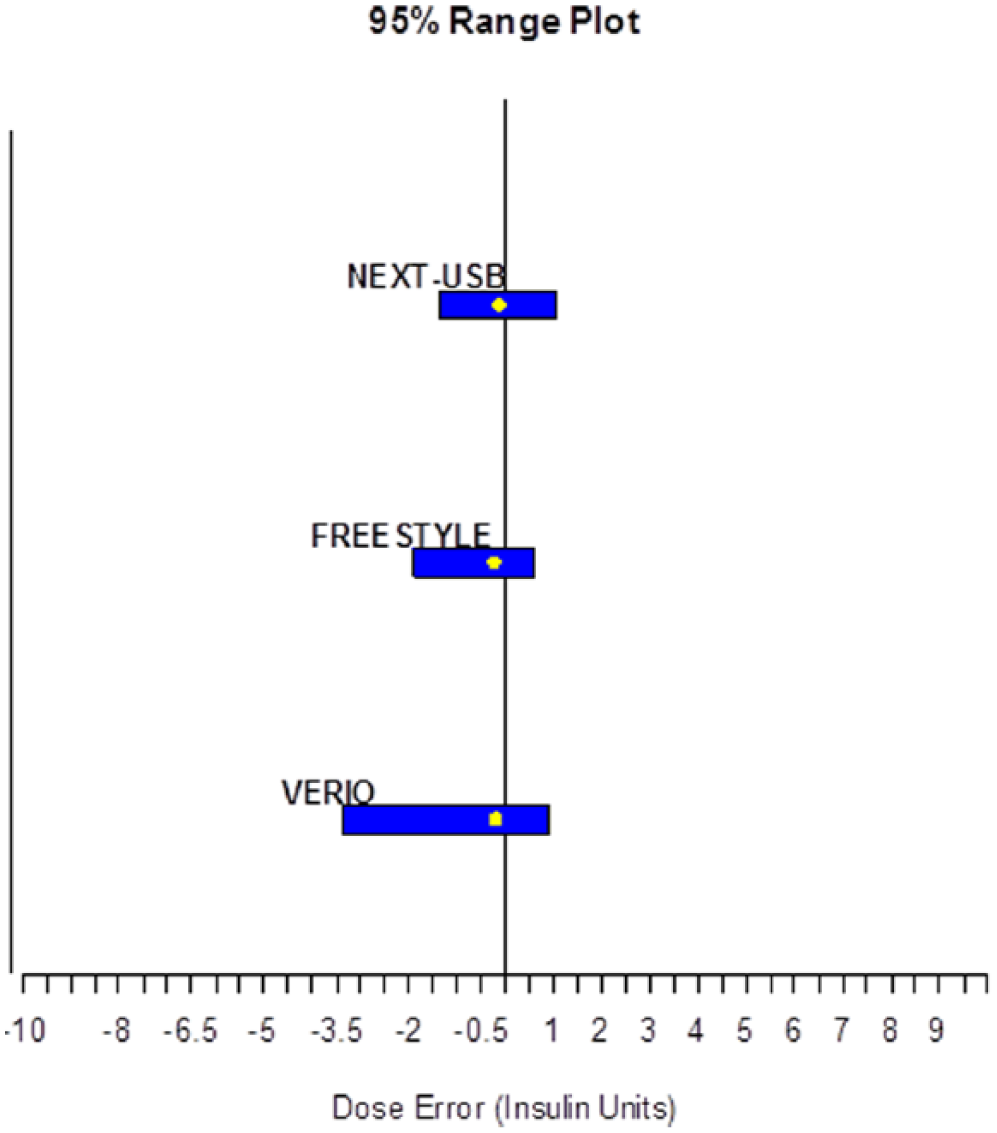
Insulin dose error analysis. The x-axis is the insulin dose error (in insulin units). Bars show the 95% range of potential dose errors caused by erroneous measurements.
Discussion
In the management of diabetes the results of BG self-monitoring are of high importance for the patient’s therapy, behavior and outcomes.1-5 In the present study, the accuracy of 3 BGMS was assessed, according to ISO 15197:2013 accuracy limit criteria using hexokinase reference method as a comparison, and also by means of parameters reflecting the clinical significance of erroneous measurements. In addition to being the local reference method, the hexokinase method is a commonly used method throughout Europe, and the method of choice of many technical certification providers (see Introduction) as well as in leading hospitals in Spain. 12 In a recent publication, a mean bias (systematic measurement difference) has been described to be < 2.2% for the hexokinase method (albeit using an instrument by a different manufacturer). 13 The results of all tested BGMS (Table 2) met the ISO accuracy limit criterion A that 95% of the measured individual glucose values shall fall within ± 15 mg/dL or ± 15% of the reference method value (for glucose concentrations < 100 mg/dL and ≥ 100 mg/dL, respectively). 7 CEG evaluation 10 showed that none of the measurements of any tested BGMS fell in a risk category considered as significant (zone C or higher) (Figure 3). For CNU, all (100%) measurements fell within zone A which indicates that the respective measurement error has “no effect on clinical action.” 10 Thus, the novel criterion B of ISO 15197:2013 (which requires 99% of measurements to fall in zones A or B; for patients with type 1 diabetes) was fulfilled as well. It must be noted that the CEG, although recently included into the ISO 15197:2013 accuracy requirements for type 1 diabetes patients, 7 is considered increasingly obsolete, as it does not take into account recent advances in diabetes therapy. Notwithstanding, this additional criterion was also fulfilled by all 3 BGMS and point to a high degree of accuracy.
Comparing all 3 BGMS, CNU showed the smallest MARD values (Figure 2). These results are consistent with results from a previous comparator trial. 14 In that trial, 5 different BGMS were compared (Contour Next EZ, Accu-Chek® Aviva, FreeStyle Freedom Lite®, OneTouch Ultra 2, and TRUEtrack®). Contour Next EZ (equivalent to Contour XT but named differently in the United States and Canada) had the lowest MARD across the tested glucose ranges. Results are further strengthened by another recently published study on Contour XT accuracy conducted in Germany, which reported 100% of results to be within zone A. 15 Results are relevant, as Contour Next USB is a similar BGMS which utilizes the exact same technology and test strips.
Recently, in a joint effort, various medical societies and authorities (Diabetes Technology Society, Food and Drug Administration, American Diabetes Association, the Endocrine Society, and the Association for the Advancement of Medical Instrumentation, as well as representatives of academia, industry and government) have introduced the new SEG, that displays clinical risk on a continuous color-coded scale. 11 The SEG, due to its recent introduction and its suitability for both type 1 and type 2 diabetes patients regardless of insulin use, is considered an updated method for assessing clinical significance of errors. This analysis showed that none of the BGMS results fell within higher risk categories. However, while CNU and OT results were almost entirely located in the “no risk” zone of the SEG, the FIL also had results in the yellow “slight, higher risk” zones (Figure 4). Results seem to support the premise that the SEG is able to distinguish slight reading errors more precisely than the CEG: in CEG, 1.7% (FIL) and 1.0% (OT) of readings fell in zone B (zone B indicating “little to no effect on clinical action”). To see how the SEG’s “slight, higher risk” category translates into CEG’s “little to no effect on clinical action” warrants further investigation.
Interestingly, the bolus insulin dosing error—the difference of hypothetical insulin doses calculated based on BGMS and reference method results 8 —was lowest for the CNU and highest for the OT BGMS. Both, the FIL and OT BGMS showed an insulin dosing error indicating a tendency toward underdosing (ie, resulting in potential hyperglycemia), while the confidence range for the CNU was equally distributed around −1.5 to 1.5 insulin units (Figure 5). Insulin dosing errors are of high clinical relevance as they may be compounded over time since modification of insulin dosing may occur consecutively and multiple times a day. 3 The method used in this study has been published by the Diabetes Teaching Center of the University of California, San Francisco, USA.
There are some methodological issues that need to be considered in the interpretation of these results. In the present study not all the methodologies laid out in ISO 15197:2013 section 6.3 (7) were used, for example only venous blood and 2 strip lots were employed, which was in line with local routine hospital procedures. Another point to consider is that this study assessed the accuracy of the respective BGMS as used by trained health care professionals only. It did not, as stipulated by ISO 15197:2013 section 8, assess the accuracy in the hands of patients. Thus, possible handling inconsistencies by laymen use may have not been taken account of in this study. Therefore, future studies including measurements taken by the patients themselves (self-testing) might yield data closer to the real-world situation, and thus, uncover potential practical shortcomings of each device.
Conclusions
The value of the current study lies in the comparison of 3 commonly used BGMS under routine conditions in a leading hospital in Spain. All BGMS fulfilled ISO 15197:2013 accuracy limit criteria and CEG criterion. However, taking together all analyses, differences in performance of potential clinical relevance may be observed. Results showed that Contour Next USB had lowest MARD values across the tested glucose range, as compared with 2 other common BGMS. CEG and SEG analyses, as well as calculation of the hypothetical bolus insulin dosing error together suggest a high accuracy of the Contour Next USB.
Footnotes
Acknowledgements
The authors would like to thank Beatriz Fernandez-Tresguerres (Bayer HealthCare, Germany) and Christoph Engler (GKM Gesellschaft für Therapieforschung mbH) for support in completion of this article.
Abbreviations
ARD, absolute relative difference; BG, blood glucose; BGMS, blood glucose monitoring system; CEG, consensus error grid; CNU, Contour Next USB; EDTA, ethylenediaminetetraacetic acid; FIL, FreeStyle InsuLinx; HSD, honestly significant difference; ISO, International Organization for Standardization; LCL, lower confidence limit; MARD, mean absolute relative difference; OT, OneTouch Verio IQ; SEG, surveillance error gird; UCL, upper confidence limit.
Declaration of Conflicting Interests
The author(s) declared the following potential conflicts of interest with respect to the research, authorship, and/or publication of this article: JFW, SP, and TP are full-time employees of Bayer Inc.
Funding
The author(s) disclosed receipt of the following financial support for the research, authorship, and/or publication of this article: The study, including publication, was funded by Bayer Hispania SL Spain and Bayer HealthCare Germany, Leverkusen, Germany