
Abstract
Background:
Self-monitoring of blood glucose is crucial for the effective self-management of diabetes. The present study evaluated the accuracy of the Contour® XT blood glucose monitoring system (BGMS) compared to the reference method in a large multicenter study under routine lab conditions at each hospital site.
Methods:
This study was conducted at 21 leading hospitals in Spain using leftover whole blood samples (n = 2100). Samples were tested with the BGMS using 1 commercial strip lot and the local laboratory hexokinase method. BGMS accuracy was assessed and results were compared to ISO 15197:2013 accuracy limit criteria and by using mean absolute relative difference analysis (MARD), consensus (Parkes) error grid (CEG), and surveillance error grid analyses (SEG).
Results:
Pooled analysis of 2100 measurements from all sites showed that 99.43% of the BGMS results were within the ranges accepted by the accuracy limit criteria. The overall MARD was 3.85%. MARD was 4.47% for glucose concentrations < 70 mg/dL and 3.81% for concentrations of 70-300 mg/dL. In CEG, most results (99.8%) were within zone A (“no effect on clinical action”); the remaining ones (0.2%) were in zone B (“little to no effect on clinical action”). The SEG analysis showed that most of the results (98.4%) were in the “no risk” zone, with the remaining results in the “slight, lower” risk zone.
Conclusions:
This is the largest multicenter study of Contour XT BGMS to date, and shows that this BGMS meets the ISO 15197:2013 accuracy limit criteria under local routine conditions in 21 leading Spanish hospitals.
Keywords
Self-monitoring of blood glucose is a daily requirement for many diabetes patients. Multiple daily measurements are often a prerequisite to obtain and maintain patient health and support appropriate treatment. Patients may adjust their medication, diet, exercise and life-style according to the self-testing results of their blood glucose monitoring system (BGMS). Thus, any malfunction, including even slight inaccuracies could have a profound impact on patients’ well-being and quality of treatment.1-4
The Contour® XT BGMS (Bayer Consumer Care Basel, Switzerland), which uses Contour Next test strips, has been developed to provide a highly reliable and easy-to-use tool for patients’ diabetes management. It has been designed for self-monitoring and point-of-care use with fresh capillary and venous blood samples.
Several previous studies have proven the system’s high accuracy and ease of use. Specifically, it has been shown that this BGMS fulfilled the standards within the International Organization for Standardization ISO 15197 accuracy limit criteria, 5 even after the required accuracy was increased in 2013.6-8 In fact, it has been shown that > 99% of the BGMS measured results were within the more stringent limits of ± 10 mg/dl or ± 10% of the reference results.9,10
The objective of the present postmarketing study was to determine if health care professionals in 21 leading hospitals in Spain testing venous whole blood with the Contour XT System would achieve the goal that 95% of results, (pooled results and from each individual site), would fall within the ISO 15197:2013 limits, that is, ±15 mg/dL (for BG < 100 mg/dL) and within ±15% (for BG ≥ 100 mg/dL) of the local laboratory reference result (hexokinase method). The study was conducted under local routine conditions and did not attempt to fulfill formal methodological ISO requirements (ISO 15197:2013, section 6.3). Discrete (ie, binary) measures, such as those described in ISO 15197:2013, 5 have several shortcomings as compared to continuous measures and do not take into account the clinical significance of respective erroneous measurements.11,12 Therefore accuracy was also assessed by analyzing the mean absolute relative difference (MARD) between BGMS reading and hexokinase result, as well as consensus (Parkes) error grid (CEG) and surveillance error grid (SEG).
The BGMS used in the study is marketed as well in the United States and Canada (under the name Contour Next EZ BGMS). Therefore, accuracy performance was also assessed according to draft accuracy limits recommendations of the American Food and Drug Administration (FDA). 13
The findings in this study indicate that the Contour XT, despite being evaluated under local laboratory study conditions in a large scale multicenter setting, meets the more accurate ISO 151979:2013 limits, as well as established and modern error grid–based accuracy criteria.
Methods
Subjects
Leftover venous blood samples obtained for routine testing, including testing for glucose and hematocrit, were used. Therefore, no information on the subjects (ie, demographic, personal data or information on the medical history) was obtained. Following local regulations (local hospital regulations and Spanish Law 14/2007) patients’ informed consent was not required, because analyses were performed on leftover venous blood samples, and were not linked to any subject information. Measurements were exclusively carried out by trained staff without involving any patient participation.
Local ethics committee approval was obtained when required.
Study Design
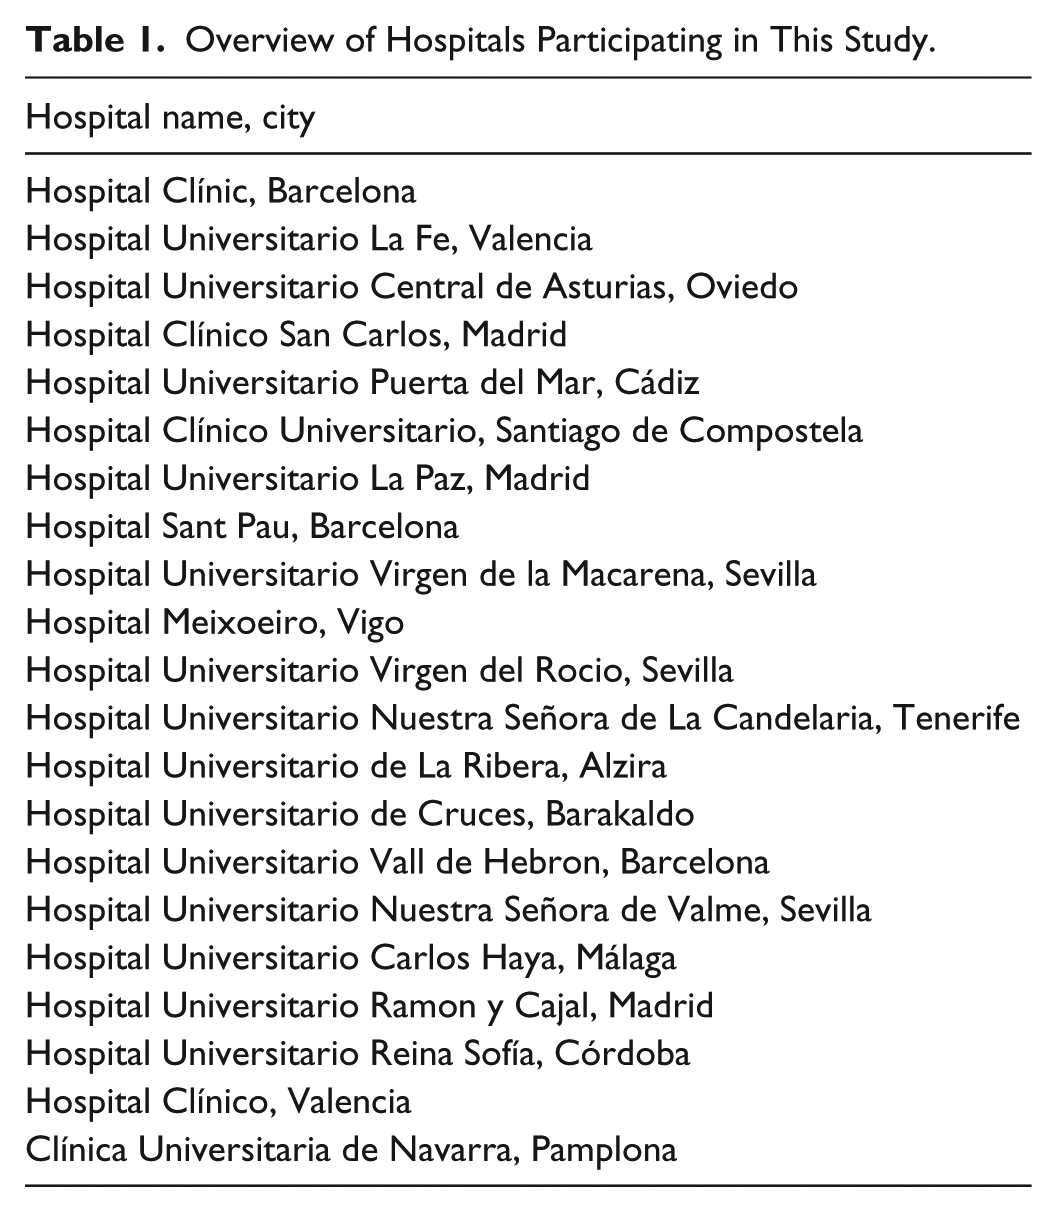
This noninterventional, multicenter, national study was conducted at 21 leading Spanish hospitals under local routine laboratory conditions. All participating hospitals were national teaching hospitals with high-volume diabetes units and large, ISO-certified laboratory facilities (Table 1).
Overview of Hospitals Participating in This Study.
In this study, whole blood glucose levels were assessed using the Contour XT BGMS with 1 commercially available strip lot (DP3BFEC02B) and the respective hexokinase laboratory reference assay established at the respective hospital. All testing was conducted by site staff trained in a common investigator meeting to ensure identical knowledge of the protocol and handling of the BGMS as well as the respective local reference (hexokinase) method for the comparative glucose measurement.
A total of 2100 venous blood samples (100 per site) were used in this study, and testing was performed shortly after the blood collection (average overall time: 7 minutes). All samples consisted of fresh venous blood. The samples had been collected in tubes containing lithium or sodium heparin; ethylenediaminetetraacetic acid (EDTA) and other anticoagulants besides heparin were not allowed. Samples were kept at room temperature at all sites at all times.
Each blood sample was gently mixed and 1 drop was dispensed onto a clean glass slide immediately before each test with the BGMS. In contrast to ISO 15197:2013, section 6.3 methodology, blood glucose measurements were derived from 1 single measurement. The time interval between BGMS test and centrifugation for subsequent measurements with the reference method did not exceed 10 minutes.
Prior to the start and on every day throughout the study, to ensure that the BGMSs were performing correctly, each meter was tested with the corresponding test strip and normal control solution provided with each meter kit. All sites used the same test strip lot throughout this study.
The accuracy of the hexokinase reference method was assessed using serum controls (Liquid Assayed Multiqual, BioRad®, Hercules, CA). At each site, 3 control sera with different glucose concentrations were tested in duplicate on each instrument over a 5-day period prior to the study and during each day of the study. Results were compared to predetermined limits of the manufacturer of the BGMS to ensure the reference analyzer was operating properly prior to testing blood samples.
Hematocrit was measured for each sample using the local laboratory method.
Assessment and Analyses
Basic descriptive statistics including absolute and relative frequency distributions and 2-sided 95%-confidence intervals were used for description of the precision and accuracy results. Modified Bland–Altman plots were composed using SAS/JMP 11 (SAS Institute Inc, Cary, NC, USA) software. Regression analysis was utilized for assessing the impact of hematocrit levels on BGMS accuracy. Further regression analysis utilizing weighted least squares (WLS), with weight (w) function
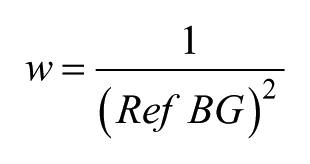
was used to fit a straight line to data pairs - BGMS and reference method (Ref BG). The weighting function was chosen to account for the constant coefficient of variation nature 14 of blood glucose measurements. Regression statistics were computed with outliers excluded, as per ISO 15197:2013, section 8.7, guidelines, and also with outliers included.
An additional analysis was performed to assess accuracy of the BGMS by calculating the MARD between the BGMS and the reference hexokinase method. MARD, as a continuous parameter, offers a better measure of differences between results obtained with different methods within a single study. 11 MARD is the mean of the absolute value of relative (%) difference (ARD) between a BGMS result (BG) and the corresponding hexokinase (H) result
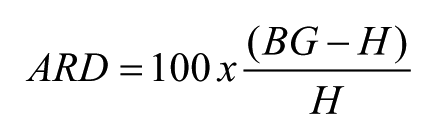
Lower MARD values indicate smaller differences between reference values and meter values.
CEG analysis attempts to account for the clinical importance of respective BGMS errors by assigning the error of a BGMS measurement to 1 of 5 increasing clinical risk categories.12,15 CEG analyses were performed for all samples and for each site according to the original approach described by Parkes 15 using a Microsoft Excel™ VBA macro program (Microsoft Corporation, Redmond, WA, USA).
Recently, in a joint effort, various medical societies and authorities (Diabetes Technology Society, FDA, American Diabetes Association, the Endocrine Society, and the Association for the Advancement of Medical Instrumentation, as well as representatives of academia, industry and government) have introduced a new, so-called SEG that displays clinical risk on a continuous color-coded scale. 16 The SEG, due to its recent introduction and its suitability for both type 1 and type 2 diabetes patients regardless of insulin use, takes into account advances in diabetes therapy of the last decade and heightened concerns about the accuracy of measurements, and thus is likely to find greater acceptance over the next years. SEG analyses were performed for all samples and for each site according to the methodology described by Klonoff et al 16 using a Microsoft Excel VBA macro program.
In the context of further post hoc analyses, accuracy performance was as well assessed according to the draft accuracy limits recommendations of the FDA for OTC use. 17 To demonstrate that a BGMS is sufficiently accurate to be used safely by diabetic patients and to enable them to make well-founded decisions about their treatment, the FDA recommends that 95% of all BGMS results in the study are within ±15% of the reference measurement across the entire measuring range of the device (to be called in this manuscript FDA criterion a), and that 99% of all BGMS results are within ±20% of the reference measurement across the entire measuring range of the device (to be called in this manuscript FDA criterion b).
Results
Sample Characteristics
The glucose range of the 2100 analyzed samples was 33 to 562 mg/dL (mean 115 mg/dL) as measured by the laboratories’ reference hexokinase method.
A total of 1081 samples (51.5%) had glucose concentrations > 100 mg/dL; the remaining 1019 samples showed glucose concentrations < 100 mg/dL. Hematocrit levels of all samples ranged from 15% to 57% with a mean of 38.7%; regression analysis showed no impact of hematocrit levels on BGMS performance (not shown).
Accuracy
Accuracy of the Local Laboratory Hexokinase Reference Method
All the results obtained with the glucose serum control solutions (Liquid Assayed Multiqual, BioRad) were within the respective limits provided by the manufacturer (target approximately ±20% of target; data not shown). For this study, however, even more stringent limits for the range of the BioRad controls were applied: For targets <100 mg/dL, the target limits were set to ±5 mg/dL. For ≥100 mg/dL the limits were set to target limits ±5%. For the low control level (target 60.89 mg/dL) all the results were within these more stringent limits. For the medium level (target 121.07 mg/dL), only 1 reading from 1 site was outside the more stringent upper limit. For the high level (target 362.12 mg/dL), 3 readings from 1 site were outside the more stringent upper limit. All together, results indicated that at all sites lab instruments yielded reliable and comparable results (Table 2).
Accuracy Results of Local Hexokinase Method at Various Sites Using 3 Different Control Solutions.
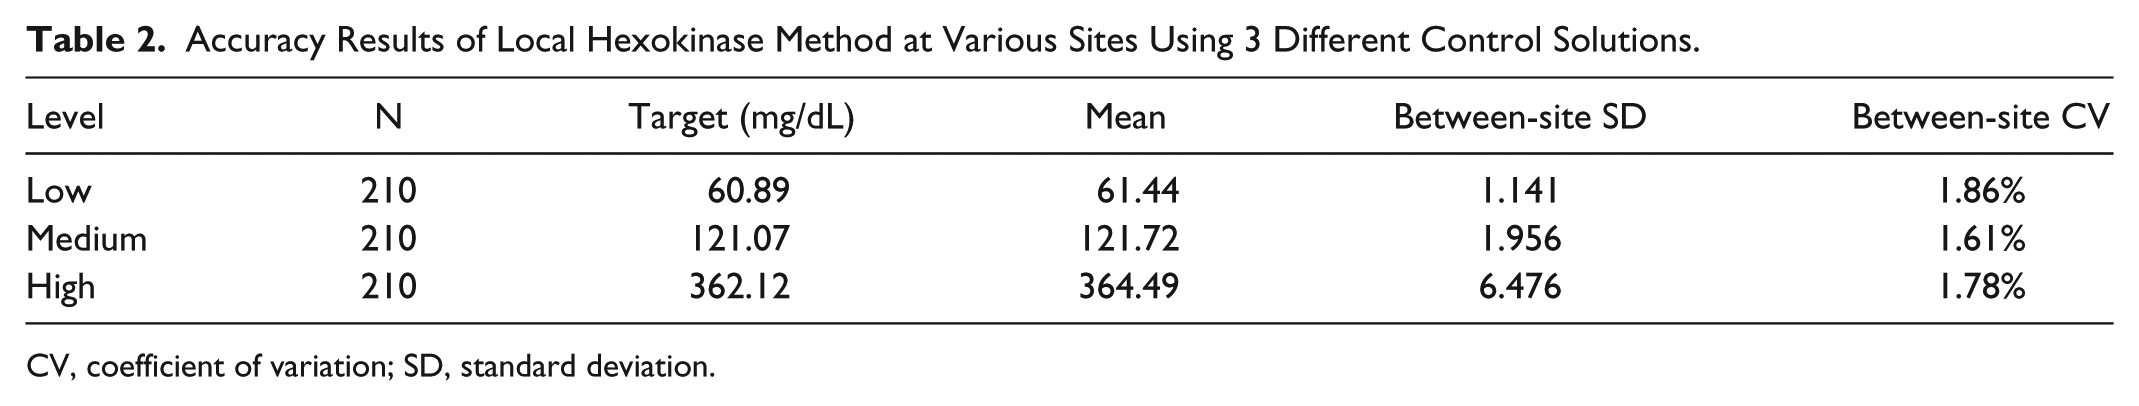
CV, coefficient of variation; SD, standard deviation.
BGMS Performance
No “error” codes occurred with the BGMS in the study. For all the meters used during the study, results of measurements of the provided normal control solution were within the specified label values (not shown).
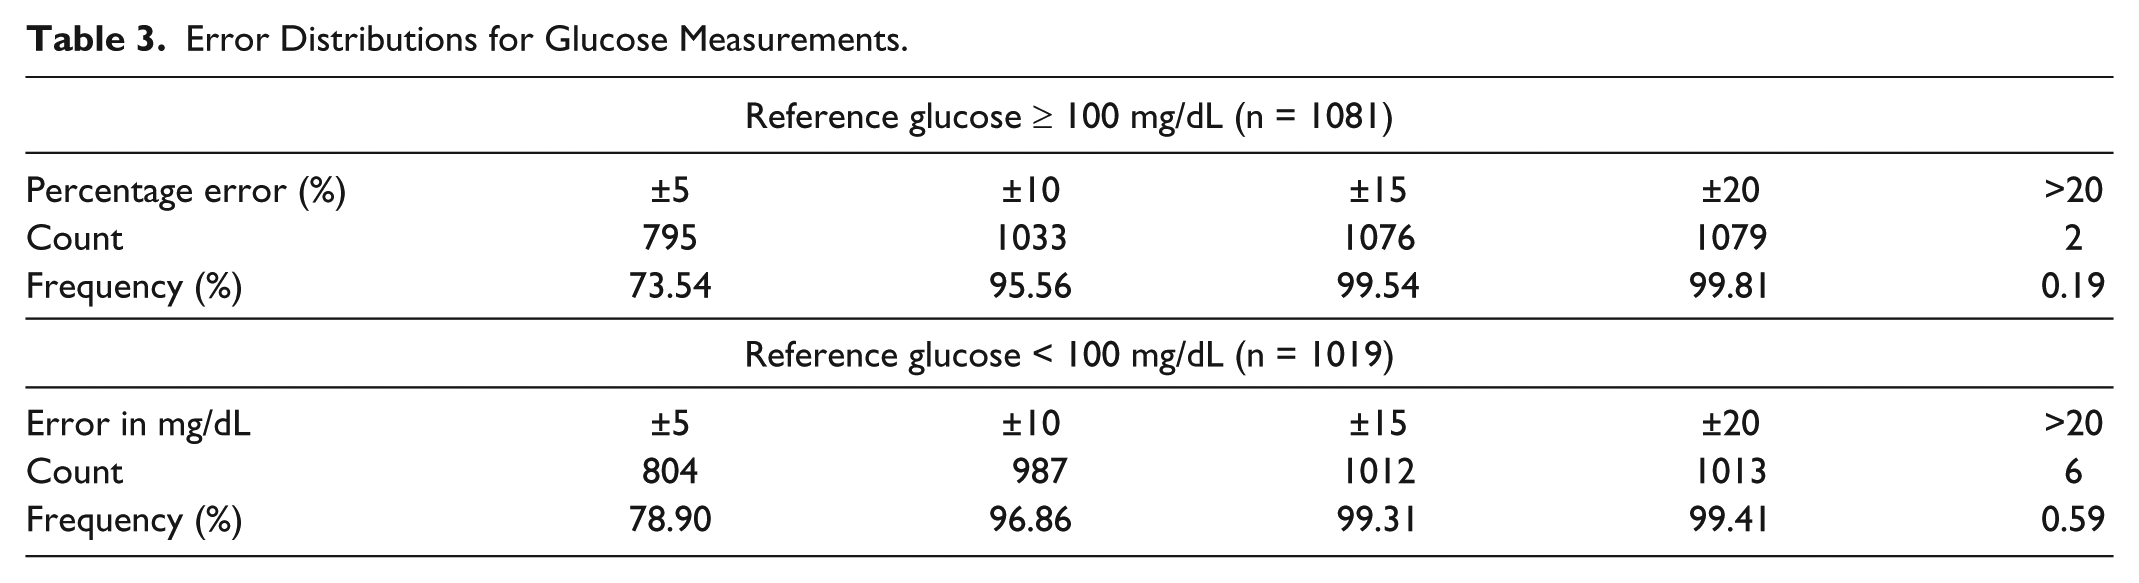
The vast majority (2088 out of 2100 samples, 99.43%, 95% CI: 99.00%, 99.67%) of all samples were within the ISO 15197:2013 accuracy limits (±15 mg/dL [<100 mg/dL] or ±15% [>100 mg/dL] of the hexokinase laboratory results). The corresponding error distributions are displayed in Table 3.
Error Distributions for Glucose Measurements.
More than 95% of all samples within each individual site were within the ISO 15197:2013 accuracy limits. At 14 sites (two-thirds of all sites) 100% of the results were within the accuracy limits. Only at 1 site, was the percentage exactly 95% within the criteria, but still meeting the ISO 15197:2013 accuracy limit criteria also at this site (data not shown).
Regression analysis between BGMS and reference method showed an adjusted R² of 0.9650 (without exclusion of outliers).
Accuracy of the BGMS Performance Within Specific Glucose Ranges
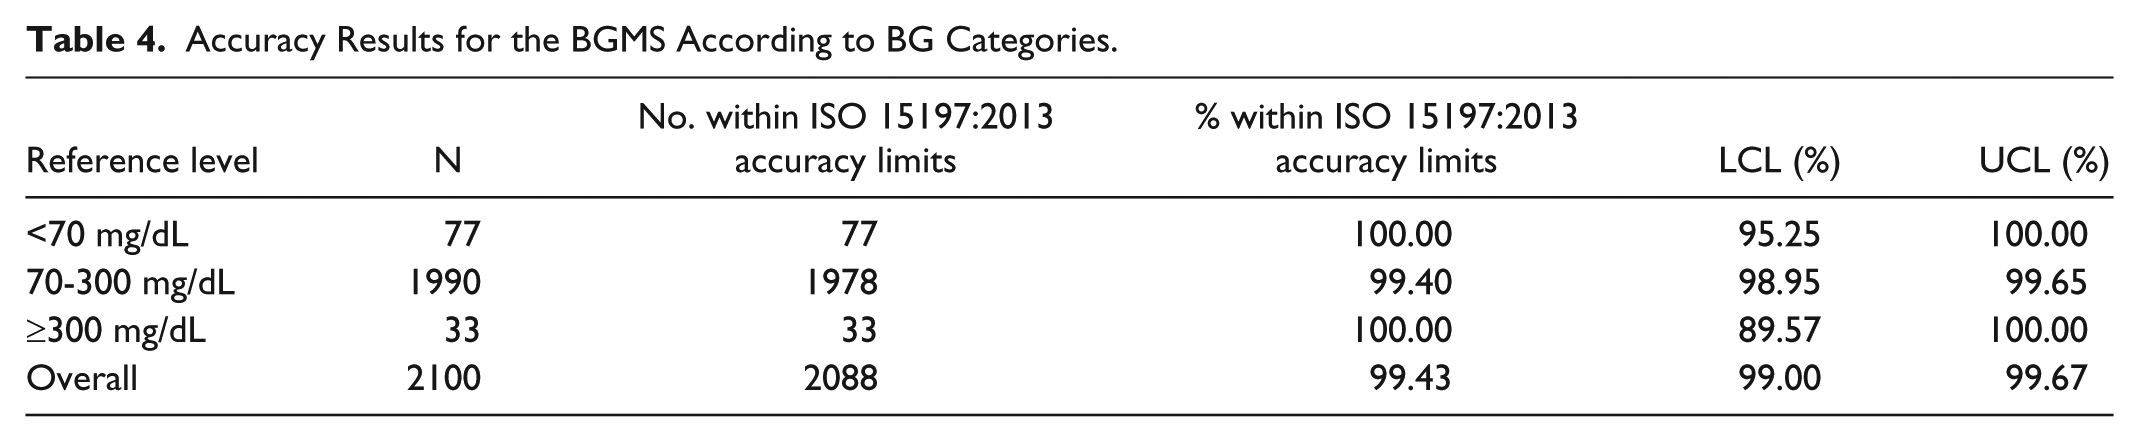
A post hoc analysis was performed to evaluate the accuracy of the BGMS measurements according to BG levels of the samples. Three categories were defined (<70 mg/dL, 70-300 mg/dL, ≥300 mg/dL), based on ranges of the reference hexokinase method. The majority of samples were within the 70-300 mg/dL subset. Results are summarized in Table 4.
Accuracy Results for the BGMS According to BG Categories.
Modified Bland–Altman plots generated using results of all evaluable samples combined as well as sorted according to the above categories. These are shown in Figure 1 and demonstrate that the majority of readings (99.40%, 95% CI: 98.95%, 99.65%) in the medium blood glucose range were within the ISO 15197:2013 limits. None of the readings in the low BG range (below 70 mg/dL), nor those above 180 mg/dL exceeded the ISO 15197:2013 limits.
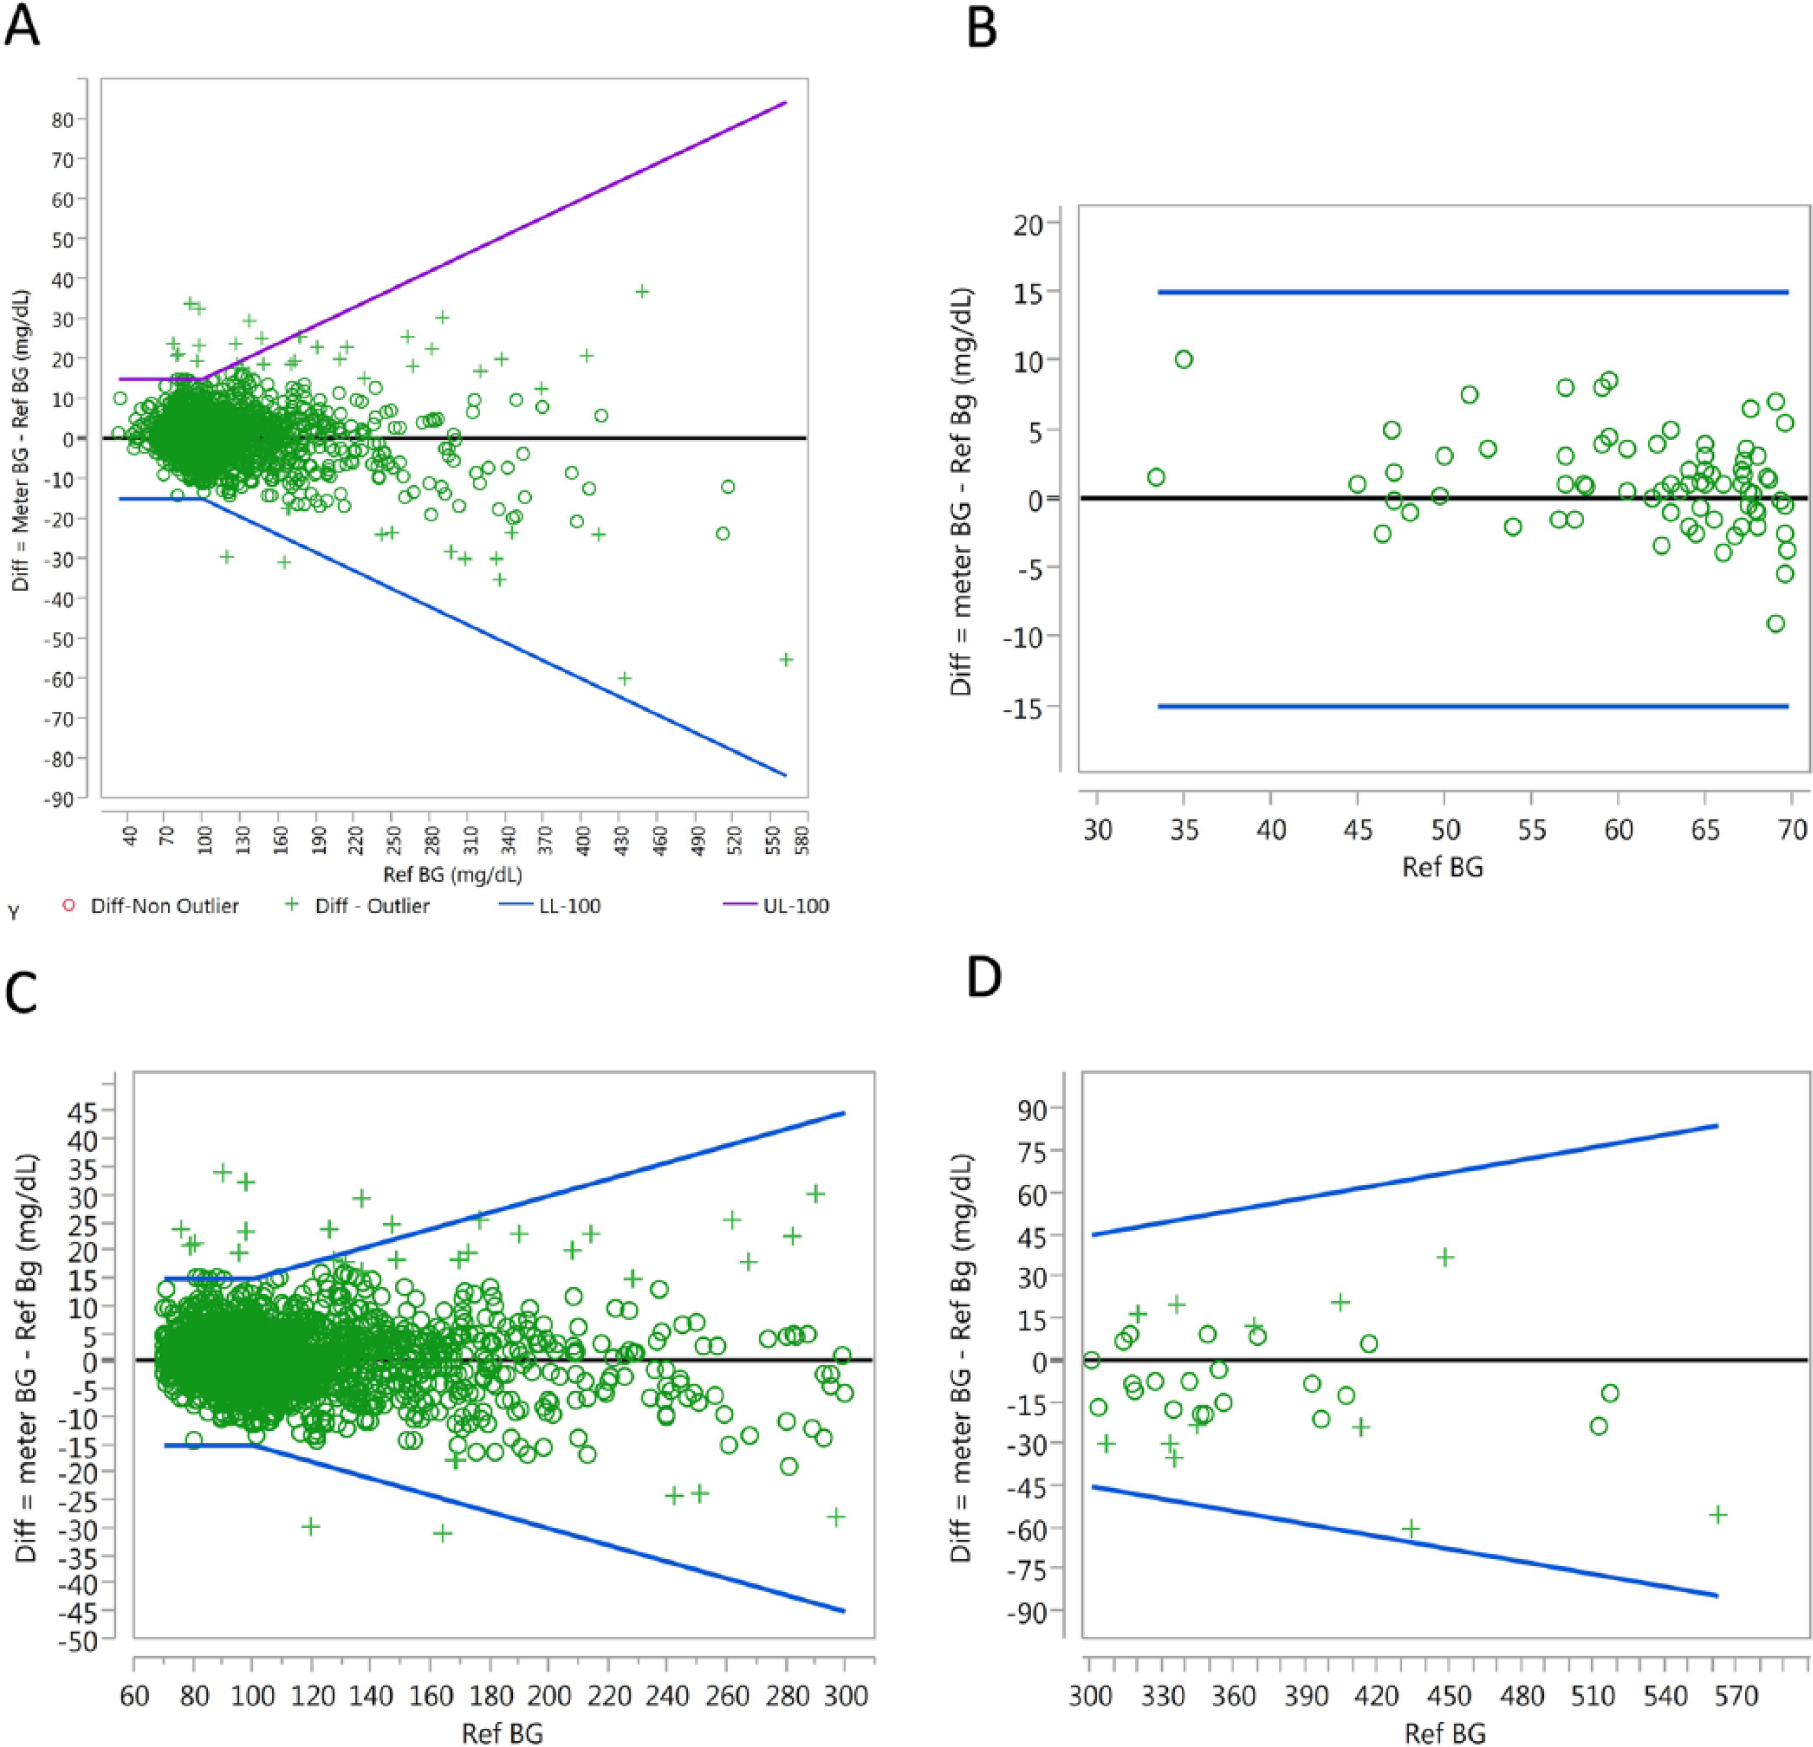
Modified Bland–Altman analysis of measurements for all samples (A), or according to reference value categories: <70 mg/dL (B), 70-300 mg/dL (C), and ≥300 mg/dL (D). A-D: The y-axis depicts the difference between BGMS result and the hexokinase reference result, and the x-axis is the blood glucose level as assessed by the reference hexokinase method (mg/dL). The lower and upper accuracy limits (LL, UL, expressed in mg/dL) depicted as blue lines in the plots are according to ISO 15197:2013 either ± 15 mg/dL (hexokinase < 100 mg/dL) or ± 15% of hexokinase result (hexokinase ≥ 100 mg/dL). Points are identified as outliers (cross symbols) if their Studentized residuals from the regression exceed the limits of approximately ±2.58, which represent the middle 99% range expected for such residuals. Nonoutliers are represented by circle symbols.
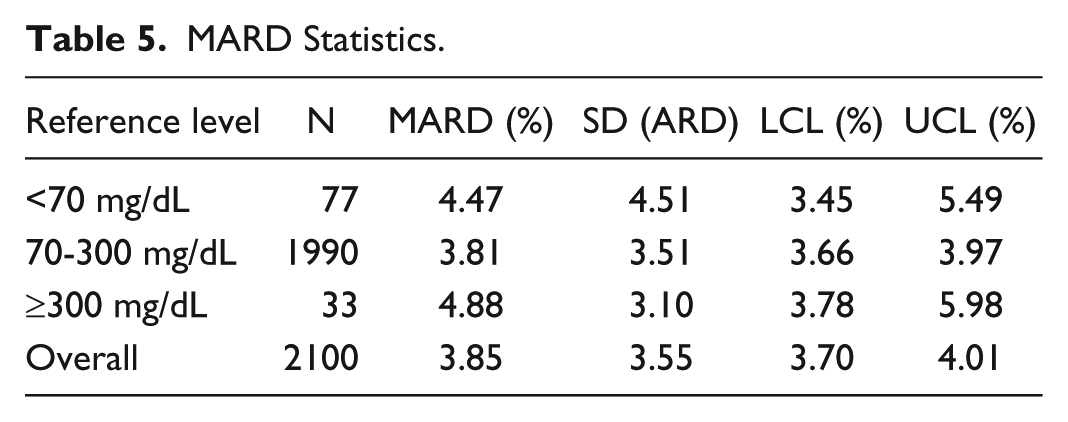
MARD analysis was computed for all evaluable results combined (overall) and for each subset of the data as previously described. Table 5 shows the results, along with the standard deviations of ARD and 95% confidence interval limits (lower confidence limit [LCL] and upper confidence limit [UCL]) for MARD. MARD was smallest for the medium glucose range 70-300 mg/dL.
MARD Statistics.
CEG analysis 15 (Figure 2) showed that 99.8% (n = 2096) of the results for the BGMS were within zone A, signified as “no effect on clinical action.” The results of 4 measurements (0.2%) were within zone B (“altered clinical action with little or no effect on clinical outcome”). There were no measurements with results in zones C, D, or E, all of which signify errors with a higher clinical relevance. 15
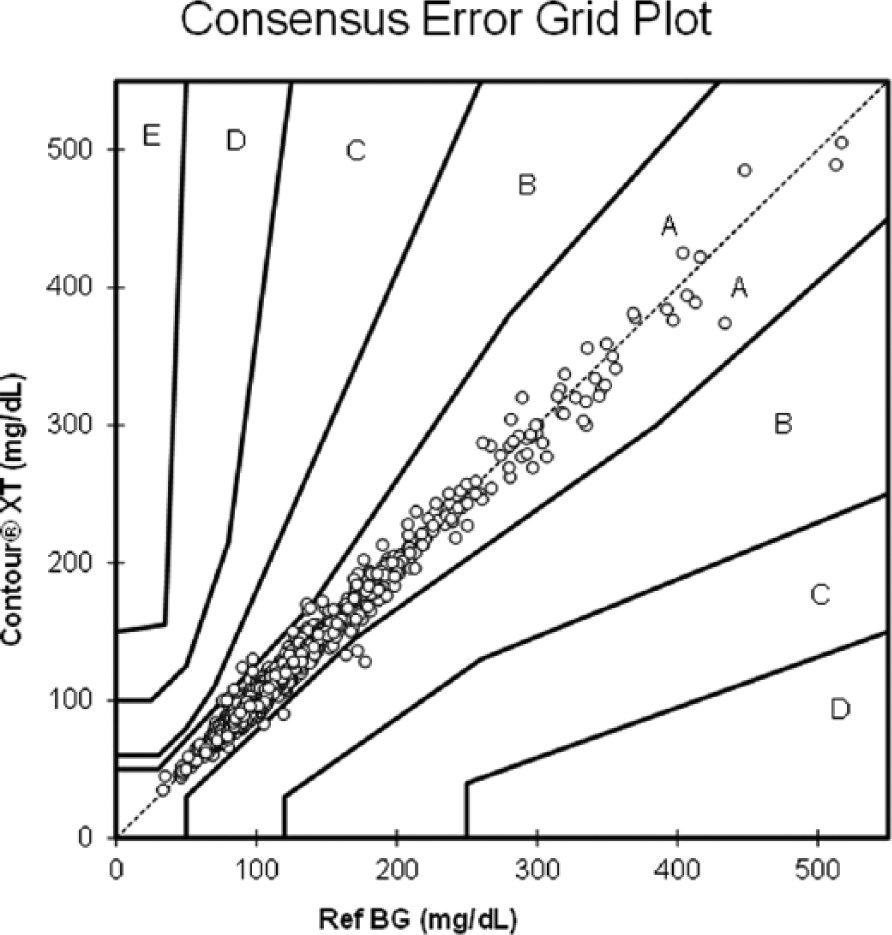
Consensus (Parkes) error grid analysis. The y-axis depicts the result of measurement with the BGMS; the x-axis shows the results of the reference hexokinase method measurement. Circles represent the individual measurements. Zone definitions according to Parkes et al. 15
SEG analysis revealed that 98.9% (n = 2076) of the results for the BGMS were in the “no risk” zone. The results of the remaining 24 measurements were in the “slight, lower” risk zone. No measurements fell into a higher risk category. Due to software limits (specified data limit of 2000 data points) a pooled graph could not be created. Therefore, sites were divided in 3 groups (700 data points each) for graphic depiction (Figure 3).
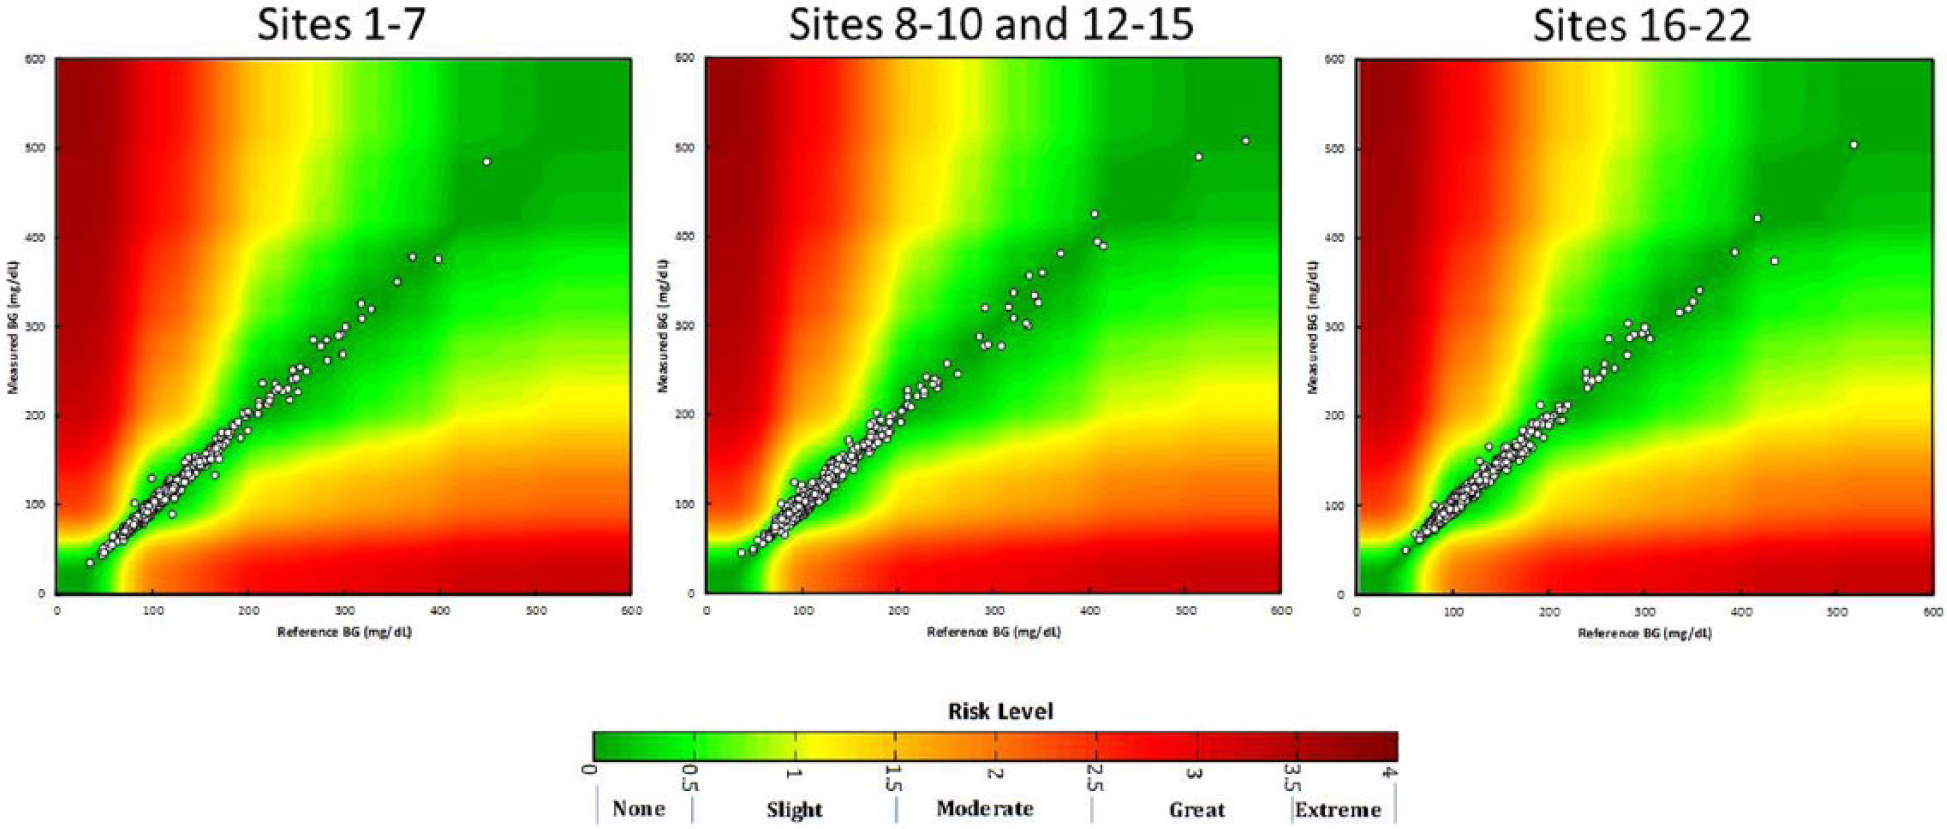
Surveillance error grid analysis, divided in 3 groups for technical reasons. Site 11 did not participate in the study. The y-axis depicts the result of measurement with the BGMS; the x-axis shows the results of the reference hexokinase method measurement. Circles represent the individual measurements. Zone definitions according to Klonoff et al. 16
In addition to comparing the results from this study to ISO 15197 accuracy criteria, the results were also compared to the draft accuracy limits recommended by FDA for OTC use. The BGMS met both limits (FDA criterion a, FDA criterion b, Table 6).
Performance of BGMS Measurements According to FDA Accuracy Limits (Post Hoc Analysis).
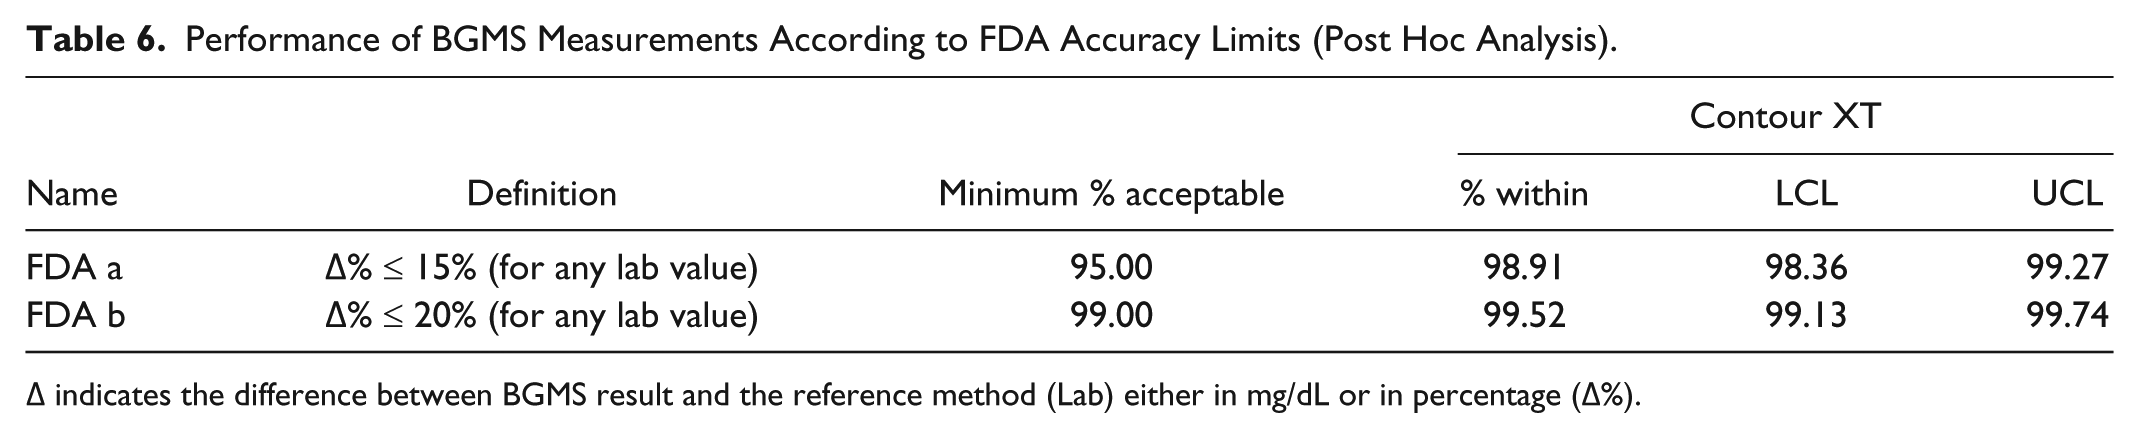
Δ indicates the difference between BGMS result and the reference method (Lab) either in mg/dL or in percentage (Δ%).
Discussion
The results of this postmarketing multicenter study support previous reports on the accuracy and reliability of Contour XT.7-10 To our best knowledge, this is the biggest multicenter study to date assessing the accuracy and reliability of a handheld BGMS compared to the standard reference method (hexokinase). Comparability of measurements was ensured by using the routine conditions and their hospitals’ standard reference method as a comparator. Accuracy of the local reference method was confirmed by daily testing of controls, exceeding the manufacturer’s standards. Overall results of the BGMS showed that the accuracy limit criteria of the ISO 15197:2013 were met in the hands of health care personnel. Notably, post hoc analyses demonstrated that the draft FDA BGMS accuracy limits for OTC use were fulfilled as well.
As ISO 15197:2013 accuracy limit requirements have been considered as insufficient for comprehensive accuracy assessment of BGMS,11,12 this study aimed to meet more stringent, and more relevant accuracy criteria. The importance for accuracy in BGMS lies primarily in the need to detect hypoglycemic events. Breton and Kovatchev 3 reported that the chance of missing a hypoglycemic event was 10% at a meter error level of 20%, which was reduced to just 1% at a meter error level of 10%. As well, in the hypoglycemic range, relatively small errors can have a major clinical impact and therapeutic consequences.4,12 Thus, accuracy requirements have to take into account the clinical relevance of erroneous measurements, for instance, if a false reading leads to hypoglycemia that goes unnoticed and untreated.
For these reasons, discrete (ie, binary) measures such as the ones described by ISO 15197:2013 provide less relevant information than continuous measures. In addition, they require much larger sample sizes to detect differences between systems or test methods. 11 Therefore in the presents study, a number of additional analyses were performed to gather more information on the clinical relevance of potential erroneous readings.
MARD is a continuous measure that accounts for percentage bias of each observation, and thus, correlates with ISO 15197:2013 accuracy measurements. MARD analysis has been used as the primary end point in another comparative study of 5 BGMS 18 and has been utilized in accuracy studies of continuous glucose monitoring systems as well.19,20 Our results show very small MARD values, which were lowest in the middle ranges of blood glucose, that is, 70-300 mg/dL, and only slightly higher in the low and high ends of the glucose level spectrum. As accuracy of BGMS tends to worsen in the low glycemic range, sufficient BGMS accuracy of low glucose samples measurements is of high clinical relevance. 7
Several error grid analysis systems have been developed over the last decades to account for the clinical significance of measurement errors between BGMS and reference method testing.15,16 CEG criteria 15 have also been included into the ISO 15197:2013 requirements for patients with type 1 diabetes, 5 requiring 99% of results to lie within Zones A and B. Small inaccuracies are, as pointed out above, of much higher clinical relevance if occurring in hypoglycemic versus normoglycemic states. 12 The vast majority of measurements in the present study (99.8%) were in zone A of the Parkes error grid—where an erroneous measurement would have “no effect on clinical action.” Only 0.2% (ie, 4 measurements) were in zone B where an erroneous measurement would cause “altered clinical action with little or no effect on clinical outcome.” All results were within the ISO 15197:2013 requirements for the CEG. 15 None of the detected measurement errors were categorized in the more clinically significant error zones. Results are in accordance with recently published data on Contour XT accuracy conducted in Germany, which reported 100% of results to be within zone A. 8 However, the CEG has come under scrutiny as it was introduced more than 10 years ago and thus, does not account for recent developments in the clinical practice of diabetes. Therefore, we further performed the more recent SEG analysis, which presents the clinical risks of erroneous measures on a continuous color-coded matrix. 16 The benefit of this novel error grid is that it is equally valid for patients with type 1 and type 2 diabetes mellitus, independent from the necessity for insulin use. The SEG analysis produced comparable results (98.4% of readings in the “no risk” zone) as the CEG analysis, confirming that reading errors occur rarely with the evaluated BGMS, and in all cases constitute only a low degree of risk to the patient.
Conclusions
This is a major postmarketing study conducted in 21 leading hospitals to assess the accuracy performance of Contour XT under routine conditions. To date, this is the largest multicenter study assessing accuracy of this BGMS. Contour XT met and exceeded ISO 15197:2013 accuracy limit requirements despite the inclusion of a large number of sites and samples. Error grid analyses proved that none of the erroneous measurements were of significant clinical relevance.
Footnotes
Acknowledgements
The authors would like to thank Christoph Engler and GKM Gesellschaft für Therapieforschung mbH for support in completion of this article.
Abbreviations
BG, blood glucose; BGMS, blood glucose monitoring system; CEG, consensus (Parkes) error grid; EDTA, ethylenediaminetetraacetic acid; FDA, Food and Drug Administration; ISO, International Organization for Standardization; LCL, lower confidence limit; MARD, mean absolute relative difference; SEG, surveillance error grid; UCL, upper confidence limit; WLS, weighted least squares.
Declaration of Conflicting Interests
The author(s) declared the following potential conflicts of interest with respect to the research, authorship, and/or publication of this article: Jane Wallace, Thorsten Petruschke, and Scott Pardo are full-time employees of Bayer Inc.
Funding
The author(s) disclosed receipt of the following financial support for the research, authorship, and/or publication of this article: The study including publication was funded by Bayer Hispania S.L. Spain and Bayer HealthCare Germany, Leverkusen, Germany