
Abstract
Background
Malignant tumors are serious diseases that endanger human health. Therefore, it is crucial to identify markers that facilitate tumor diagnosis and prognostic assessment.
Objective
This study analyzed the significance of Monocyte to macrophage differentiation-associated (MMD) in various tumors from multiple perspectives, to explore the possibility of using MMD as a novel tumor marker.
Methods
Using the R software, an examination of MMD levels was conducted across diverse human cancers and their influence on cancer outcomes. MMD methylation, mutations, and immune infiltration analyses of various tumors were performed. A Cox regression model was used to predict the survival rates of patients with hepatocellular carcinoma (HCC). Finally, MMD expression and function were validated in Hep-3B cells.
Results
MMD was aberrantly expressed in diverse tumors and can predict patient outcomes. Methylation and functional enrichment studies indicated possible function of MMD in tumor progression, whereas immune infiltration data suggested its involvement in tumor immune evasion. Cox regression analysis revealed that elevated MMD levels were independent predictors of HCC patient outcomes. The quantitative real-time polymerase chain reaction (qPCR) data demonstrated high MMD levels in Hep-3B cells, and its suppression impeded Hep-3B cell growth.
Conclusions
MMD was abnormally expressed in various tumors and was closely associated with tumor prognosis. Thus, it had the potential to be used as a novel tumor marker.
Introduction
Malignant tumors pose a significant risk to human health, and their incidence rates are consistently at the forefront of the human disease rankings. 1 Many malignant tumors have insidious onset and atypical clinical symptoms. However, they develop rapidly and, when diagnosed, the optimal treatment period is often missed, leading to increased difficulty in clinical treatment, poor prognosis, and high mortality. Malignant tumors continue to be a problem in the global medical community and have always been a hot topic in scientific research. With scientific advancements, researchers are unveiling an increasing number of tumor molecular diagnostic markers using novel techniques to broaden the spectrum of tumor marker classifications. By detecting specific tumor biomarkers, it is possible to reduce the morbidity and mortality rates of specific tumor types through early prevention, diagnosis, and intervention. Therefore, mining tumor biomarkers has a positive significance in the prevention, diagnosis, and treatment of tumors.
Monocyte to macrophage differentiation-associated (MMD) is a member of the AdipoQ receptor family. 2 MMD has been discovered as a novel Ras modulator in the Golgi complex. 3 MMD is also linked to macrophage activation, which may involve ERK and Akt phosphorylation. 4 Several studies revealed its pivotal function in promoting Lung adenocarcinoma (LUAD) cell proliferation and migration.5,6 A previous study revealed that MMD regulated lipolysis. 7 Additionally, MMD modulated disease progression in rheumatoid arthritis. 8 The miR-140-5p/MMD axis proved pivotal in influencing microglial stimulation and the ensuing inflammatory reaction instigated by subarachnoid hemorrhage. 9 However, research on the relationship between MMD expression levels and neoplastic diseases is limited. This study aimed to provide a diversified evaluation of the effect of MMD on cancer progression, the manifestation of MMD in hepatocellular carcinoma (HCC), and its influence on HCC cell growth.
Methods
MMD expression
Data for MMD expression analysis in cancer and para-cancer tissues were downloaded from the Cancer Genome Atlas (TCGA) (https://portal.gdc.cancer.gov/). Statistical evaluations were conducted using the Statistics package (v4.2.1), whereas visualizations were completed using the ggplot2 package (v3.3.6).
Survival analysis
A comprehensive evaluation of the correlation between MMD expression and prognosis across 33 TCGA tumors was conducted using the survival, survminer, and ggplot2 packages. Risk proportionality testing and regression analysis were performed using the survival package and the log-rank test was used for statistical analyses.
Assessing the diagnostic efficacy of MMD for tumors
The ROC curve analyses of MMD within each TCGA tumor were conducted using the pROC package. This analysis enabled the quantification of its diagnostic accuracy by calculating the area under the curve (AUC). Tumor outcomes were more efficiently predicted as the AUC approached 1.
MMD methylation and mutation analysis
The UALCAN (https://ualcan.path.uab.edu/) analytics tool 10 was employed to select the “TCGA” module's Methylation analysis, which was then used to generate a boxplot comparing MMD promoter methylation levels in tumors versus their respective normal tissues. Subsequently, the “TP53 mutation status” module was utilized to generate a boxplot demonstrating the disparity in MMD promoter methylation levels in tumors harboring or lacking TP53 mutations. Furthermore, an examination was conducted of the correlation between MMD expression and TP53 mutations in the tumors. To assess MMD mutations across various cancers, the “TCGA PanCancer Atlas Studies” dataset on the cBioPortal (https://cbioportal.org/) was utilized. 11
Protein-protein interaction (PPI) and enrichment analysis
The generation of a PPI network for the MMD was facilitated by the utilization of STRING (https://string-db.org/). This network was graphically represented using Cytoscape software (version 3.9.1). Subsequently, enrichment analysis was conducted on these proteins as a gene set, resulting in chordal plots.
Analysis of MMD and tumor immune infiltration
Employing an immunology correlation evaluation tool, the immunedeconv package, attached to TCGA data, an xCell-derived correlation heatmap was generated in the results segment. 12 A pan-cancer harmonized dataset (N = 10,535, G = 60,499) was obtained from the University of California, Santa Cruz Genomic Browser (UCSC) (http://genome.ucsc.edu/). 13 Subsequently, MMD gene expression per sample was isolated, and tool packages were utilized to compute the mutation load of each tumor. The tumor mutation burden (TMB) and microsatellite instability (MSI) scores were incorporated into the assessment, which enabled the calculation of the Spearman correlation coefficient between the MMD and these parameters within each tumor.
Subsequently, the relationship between MMD and several immune checkpoint genes and four mismatch repair (MMR) genes was analyzed utilizing the TIMER2.0 database. Furthermore, the correlation between MMD and four DNA methylation transferases was evaluated.
Cox regression analysis
The integration of MMD expression data from liver hepatocellular carcinoma (LIHC) of TCGA (TCGA-LIHC) with clinically relevant prognostic indicators had enabled the development of a proportional hazard model using Cox regression to predict HCC patient outcomes. These findings were visually represented using forest plots.
Cell culture
Normal human hepatocytes (LO2) were obtained from Yuchi (China), and the HCC cell line (Hep-3B) was purchased from Cellcook Bio (China). Culturing of these cells occurred in the complete medium comprising high-glucose DMEM (L110KJ, BasalMedia, China) and fetal bovine serum (AB-FBS-0050S, ABW, China) at a 9:1 ratio, under 37 °C, 5% CO2 conditions within an incubator (3131, Thermo Scientific, USA).
Quantitative real-time polymerase chain reaction (qPCR)
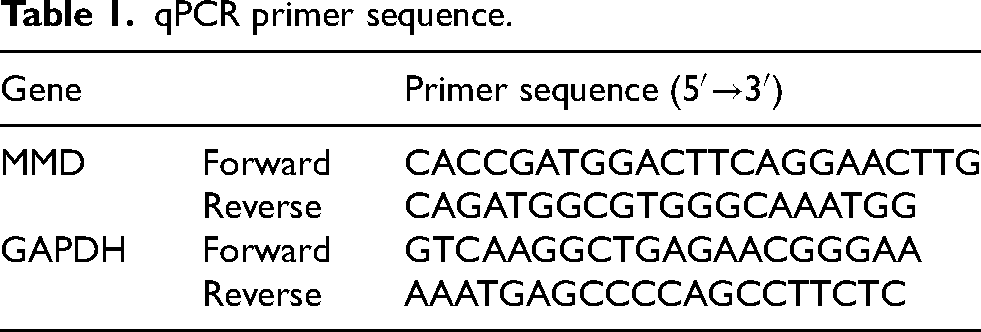
RNA was isolated using the TRIzol reagent (Invitrogen, USA), as confirmed by the concentration of NanoDrop2000 (Thermo Scientific, USA). Reverse transcription into cDNA utilizing a reverse transcription kit (AT311; TransGen, Beijing, China). Following the recommended procedures, these cDNA served as templates for subsequent qPCR experiments (AQ131, TransGen, China). The primer sequences are listed in Table 1.
qPCR primer sequence.
Cell transfection
GenePharma designed and synthesized negative control (NC) and MMD-siRNA . The transfection reagent Endofectin Max (EF013, GeneCopoeia, China) was prepared with NC or siRNA at a ratio of 1:1 (5 μl:100 pmol). Transfection experiments were done in 6-well cell culture plates.
Cell proliferation assay
Twenty-four hours after cell transfection, cells from the NC and siRNA groups were transferred to 96-well plates according to 3500 cells/well (100 μl), with triplicate wells per group. These cells were then routinely incubated. Absorbance readings at A450 were taken using the CCK-8 reagent (BS350, Biosharp, China) at 0, 24, 48, 72, and 96 h post-cell seeding using a Microplate Reader (Thermo Scientific, USA).
Statistical analysis
MMD's relative expression was quantitated via 2−ΔΔCt methodology utilizing GraphPadPrism9.0 software for statistical analysis. A parametric t-test was used for intergroup comparisons, and p < 0.05 served as a statistical signi ficance level.
Results
MMD expression in the pan-cancer
MMD expression in 33 tumors is shown in Figure 1(a). Low MMD expression levels are evident in thyroid carcinoma (THCA), glioblastoma multiforme (GBM), pancreatic adenocarcinoma (PAAD), breast invasive carcinoma (BRCA), kidney chromophobe (KICH), and prostate adenocarcinoma (PRAD), whereas high MMD expression is observed in head and neck squamous cell carcinoma (HNSC), esophageal carcinoma (ESCA), lung adenocarcinoma (LUAD), stomach adenocarcinoma (STAD), cholangiocarcinoma (CHOL), LIHC, pheochromocytoma paraganglioma (PCPG), and colon adenocarcinoma (COAD).
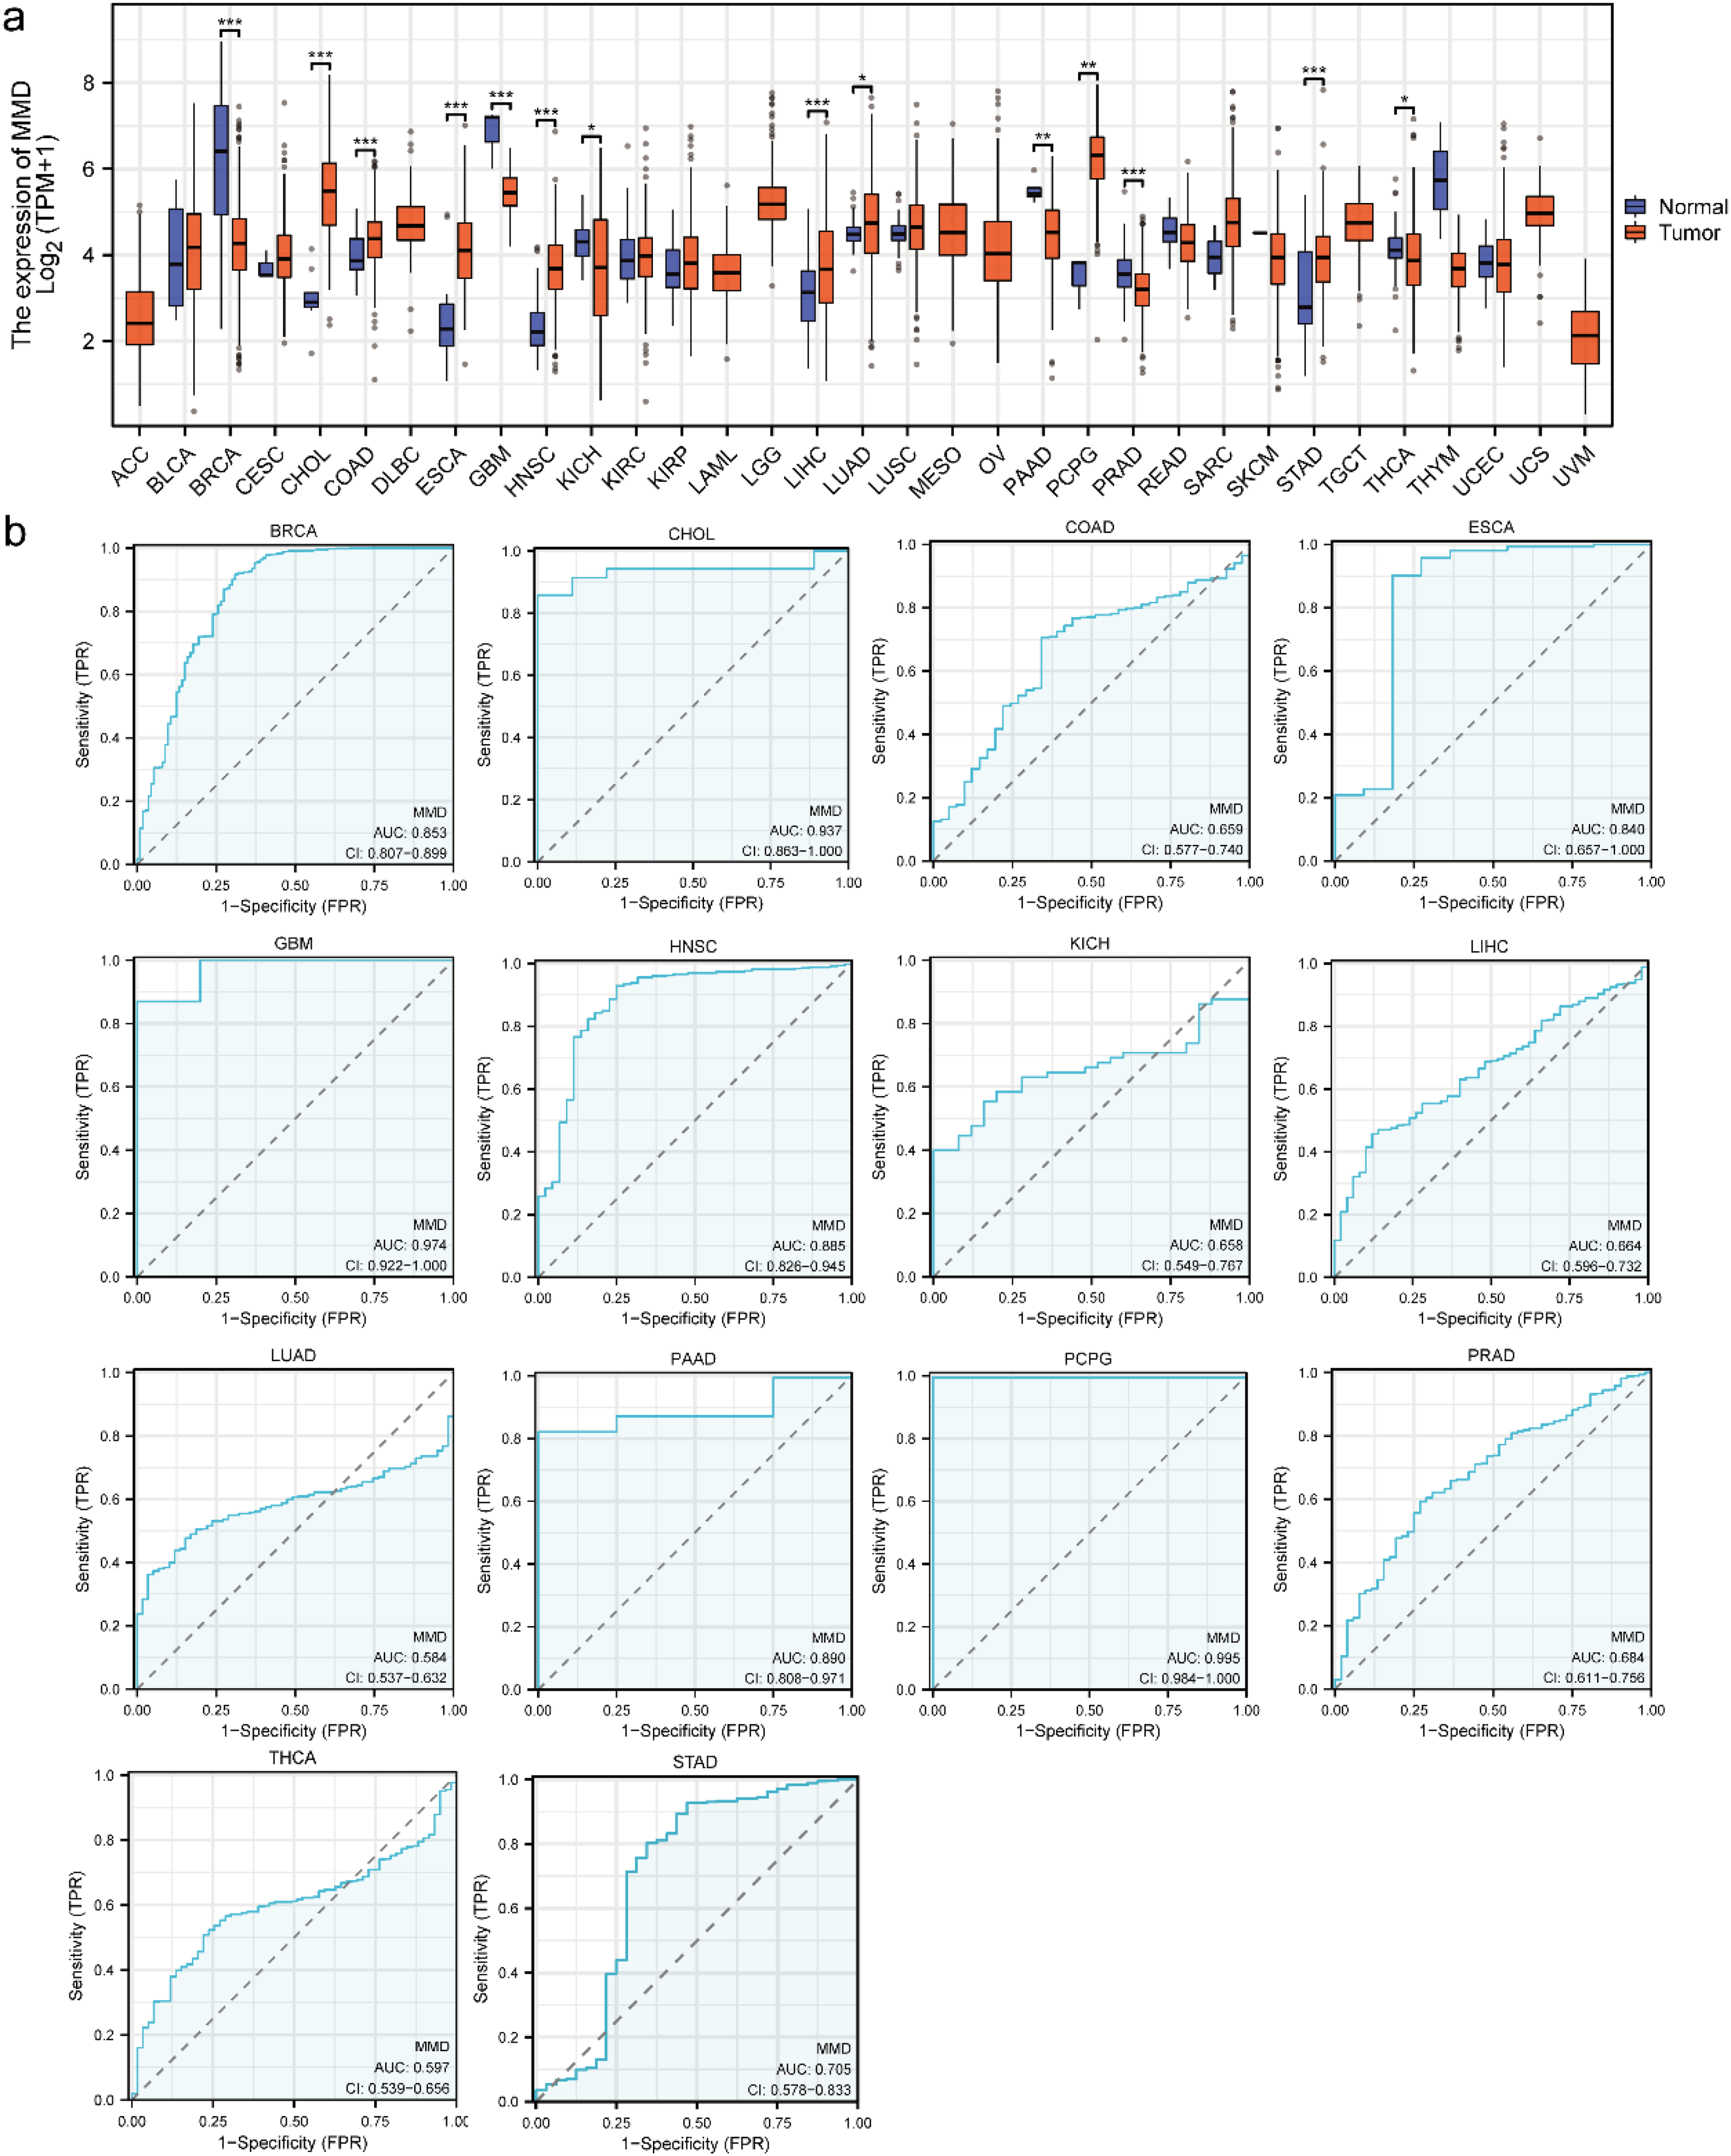
MMD expression and its diagnostic efficacy in pan-cancer (a) MMD expression in tumors; (b) diagnostic efficacy of MMD in tumors.(*: p < 0.05; **: p < 0.01; ***: p < 0.001).
MMD has good diagnostic efficacy in a variety of tumors
The receiver operating characteristic (ROC) curve is a graphical representation used to illustrate the sensitivity and specificity of a factor at various diagnostic thresholds. The area value below the curve is denoted as the AUC value, and the closer the value is to 1, the better is the diagnostic efficacy. Consequently, the AUC is a pivotal indicator of the efficacy of diagnostic tests. The present study evaluated the potential influence of MMD expression on disease diagnosis in different tumors. As shown in Figure 1(b), the AUC values for the diagnostic efficacy of MMD expression for the following tumors were assessed as PCPG (0.995), GBM (0.974), CHOL (0.937), PAAD (0.890), HNSC (0.885), BRCA (0.853), ESCA (0.840), STAD (0.705), PRAD (0.684), LIHC (0.664), COAD (0.659), KICH (0.658), THCA (0.597), and LUAD (0.584). The preceding analysis indicates that MMD has the potential to contribute to the diagnosis of a variety of tumors and that MMD may become a new diagnostic marker for tumors that merits further study.
MMD expression affects the prognosis of tumor patients
By evaluating the prognostic impact of varying MMD expression across various cancers, significant differences were observed (Figure 2). In LIHC, acute myeloid leukemia (LAML), and kidney renal papillary cell carcinoma (KIRP), high MMD expression correlated with reduced overall survival (OS). This trend was also evident for PRAD, uterine corpus endometrial carcinoma (UCEC), brain lower-grade glioma (LGG), STAD, LUAD, THCA, KICH, HNSC, oral squamous cell carcinoma (OSCC), bladder urothelial carcinoma (BLCA), cervical squamous cell carcinoma (CESC), and mesothelioma (MESO). However, in COAD, kidney renal clear cell carcinoma (KIRC), rectum adenocarcinoma (READ), ESCA, and skin cutaneous melanoma (SKCM), high expression of MMD predicted improved OS outcomes.
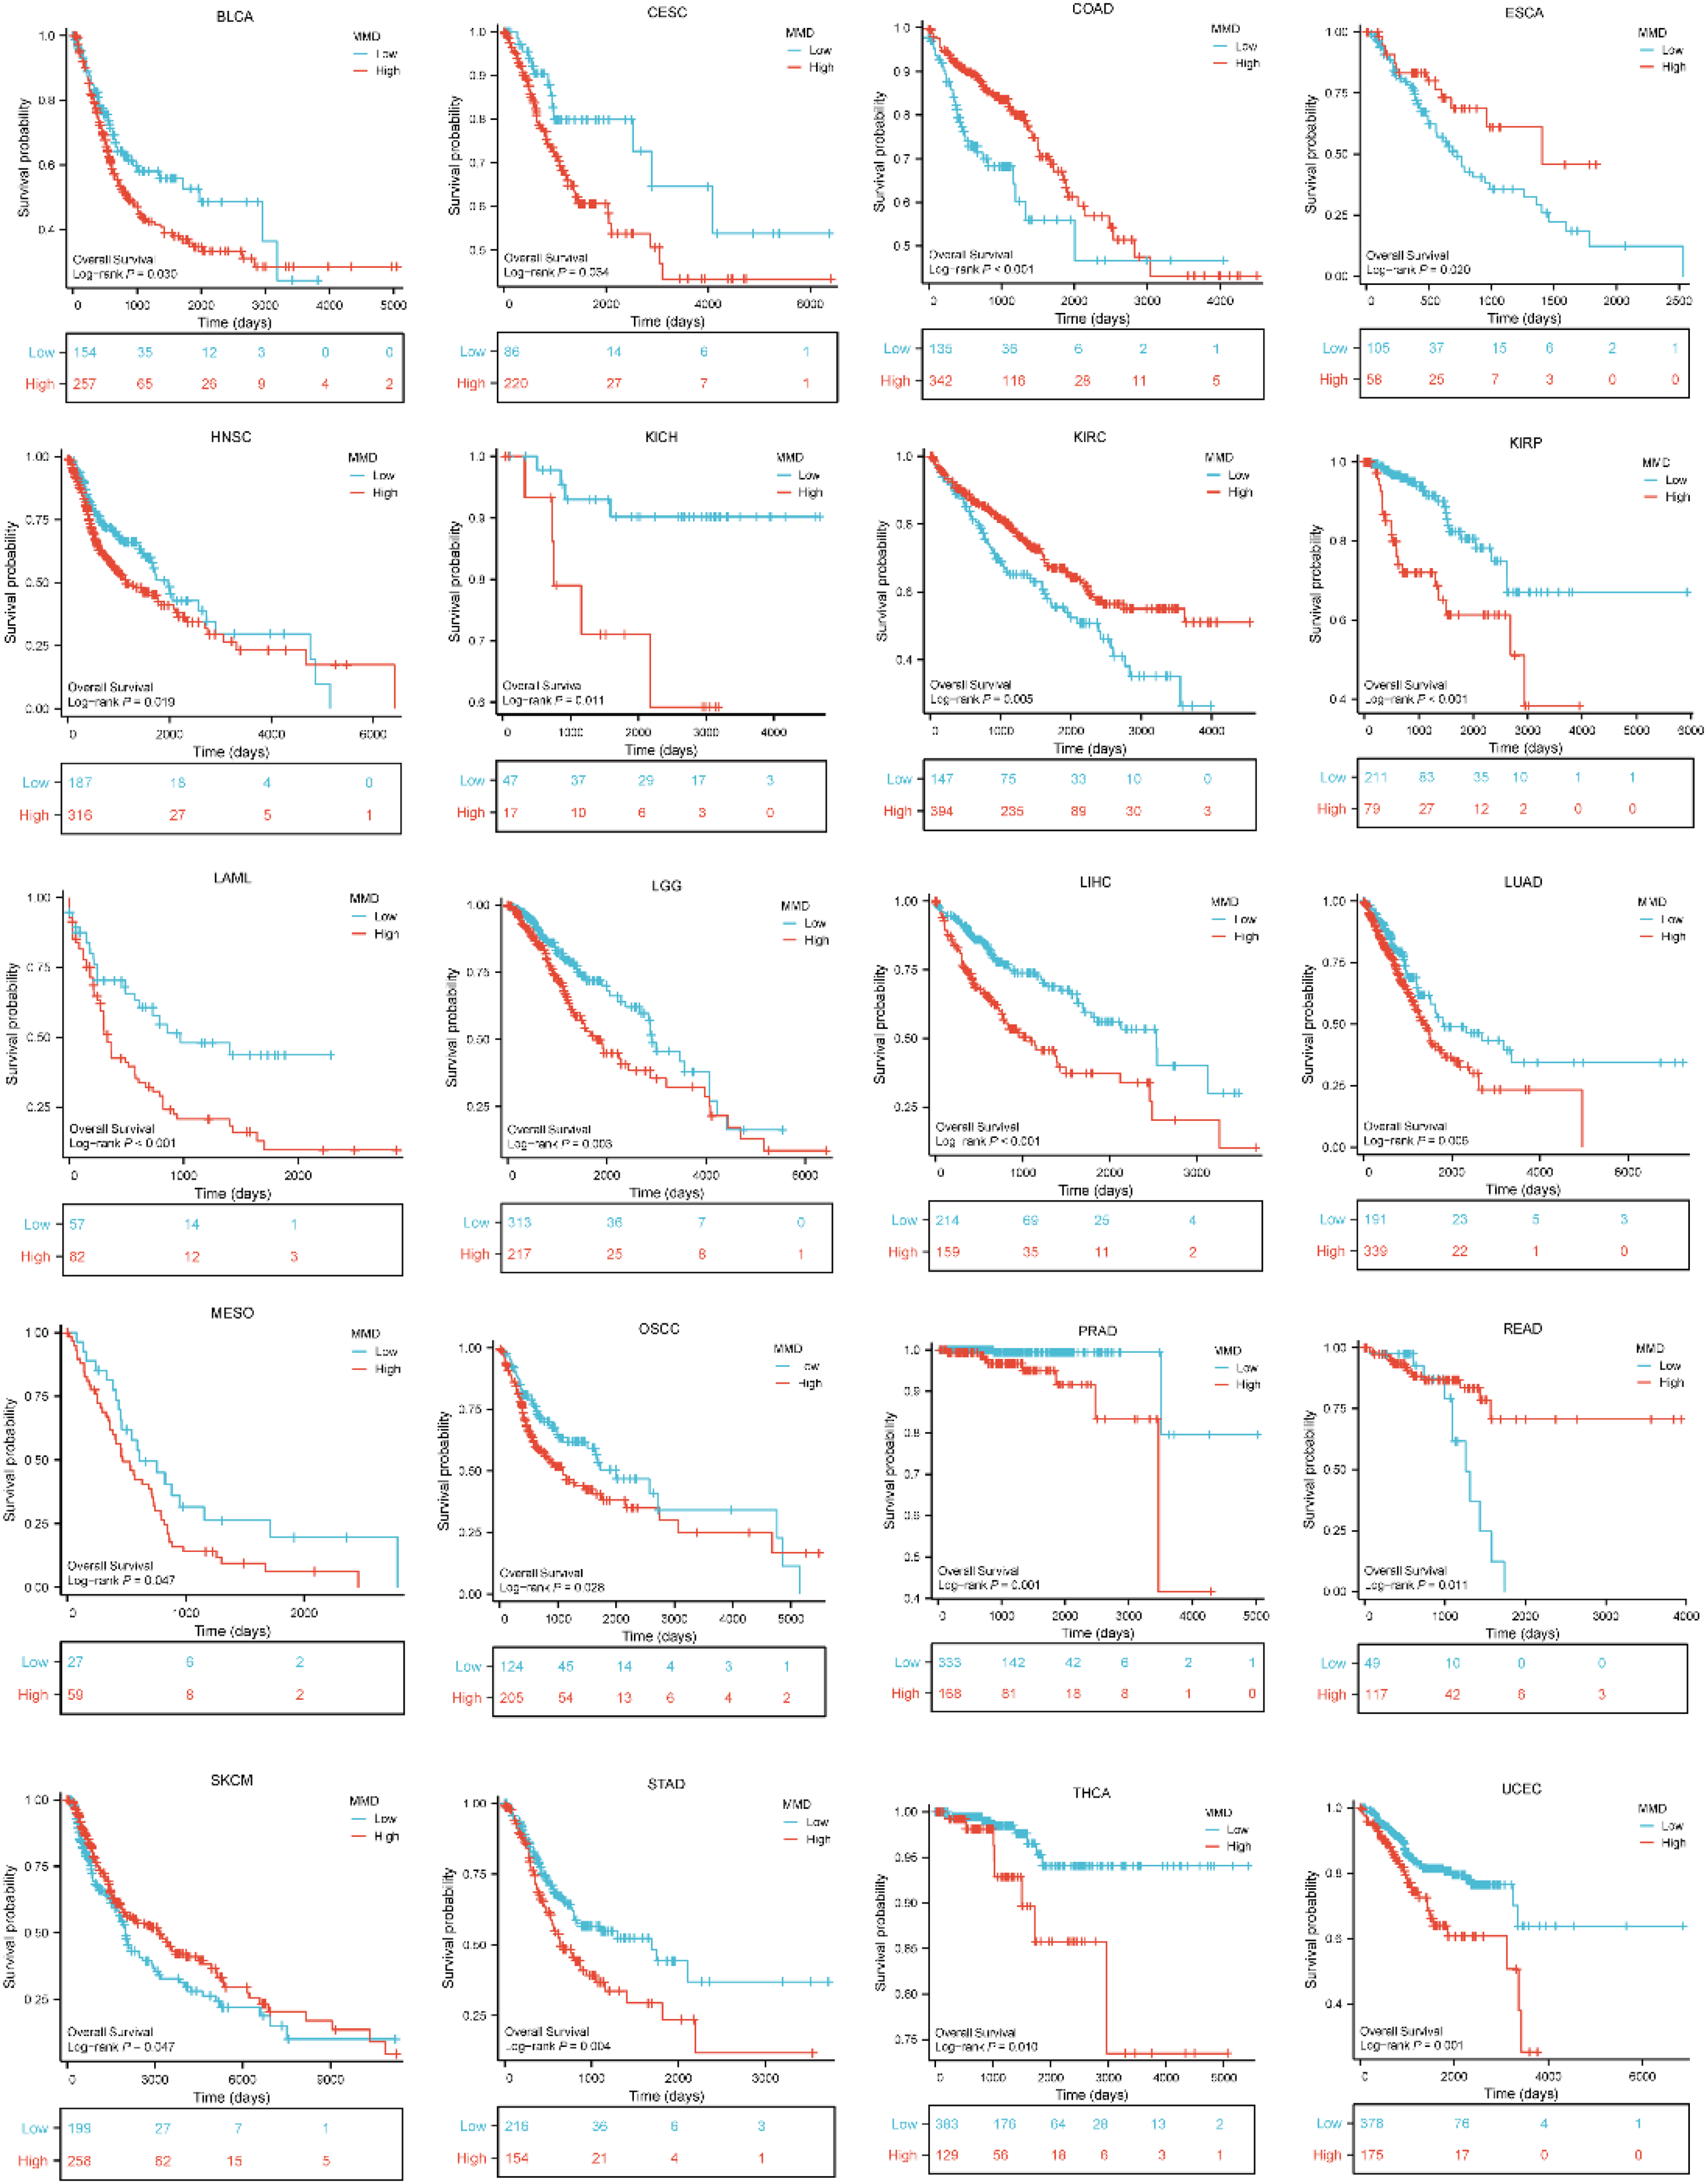
Impact of MMD on overall survival of tumors.
As shown in Figure 3, in LIHC, KIRP, PRAD, UCEC, STAD, LUAD, LGG, PCPG, MESO, HNSC, CESC, KICH, and BLCA, the MMD high expression group had a shorter disease specific survival (DSS). However, patients in the MMD high expression group exhibited higher DSS survival rates in COAD, KIRC, and READ.
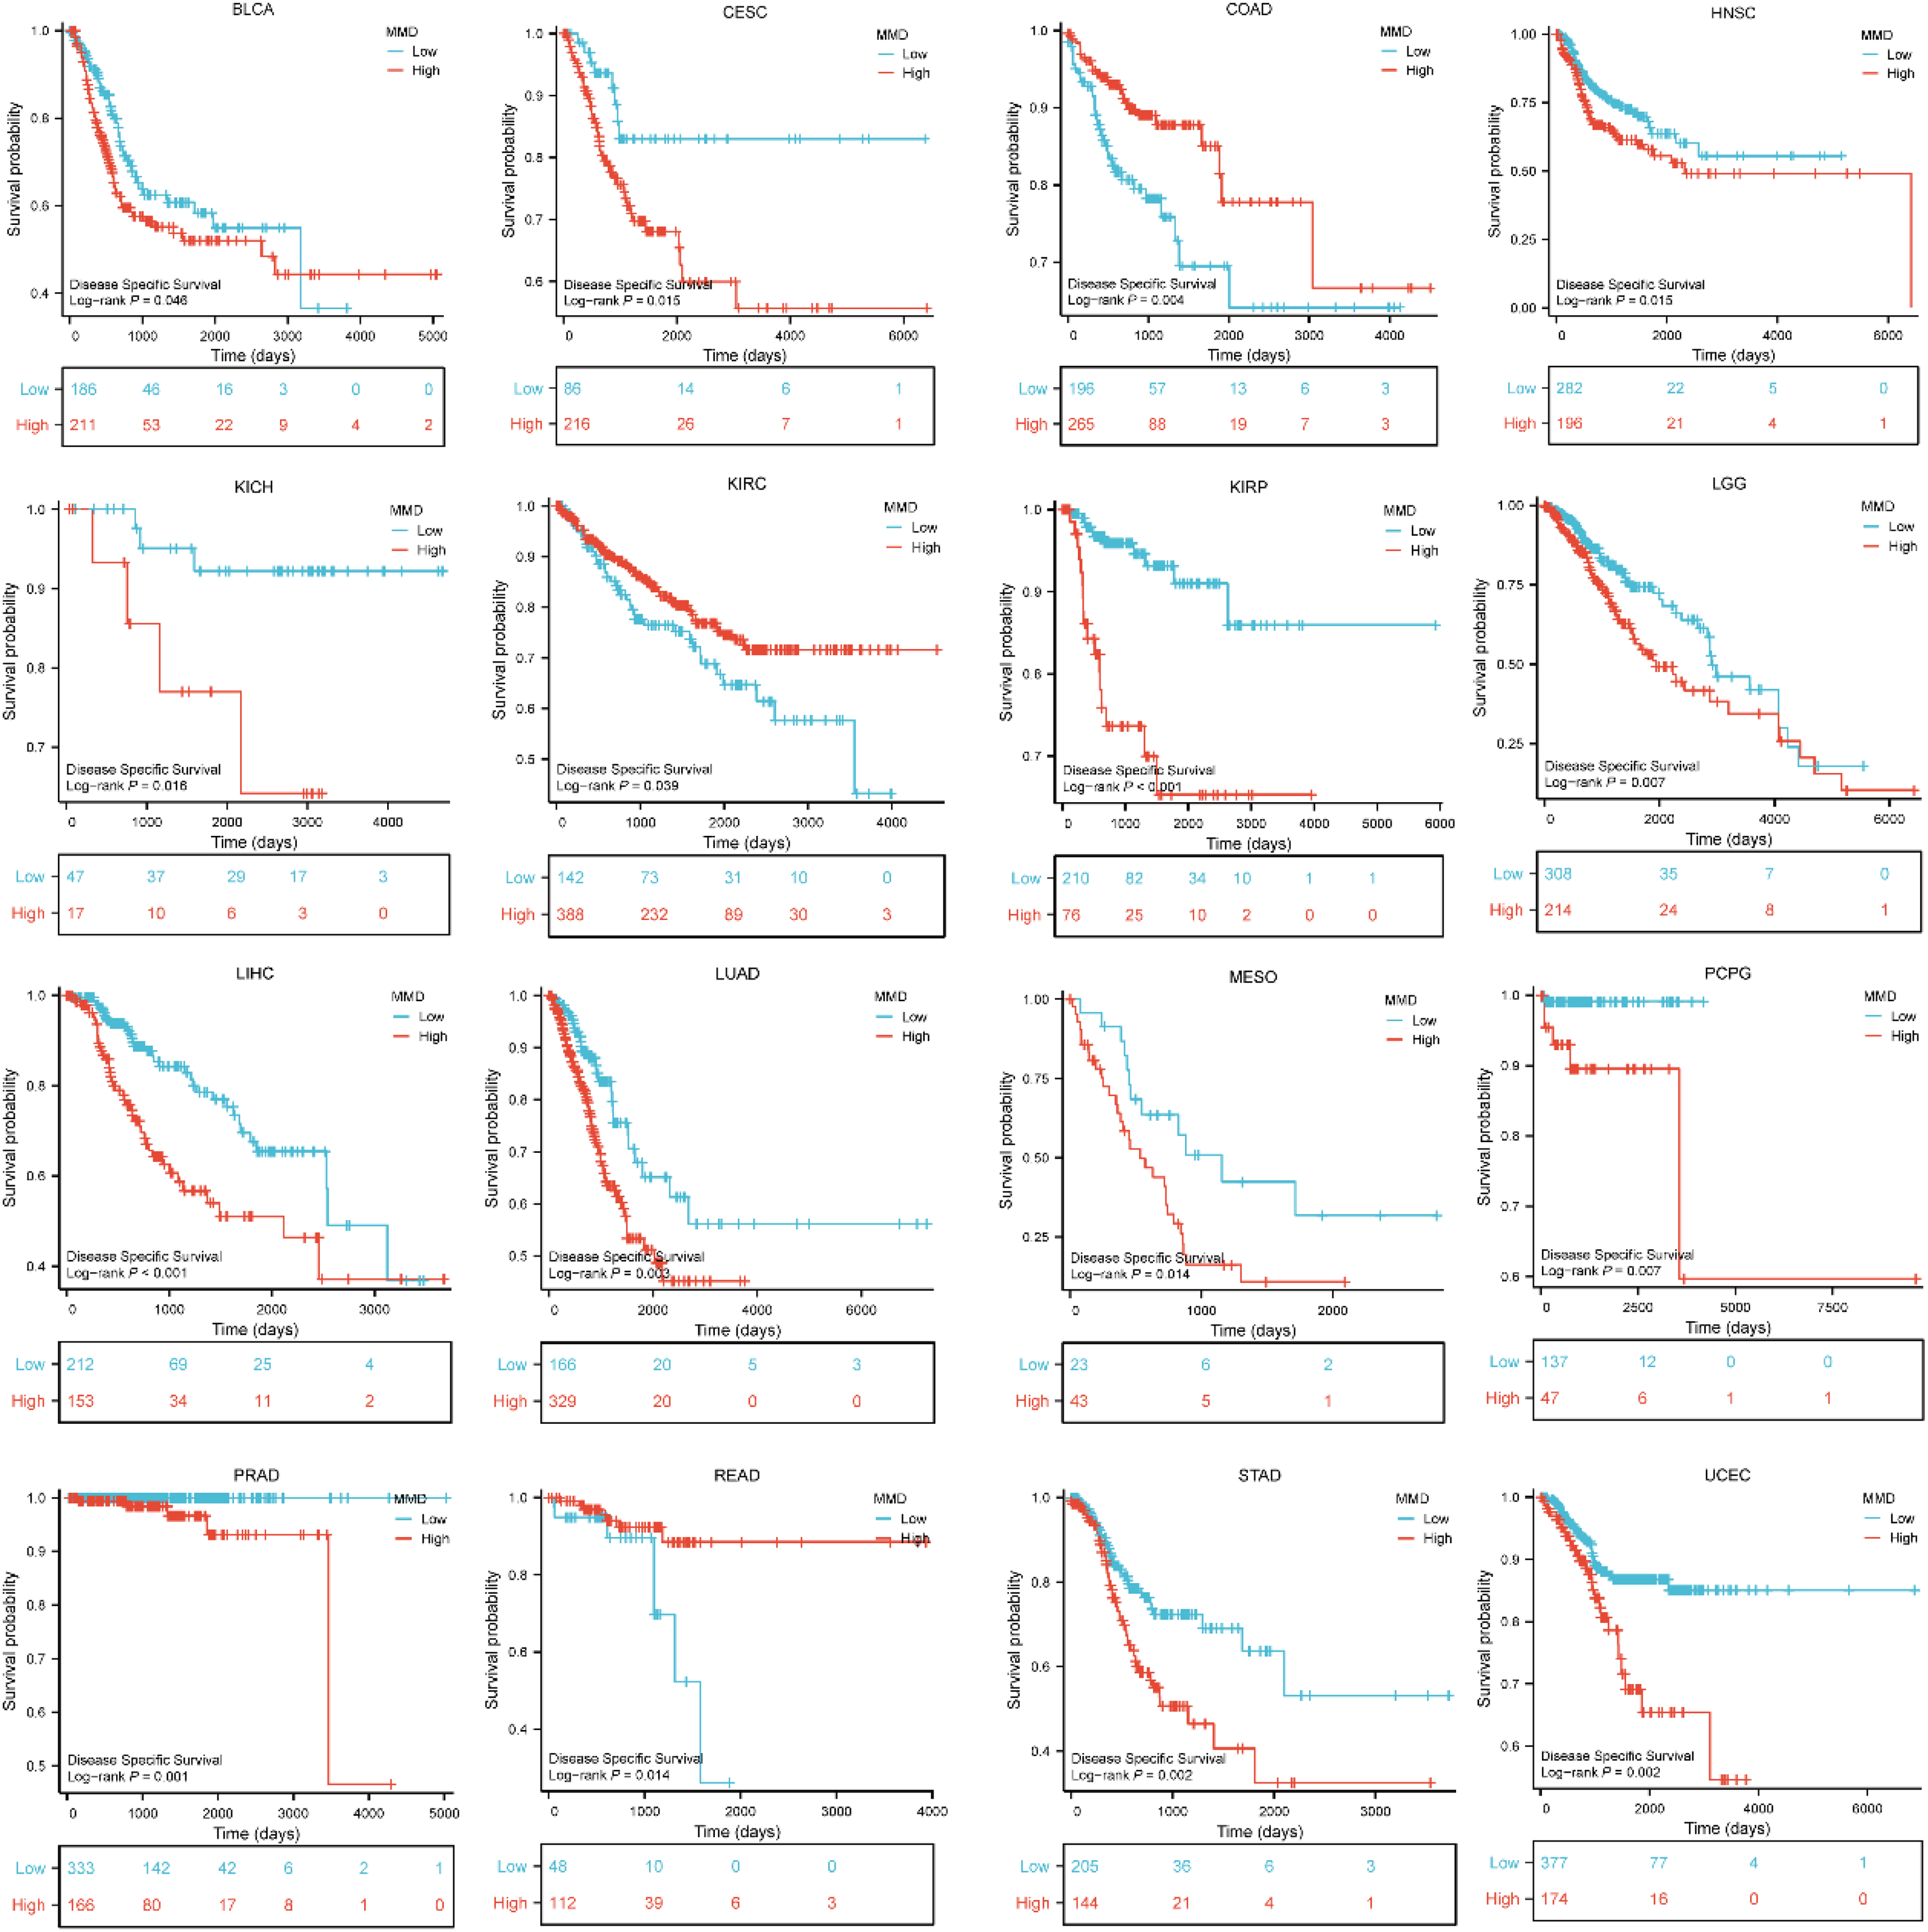
Impact of MMD on disease specific survival of tumors.
A total of 33 tumor samples were examined for MMD's influence on progression-free interval (PFI). In UCEC, PRAD, LIHC, LUAD, LGG, STAD, CESC, sarcoma (SARC), LUSC, KIRP, BLCA, and GBM, elevated MMD levels were associated with poorer outcomes. Conversely, in SKCM, increased MMD expression was associated with a superior PFI (Figure 4).
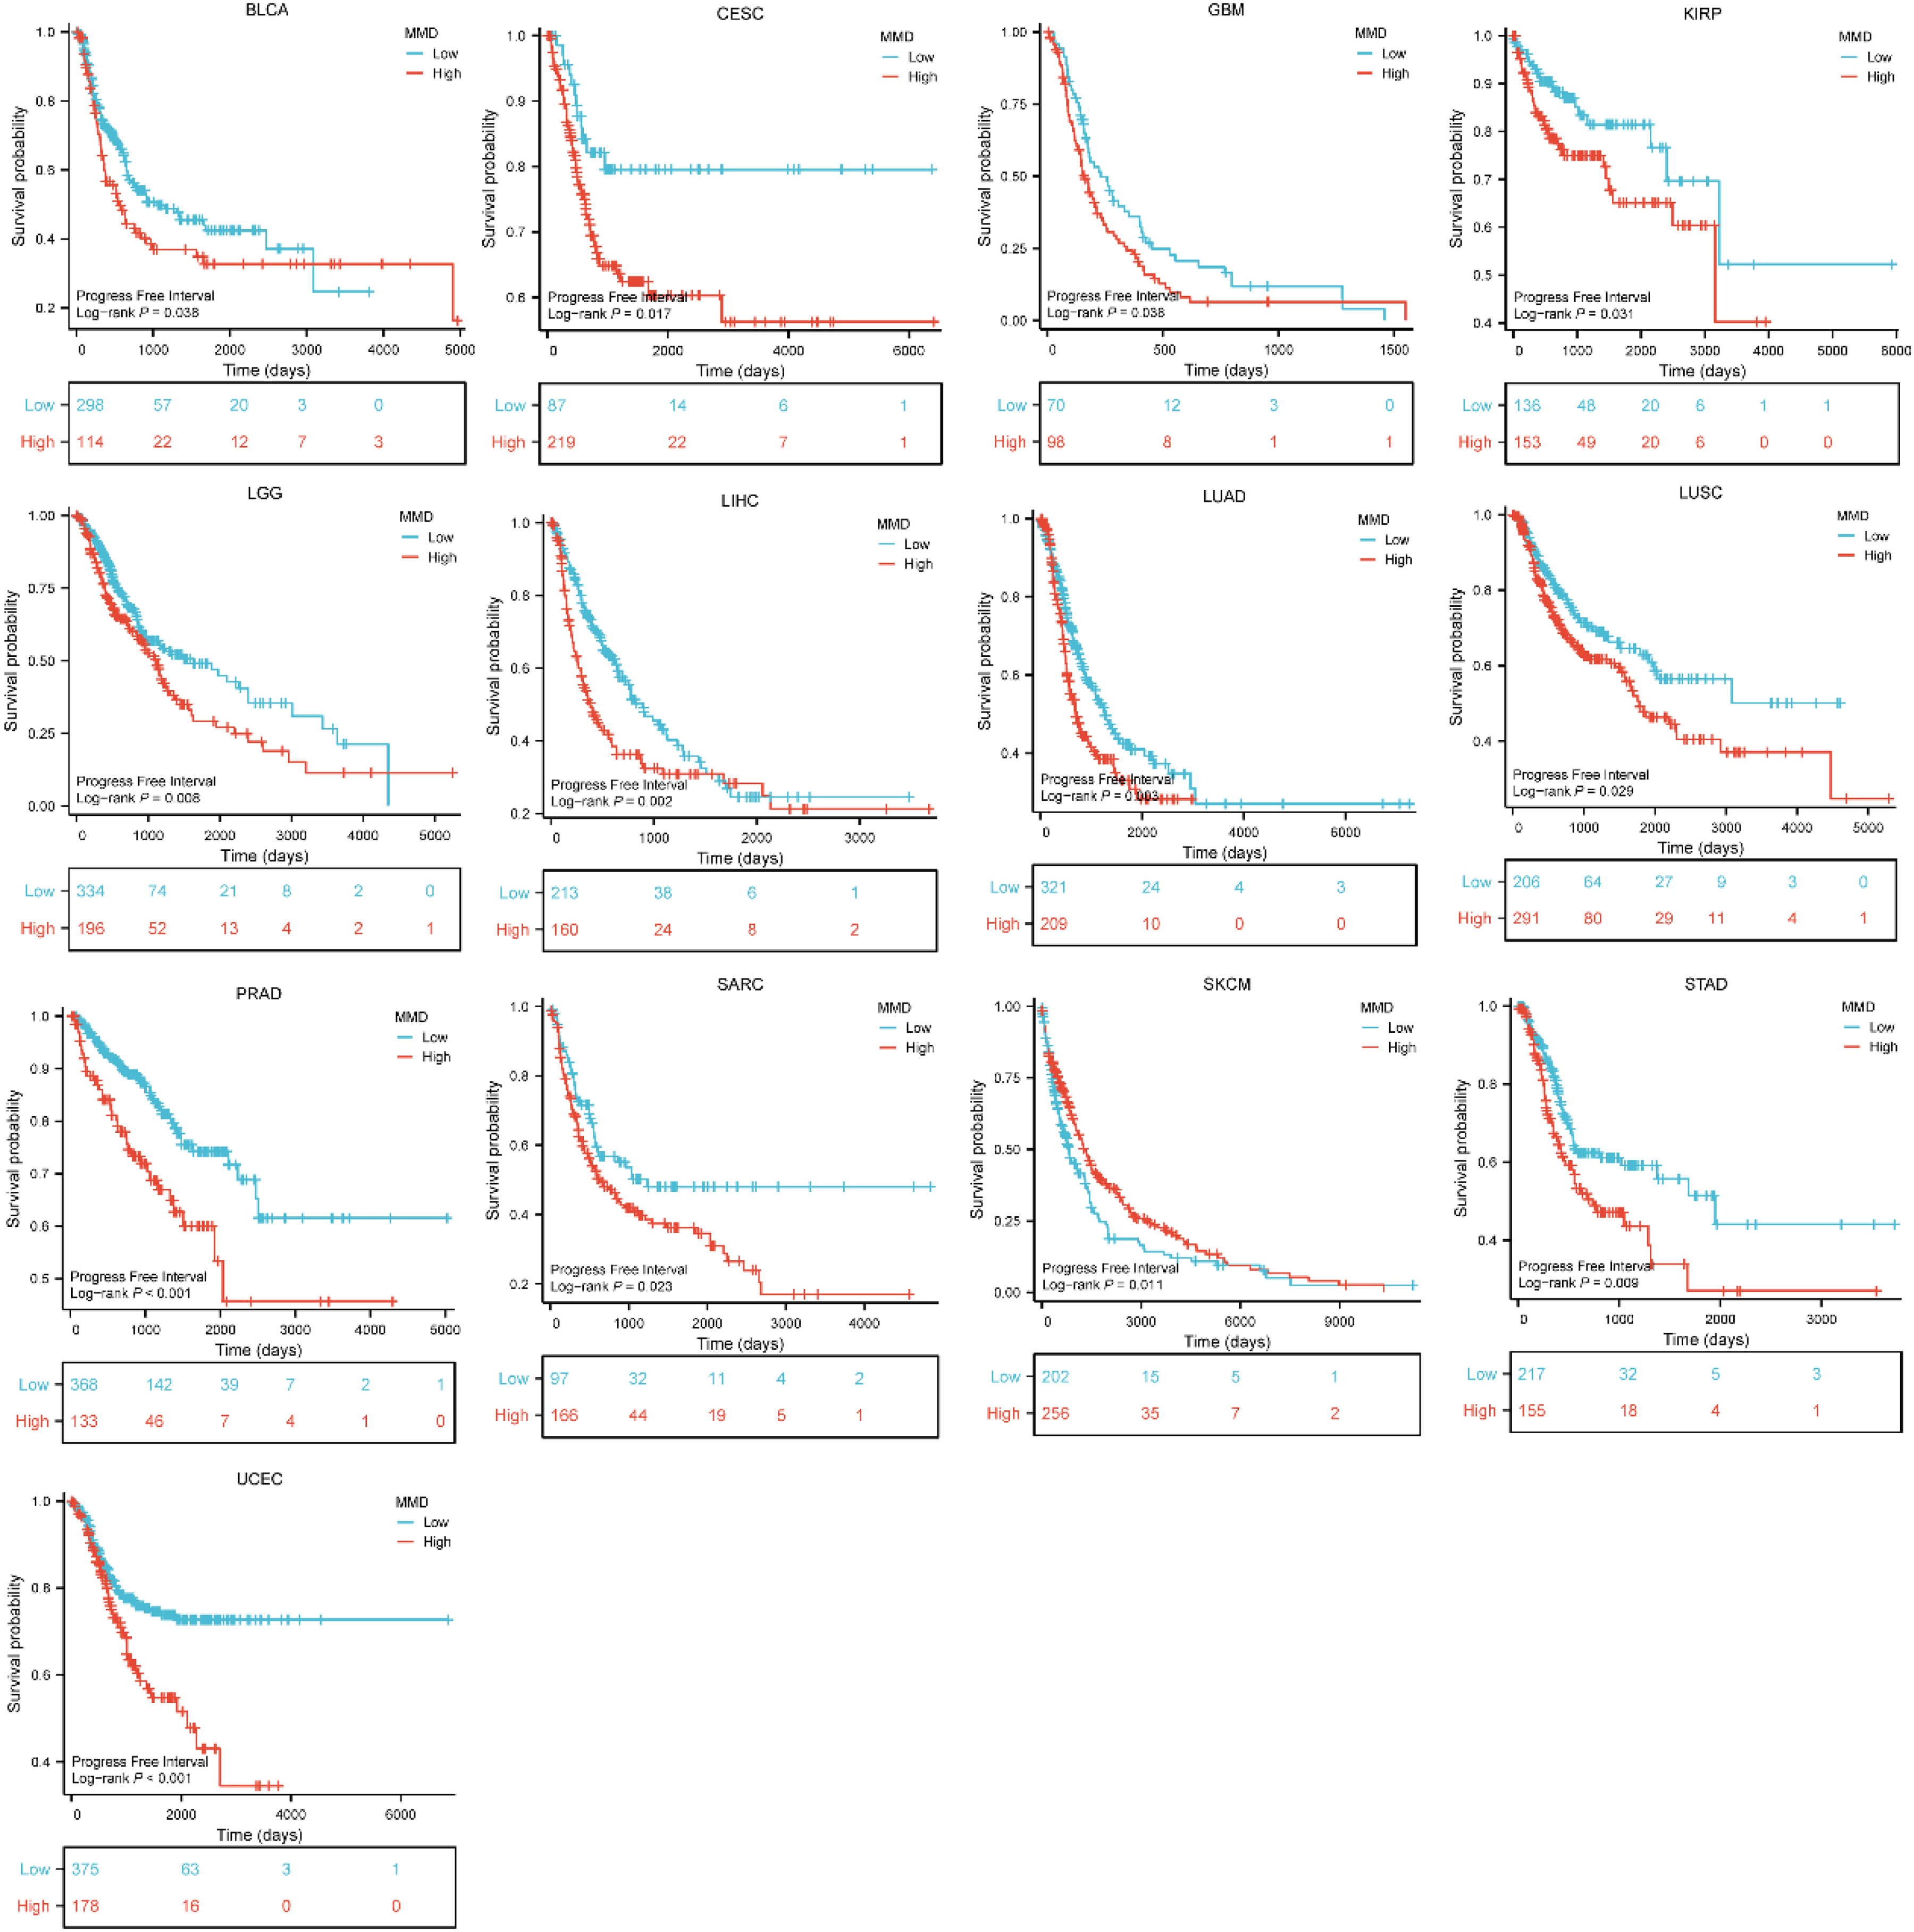
Impact of MMD on progress free interval of tumors.
The present study aimed to analyze the correlation between MMD expression and three tumor prognostic indicators in patients with tumors. The analysis has revealed that MMD expression levels can have a significant impact on the prognosis of patients suffering from this disease, in a variety of tumors. This finding further illustrates the potential of MMD in the diagnosis of tumors.
Pan-cancer analysis of MMD promoter methylation levels
Numerous studies have demonstrated that the methylation levels of specific genes within a tumor can influence its progression and, consequently, the patient's prognosis. For instance, the methylation levels of septin 9 (SEPT9) and spleen-associated tyrosine kinase (SYK) have been demonstrated to influence the development and prognosis of liver and colorectal cancers.14–17 Furthermore, the methylation level of the Ras association domain family member 1 (RASSF1A) has been identified as a potential marker for lung cancer diagnosis and screening of lung cancer. 18 In this study, the UALCAN's “Methylation” tool was utilized to analyze MMD promoter methylation across multiple cancers to investigate whether MMD methylation is involved in carcinogenesis. These figures indicated that MMD methylation levels were reduced in HNSC, THCA, LUAD, LUSC, LIHC, CESC, BLCA, UCEC, PRAD, and testicular germ cell tumors (TGCT) compared to their respective normal tissues, but elevated in COAD, KIRC, and READ (Figure 5). A notable finding was the presence of disparities in MMD methylation levels between certain tumor tissues and their corresponding normal tissues. These findings suggest a potential role for the aberrant methylation of MMD in the progression of certain tumors.
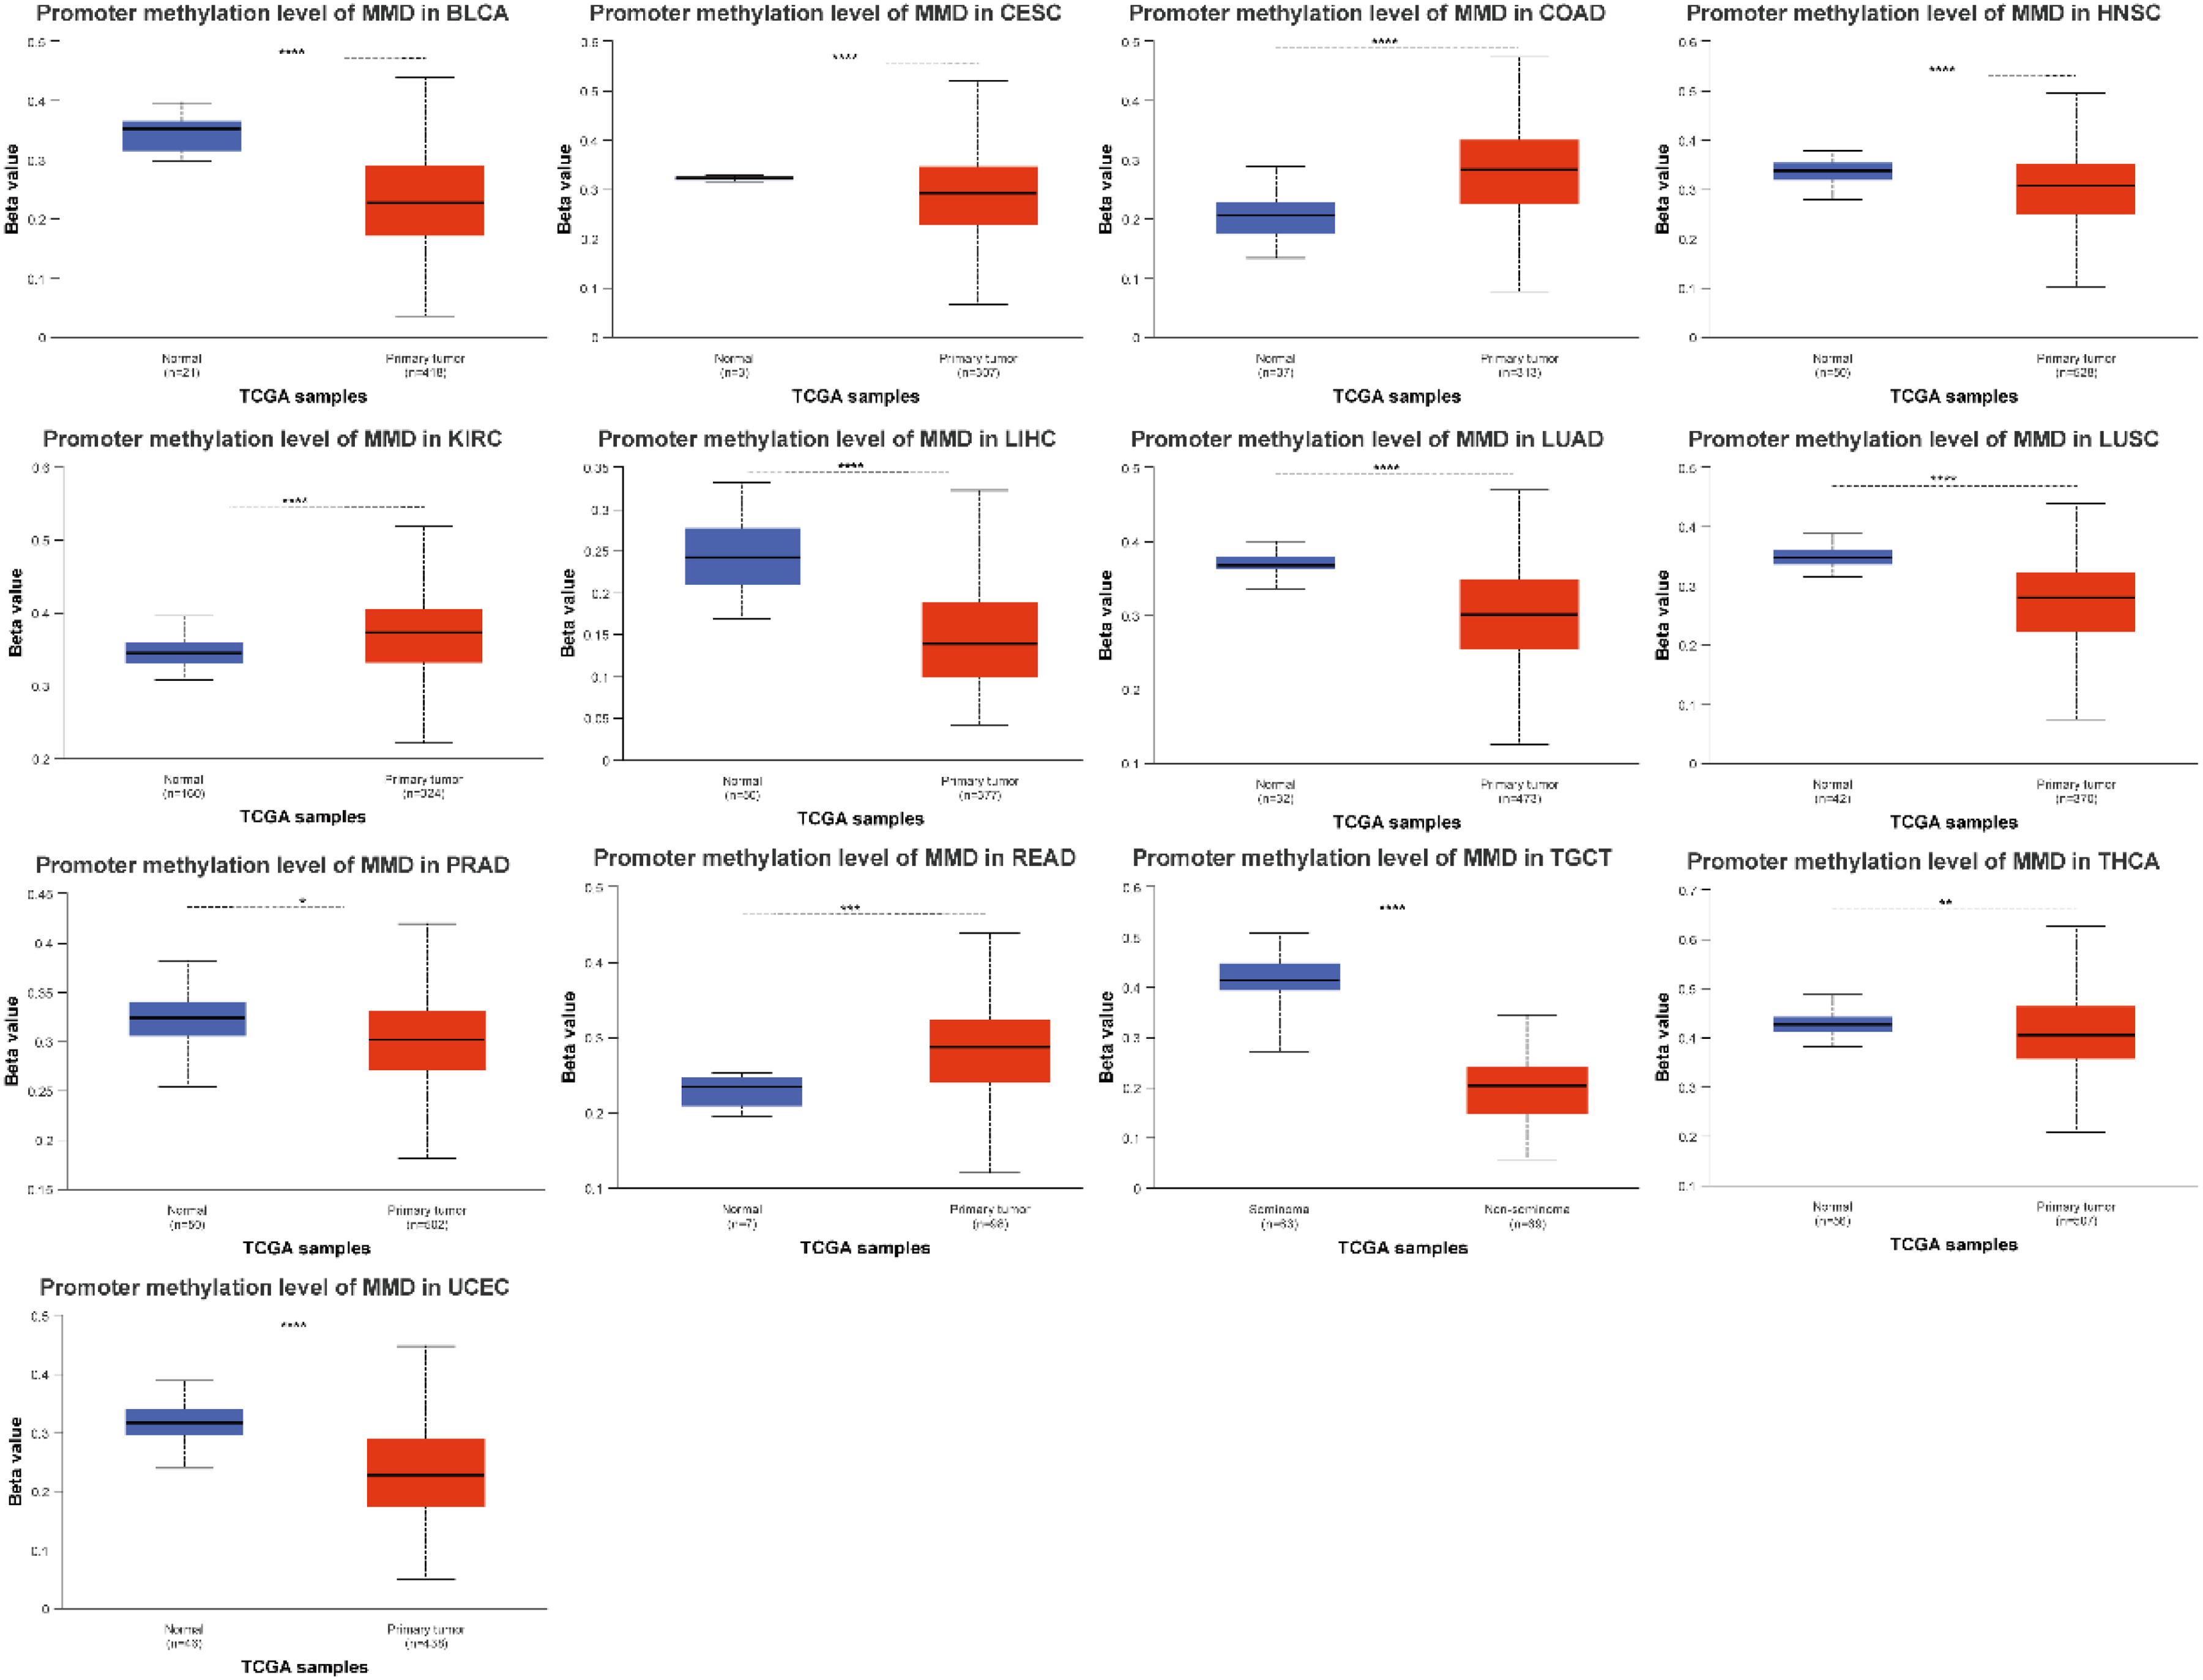
Methylation level analysis of MMD in multiple tumors (*: p < 0.05; **: p < 0.01; ***: p < 0.001; ****: p < 0.0001).
It is well known that TP53 mutations are associated with the development of many malignant tumors, but the relationship between MMD and TP53 mutations has not been reported. Further studies have shown a possible association between MMD methylation and TP53 mutations in various tumors. MMD methylation levels were lower after TP53 mutation than in those without TP53 mutation in GBM, HNSC, PRAD, PAAD, LUSC, STAD, and SARC tissues (Figure 6(a)). The opposite trend was observed for UCEC and READ. Analysis of TP53 mutations and MMD expression levels in tumors showed that MMD was present at higher levels in TP53-mutated tumors, including ESCA, LUAD, COAD, GBM, LIHC, PRAD, SKCM, UCEC, and BLCA, than in LGG and SARC (Figure 6(b)). The present study investigated the association between MMD expression, methylation levels, and TP53 mutations in tumor tissues. As shown in Figure 6, the MMD expression and methylation levels in certain tumor tissues were significantly associated with TP53 mutations. They suggested that MMD may be involved in the development of certain tumorigenesis following TP53 mutations.
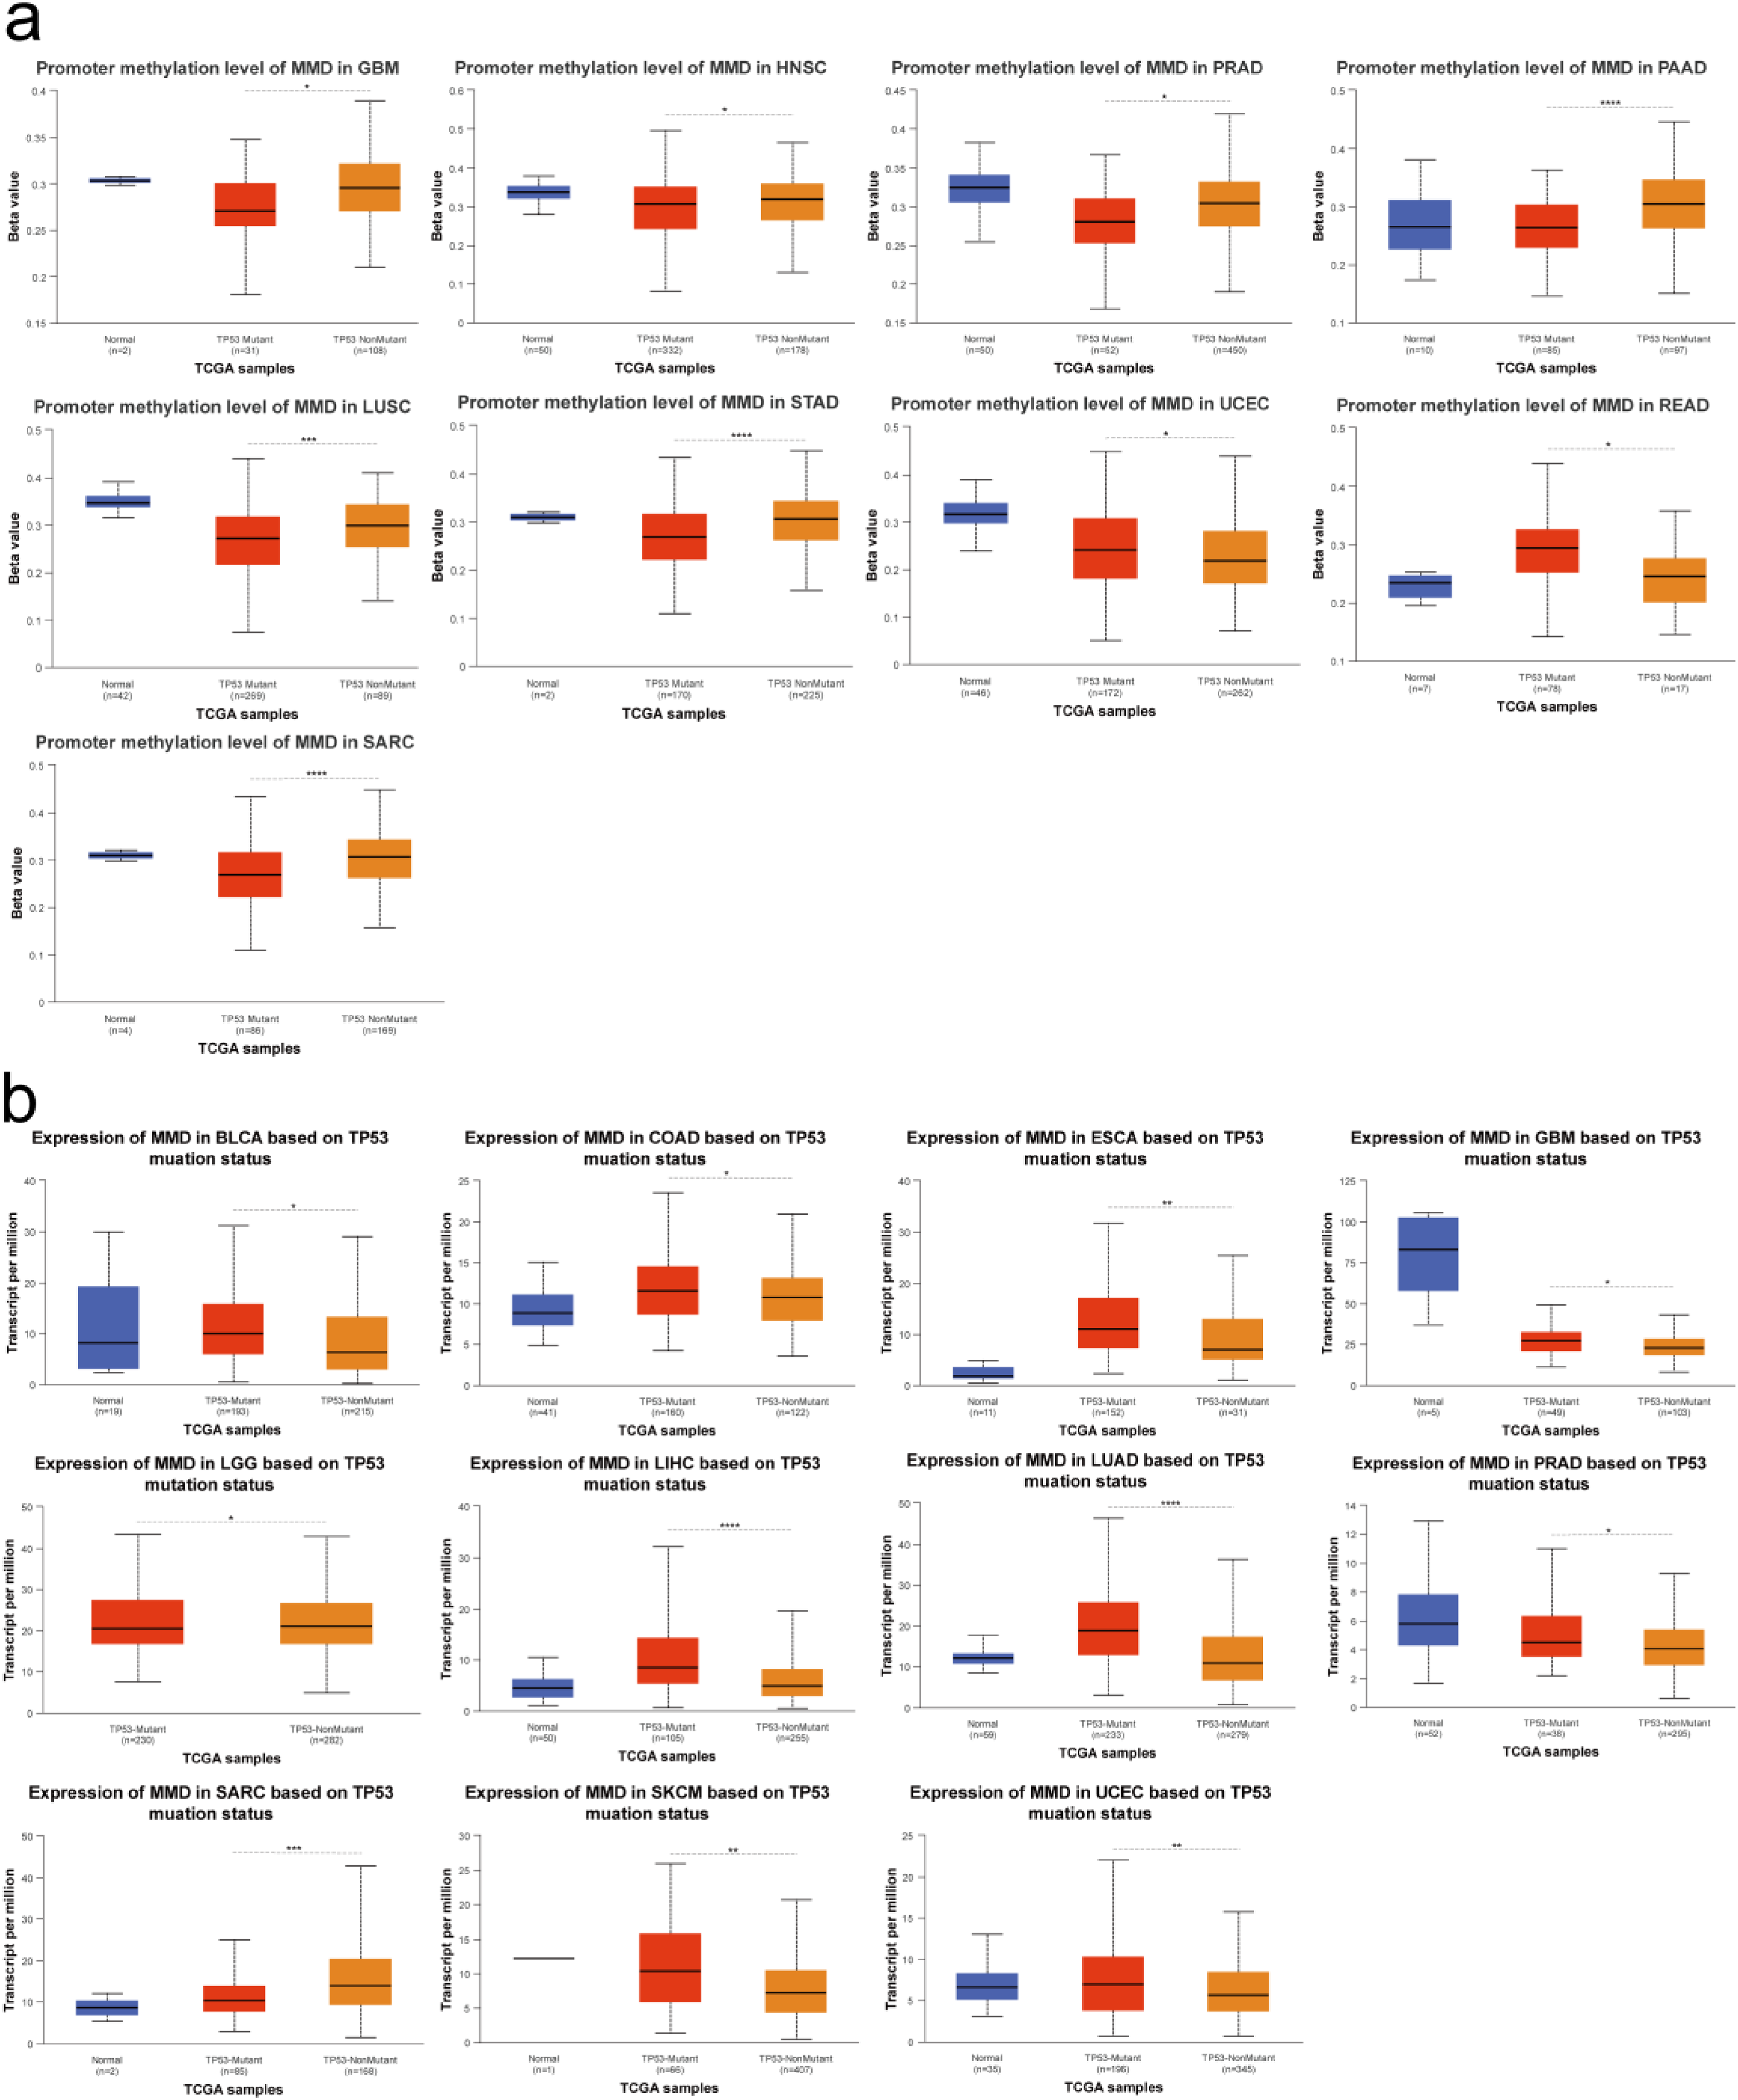
Relationship between MMD and TP53 mutation in tumors (a) MMD methylation and TP53 mutation; (b) MMD expression and TP53 mutation. (*: p < 0.05; **: p < 0.01; ***: p < 0.001; ****: p < 0.0001).
Mutational features of MMD
In 10,953 TCGA tumor samples, the MMD mutation rate was 1.6%, with amplification and missense mutations being the main alterations (Figure 7(a)). The highest MMD mutation rate (5%-6%) was observed in the BRCA samples (Figure 7(b)). MMD exhibits a low mutation rate in most tumor tissues, and it has been hypothesized that mutations in MMD may not have a significant effect on tumorigenesis and progression.
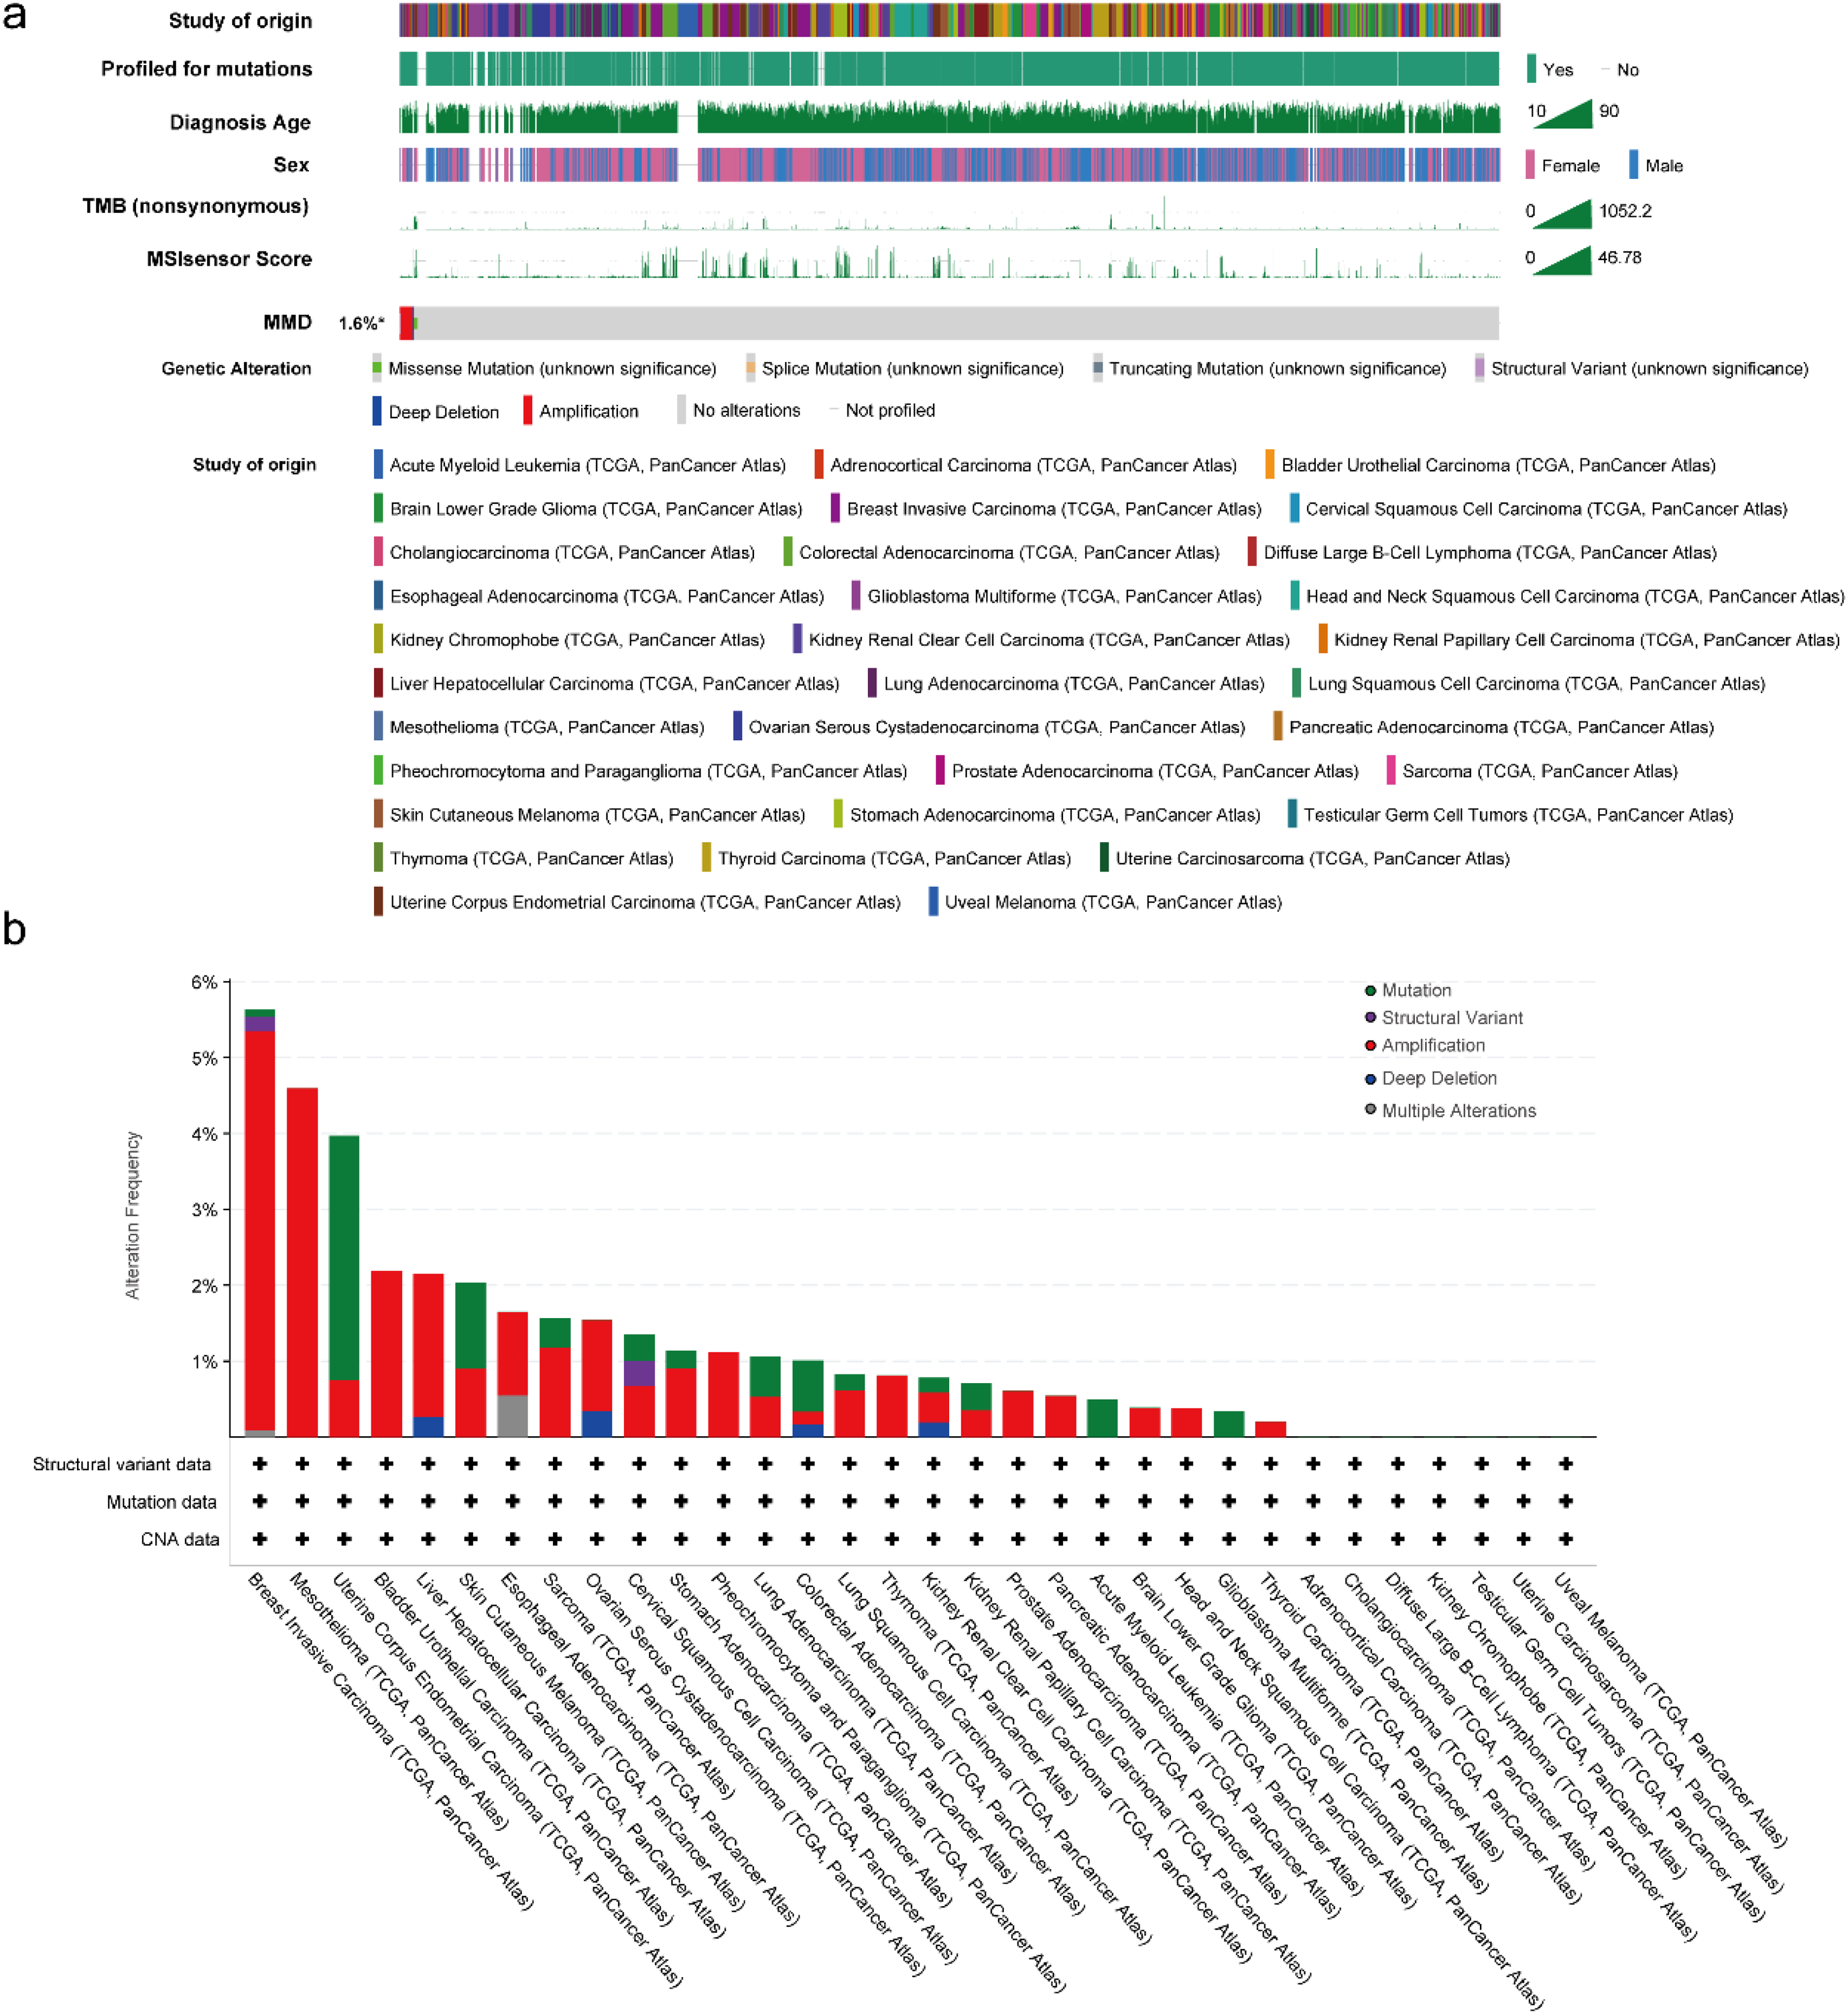
MMD's mutational characterization (a) mutation type; (b) mutation frequency.
PPI and enrichment analysis for MMD
To identify the proteins interacting with MMD, the STRING database was utilized to select 48 proteins (node degree: 1–16). A protein interaction network (PPI) was constructed (Figure 8(a)). Following functional analyses including GO annotation and KEGG pathway enrichments (GO/KEGG), it was observed that these genes predominantly participate in hypoxic responses, steroid hormone signaling, mitochondrial depolarization, triglyceride metabolism, autophagy, neuronal differentiation, apoptosis, mitogen-activated protein kinase (MAPK) activity regulation, protein kinase activity regulation, steroid hormone binding, lipolysis, estrogen signaling, peroxisome proliferator-activated receptor (PPAR) signaling, epidermal growth factor receptor (ERBB) signaling, and others (Figure 8(b)).
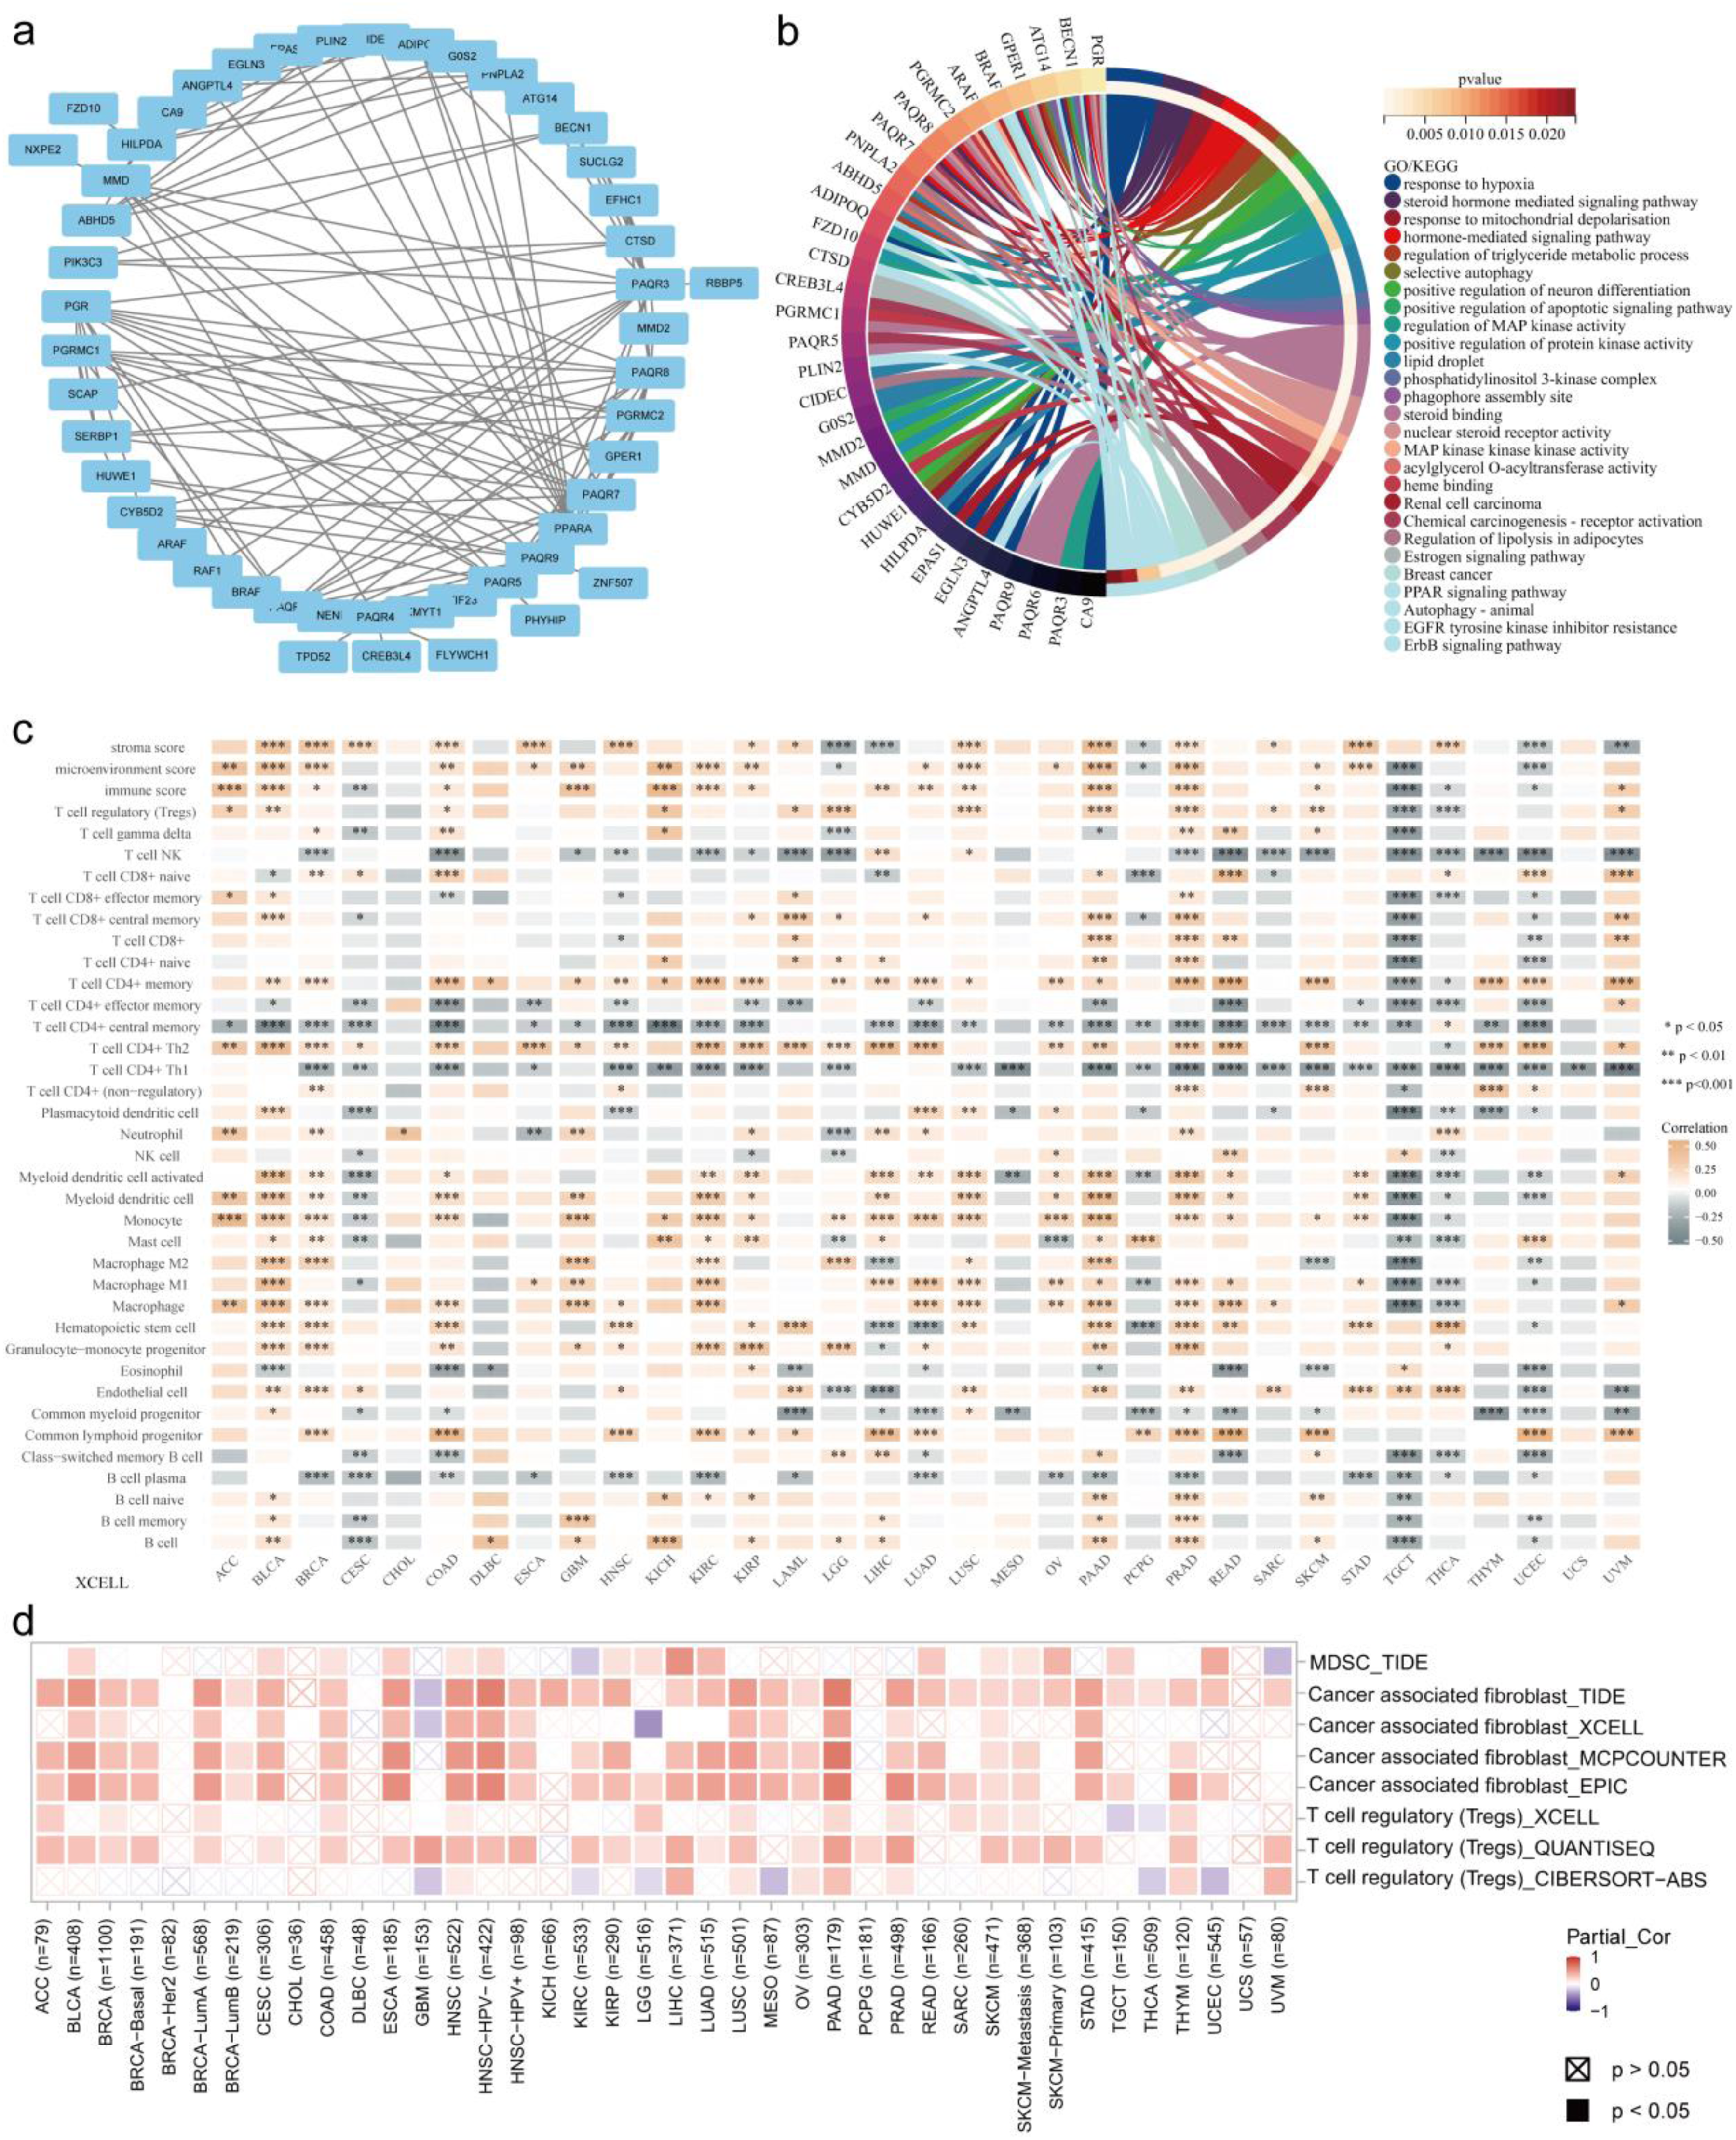
PPI network construction, enrichment analysis and tumor immune analysis (a) PPI network; (b) GO/KEGG analysis (chord plot); (c) MMD expression and immune infiltration of tumors (heatmap); (d) MMD and 3 types of immune suppresive cells (heatmap). (*: p < 0.05; **: p < 0.01; ***: p < 0.001; ****: p < 0.0001).
MMD and immune infiltration of cancers
The present study examined the correlation between MMD gene expression and various immune cells within individual tumors using RNAseq datasets and clinical data from TCGA. The analysis of the data revealed a strong association between MMD and immune cell infiltration in most cancers (Figure 8(c)), indicating negative relationships in CESC, PCPG, TGCT, THCA, and UCEC and positive associations in LUAD, LUSC, PAAD, BRCA, KIRP, ACC, KIRC, BLCA, and PRAD. Notably, MMD exhibited a negative correlation with immune infiltrates such as B cell plasma, common myeloid progenitors, CD4+ Th1 cell/central memory, and NK T cells, and a positive correlation with CD4+ Th2 cells and common lymphoid progenitors.
Subsequently, an assessment was conducted to determine the correlation between MMD expression in 14 tumors (differential MMD expression) and 23 immune cells in each tumor using single-sample gene set enrichment analysis (ssGSEA) (Figure S1). Interestingly, a significant negative correlation was observed between MMD and Th17 cell infiltration in 22 tumors (Figure S2).
By evaluating the link between MMD and tumor immune suppression using the TIMER2.0 platform, it was determined that in most cancers, elevated MMD levels correlated with higher infiltration of regulatory T cells (Tregs), cancer-associated fibroblasts (CAFs), and myeloid-derived suppressor cells (MDSC) (Figure 8(d)). Furthermore, in most tumors, a remarkable correlation emerged between MMD and eight immune checkpoint genes: T-cell immunoreceptor with Ig and ITIM domains (TIGIT), programmed cell death 1 ligand 2 (PDCD1LG2), programmed cell death 1 (PDCD1), lymphocyte activating 3 (LAG3), Cytotoxic T-lymphocyte associated protein 4 (CTLA4), CD276, CD274, B and T lymphocyte associated (BTLA) (Figure 9(a)).
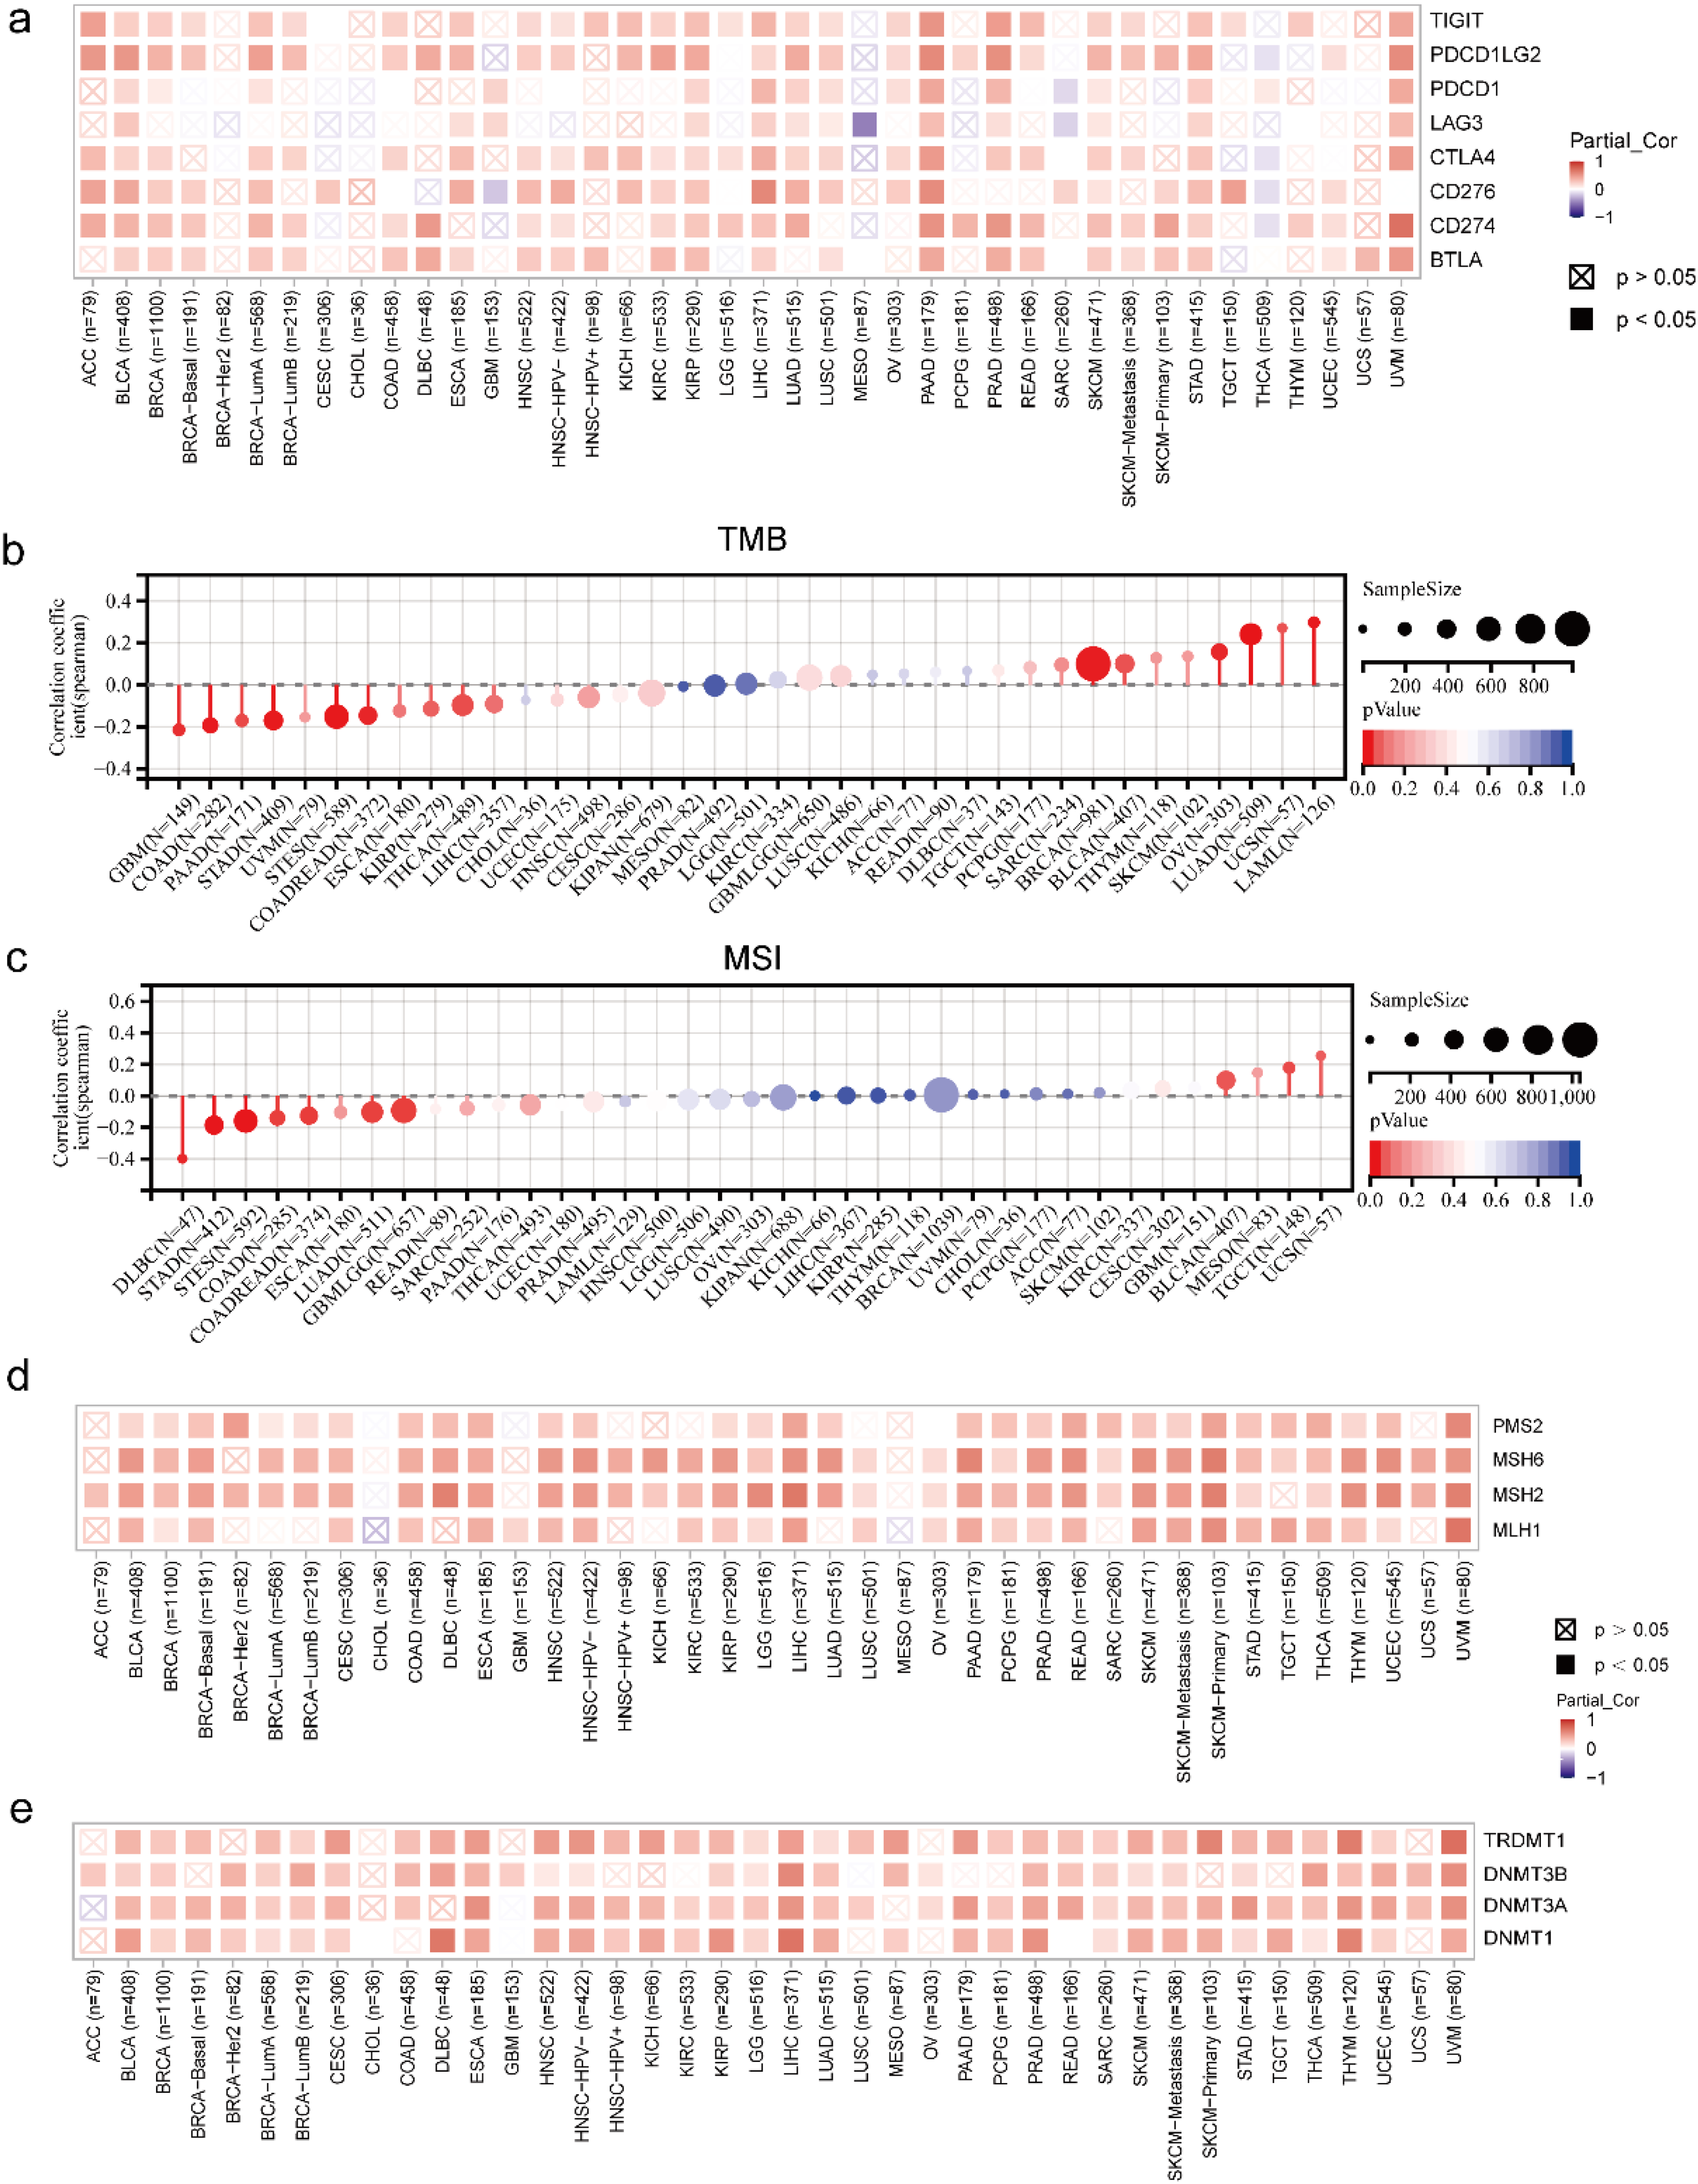
Correlation of MMD with immune checkpoint molecules, TMB, MSI, MMR genes, and DNA methyltransferase (a) MMD and eight immune checkpoint molecules (heatmap); (b) MMD and TMB (lollipop plot); (c) MMD and MSI (lollipop plot); (d) MMD and MMR genes (heatmap); (e) MMD and DNA methyltransferase genes (heatmap).
Two markers (TMB and MSI) were associated with response to immunotherapy. Assessing the correlation between MMD levels, TMB, and MSI in 37 tumors revealed a noteworthy connection between MMD and TMB in 13 tumors (Figure 9(b)). This correlation was positive and significant in six tumors: LUAD, LAML, BRCA, OV, uterine carcinosarcoma (UCS), and BLCA, whereas significant negative correlations were found in seven tumors: GBM, THCA, PAAD, STAD, colon adenocarcinoma/rectum adenocarcinoma esophageal carcinoma (COADREAD), stomach and esophageal carcinoma (STES), and COAD. In nine tumors, MMD demonstrated a marked correlation with MSI (Figure 9(c)). Two tumors (TGCT and BLCA) showed a notably positive relationship, whereas seven tumors–glioma (GBMLGG), LUAD, STES, STAD, COADREAD, COAD, and lymphoid neoplasm diffuse large B-cell lymphoma (DLBC)–showed a negative relationship. Correlation of MMD with MMR genes, including PMS1 homolog 2, mismatch repair system component (PMS2), MutL homolog 1 (MLH1), MutS homolog 2 (MSH2), and MutS homolog 6 (MSH6), revealed significant positive associations across most tumor types (Figure 9(d)).
Previous studies have indicated that DNA methylation is significantly correlated with resistance to tumor therapy resistance.19–21 The association between the MMD and DNA methylation was explored by establishing Spearman's correlation coefficients between the MMD and the following DNA methyltransferase genes: DNA methyltransferase 1 (DNMT1), tRNA aspartic acid methyltransferase 1 (TRDMT1), DNA methyltransferase 3 alpha (DNMT3A), and DNA methyltransferase 3 beta (DNMT3B). This analysis revealed a consistent positive correlation across various malignancies (Figure 9(e)).
Relationship between MMD and clinicopathologic features of HCC and Cox regression analysis
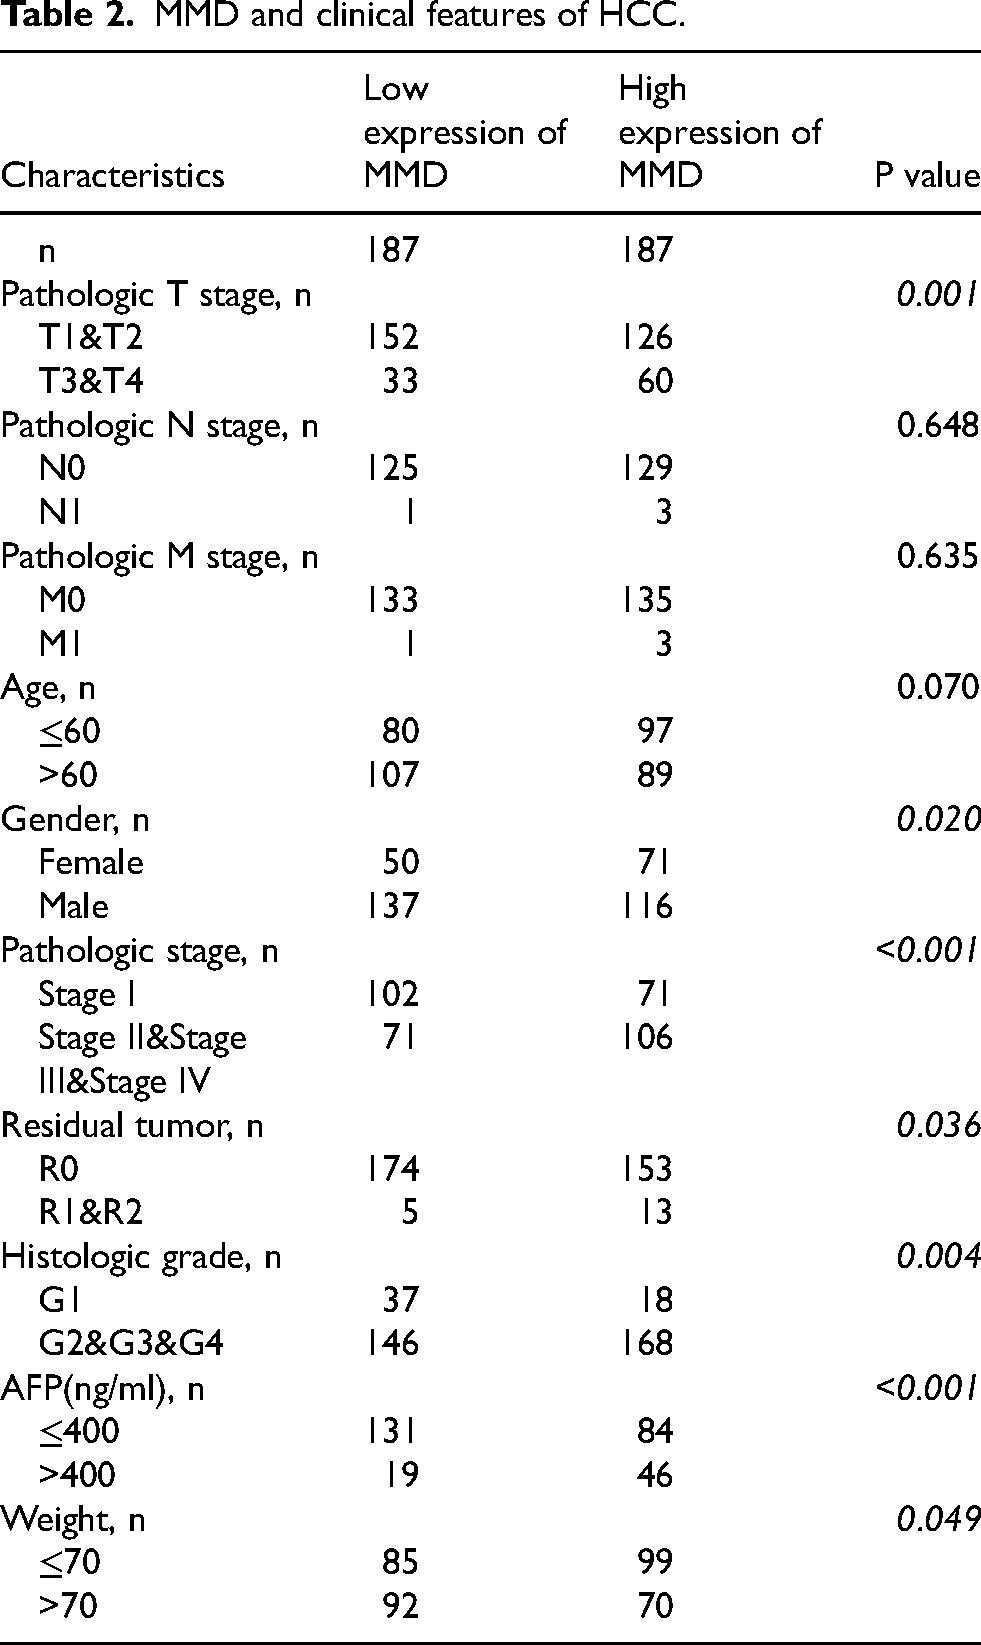
It was evident from the table that MMD expression was strongly correlated with T stage (p = 0.001), stage (p < 0.001), sex (p = 0.020), histologic grade (p = 0.004), weight (p = 0.049), alpha fetoprotein (AFP) (p < 0.001), and residual tumor (p = 0.036) by evaluating the association between MMD and the clinicopathological features of HCC patients (Table 2). The results indicated that the detection of MMD gene expression could potentially contribute to the diagnosis and prognosis prediction of hepatocellular carcinoma.
MMD and clinical features of HCC.
A rigorous Cox regression analysis was conducted to investigate the effect of MMD on the clinical prognosis of patients with HCC. T-stage, M-stage, pathological staging, and MMD levels were identified as significant predictors of HCC prognosis (hazard ratio > 1, p < 0.05) by univariate Cox regression. Furthermore, T-stage and MMD levels continued to serve as prognostic indicators (hazard ratio > 1, p < 0.05) in the multifactorial regression model, demonstrating that elevated MMD levels served as independent determinants of poor HCC prognosis (Figure 10(a)). To further evaluate these findings, a nomogram was constructed using MMD levels and T-stage data to forecast patient survival at 1, 3, and 5 years after diagnosis (Figure 10(b)). The model predicted well (Figure 10(c)).
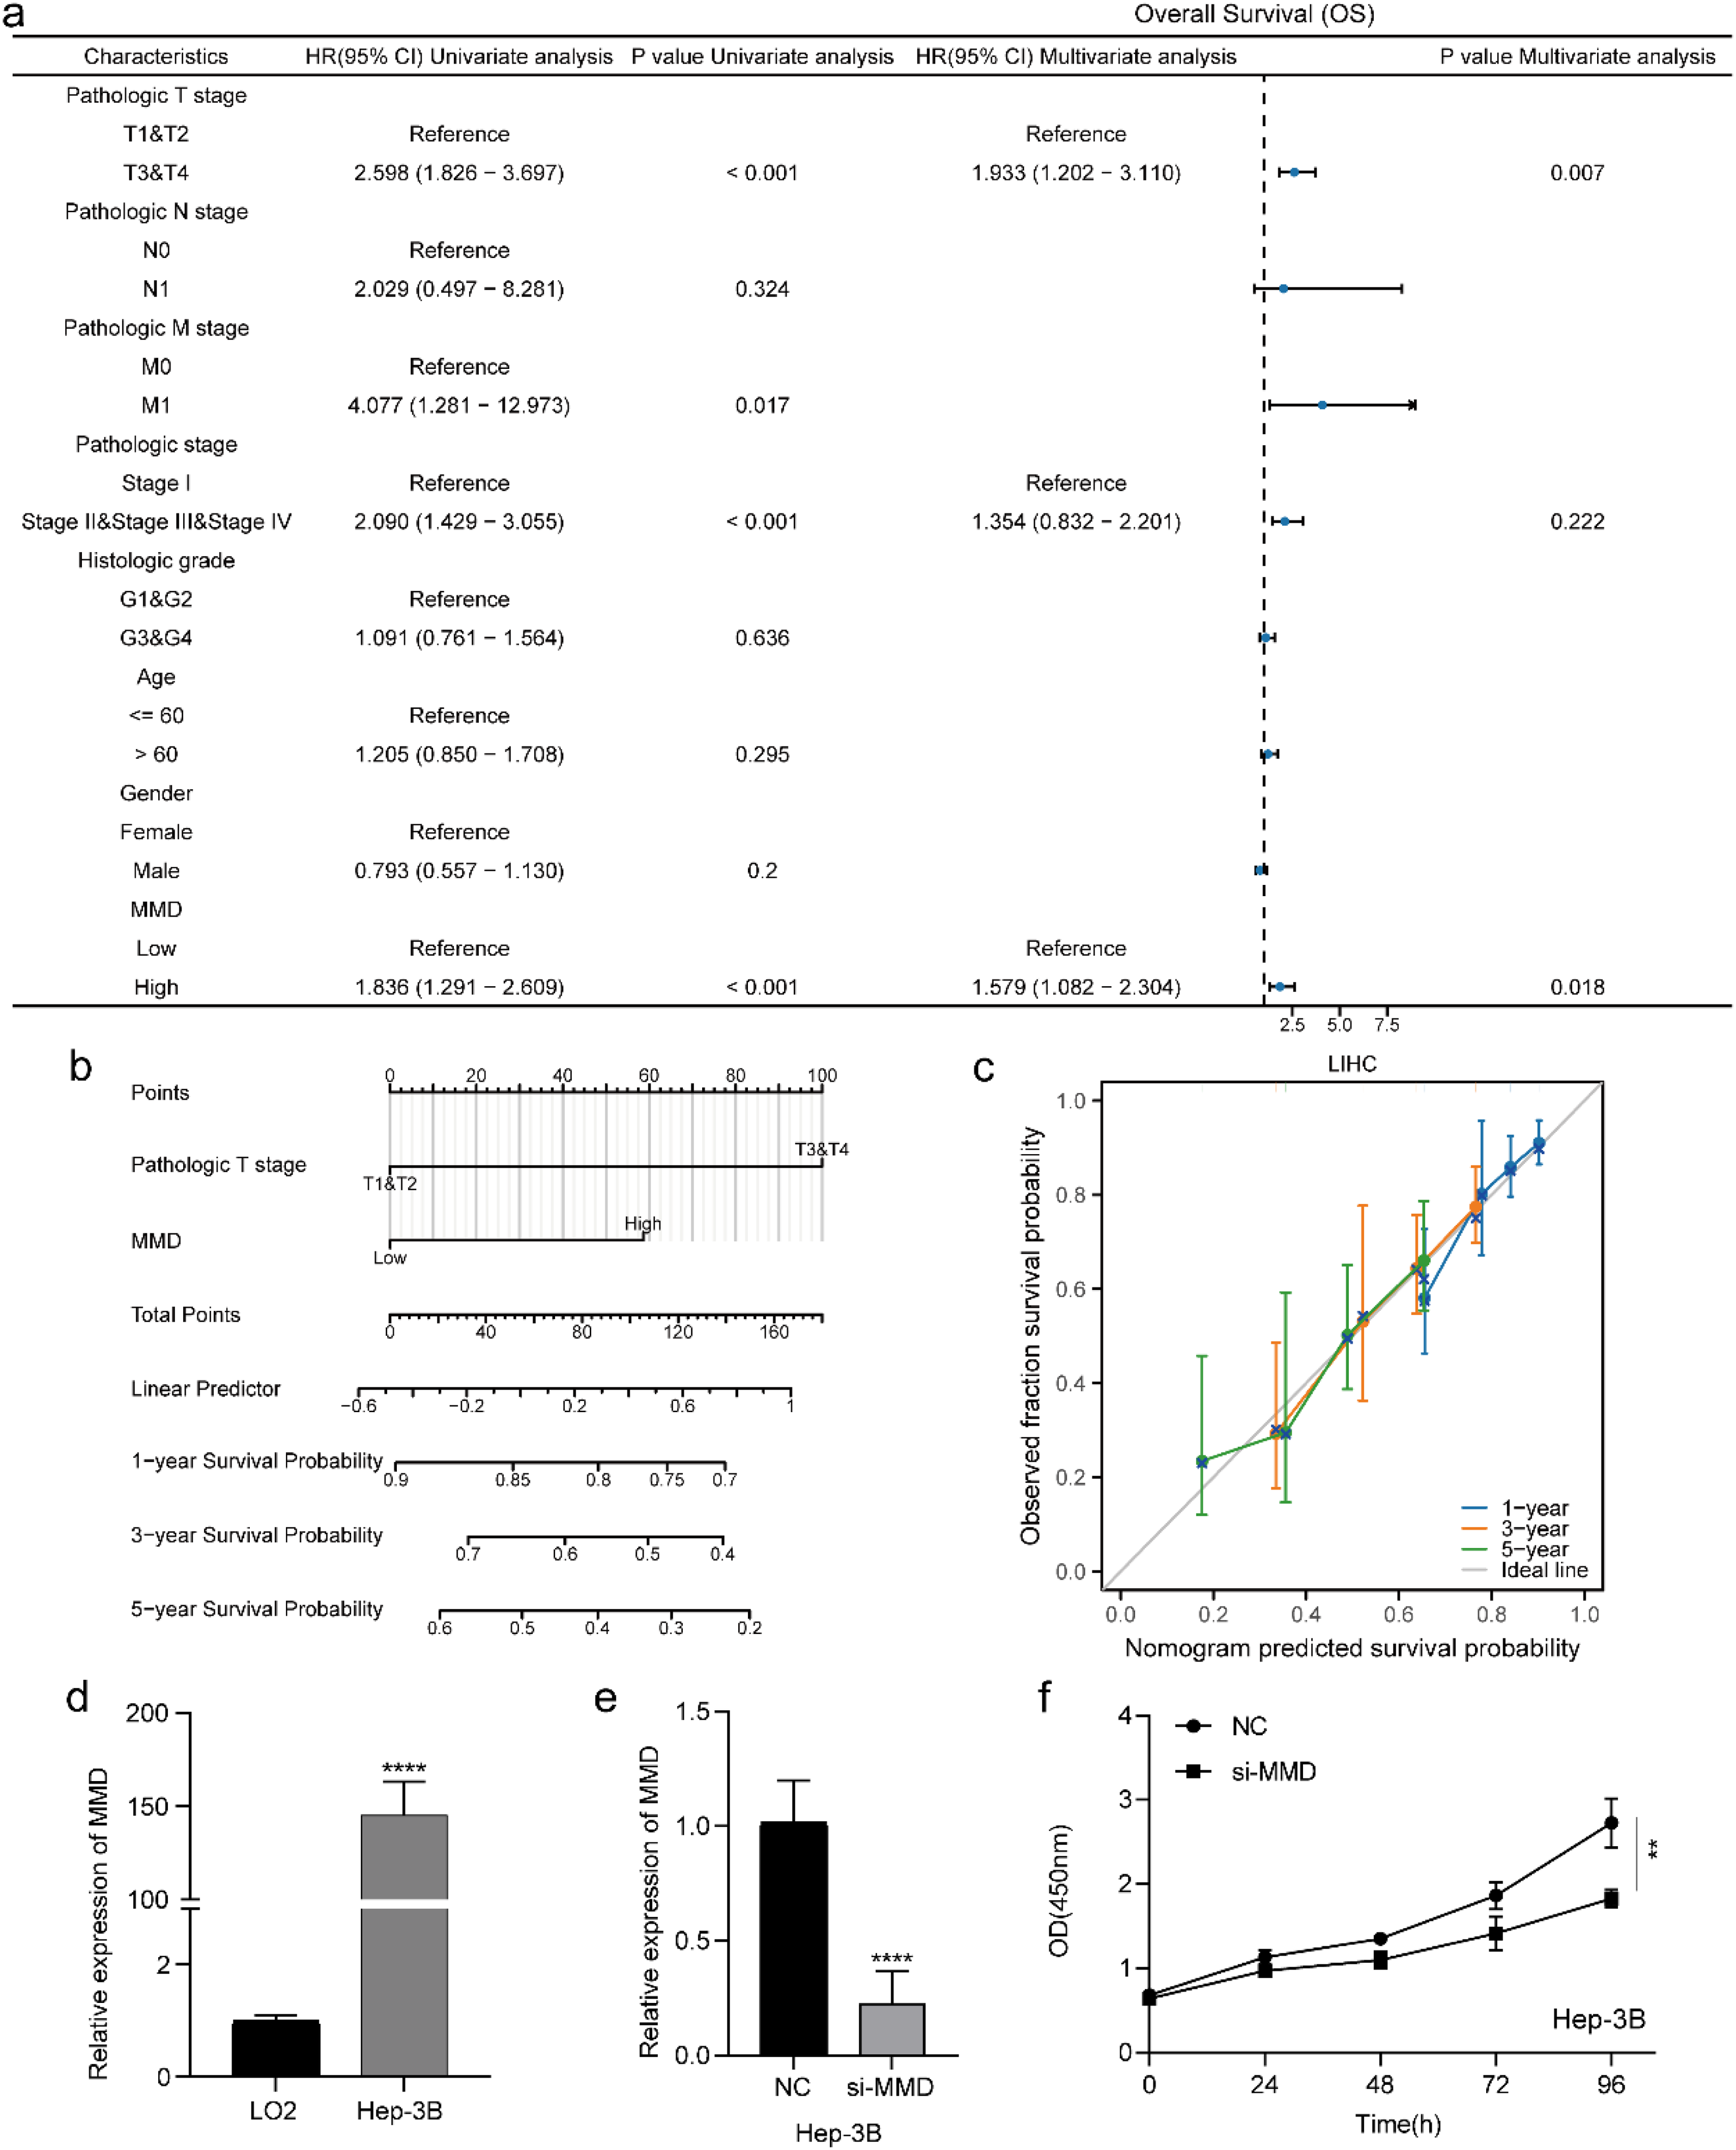
Cox regression analysis and MMD expression and proliferation assay in liver cancer (a) cox regression analysis in HCC; (b) nomogram; (c) calibration curve; (d) expression of MMD in HCC cells; (e) validation of the effectiveness of siRNA; (f) CCK-8 assay. (**: p < 0.01; ****: p < 0.0001).
High MMD expression affects Hep-3B cell proliferation
MMD expression was significantly higher in Hep-3B cells than in normal hepatocytes (p < 0.0001) (Figure 10(d)). Subsequently, an investigation was conducted to determine the alterations in cellular proliferation after MMD depletion in Hep-3B cells using the CCK-8 assay. A significant decrease in the proliferation rate of Hep-3B cells was observed in the MMD knockdown cohort than in the negative control group (NC) (p < 0.01) (Figure 10(f)).
Discussion
A conducted a series of multi-omics pan-cancer analyses of MMD explored its significance in tumors. Pan-cancer expression analysis in showed differential expression of MMD in 14 tumors. High MMD levels significantly correlated with LGG, LUAD, STAD, LIHC, KIRP, CESC, PRAD, BLCA, and UCEC, indicating a poorer prognosis for OS, DSS, and PFI. Conversely, low MMD levels were positively correlated with adverse outcomes in terms of OS and DSS in patients with COAD, KIRC, and READ, while exhibiting a negative correlation with OS and DSS in patients with HNSC and KICH. In conjunction with pan-cancer expression profiling, a remarkable upregulation of MMD was observed in HNSC, LIHC, LUAD, and STAD. Concurrently, elevated MMD levels showed a conspicuous correlation with an unfavorable prognosis among the four malignancies. Evaluation of the diagnostic efficacy of MMD showed that MMD had better diagnostic efficacy in 14 tumors, including HNSC, LIHC, LUAD, and STAD. Abnormal DNA methylation is closely related to tumorigenesis, progression, and metastasis.22,23 MMD showed a predominant trend of reduced methylation levels in 13 tumors, implying the possible involvement of MMD methylation in cancer initiation and progression. TP53 plays an essential role in maintaining genome stability, inhibiting cancer transformation of normal cells, and inhibiting cancer cell growth; thus, mutations in TP53 can affect the development of tumors.24–26 The present study examined the association between MMD expression, MMD methylation, and TP53 mutations and found evidence of their association with various tumors. Significantly elevated MMD protein expression was observed in tumor tissues exhibiting TP53 mutations than in those lacking such alterations, paralleled by diminished MMD DNA methylation levels in tumors containing TP53 mutations versus their counterparts devoid of this genetic alteration. The results of the present study demonstrate that, in certain tumors, there is an association between altered MMD gene expression levels or aberrant methylation and TP53 mutations. It was speculated that MMD might be involved in the development of certain malignant tumors caused by TP53 mutations. Mutation data revealed an exceedingly restrained incidence of MMD alterations across numerous tumor specimens, leading to speculation regarding the minimal relevance of MMD mutations in tumor evolution. Examination of MMD and its related genes via functional enrichment analysis revealed the participation of these genes in signaling cascades pertinent to tumor development, cellular apoptosis, and autophagy. Consequently, MMD is potentially interconnected with specific proteins in these pathways, thereby influencing the physiological functions of tumor cells.
Helper T lymphocytes (Th), whose surface marker is CD4, are divided into various subtypes according to the secreted cytokines and effector functions, with Th1 and Th2 being the two earliest subpopulations identified, and Th17 being a newly discovered subpopulation in recent years. 27 Th1 lymphocytes primarily release interleukin-2, tumor necrosis factor, and interferon-γthat stimulated Th1 proliferation while suppressing Th2 proliferation.28–30 These proteins also energize CD8+ cytotoxic T cells and macrophages and affect cellular immunity. Th2 lymphocytes primarily produce cytokines like interleukin-4, interleukin-5, and others that stimulate Th2 cell proliferation while suppressing Th1 growth, further contributing to B lymphocytic mobilization.31,32 Typically, Th1 and Th2 cells in the organism are in dynamic balance, and once this balance is disrupted, it may lead to tumorigenesis and progression, and the relative predominance of Th2 cells in tumors may be related to tumor immune escape. 29 As shown in Figure 8(c), MMD had a noticeable negative correlation with CD4+ Th1 infiltration and an impressive positive correlation with CD4+ Th2 infiltration in most tumors. Furthermore, this study showed an inverse correlation between MMD and Th17 cell infiltration in 22 tumors. Th17 cells have been implicated in tumor suppression. Th17 mainly secretes interleukin-17, which promotes the release of inflammatory factors that amplify the inflammatory response.33–35 The above analyses suggest that MMD may be involved in the regulation of tumor immune infiltration.
Both MDSC and Treg cells inhibit T cell function, whereas CAFs inhibit cytotoxic T cell (CTL) activation and promote the apoptosis of activated CTLs to decrease the immune response.36–38 Cellular immune checkpoint molecules inhibit immune cell functions and maintain regular immune activity. In the context of tumors, the expression of immune checkpoint molecules may be induced, thereby impeding the body's capacity to mount an effective immune response to suppress tumor growth, resulting in tumor immune escape.39–41 In addition, they are involved in carcinoma metastasis, angiogenesis, and drug resistance. 42 The results showed that MMD was strongly associated with suppressive immune cells (MDSC, CAF, and Tregs) and immune checkpoint molecules in most tumors. It has been suggested that MMD may be involved in tumor immune escape.
A preliminary analysis of the relationship between MMD and several malignancy immune markers (TMB, MSI) explored the possible impact of MMD on immunotherapy.43,44 The analysis revealed a significant link between MMD and TMB, MSI, and MMR genes in multiple tumor types. Defective MMR genes would lead to MSI. 45 These findings indicated that high MMD expression may impair the potency of immunotherapy. DNA methyltransferases were critical enzymes in the process of DNA methylation, and aberrant DNA methylation had been demonstrated to play a pivotal role in tumor growth and invasion.22,46 For example, DNA hypermethylation mediated by DNMT1 and DNMT3A contributes to the aggressive nature of adrenocortical carcinoma. 47 Furthermore, the hypermethylation of cadherin 1 (CDH1), induced by DNMT3A, has been shown to promote metastasis in gallbladder cancer. 48 Notably, a positive correlation was discovered between MMD and DNA methyltransferases across the majority of the studied tumors. MMD expression may be mediated by certain DNA methyltransferases, which can result in aberrant methylation, thereby influencing tumor progression.
Finally, the results from a Cox regression analysis using comprehensive TCGA-LIHC data indicated that elevated levels of MMD were a significant independent prognostic predictor in patients with HCC. It had been experimentally verified that MMD expression was elevated in HCC cells and affected their proliferation. Therefore, MMD may be involved in HCC progression.
Conclusions
This comprehensive examination delved into the function of MMD in tumors from diverse viewpoints. The findings revealed that aberrant MMD expression was detected in 14 types of tumors and correlated with OS in 20 types, DSS in 16 types, and PFI in 13 tumors. Furthermore, MMD methylation levels were altered in 13 tumors, and remarkably altered MMD expression and methylation levels were observed in several tumors linked to TP53 mutations. Functional enrichment analysis indicated that MMD and its associated genes may play pivotal roles in controlling the activities of numerous protein kinases and several pathway proteins implicated in tumor progression. Simultaneously, MMD levels correlated with immune cell infiltration in diverse cancers. Cox regression analysis showed that elevated MMD levels were an independent risk factor for poor prognosis in patients with HCC. The qPCR assay demonstrated that MMD was highly expressed in Hep-3B cells, and its suppression could effectively impede Hep-3B cell proliferation. Thus, MMD has the potential to become a novel tumor marker.
Supplemental Material
sj-docx-1-cbm-10.1177_18758592251329280 - Supplemental material for Multi-omics pan-cancer analysis of monocyte to macrophage differentiation-associated (MMD) and its significance in hepatocellular carcinoma
Supplemental material, sj-docx-1-cbm-10.1177_18758592251329280 for Multi-omics pan-cancer analysis of monocyte to macrophage differentiation-associated (MMD) and its significance in hepatocellular carcinoma by Suyang Bai, Yuping Wang, Yongning Zhou and Liang Qiao in Cancer Biomarkers
Footnotes
Ethics approval
No applicable.
Author contributions
Conception: Suyang Bai; Yuping Wang. Interpretation or analysis of data: Suyang Bai; Yuping Wang. Preparation of the manuscript: Suyang Bai. Revision for important intellectual content: All authors. Supervision: All authors.
Funding
The authors received no financial support for the research, authorship, and/or publication of this article.
Declaration of conflicting interests
The authors declared no potential conflicts of interest with respect to the research, authorship, and/or publication of this article.
Data availability
The datasets generated during and analysed during the current study are available from the corresponding author on reasonable request.
Supplemental material
Supplemental material for this article is available online.
References
Supplementary Material
Please find the following supplemental material available below.
For Open Access articles published under a Creative Commons License, all supplemental material carries the same license as the article it is associated with.
For non-Open Access articles published, all supplemental material carries a non-exclusive license, and permission requests for re-use of supplemental material or any part of supplemental material shall be sent directly to the copyright owner as specified in the copyright notice associated with the article.