
Abstract
Objectives
The present study aimed to develop a gene signature based on the ESTIMATE algorithm in hepatocellular carcinoma (HCC) and explore possible cancer promoters.
Methods
The ESTIMATE and CIBERSORT algorithms were applied to calculate the immune/stromal scores and the proportion of tumor-infiltrating immune cells (TICs) in a cohort of HCC patients. The differentially expressed genes (DEGs) were screened by Cox proportional hazards regression analysis and protein–protein interaction (PPI) network construction. Cyclin B1 (CCNB1) function was verified using experiments.
Results
The stromal and immune scores were associated with clinicopathological factors and recurrence-free survival (RFS) in HCC patients. In total, 546 DEGs were up-regulated in low score groups, 127 of which were associated with RFS. CCNB1 was regarded as the most predictive factor closely related to prognosis of HCC and could be a cancer promoter. Gene Set Enrichment Analysis (GSEA) and CIBERSORT analyses indicated that CCNB1 levels influenced HCC tumor microenvironment (TME) immune activity.
Conclusions
The ESTIMATE signature can be used as a prognosis tool in HCC. CCNB1 is a tumor promoter and contributes to TME status conversion.
Introduction
Based on the latest global cancer epidemic statistics (GLOBOCAN), hepatocellular carcinoma (HCC) is one of the most fatal diseases, ranking fourth among all tumors worldwide. 1 HCC accounts for 70% to 85% of primary liver cancers with about 750,000 new cases and 700,000 deaths each year. 1 HCC patients are frequently diagnosed at advanced stage with 5-year survival rates less than 30%. 2 At present, treatment for HCC mainly includes surgical resection, interventional therapy, and percutaneous ablation. Chemotherapy and targeted therapies are generally less effective. It is therefore necessary to identify more effective molecular biomarkers and therapeutic targets. To achieve this goal, researchers have established certain whole gene expression data sets, including The Cancer Genome Atlas (TCGA) database, to analyze genomic abnormalities in cancer cases. 3
Intrinsic genes, especially main transcription factors, have always been the focus of malignancy research. However, it has been suggested that the tumor microenvironment (TME) is of critical importance for tumor-associated gene expression. 4 The TME is the cellular milieu around where the tumor is located. It is considered to be a crucial factor for determining the survival and proliferation of tumor cells in metastatic lesions. 5 In addition to tumor cells, the TME of HCC is composed of stromal cells, extracellular matrix, and intercellular communication molecules that regulate immune escape and immune therapy response of HCC cells. 6 To assess the tumor purity of the TME, Yoshihara et al. 4 established a computational method called Estimation of STromal and Immune cells in MAlignant Tumor tissues using Expression data (ESTIMATE). By analyzing gene expression characteristics, the algorithm can calculate immune and stromal scores as main parameters. In subsequent studies, the ESTIMATE program was applied to prostate cancer, 7 breast cancer, 8 colon cancer, 9 and glioblastoma, 10 demonstrating the effectiveness of this big data-based algorithm. However, the usefulness of the ESTIMATE algorithm in HCC has not been investigated in detail.
CCNB1, the gene coding for cyclin B1, belongs to the highly conserved cyclin family and is a regulatory factor involved in mitosis and cell cycle progression. 11 It is broadly expressed in lymph node tissue and provides proper control for the G2/M phase transition. In addition, CCNB1 combines with p34(cdc2) to form the maturation-promoting factor (MPF). 12 Here, by further comparing differentially expressed genes (DEGs), we demonstrate that CCNB1 is a potential factor responsible for the change of TME status in HCC.
Materials and methods
Ethical approval
The data used in this study were from TCGA database; consent and ethics-related documents can be found here: https://www.cancer.gov/about-nci/organization/ccg /research/structural-genomics/tcga/history/policies. Further ethical approval was given by Second Affiliated Hospital of Harbin Medical University.
TCGA Data
Gene expression profiles of HCC tumors were accessed from the TCGA database (https://tcga-data.nci.nih.gov/tcga/), which was measured experimentally using the Illumina HiSeq 2000 RNA Sequencing platform by the University of North Carolina TCGA genome characterization center. 3 This dataset shows gene-level transcriptional estimates, as in log2(x+1) transformed RSEM normalized count. Clinical data were also obtained from the same portal. Immune scores and stromal scores were gained by running ESTIMATE computational methods. 4 For results verification, a gene expression profile GSE54236 was downloaded from the Gene Expression Omnibus (GEO) database (GPL6480 platform, GPL6480 Agilent-014850 Whole Human Genome Microarray 4x44K G4112F). According to the platform annotation information, the probes were transformed into the corresponding genetic symbol.
Identification of differentially expressed genes (DEGs)
Overall, 232 HCC cases were divided into upper and lower halves relative to the median values of the immune and stromal scores. The limma package was used to perform data analysis. 13 The cut-off value was set as fold change > 1.5 and adj. P < 0.05 to filter the TCGA data and identify DEGs, which were generated by the comparison between the high-score cases vs. the low-score cases.
Heatmaps
The open-source web tool ClustVis was used to build heatmaps. 14
Protein–protein interaction (PPI) network construction
Data for protein–protein interaction (PPI) networks were provided by the Search Tool for the Retrieval of Interacting Genes (STRING; http://string-db.org) (version 10.0) 15 and constructed by Cytoscape software. 16 The topological clustering tool Molecular Complex Detection (MCODE) (version 1.4.2) was used to detect densely connected clusters. 17
Enrichment analysis of DEGs
Gene Ontology (GO) and Kyoto Encyclopedia of Genes and Genomes (KEGG) enrichment analyses were performed with the cluster Profiler, enrichplot, and ggplot2 packages. The items with P < 0.05 were considered significantly enriched.
Enrichment analysis of gene sets
Gene Set Enrichment Analysis (GSEA)-3.0 software was used to perform the analysis. Hallmark, KEGG, GO, and C7 gene sets of v6.2 collections were obtained as the target set from the Molecular Signatures Database. Listed gene sets with nominal (NOM) P < 0.05 were considered statistically significant.
Tumor-infiltrating immune cell (TIC) profiles
The distribution of tumor-infiltrating immune cells (TICs) abundance in all tumor samples was estimated using the CIBERSORT calculation method. The cases with P < 0.05 were filtered for further analysis.
Tissue collection
Paraffin‑embedded HCC specimens and paired non-cancerous tissues from 108 patients were selected from the Department of General Surgery, Second Affiliated Hospital of Harbin Medical University (Harbin, China) between January 2013 and January 2015. The study protocol was approved by the Ethics Committee of the Second Affiliated Hospital of Harbin Medical University and samples were obtained with written informed consent.
Immunohistochemical staining analysis
In brief, 4-µm-thick sections were cut from paraffin‑embedded specimens, then deparaffinized, rehydrated, and heated according to procedural standards. Subsequently, the sections were placed in 3% hydrogen peroxide at room temperature for 10 minutes to remove endogenous peroxidase activity, followed by blocking with 1% bovine serum albumin (BSA). The samples were then incubated with a CCNB1 primary antibody (1:100 ABclonal, Wuhan, China) at 4°C overnight. Finally, the sections were incubated with biotin‑labeled secondary antibody (1:100; HY90046; Shanghai HengYuan Biological Technology Co. Ltd., Shanghai, China) at 37°C for 30 minutes and horse-radish peroxidase-conjugated streptavidin for 20 minutes. A Leica DM4000B/M microscope (Leica Microsystems, Inc., Buffalo Grove, IL, USA) was used for observation.
Cell culture and transfections
Huh7 and HepG2 cells were obtained from the American Type Culture Collection (ATCC). Both cell lines were cultured in Dulbecco’s modified Eagle’s medium (DMEM) supplemented with 10% fetal bovine serum (FBS) (Thermo Fisher Scientific, Waltham, MA, USA) and incubated at 37°C and 5% CO2. A small interfering RNA (siRNA) against CCNB1 and scrambled siRNA negative control were synthesized by GenePharma (Shanghai, China). Transient transfections in cells were performed with Lipofectamine 2000 (Thermo Fisher Scientific) according to the manufacturer's instructions.
Immunofluorescence assay
Cells were seeded in culture dishes and grown for 2 days. Cells in the logarithmic phase of growth were washed with phosphate buffered saline (PBS) and fixed with 4% paraformaldehyde at room temperature for 30 minutes. A 0.2% Triton X-100 solution was used to permeabilize cell membranes. After blocking in 5% BSA for 30 minutes, the cells were incubated with a CCNB1 primary antibody (1:100 ABclonal) at 4°C overnight. The cells were further washed with PBS three times and incubated with fluorescence-conjugated secondary antibodies for 1 hour. The nuclei were stained with 4ʹ,6-Diamidine-2ʹ-phenylindole dihydrochloride (DAPI, C1002, Beyotime, Shanghai, China). Finally, immunofluorescence images were captured by confocal microscope (Olympus FV1000, Japan).
Cell proliferation, migration, and invasion assays
Cell Counting Kit (CCK)-8 assays (C0038, Beyotime) were used to evaluate the proliferation rates of untreated and CCNB1-deficient HCC cells. 2 × 10³ cells were plated in 96-well plates and the absorbance readings at 450 nm were recorded every 24 hours. For Transwell migration and Matrigel invasion assays, cells were incubated for 24 hours, then any migrated cells were fixed with methanol and stained with crystal violet. Cell migration and invasion were observed under a microscope.
Establishment of animal models
Animal models were established based on institutional protocols and approved by the Animal Ethics Committee of Harbin Medical University. For in vivo experiments, 4-week-old male BALB/c nude mice were injected with equal numbers of HCC cells stably infected with pL/shRNA/F-CCNB1 or pL/shRNA/F (5 × 10⁶ cells/injection for Huh7 cells). These vectors are for a short hairpin RNA (shRNA) against CCNB1 and control shRNA. About 4 weeks after xenotransplantation, mice were sacrificed and xenografts were removed, weighed, and photographed. Tumor diameters were observed with a precision caliper to calculate the mass volume.
Statistical analysis and survival curves
SPSS 20.0 software (IBM, Armonk, NY, USA) and GraphPad Prism 7.0 (GraphPad Software, San Diego, CA, USA) were used for statistical analysis. All results are expressed as mean ± standard deviation (SD). Data for non-parametric variables were evaluated by chi-square tests. Student’s t-tests were used for parametric variables. The relationships between DEG expression levels and patient recurrence-free survival (RFS) were illustrated with Kaplan–Meier plots and Cox proportional hazards regression models. The results was tested using log-rank tests. P-values < 0.05 were regarded as statistically significant.
Results
Immune and stromal scores are significantly correlated with clinicopathological factors and RFS of HCC patients
We screened data from TCGA database for HCC cases that received only radical resection with RFS more than 30 days. Ultimately, 232 cases were enrolled. The ESTIMATE method was used to obtain immune and stromal scores and then analyze both with clinicopathological factors. Statistics indicated that the stromal score was associated with histological grade (P = 0.006), body mass index (BMI) (P = 0.018), and hepatitis virus infection (P = 0.025). The immune score was relevant with the clinical stage (P = 0.007), but the stromal score (P = 0.070) was not statistically significant (Table 1).
Association between immune and/or stromal scores and clinicopathological characteristics in hepatocellular carcinoma (HCC) patients.

SE, standard error; MVI, microvascular invasion; BMI, body mass index.
To demonstrate the potential relationship between RFS and immune and/or stromal scores, 232 HCC cases were divided into upper and lower halves (high vs. low groups). According to the Kaplan–Meier survival curves (Table 2), the median RFS of the high stromal score group was longer than that of the low score group (1432 days vs. 776 days, P = 0.0326). Consistently, the high immune score group also had longer median RFS than the low score group (2028 days vs. 592 days, P < 0.0001). In addition, we performed prognostic statistical analysis of other pathological factors and confirmed that clinical stage (P < 0.001), microvascular invasion (MVI) (P = 0.026), surgical method (P < 0.001), and viral hepatitis (P = 0.008) were also associated with RFS (Table 2).
Univariate survival analysis of recurrence-free survival (RFS) in hepatocellular carcinoma (HCC) patients.

RFS, recurrence-free survival; SE, standard error; CI, confidence interval; MVI, microvascular invasion; BMI, body mass index.
Parameters confirmed as significant in the univariate log-rank test, along with some important clinicopathological factors, were included in the multivariate Cox regression model. The statistics indicated that the immune score (P = 0.003, Table 3) could possibly serve as an independent prognostic marker for RFS. Furthermore, clinical stage (P
Multivariate Cox regression analysis for various potential prognostic characteristics of recurrence-free survival (RFS) in hepatocellular carcinoma (HCC) cases.

RFS, recurrence-free survival; CI, confidence interval; MVI, microvascular invasion; BMI, body mass index.
Identification of DEGs with stromal and/or immune scores in HCC
We compared RNA-sequencing (RNA-seq) data of low vs. high immune/stromal scores cohorts (Figure 1a,b) and identified 433 and 174 up-regulated genes in the low stromal and low immune score groups, respectively (fold change > 1.5, P < 0.05). A total of 546 genes were up-regulated in both groups, of which 61 genes were commonly up-regulated (Figure 1c). Therefore, we decided to focus on all of these up-regulated DEGs for follow-up analysis. The most significant features of GO enrichment analysis are shown in Figure 1d, including nuclear division, chromosome segregation, and organelle fission. By KEGG enrichment analysis, up-regulated DEGs were enriched in cell cycle and metabolism of xenobiotics by cytochrome P450 signaling pathways (Figure 1e). Therefore, the overall function of these DEGs seems to be related to tumor development.

Differential gene expression profiles with stromal/immune scores and protein–protein interaction (PPI) networks in HCC cases. (a) Heatmap of the differentially expressed genes (DEGs) in the low vs. high immune score groups. (Fold change > 1.5, P < 0.05). (b) Heatmap of the DEGs in the low vs. high stromal score groups. (Fold change > 1.5, P < 0.05). (c) Venn diagrams of upregulated DEGs in both the stromal and immune score groups. (d) Gene Ontology (GO) enrichment analysis of 546 DEGs (The cutoff value was set as P and q < 0.05). (e) Kyoto Encyclopedia of Genes and Genomes (KEGG) enrichment analysis of 546 DEGs (P and q < 0.05). (f) Protein–protein interaction (PPI) networks of the cyclin-dependent kinase 1 (CDK1) module. (g) PPI networks of the anti-silencing function 1B histone chaperone (ASF1B) module. The heatmaps was constructed by ClustVis. The enrichment analyses were produced by R language with the packages of enrichplot. The PPI networks were constructed using Cytoscape. The size of nodes reflects the number of interacting proteins with the designated ones. The edge width indicates the combined scores obtained from STRING.
Correlation between individual DEG expression and RFS with univariate Cox regression
To further screen the DEGs related to RFS, a Cox proportional hazards regression model was generated. Among the 546 up-regulated genes, 127 were shown to be significantly associated with poor prognosis (P < 0.05) (Appendix).
We replicated the analysis in microarray dataset GSE54236 of 81 HCC cases from the GEO database. 18 A total of 117 DEGs could be obtained from the dataset. By establishing the Cox proportional hazards regression model, 93 DEGs were confirmed to be significantly related to survival time and 98 were significantly correlated with tumor doubling time. After summarizing the above data, 103 genes were found to be involved in both groups, and the two groups almost completely coincided. The above results further suggest the accuracy of the DEG screening.
PPI network construction among genes with preliminary prognostic value and module analysis with multivariate Cox regression
To better illustrate the interaction among RFS-related DEGs, we constructed PPI networks with STRING and Cytoscape (Figure 1f,g). After excluding the isolated nodes, a network of DEGs was established composed of two modules, including 80 nodes and 1343 edges. Both modules were selected for further analysis and named as CDK1 and ASF1B. The CDK1 module (Figure 1f) was formed by 796 edges and 42 nodes, among which all factors had identical MCODE scores of more than 25 points. CDK1, CCNB2, CCNB1, and CDC20 were defined as the remarkable nodes, for they had the highest relevance degree. In the ASF1B module (Figure 1g), 12 DEGs were included.
The nodes in both modules were added to the multivariate Cox regression model together with significant clinical pathological factors including BMI, MVI, surgical method, tumor grade, and stage. Statistical results suggested that CCNB1, DNA topoisomerase II alpha (TOP2A), ubiquitin conjugating enzyme E2 (UBE2C), and ZW10 interacting kinetochore protein (ZWINT) could be used as independent prognostic genes of RFS in the CDK1 module (Table 4). In the ASF1B module, only ERCC excision repair 6 like, spindle assembly checkpoint helicase (ERCC6L) was regarded as an independent prognostic factor.
Multivariate Cox regression analysis for various potential differentially expressed genes (DEGs) and prognostic characteristics of recurrence-free survival (RFS) in hepatocellular carcinoma (HCC) cases.

Correlation of CCNB1 expression with survival and clinicopathological factors of HCC patients
Because our findings revealed that CCNB1 had the highest degree of relevance, we moved forward with this gene as our research focus. All HCC samples were divided into high and low expression groups according to the median expression level of CCNB1. Wilcoxon rank sum tests indicated that CCNB1 expression was significantly higher in HCC tumor samples than in normal tissues (Figure 2a). An accordant result was obtained in paired analysis (Figure 2b). Survival analysis revealed that RFS and overall survival (OS) of cases with high CCNB1 expression were significantly lower than those of the low expression cases (Figure 2c,d). In particular, the expression of CCNB1 was related to grade, stage, and BMI (Figures 2e–g). These results strongly suggested that CCNB1 expression was negatively correlated with HCC prognosis.
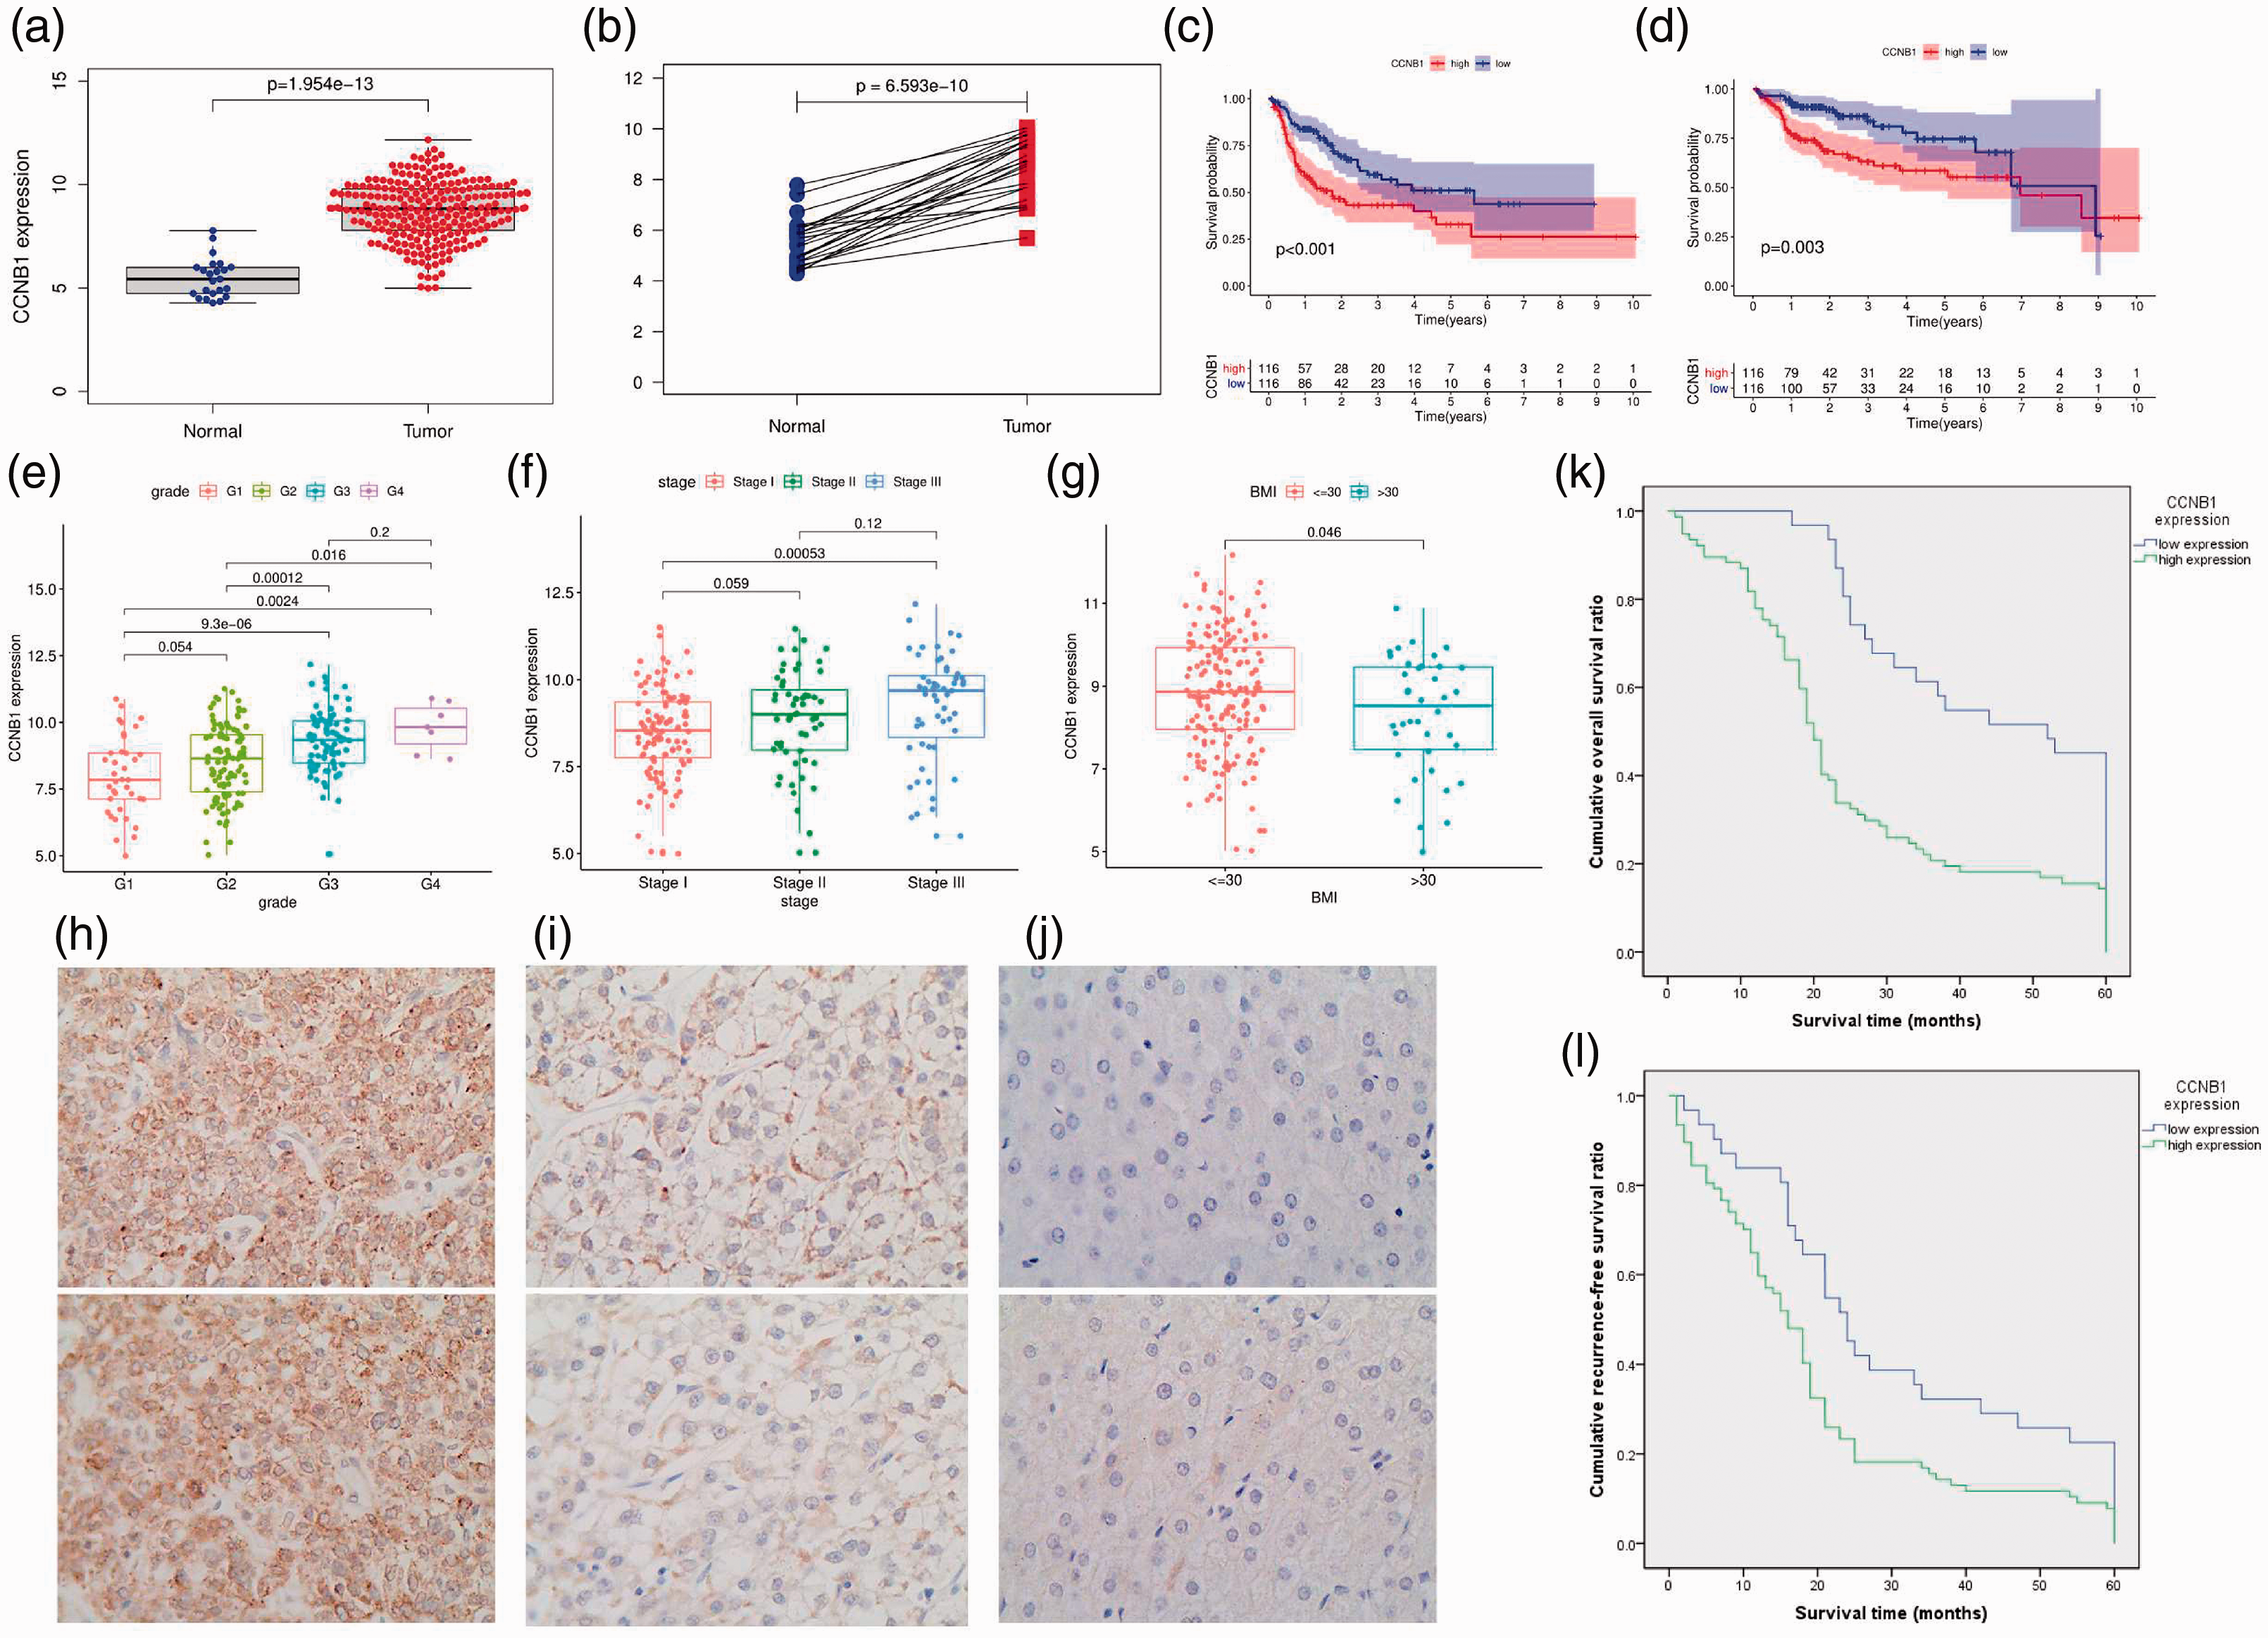
Cyclin B1 (CCNB1) is highly expressed in hepatocellular carcinoma (HCC) and suggests poor prognosis. (a) Differential expression of cyclin B1 (CCNB1) in normal liver and hepatocellular carcinoma (HCC) cases (P < 0.001). (b) Paired analysis of CCNB1 expression in normal and tumor samples of the same patients (P < 0.001). (c) Recurrence-free survival (RFS) (P < 0.001) and (d) overall survival (OS) analysis of the high vs. low CCNB1 expression groups (P < 0.001). (e) The relationship of CCNB1 expression and HCC grade. (f) The correlation of CCNB1 expression with tumor stage. (g) The correlation of CCNB1 expression with body mass index (BMI). (h) High expression of CCNB1 in HCC. (i) Low expression of CCNB1 in HCC. (j) Negative expression of CCNB1 in normal liver tissues. (k) OS and (l) RFS of HCC patients with high and low CCNB1 expression. The figures were produced by SPSS and R language with the packages of cluster Profiler and ggplot2.
To further verify our observations, immunohistochemistry (IHC) assays were used to investigate the expression of CCNB1 in clinical HCC samples and liver tissues. As shown in Figure 2h–j, CCNB1 expression was negative or extremely low in normal liver tissues, but upregulated in HCC slices. A correlation analysis exhibited the associations between CCNB1 expression and clinicopathological variables (Table 5), which demonstrated that high CCNB1 expression was associated with Hepatitis B surface antigen (HBsAg) (P = 0.043), MVI (P = 0.047), cirrhosis (P = 0.037), tumor differentiation (P = 0.001), and TNM stage (P = 0.035). Kaplan–Meier analysis showed that CCNB1 overexpression was associated with shorter OS (P < 0.001) and RFS (P < 0.001) (Figure 2k,l). The multivariate Cox regression analysis further indicated that high expression of CCNB1 could serve as an independent prognostic factor for OS (hazard ratio [HR] = 1.942, 95% confidence interval [CI] = 1.262–2.990, P = 0.003, Table 6) and RFS (HR = 1.609, 95% CI = 1.048–2.471, P = 0.030, Table 6).
Association between cyclin B1 (CCNB1) protein expression and hepatocellular carcinoma (HCC) clinicopathological characteristics in 108 patients.

CCNBI, cyclin B1; HBsAg, Hepatitis B surface antigen; MVI, microvascular invasion; BMI, body mass index.
Multivariate Cox regression analysis for various potential prognostic characteristics of overall survival (OS) and recurrence-free survival (RFS) in 108 hepatocellular carcinoma (HCC) patients.

CI, confidence interval; BMI, body mass index; MVI, microvascular invasion; CCNB1, cyclin B1.
CCNB1 knockdown inhibits the proliferation, invasion, and migration of HCC cells
A specific CCNB1 siRNA was transfected into HCC cell lines (Huh7 and HepG2), then CCNB1 protein expression levels were examined by immunofluorescence 72 hours after transfection (Figure 3a). Wound migration and Transwell experiments indicated that the migration ability of HCC cells with CCNB1 expression knocked down was significantly decreased (Figure 3b,d). CCK-8 experiments showed that CCNB1 siRNA transfection also significantly reduced the growth rates of Huh7 and HepG2 cells (Figure 3c). These data suggest that CCNB1 gene knockdown can inhibit the proliferation, invasion, and migration of HCC cells.
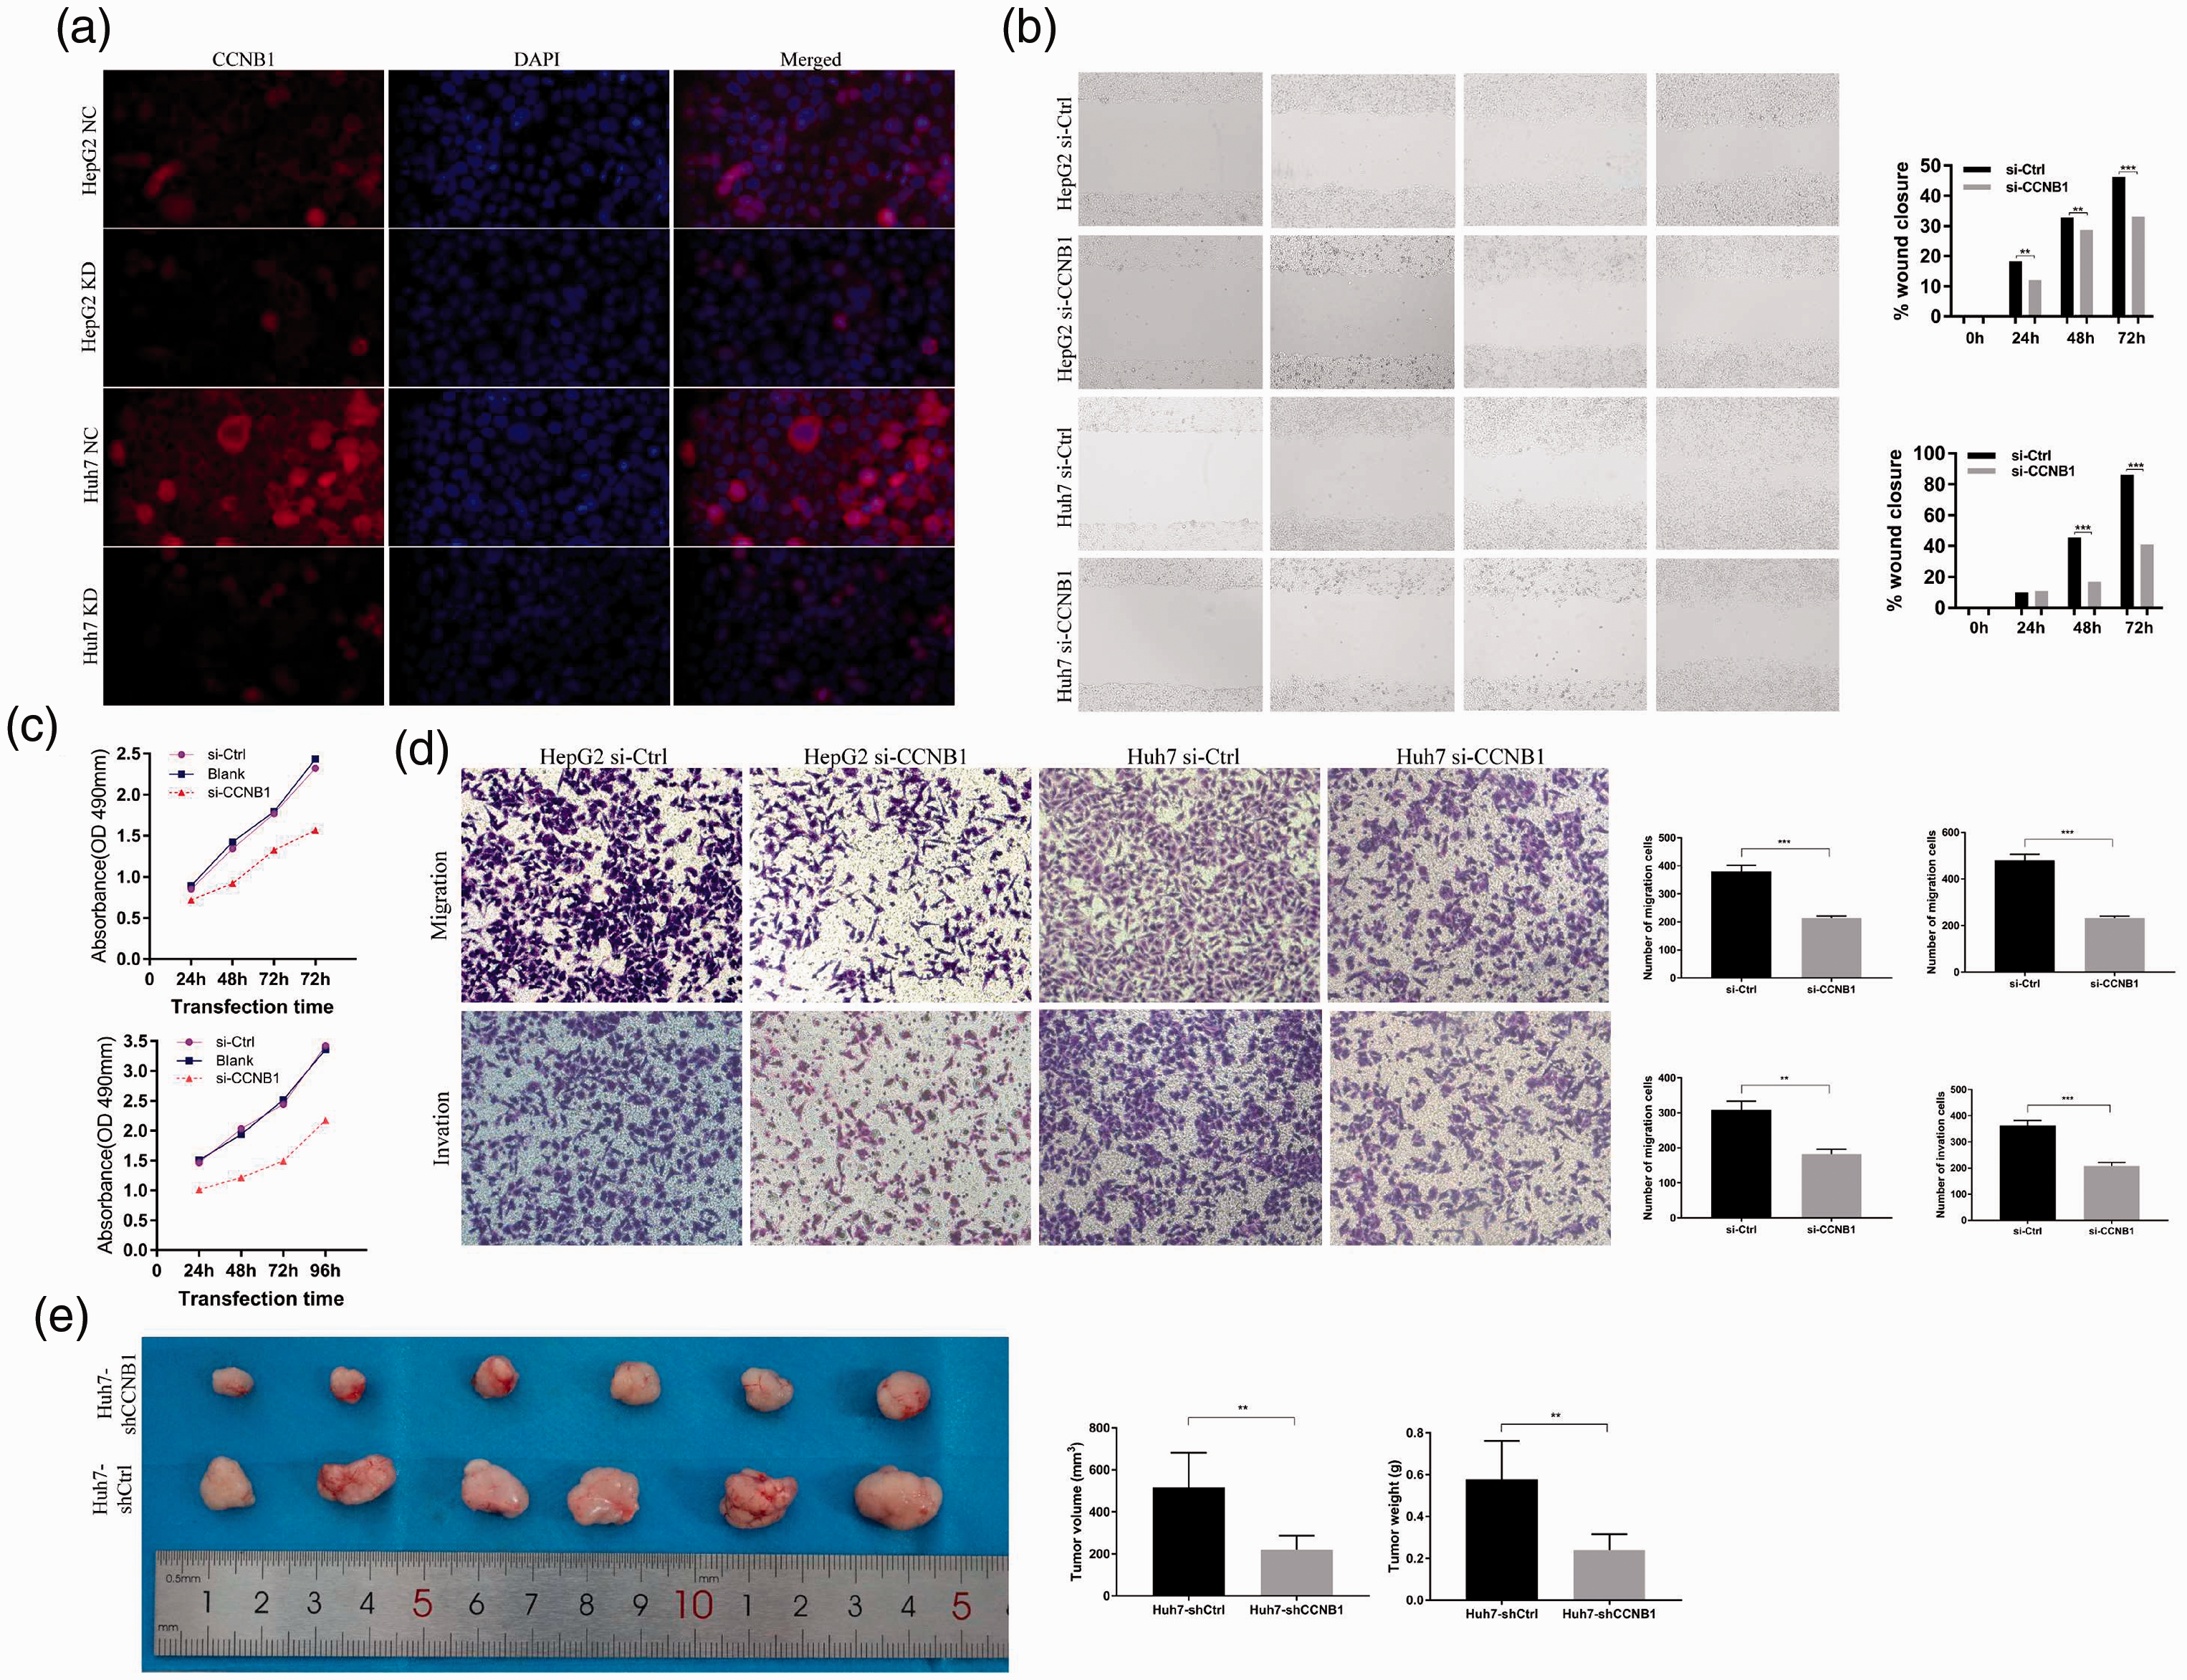
Cyclin B1 (CCNB1) knockdown inhibits the proliferation, invasion, and migration of hepatocellular carcinoma (HCC) cells in vitro and in vivo. (a) The transfection efficiency of small interfering RNAs (siRNAs) in HepG2 and Huh7 cells. (b) Wound-healing assays indicate that silencing of cyclin B1 (CCNB1) can inhibit HepG2 and Huh7 cell migration. (c) Cell proliferation was determined by Cell Counting Kit (CCK)-8 assays and detected at 24, 48, 72, and 96 hours after siRNA transfection. (d) Transwell experiments demonstrate that knockdown of CCNB1 can significantly reduce the migratory and invasive abilities of hepatocellular carcinoma (HCC) cells. (e) The Huh7-shCCNB1 and Huh7-shCtrl cells were subcutaneously inoculated into the left-side axilla of BALB/c nude mice (n = 6/group). Data points are presented as the mean ± standard deviation (SD) for tumor volume and weight. The graph was generated using GraphPad Prism.
For in vivo experiments, the Huh7-sh CCNB1 and Huh7-shCtrl cells were subcutaneously inoculated into BALB/c nude mice. The average volume and weight of Huh7-sh CCNB1 tumors were markedly lower than those of Huh7-shCtrl tumors (P < 0.01) (Figure 3e). These results indicate that CCNB1 expression exerted a growth-promoting function in HCC.
CCNB1 is a potential biomarker of TME conversion
To further explore the potential role of CCNB1 in the HCC TME, GSEA was performed on the high and low CCNB1 expression groups. In the C7 gene set collection defined by MSigDB, the CCNB1 high expression group was enriched in multiple immunologic and immune functional gene sets (Figure 4a). With GO, KEGG, and HALLMARK enrichment analyses, the gene sets in the high CCNB1 expression group were mainly enriched in cell cycle, DNA replication, and the P53 signaling pathway (Figure 4b–d). However, only one gene set was enriched in the low CCNB1 expression group (Figure 4e). The above results indicate that CCNB1 is a potential biomarker of TME conversion.

Gene Set Enrichment Analysis (GSEA) for cases with high cyclin B1 (CCNB1) expression and the proportion and correlation analysis of tumor-infiltrating immune cells (TICs) in hepatocellular carcinoma (HCC) cases. (a) C7 collection enriched gene sets in the cyclin B1 (CCNB1) overexpression group (Gene sets with nominal (NOM) P < 0.05 and FDR q < 0.05 were considered to be significant. The top 10 gene sets are shown in the map). (b) Gene Ontology (GO) collection-enriched gene sets in the CCNB1 overexpression group. (c) Kyoto Encyclopedia of Genes and Genomes (KEGG) collection-enriched gene sets in the CCNB1 overexpression group. (d) HALLMARK collection-enriched gene sets in the CCNB1 overexpression group. (e) The HALLMARK collection-enriched gene set in the low CCNB1 expression group. (f) The interrelationship among 22 types of tumor-infiltrating immune cells (TICs) (Pearson coefficient test). Each number represents the correlation P-value between every two types of immune cells. The color depth indicates the corresponding correlation value between two types of cells. (g) The proportion of 22 TICs in HCC cases. The figures were generated using Gene Set Enrichment Analysis (GSEA) and R language.
The relevance between CCNB1 and TIC proportions
A map of 22 immune cell types in HCC samples was constructed using the CIBERSORT computational method (Figure 4f,g). The correlation and difference analysis showed that there were nine types of TICs related to CCNB1 expression (Figure 5). Among them, CCNB1 was positively correlated with regulatory T cells (Tregs), follicular helper T cells, CD8+ T cells, CD4+ activated memory T cells, M0 macrophages, but negatively correlated with CD4+ naïve T cells, resting natural killer (NK) cells, resting mast cells, and M2 macrophages. These results further demonstrate that CCNB1 levels can influence the immune activity of the HCC TME.

Relationship between tumor-infiltrating immune cell (TIC) proportions and cyclin B1 (CCNB1) expression. (a) The proportion differences of 22 types of immune cells in the high vs. low cyclin B1 (CCNB1) expression groups. (b) Tumor-infiltrating immune cells (TICs) related to CCNB1 expression (P < 0.05). (c) TICs correlated with CCNB1 expression codetermined by difference and correlation tests. The figures were generated using R language with the CIBERSORT calculation method.
Discussion
HCC is a common and lethal malignancy that is often diagnosed at an advanced stage. High genetic heterogeneity was once considered the main cause of treatment failure. 19 However, accumulating evidence has shown that HCC invasion and metastasis are the results of the co-evolution of cancer cells and microenvironment. 20
In solid tumors, the cancer cells are wrapped in an intricate mixture of nontumorous cells and matrix components that are denominated as the TME. The TME is essential for tumor formation and progression, including angiogenesis and metastasis. Moreover, it has been shown to influence the effectiveness of anti-tumor therapies. Hence, lucubrating the tumor stroma would improve the curative effect of current treatment methods and provide new opportunities for therapeutic targeting.21,22 Recent work has suggested that boosting the number of neutrophils induced by administering granulocyte colony stimulating factor (G-CSF) would lead to increased tumor aggressiveness. 23 In coculture experiments, macrophages reduced the sensitivity of cancer cells to doxorubicin, etoposide, paclitaxel, and cisplatin, which was achieved by producing signal transducer and activator of transcription 3 (STAT3), inflammatory modulators, 24 cathepsin B, 25 and exosomes, 26 respectively. During chemotherapy, DNA damage in stromal cells, especially endothelial cells, increases the activity of NF-kB and numerous cytokines that protect tumor cells from DNA damage. 27 In addition, fibroblasts and extracellular matrix increase the tumor interstitial pressure, thus reducing the effect of the chemotherapeutic agent. 28 During radiotherapy, fibroblasts are activated to synthesize a mass of collagens and arrange into dense fibrous tissue, which promotes cancer cell survival through the integrin signaling pathway. 29 Similar to cytotoxic drugs, radiation-induced DNA damage leads to fibroblast senescence and promotes the synthesis of a secretome containing high levels of transforming growth factor (TGF)-β, vascular endothelial growth factor (VEGF)-A, and various cytokines. 30 Furthermore, the immunosuppressive effects of TGF-β reduces the CD8-mediated killing effect on tumor cells. 31 Thus, the TME has been shown to modulate the response to anti-tumor therapies. Additionally, lucubrating the TME may improve the efficacy of current therapies and provide new opportunities for therapeutic targeting.
In this study, we provide data suggesting that the immune and stromal scores calculated by the ESTIMATE algorithm are correlated with clinicopathological factors in HCC. Lower stromal and immune scores are associated with worse prognosis. Based on this theoretical basis, we then extracted 546 genes involved in the TME, 127 of which were associated with RFS. In addition, we verified 103 genes in HCC cohort GSE54236. Using PPI networks, we confirmed that CCNB1 could be used as an independent prognostic factor for HCC.
CCNB1 is a key modulator of cell cycle regulation and has been shown to be overexpressed in several human cancers. 32 Song et al. demonstrated that CCNB1 promotes tumor invasion and metastasis by enhancing epithelial-mesenchymal transition (EMT). 33 Lu et al. confirmed that inhibiting CCNB1/CDK1 restores p53 function, suggesting that CCNB1 could promote tumorigenesis by impairing p53 function. 34 In addition, Ding et al. demonstrated that CCNB1 enhanced drug resistance in breast cancer hormone therapy. 35 High levels of CCNB1 indicated that the treatment would be ineffective, including tamoxifen and aromatase inhibitors. 36 Here, we began with analysis of HCC transcriptome data from TCGA database and clinical patients. We then confirmed that CCNB1 was significantly overexpressed in HCC tissues, and this up-regulation was associated with advanced clinicopathological features (including HBsAg, MVI, cirrhosis, tumor differentiation, and TNM stage) and poor prognosis. CCNB1 knockdown inhibited the proliferation, invasion, and migration of HCC cells both in vitro and in vivo. Therefore, CCNB1 has the potential to be a prognostic biomarker and therapeutic target for the HCC TME.
After further exploration of the correlation between CCNB1 expression and the TME, GSEA results revealed that, in addition to cell cycle-related signaling pathways, immune cell-related signaling pathways were also significantly enriched in the CCNB1 high-expression group, especially for T lymphocytes. However, only the adipogenesis pathway was enriched in the CCNB1 low-expression group. The abovementioned results suggest that CCNB1 may participate in the regulation of immune cell function and the status conversion of fat metabolism. Subsequence analysis on TICs corroborated this viewpoint. Our CIBERSORT analysis of TIC proportions showed that, along with the upregulation of CCNB1, M0 macrophages could undergo differentiation inhibition. Additionally, T cells showed abnormal activation with altered functions. These results supported that CCNB1 could promote HCC. However, a limitation of this study is the lack of further discussion regarding the regulatory role of CCNB1. Thus, the functional mechanisms of CCNB1 still require further experimental verification.
Conclusion
The interaction between HCC and the TME greatly affects tumor progression, therapeutic effects, and prognosis. In this work, we focused on the impact of microenvironment-related genes on RFS in HCC patients. Our results provide more data to unravel the complex interactions between HCC tumor cells and the TME. In summary, using the ESTIMATE algorithm-based scores, a gene list related to the TME was extracted. Some previously overlooked genes have the potential to become new tumor markers or therapeutic targets. CCNB1 is a potential prognostic factor and cancer promoter in HCC cases. In addition, CCNB1 may serve as a hub gene that regulates other DEGs, and could possibly be used as an indicator of TME state transition. Hence, further research should be conducted to clarify the relationship between CCNB1 expression and immune cell function.
Footnotes
Acknowledgment
We appreciate Dr. Yingjuan Xu’s help with this manuscript, as well as with guidance on data collection and processing.
Declaration of conflicting interest
The authors declare that there is no conflict of interest.
Funding
This research received no specific grant from any funding agency in the public, commercial, or not-for-profit sectors.