
Abstract
Introduction
Lung cancer (LC), the most common cause of cancer-related death worldwide, is a malignant tumor that can be pathologically divided into different subtypes, including small cell lung cancer (SCLC), lung adenocarcinoma (LUAD), lung squamous cell carcinoma (LUSC), and large cell carcinoma (LCC).1–3 At present, surgical resection is the most effective treatment for patients with early non-small cell lung cancer (NSCLC), and the 5-year survival rate can reach 30% - 60%. However, some patients have been diagnosed with local advanced stage and could not be resected due to the lack of timely and effective diagnostic means, resulting in a 5-year survival rate of 10% - 15%.4,5 Therefore, there is an urgent need to find effective biomarkers to assist in the diagnosis of LC.
Exosomes, 40–160 nm extracellular vehicles (EVs), 6 contain a variety of bioactive molecules such as nucleic acids, proteins and lipids, and are important players in intercellular communication.7,8 Additionally, exosomes also participate in many processes of tumor invasion, progression, metastasis and drug resistance, and have become a potential source of information for tumor detection and may be used as a tool for LC diagnosis, prognosis, and prediction.9–12 At present, there are only a few reports on the comprehensive analysis of the relationship between exosome related genes and the prognosis of SCLC. 13 However, the specific relationship between exosome related genes and different subtypes of LC has not been extensively studied, and the diagnostic and prognostic roles of exosome related genes in SCLC, LUAD, LUSC and LCC remain unclear.
Thus, this study focused on screening valuable diagnostic markers from differentially expressed genes (DEGs) in exosomes of SCLC, LUAD, LUSC or LCC by machine learning methods, and established prognostic models based on exosome-related differentially expressed genes (ExoDEGs). It is expected to provide new ideas for prognosis treatment and management of SCLC, LUAD, LUSC and LCC. Figure 1 shows the study's flow.
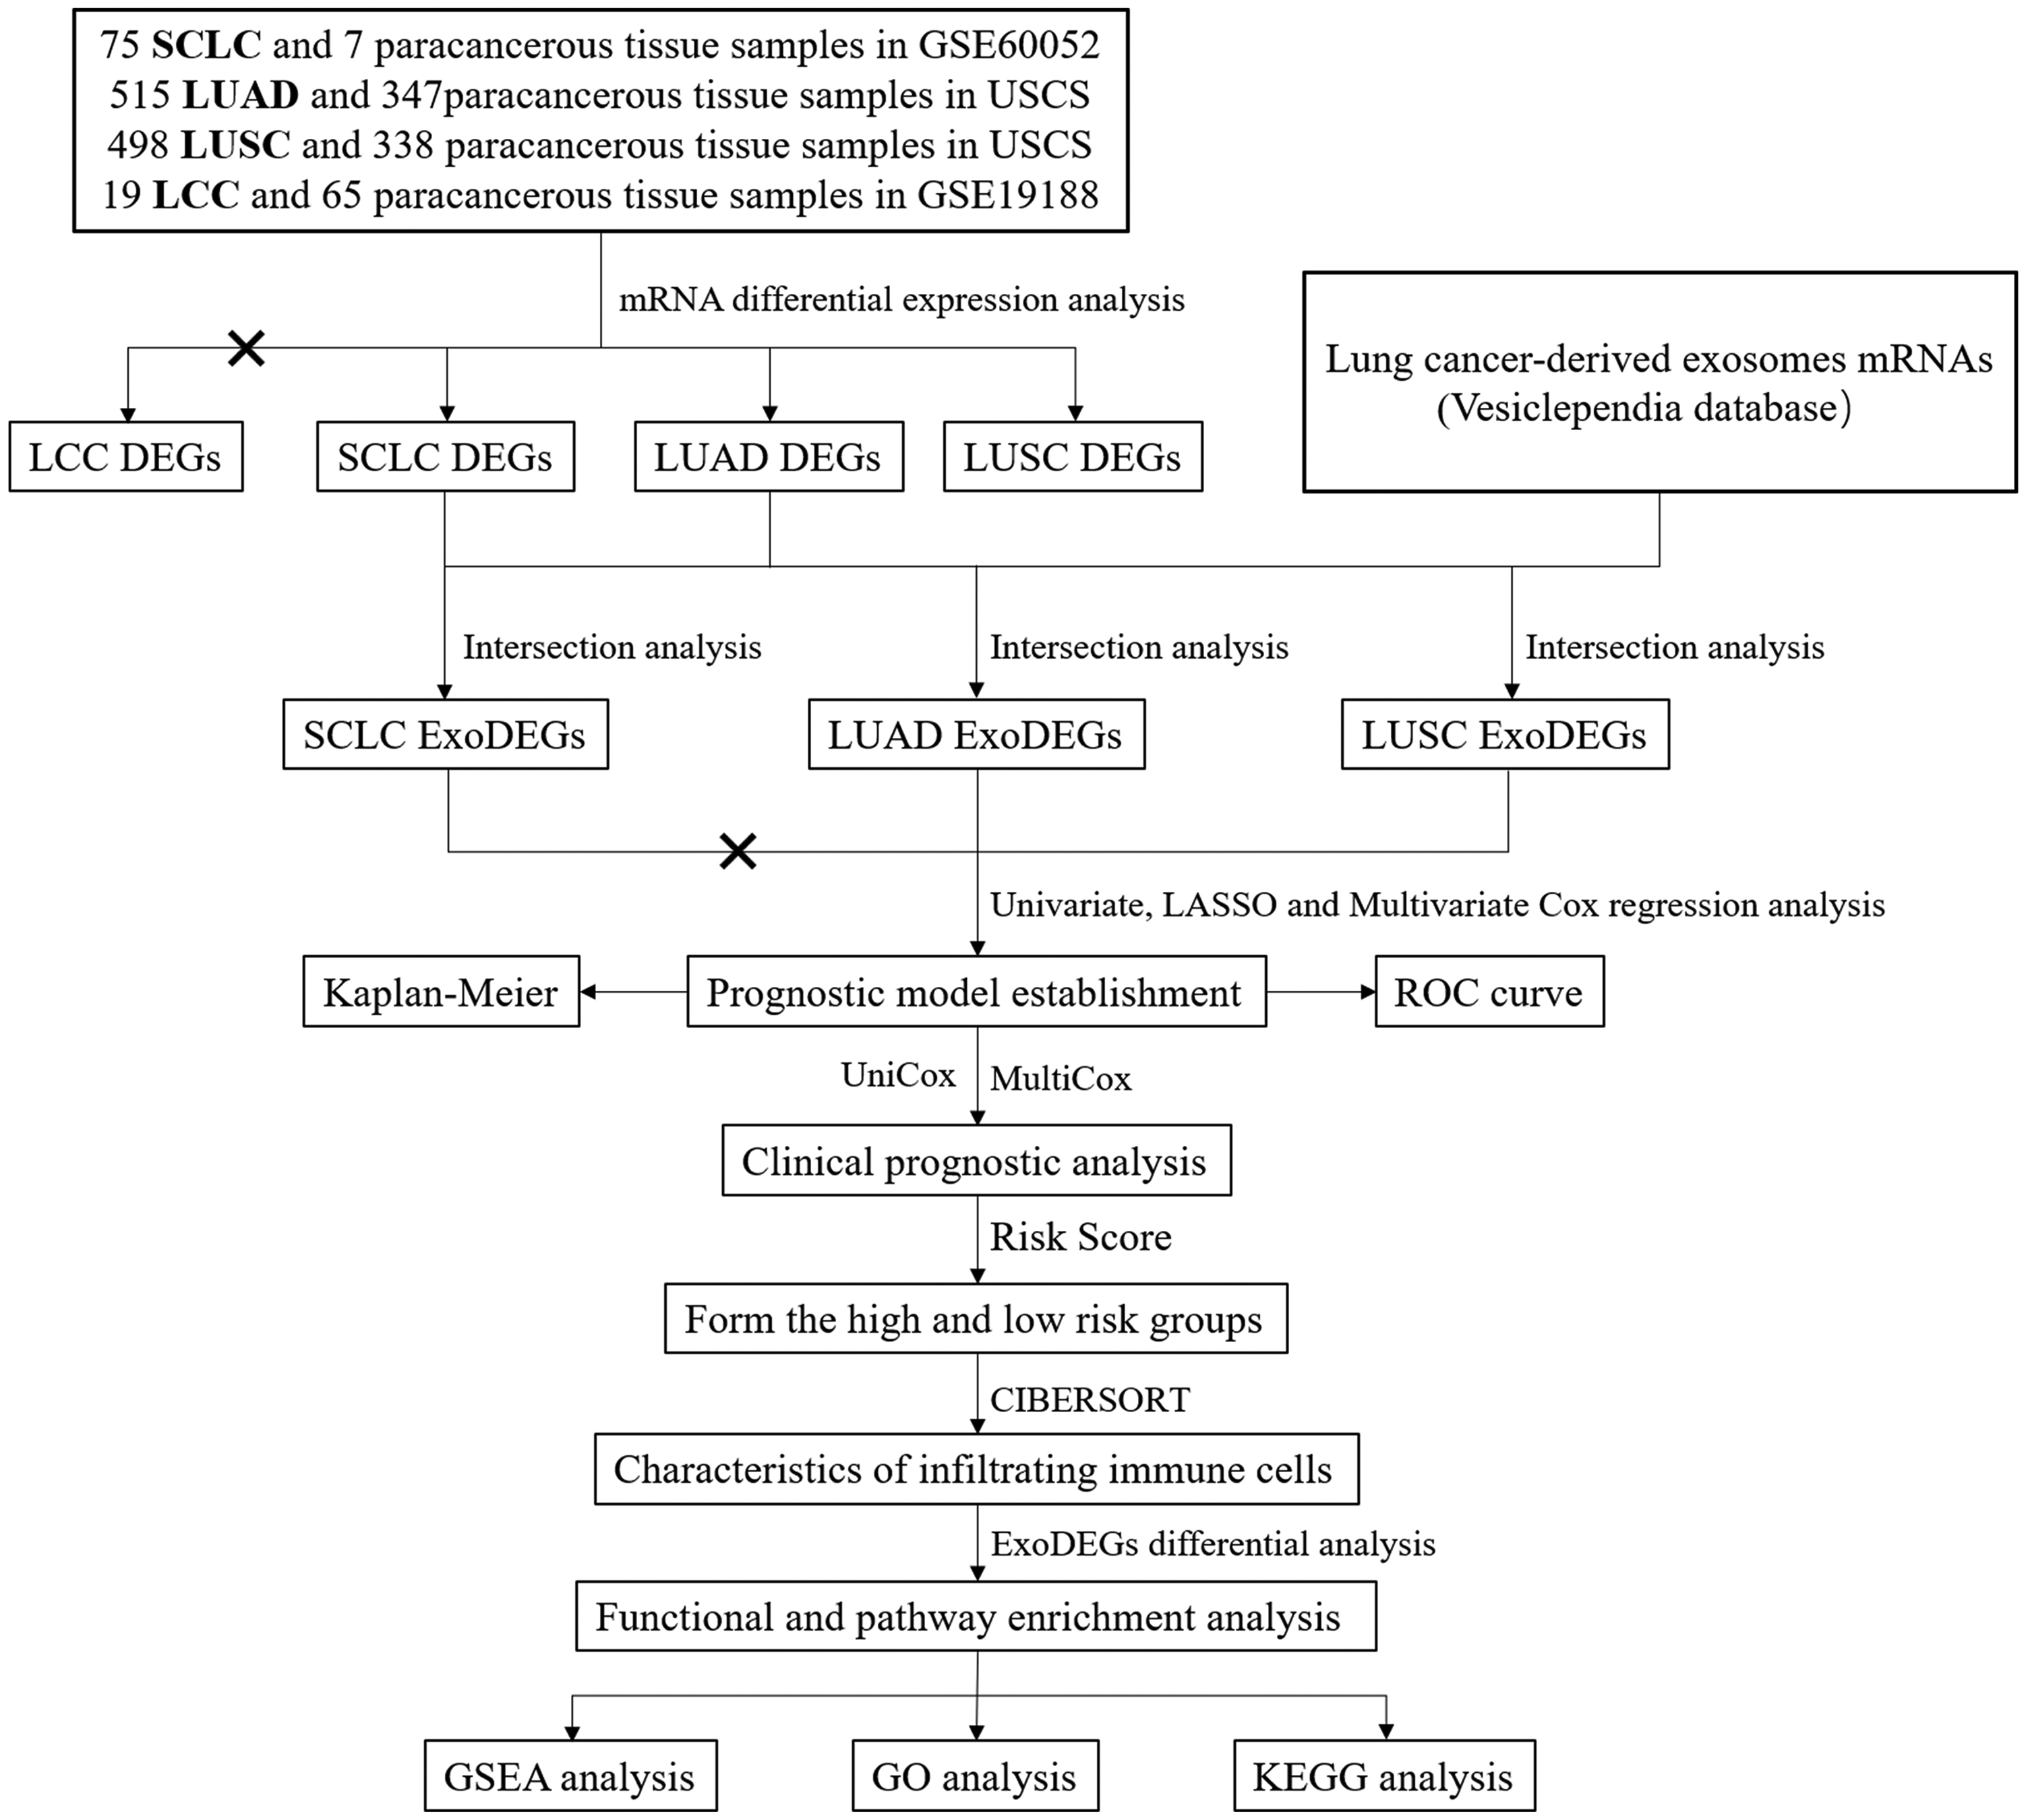
Flow chart.
Materials and methods
Data collection and processing
The mRNAs information regarding LC-derived exosomes was collected and arranged from “lung cancer cells” column of the Vesiclependia database (April 20, 2024. http://microvesicles.org/browse_results?org_name=&cont_type=&tissue=Lung%20cancer%20cells&gene_symbol=&ves_type=) (Supplementary Data S1). The mRNAs data of tumors and paracancerous tissues was obtained from the GEO database (https://www.ncbi.nlm.nih.gov/theGEO/) and UCSC database (https://xena.ucsc.edu/). From these sources, we obtained 75 SCLC samples and 7 paracancerous tissue samples, 515 LUAD samples and 347 paracancerous tissue samples, 498 LUSC samples and 338 paracancerous tissue samples, 19 LCC samples and 65 paracancerous tissue samples. However, only 48 SCLC, 484 LUAD and 482 LUSC patients had complete follow-up data. Unfortunately, the LCC samples were excluded from the analysis due to the absence of follow-up data.
Identification of ExoDEGs
The datasets obtained were standardized using transcript per kilobase of exon model per million mapped reads (TPM) method. Before screening for DEGs, undetectable mRNAs in 25% of the samples were removed. The R package “limma” was utilized to screen for DEGs in SCLC, LUAD, LUSC samples and corresponding paracancerous samples. The Wilcox test was employed for the differential analysis.14,15 The DEGs screening criteria were set at |log2-fold change| > 1 and false discovery rate (FDR) < 0.05. Then we obtained ExoDEGs through the intersection of the DEGs with LC-derived exosome genes.
Establishment of the prognostic model based on ExoDEGs
Univariate Cox regression analysis was used to evaluate the correlation between the each ExoDEGs and the corresponding patient survival, and ExoDEGs (P < 0.05) were selected for LASSO Cox regression analysis to assess prognostic related ExoDEGs. Then, multivariate Cox regression analysis was performed on the ExoDEGs screened by LASSO analysis and constructed risk prediction models. Patients were divided into two risk groups based on the median risk score. The Kaplan-Meier method was used to generate survival curves for two groups. Finally, ROC curve analysis was performed to assess the reliability of the prognostic models.
Independent prognostic analysis
We performed univariate Cox and multivariate Cox regression analysis to evaluate the independent prognostic of modal in combination with patient clinical features and risk score, and to assess the differences in risk scores among patients with different clinical features (age, sex and stage). 13
Analysis of infiltrating immune cells
We utilized the CIBERSORT algorithm to integrate annotated genomes of different immune cell for deconvolution, calculate the relative proportions of 22 types of immune cells, evaluate the differential expression of immune cells between high and low-risk groups, and analyze the characteristics of immune infiltration. P < 0.05 was considered significant difference.
Functional and pathway enrichment analysis
Differential ExoDEGs between high and low-risk groups were screened and compared with Hallmark Gene Sets in the Molecular Signatures Database (MSigDB), and then GSEA, GO and KEGG analysis and visualization of the differential ExoDEGs were performed using the R package “ClusterProfiler”.
Results
Identification of ExoDEGs in SCLC, LUAD and LUSC
We identified 5391 SCLC DEGs (Figure 2A), 4732 LUAD DEGs (Figure 2B) and 6232 LUSC DEGs (Figure 2C) between tumors samples and corresponding paracancerous tissues samples (Supplementary Data S2), respectively, and the FDR top 15 up-regulated DEGs and 15 down-regulated DEGs are shown as heatmaps (Figure 2D to F), PCA analysis results are shown in Figure S1. 1114 SCLC ExoDEGs, 1238 LUAD ExoDEGs and 1746 LUSC ExoDEGs are gathered through the intersection of above DEGs and LC-derived exosome genes (Figure 2G to I), shown in detail in Supplementary Data S3.
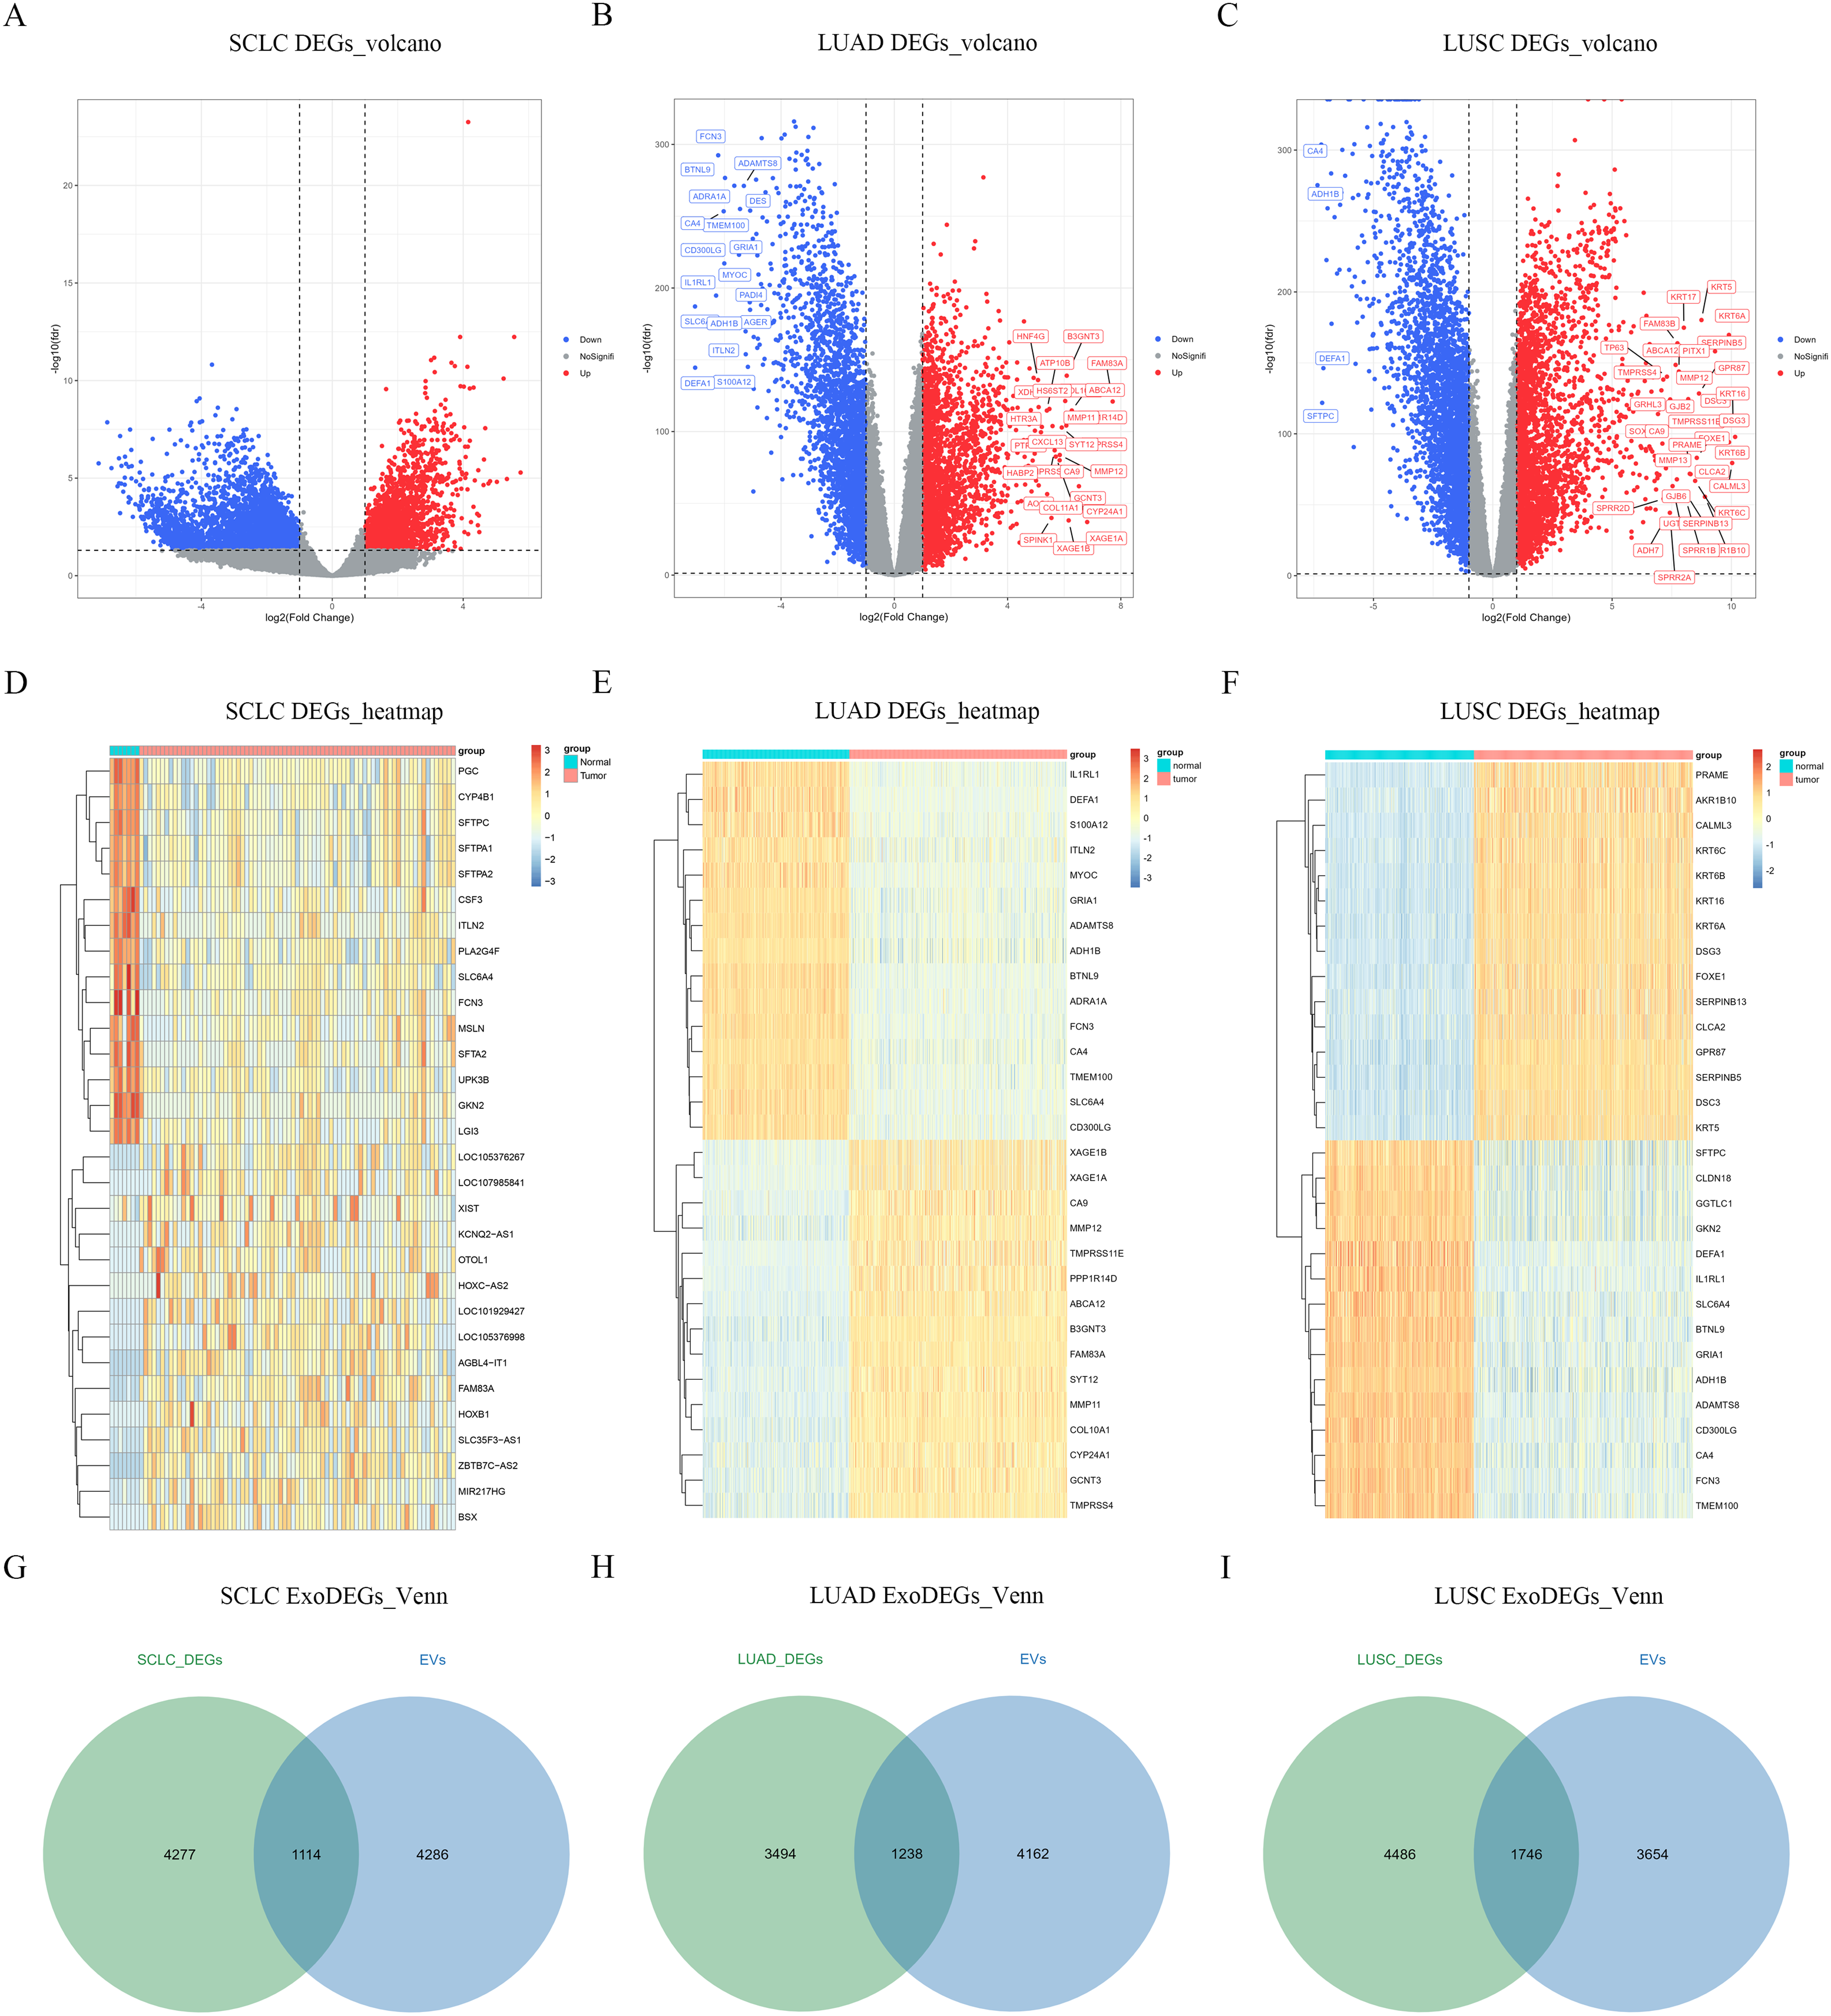
Identification of ExoDEGs. (A–C) Volcano plots of SCLC DEGs, LUAD DEGs and LUSC DEGs. (D–F) Heatmaps of SCLC DEGs, LUAD DEGs and LUSC DEGs. (G–I) The intersection of LC-derived exosome genes with SCLC DEGs, LUAD DEGs and LUSC DEGs.
Establishment of the prognostic model based on ExoDEGs
The above ExoDEGs was combined with the clinical follow-up data of 48 SCLC, 484 LUAD and 482 LUSC patients, respectively. Univariate Cox regression analysis and LASSO Cox regression analysis were used to screen for prognostic related ExoDEGs (Figure 3A to D). Unfortunately, there were few ExoDEGs associated with SCLC patient survival, so subsequent statistical analysis was not performed. Finally, we performed multivariate Cox regression analysis of ExoDEGs determined by LASSO Cox to establish a LUAD risk model composed of 12 ExoDEGs (CDH17, DAAM2, FKBP3, FLNC, GSTM2, PGAM4, HPCAL1, FERMT2, LYPD1, SNRNP70, KIR3DL2 and GPX3) (Figure 3E) and a LUSC risk model composed of 7 ExoDEGs (FGA, ERH, HID1, CSNK2A1, SLC7A5, ACOT7 and FUNDC1) (Figure 3F).
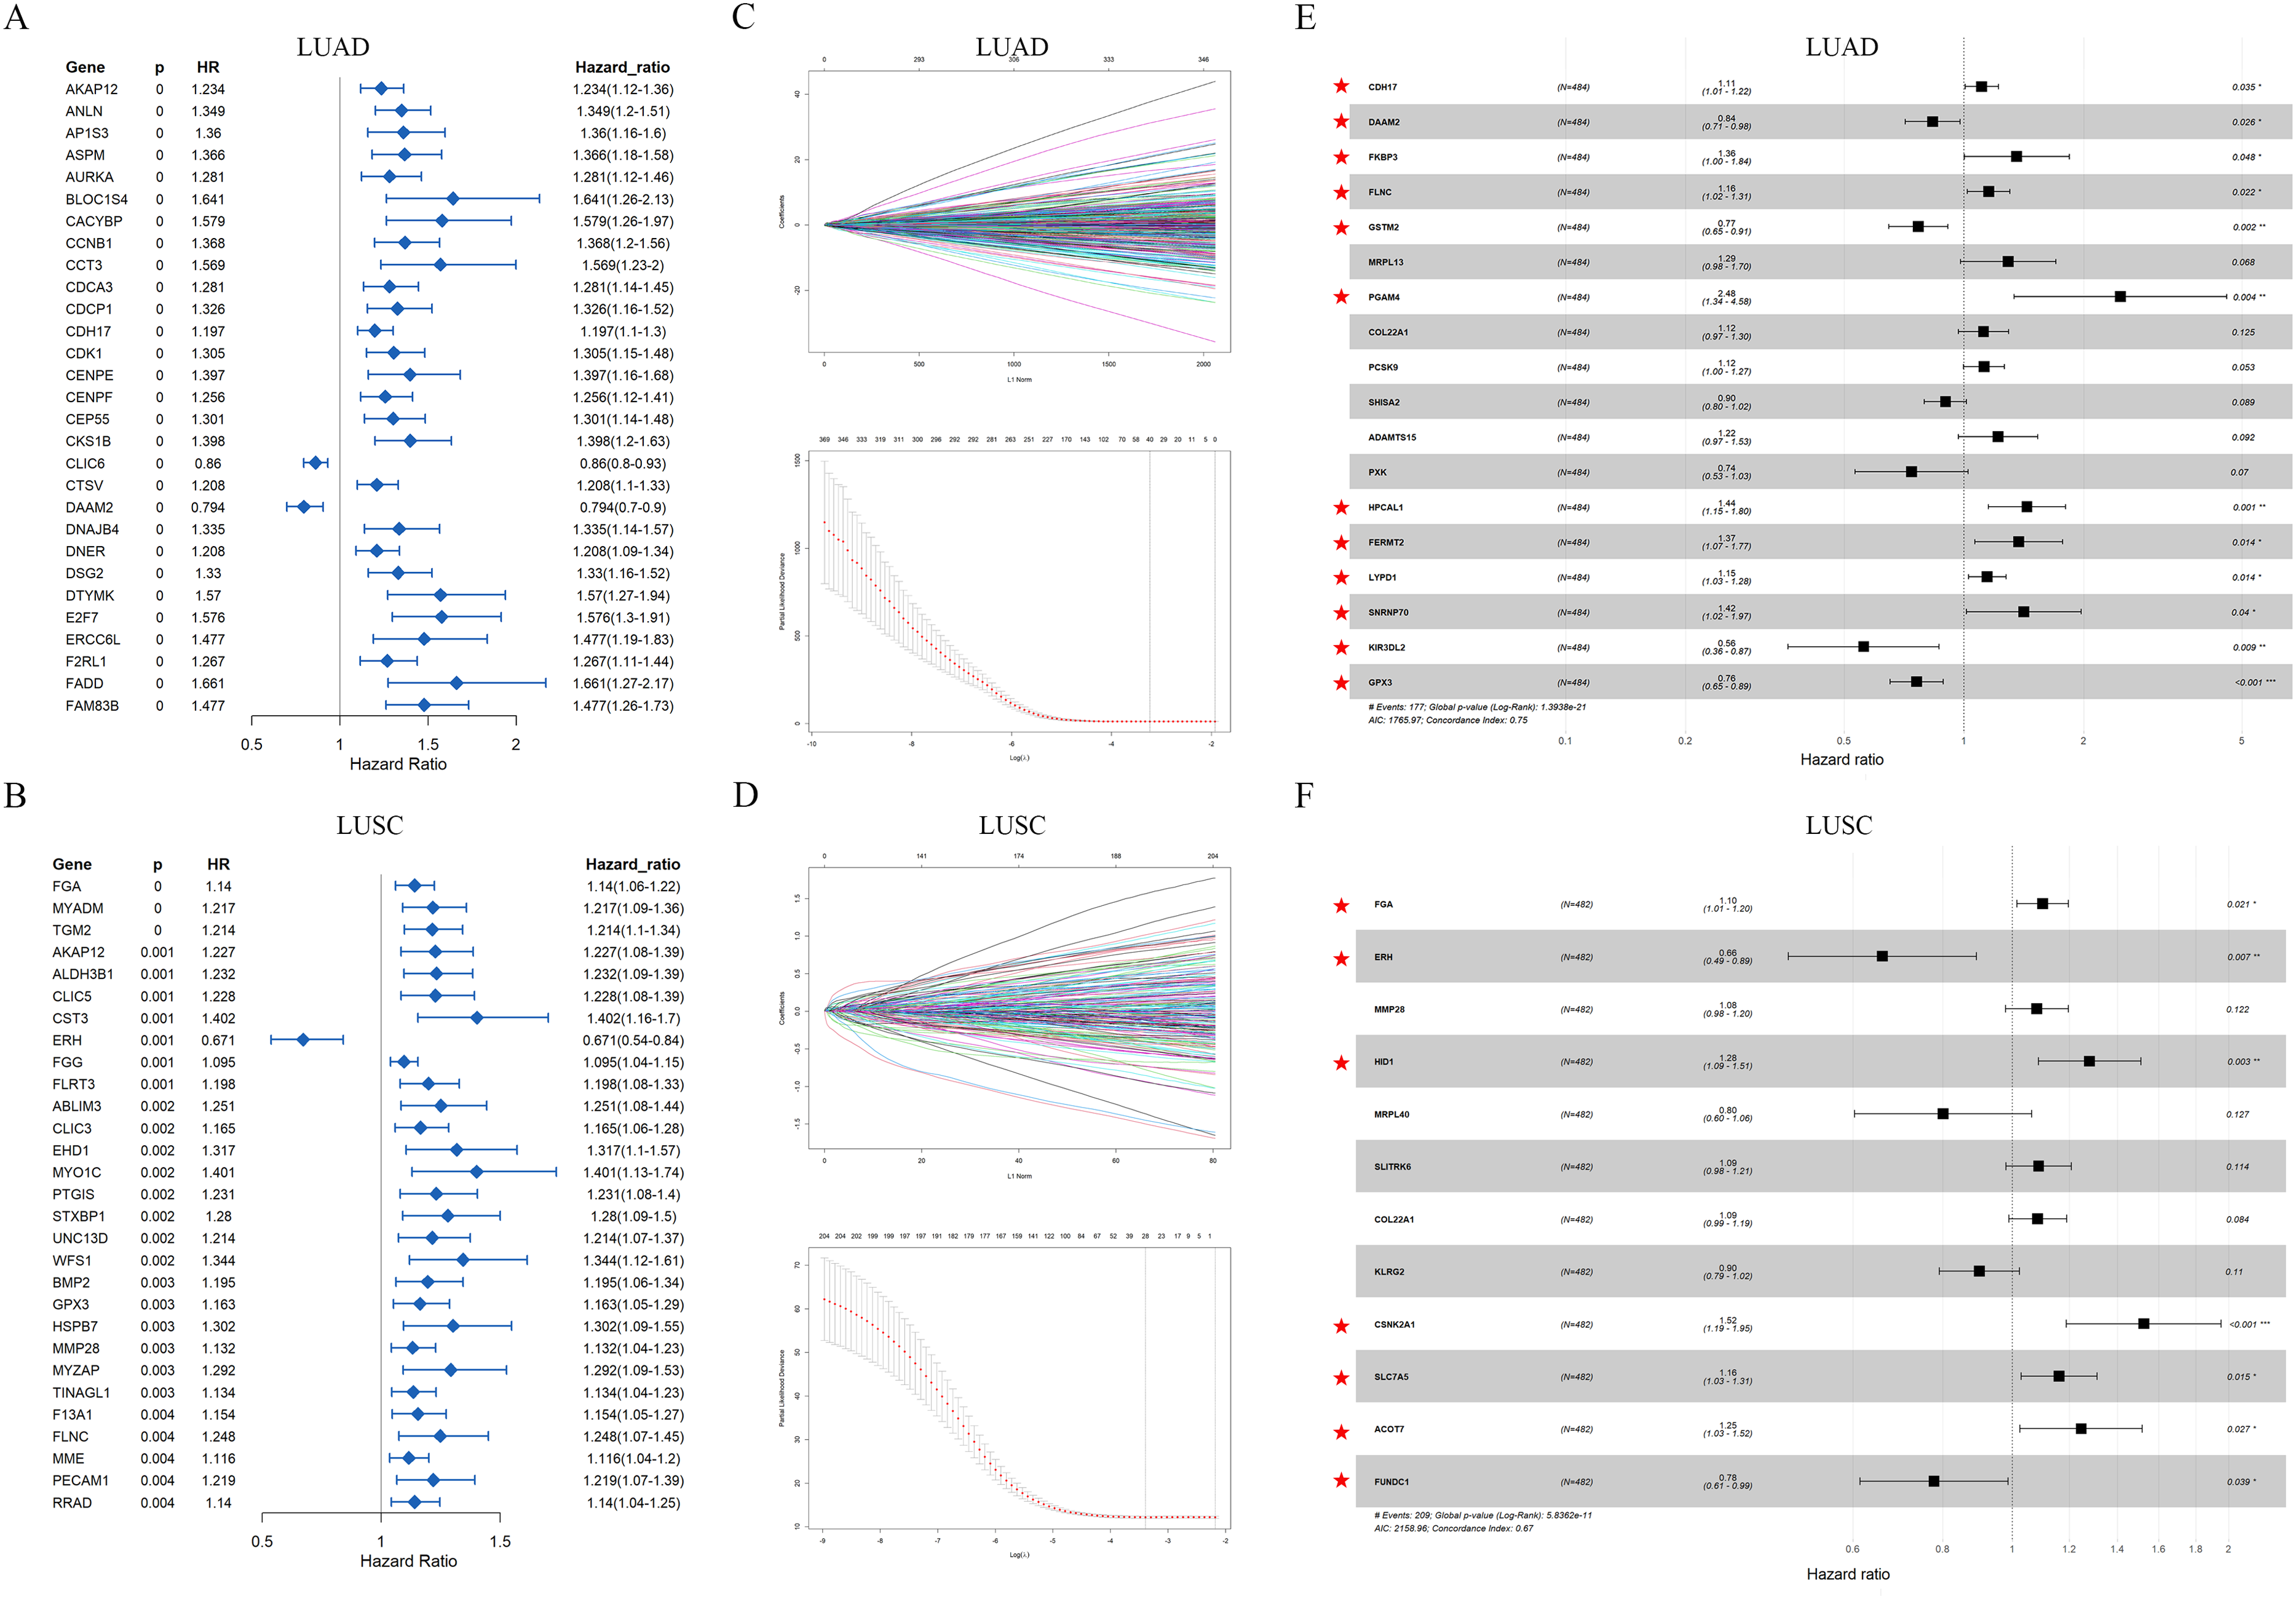
Establishment of the prognostic models based on ExoDEGs. (A–B) Univariate Cox regression analysis. (C–D) Cox regression analysis. (E–F) Multivariate Cox regression analysis. Red pentagram marks ExoDEGs to construct prognostic models.
We divided 484 LUAD patients into high or low-risk groups based on the median risk score, and found that patients in the high-risk group had higher mortality and shorter survival than patients in the low-risk group (Figure 4A to C). We then used ROC curve analysis to assess the reliability of the LUAD risk model, showing the AUC was 0.781 at 1 year, 0.797 at 3years, and 0.81 at 5 years (Figure 4D). Similarly, the risk assessment results of 482 LUSC patients were similar to those of LUAD (Figure 4E to G), and the AUC of LUSC risk model was 0.669 at 1 year, 0.748 at 3years, and 0.745 at 5 years (Figure 4H). In addition, we also verified the reliability of the model using external data, with promising results (Figure 4I).
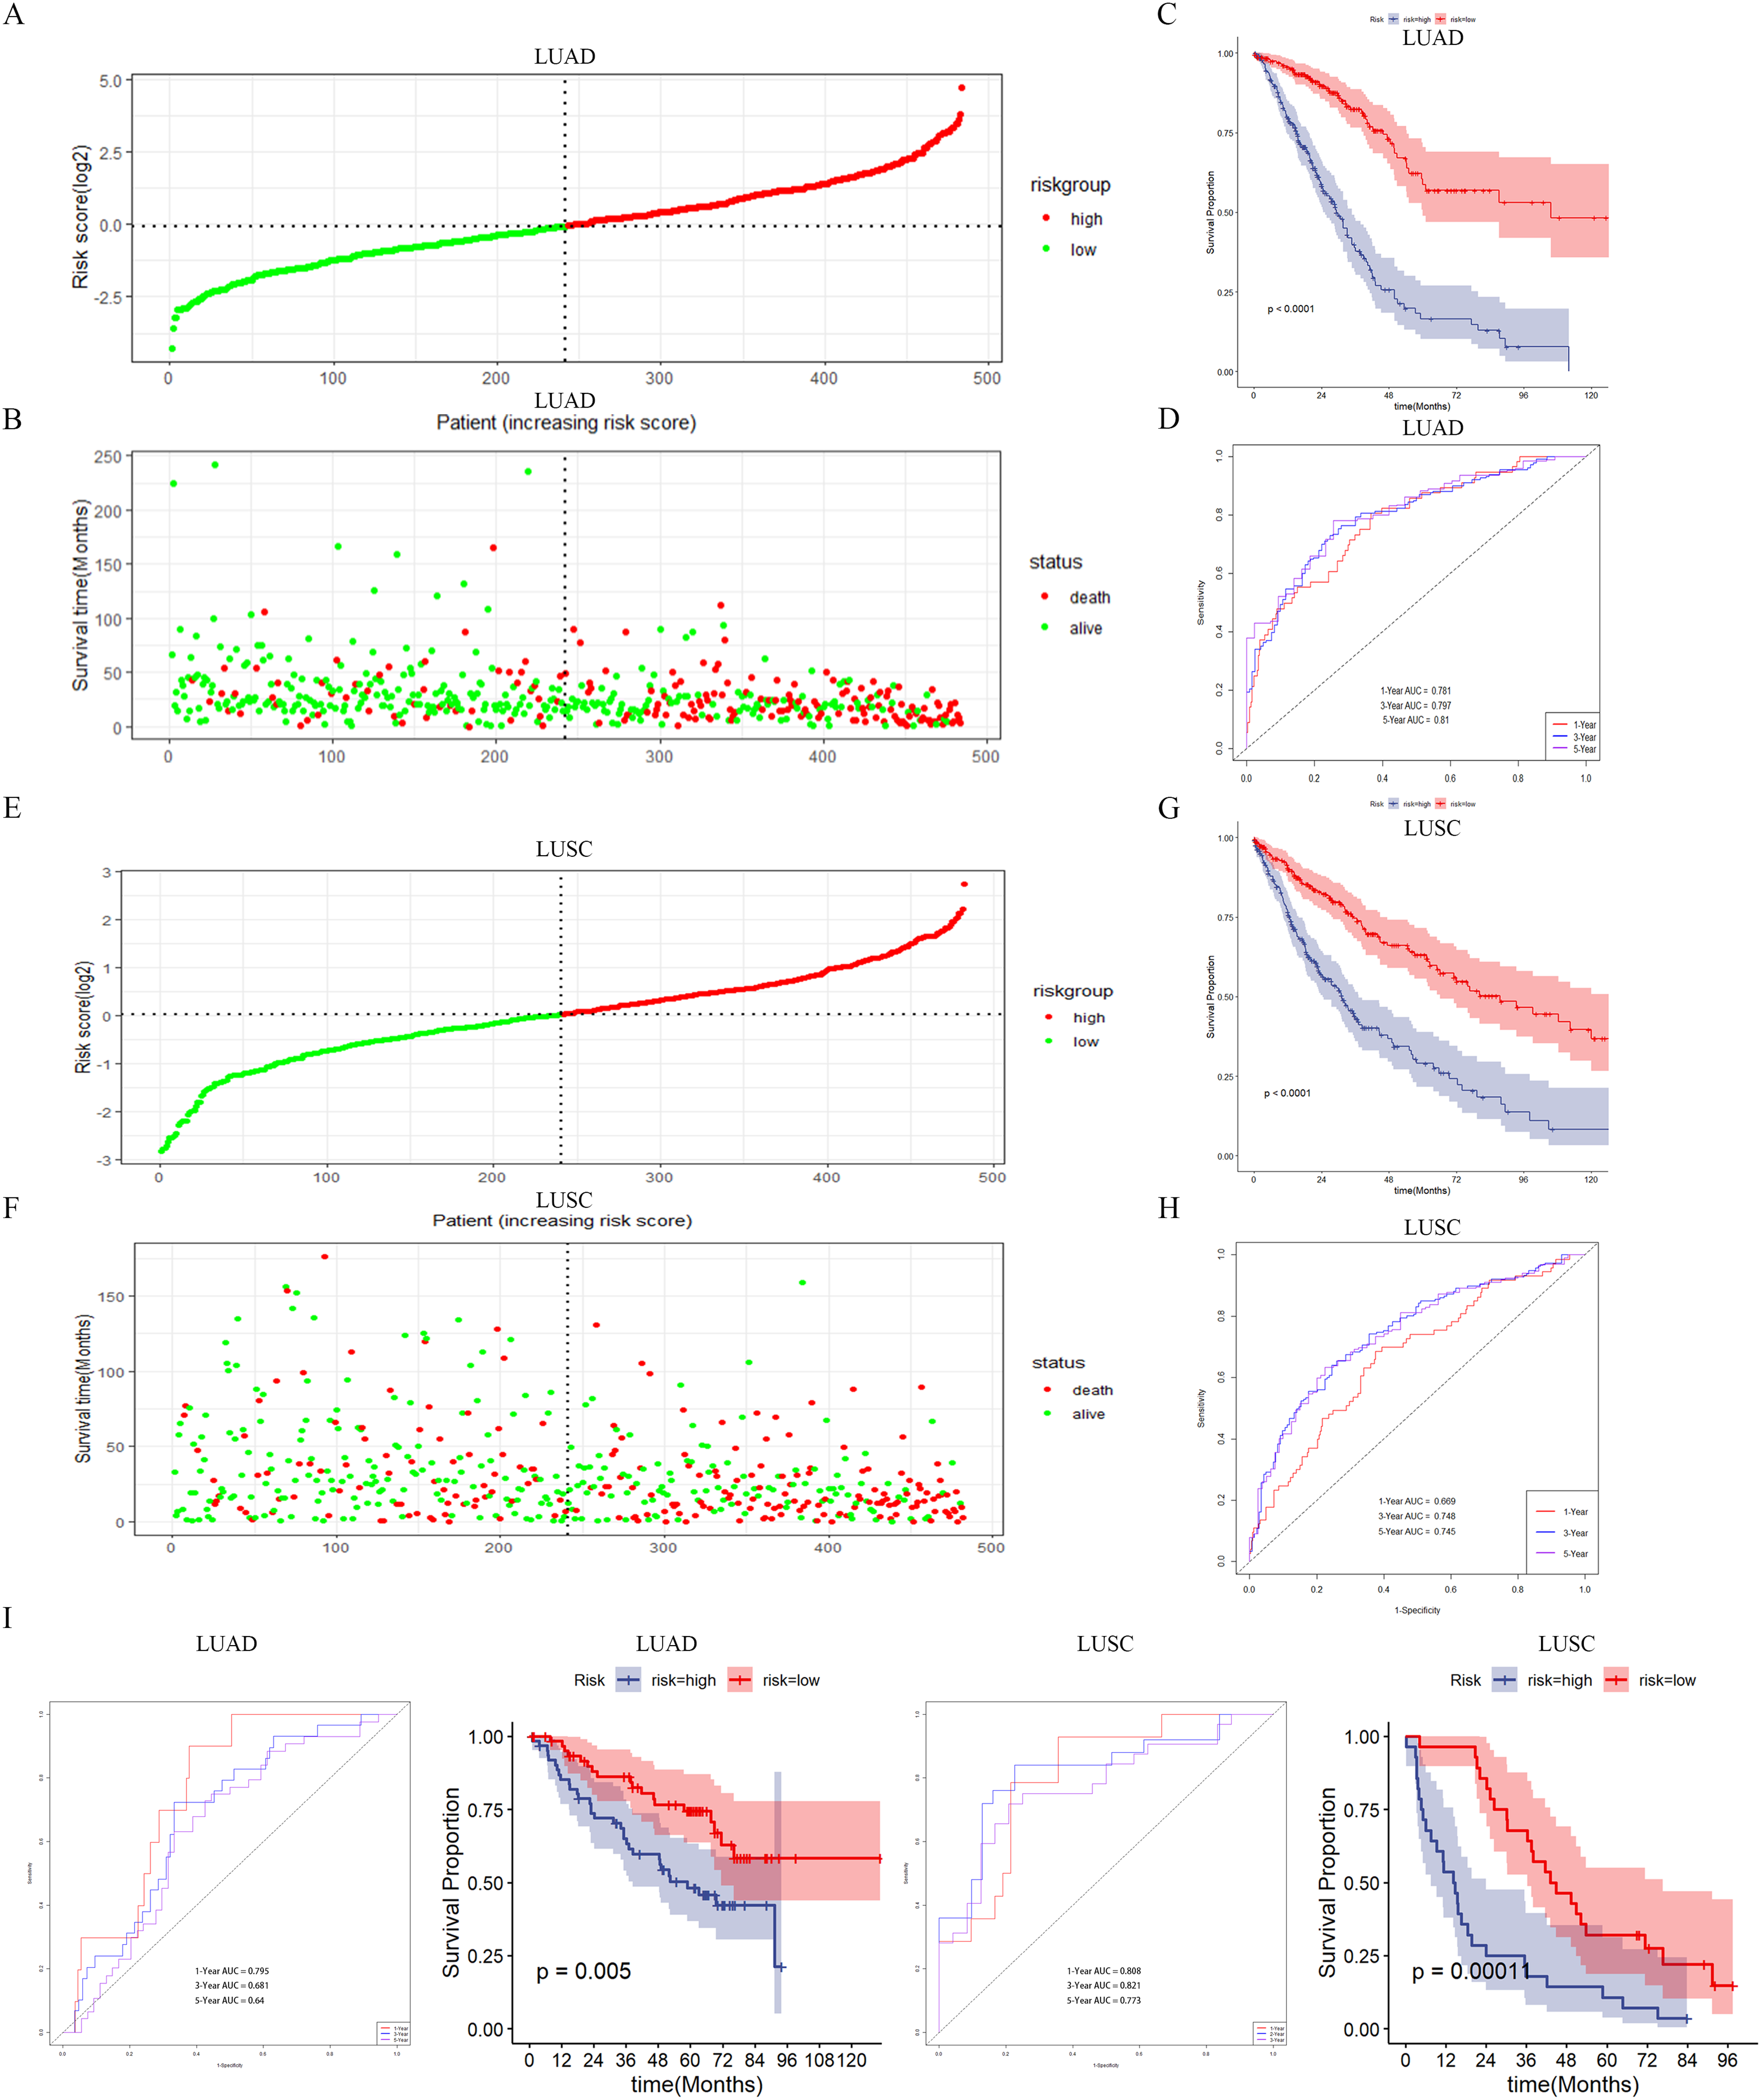
Gene expression and survival status assessment of patients in two risk groups. (A–B) Median risk score and survival time distribution of LUAD patients. (C) Kaplan-Meier analysis of LUAD high and low-risk groups. (D) ROC curve of LUAD risk model. (E–F) Median risk score and survival time distribution of LUSC patients. (G) Kaplan-Meier analysis of LUAD high and low-risk groups. (H) ROC curve of LUAD risk model. (I) Validation of the reliability of the risk model. LUAD selected the GSE50081 dataset for validation (the AUC of LUAD risk model was 0.795 at 1 year, 0.681 at 3years, and 0.64 at 5 years) and LUSC selected the GSE37745 dataset for validation (the AUC of LUSC risk model was 0.808 at 1 year, 0.821 at 3years, and 0.773 at 5 years).
Independent prognostic analysis
We integrated risk score and clinical data into univariate and multivariate Cox regression analysis, and the results showed that LUAD risk score was significantly correlated with patient survival (P < 0.001), suggesting that risk score has independent prognostic value and can be used as a prognostic indicator for LUAD (Figure 5A). To integrate age, sex, stage, and risk scores, we constructed a nomogram with a survival prediction C-index of 0.688 (P < 0.001) (Figure 5B). The 1-, 3- and 5-year calibration curves of the nomogram show that the predicted values are in good agreement with the actual observed results. (Figure 5C). Similarly, the risk score of LUSC patients can also be used as a prognostic indicator (Figure 5D), and the calibration curves (C-index:0.748, P < 0.001) show a good agreement between the predicted and observed values (Figure 5D to F). These results suggested that the LUAD or LUSC risk model has reliable predictive value for the prognosis of LUAD or LUSC.
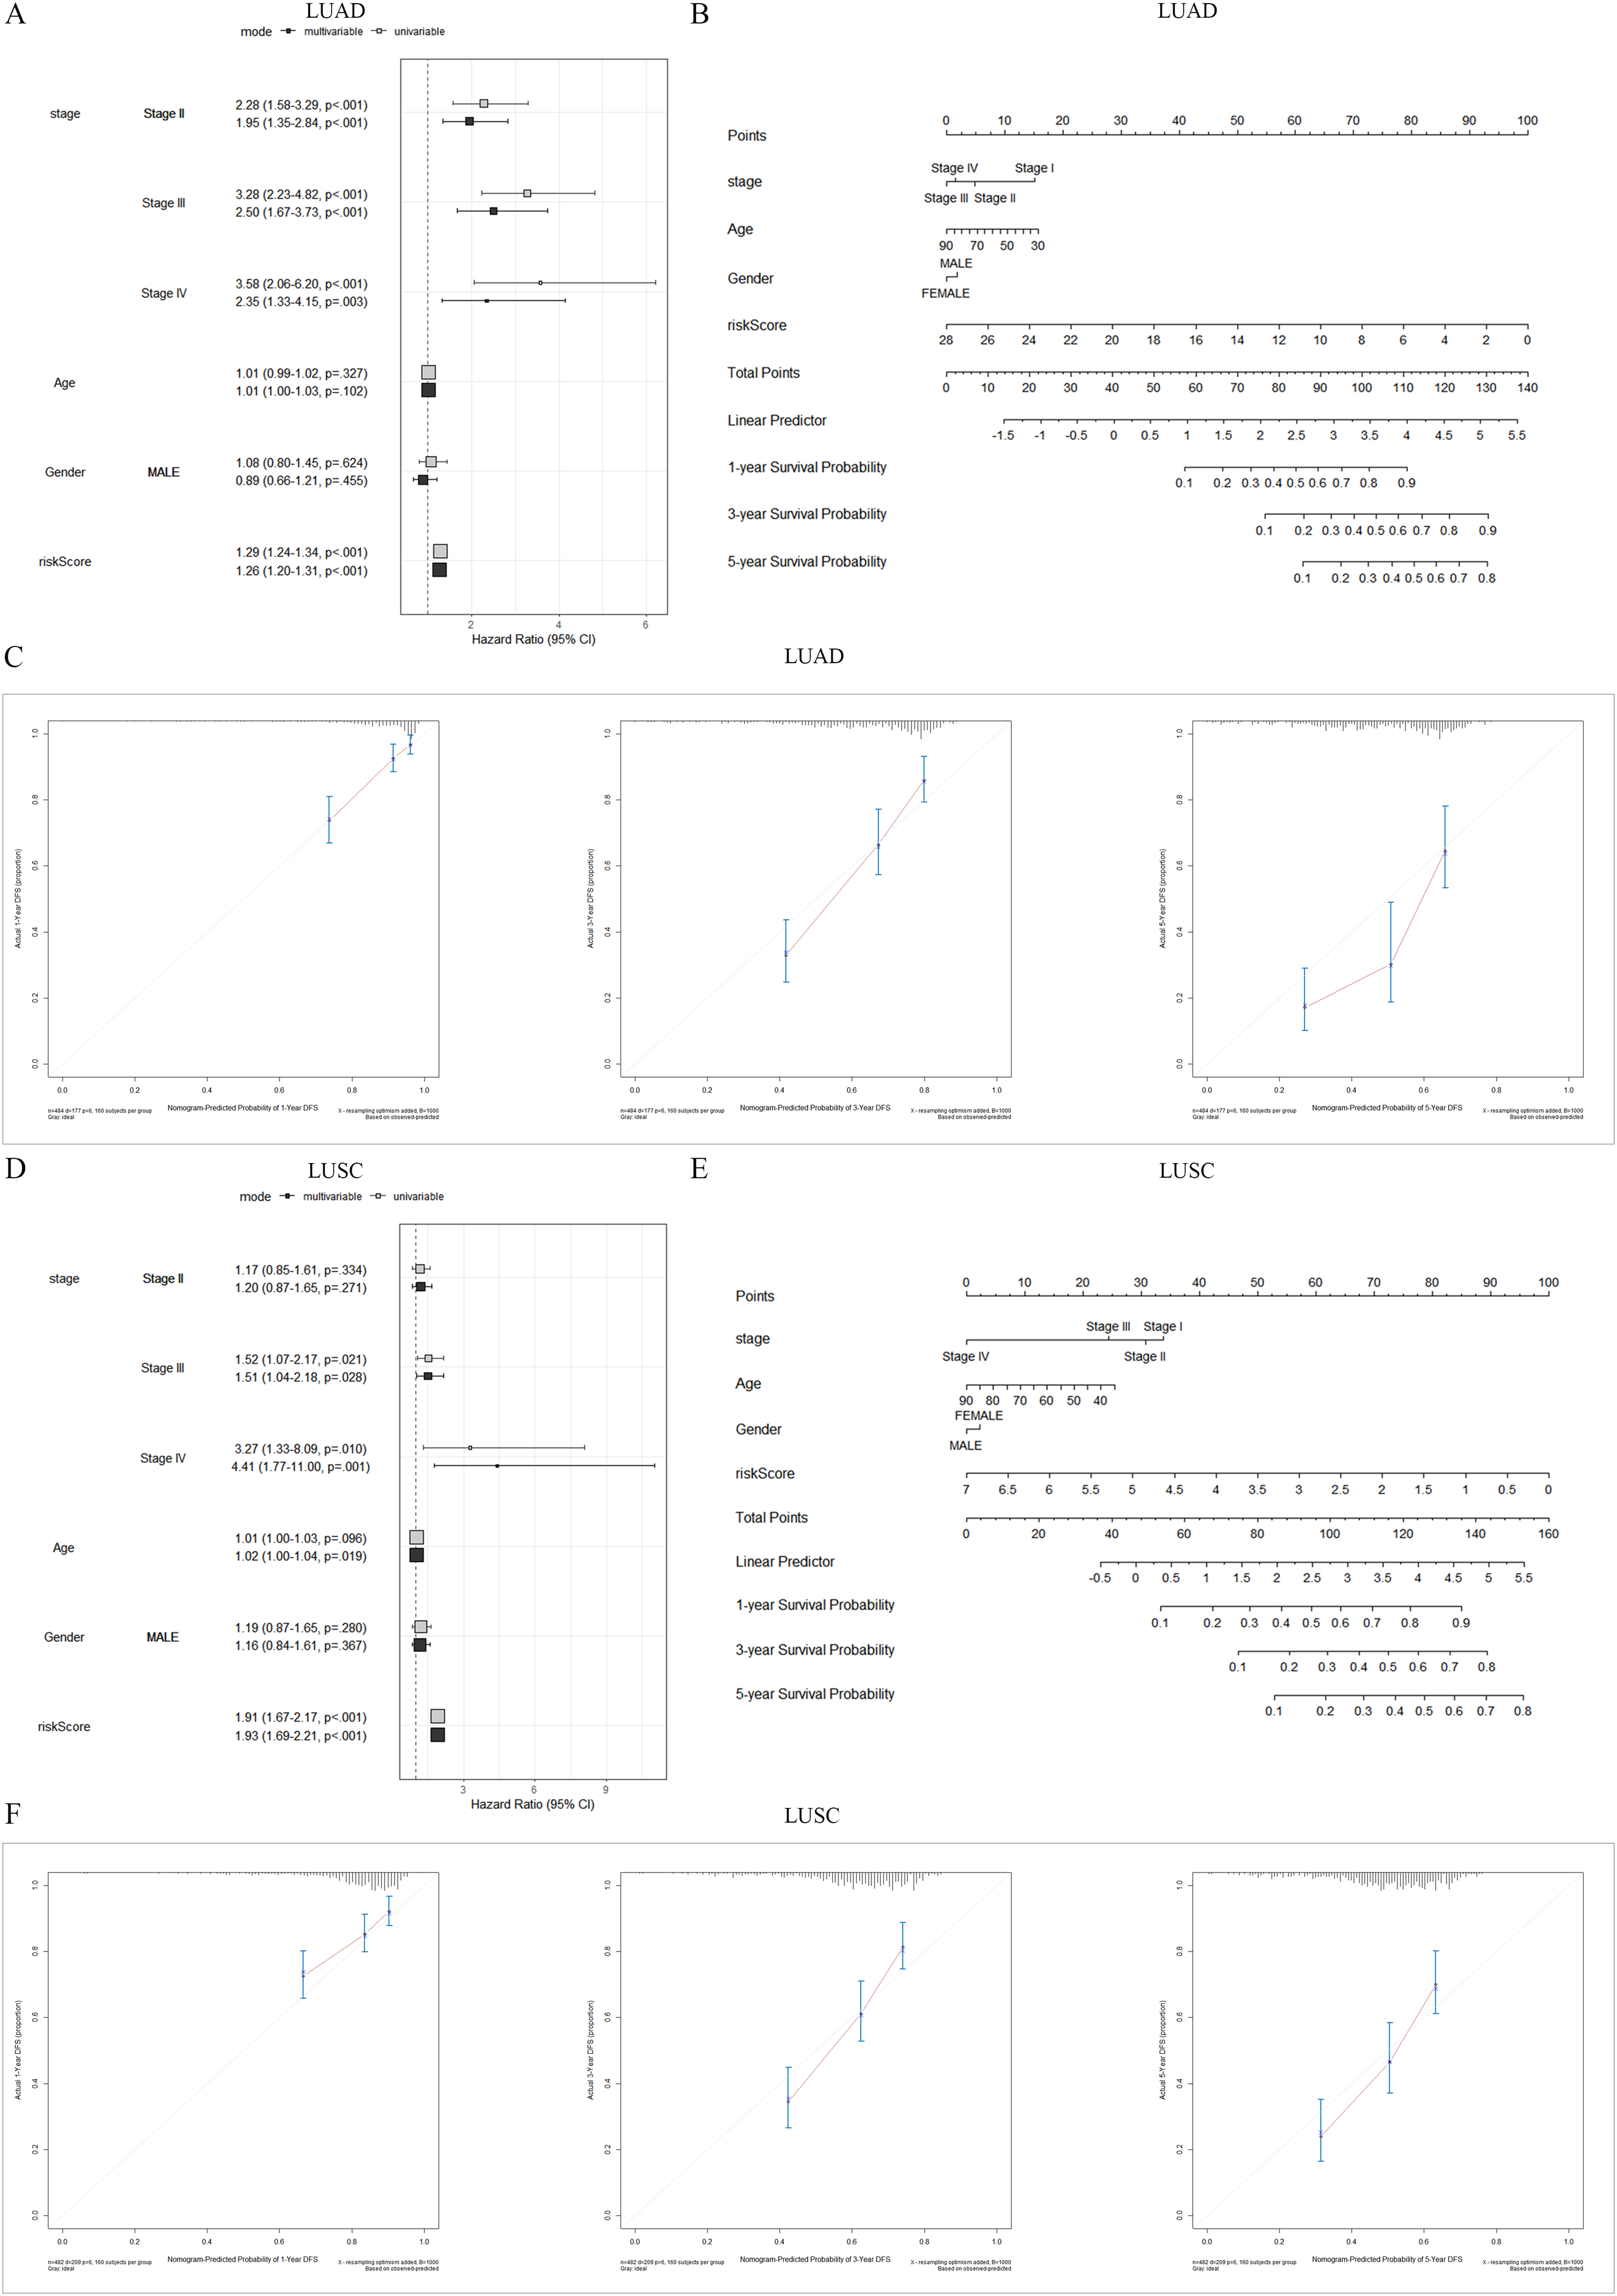
Independent prognostic analysis. (A, D) Univariate Cox and Multivariate Cox regression analysis. (B, E) Nomograms. (C, F) 1-, 3- and 5-year calibration curves of the nomogram.
Characteristics of infiltrating immune cells in high and low-risk groups
Finally, we utilized CIBERSORT algorithm to show the landscape of 22 infiltrating immune cells in LUAD and LUSC (Figure 6A and B), and assess differences in the distribution of immune cells between high and low-risk groups. We found the infiltrating density of several immune cells was significant increased compared with the LUAD low-risk group, including B cells naive, T cells CD4 memory activated, T cells regulatory, T cells gamma delta, Macrophages M0 and Dendritic cells activated, in addition, the infiltrating density of B cells memory, T cells CD8, T cells CD4 memory resting, NK cells activated, Macrophages M2, Dendritic cells resting, Eosinophils and Neutrophils was significantly decreased (Figure 6C). In LUSC, the infiltration density of Macrophages M2 in high-risk group was significantly increased, while the infiltration density of T cells gamma delta, Monocytes and Dendritic cells activated was significantly decreased (Figure 6D).
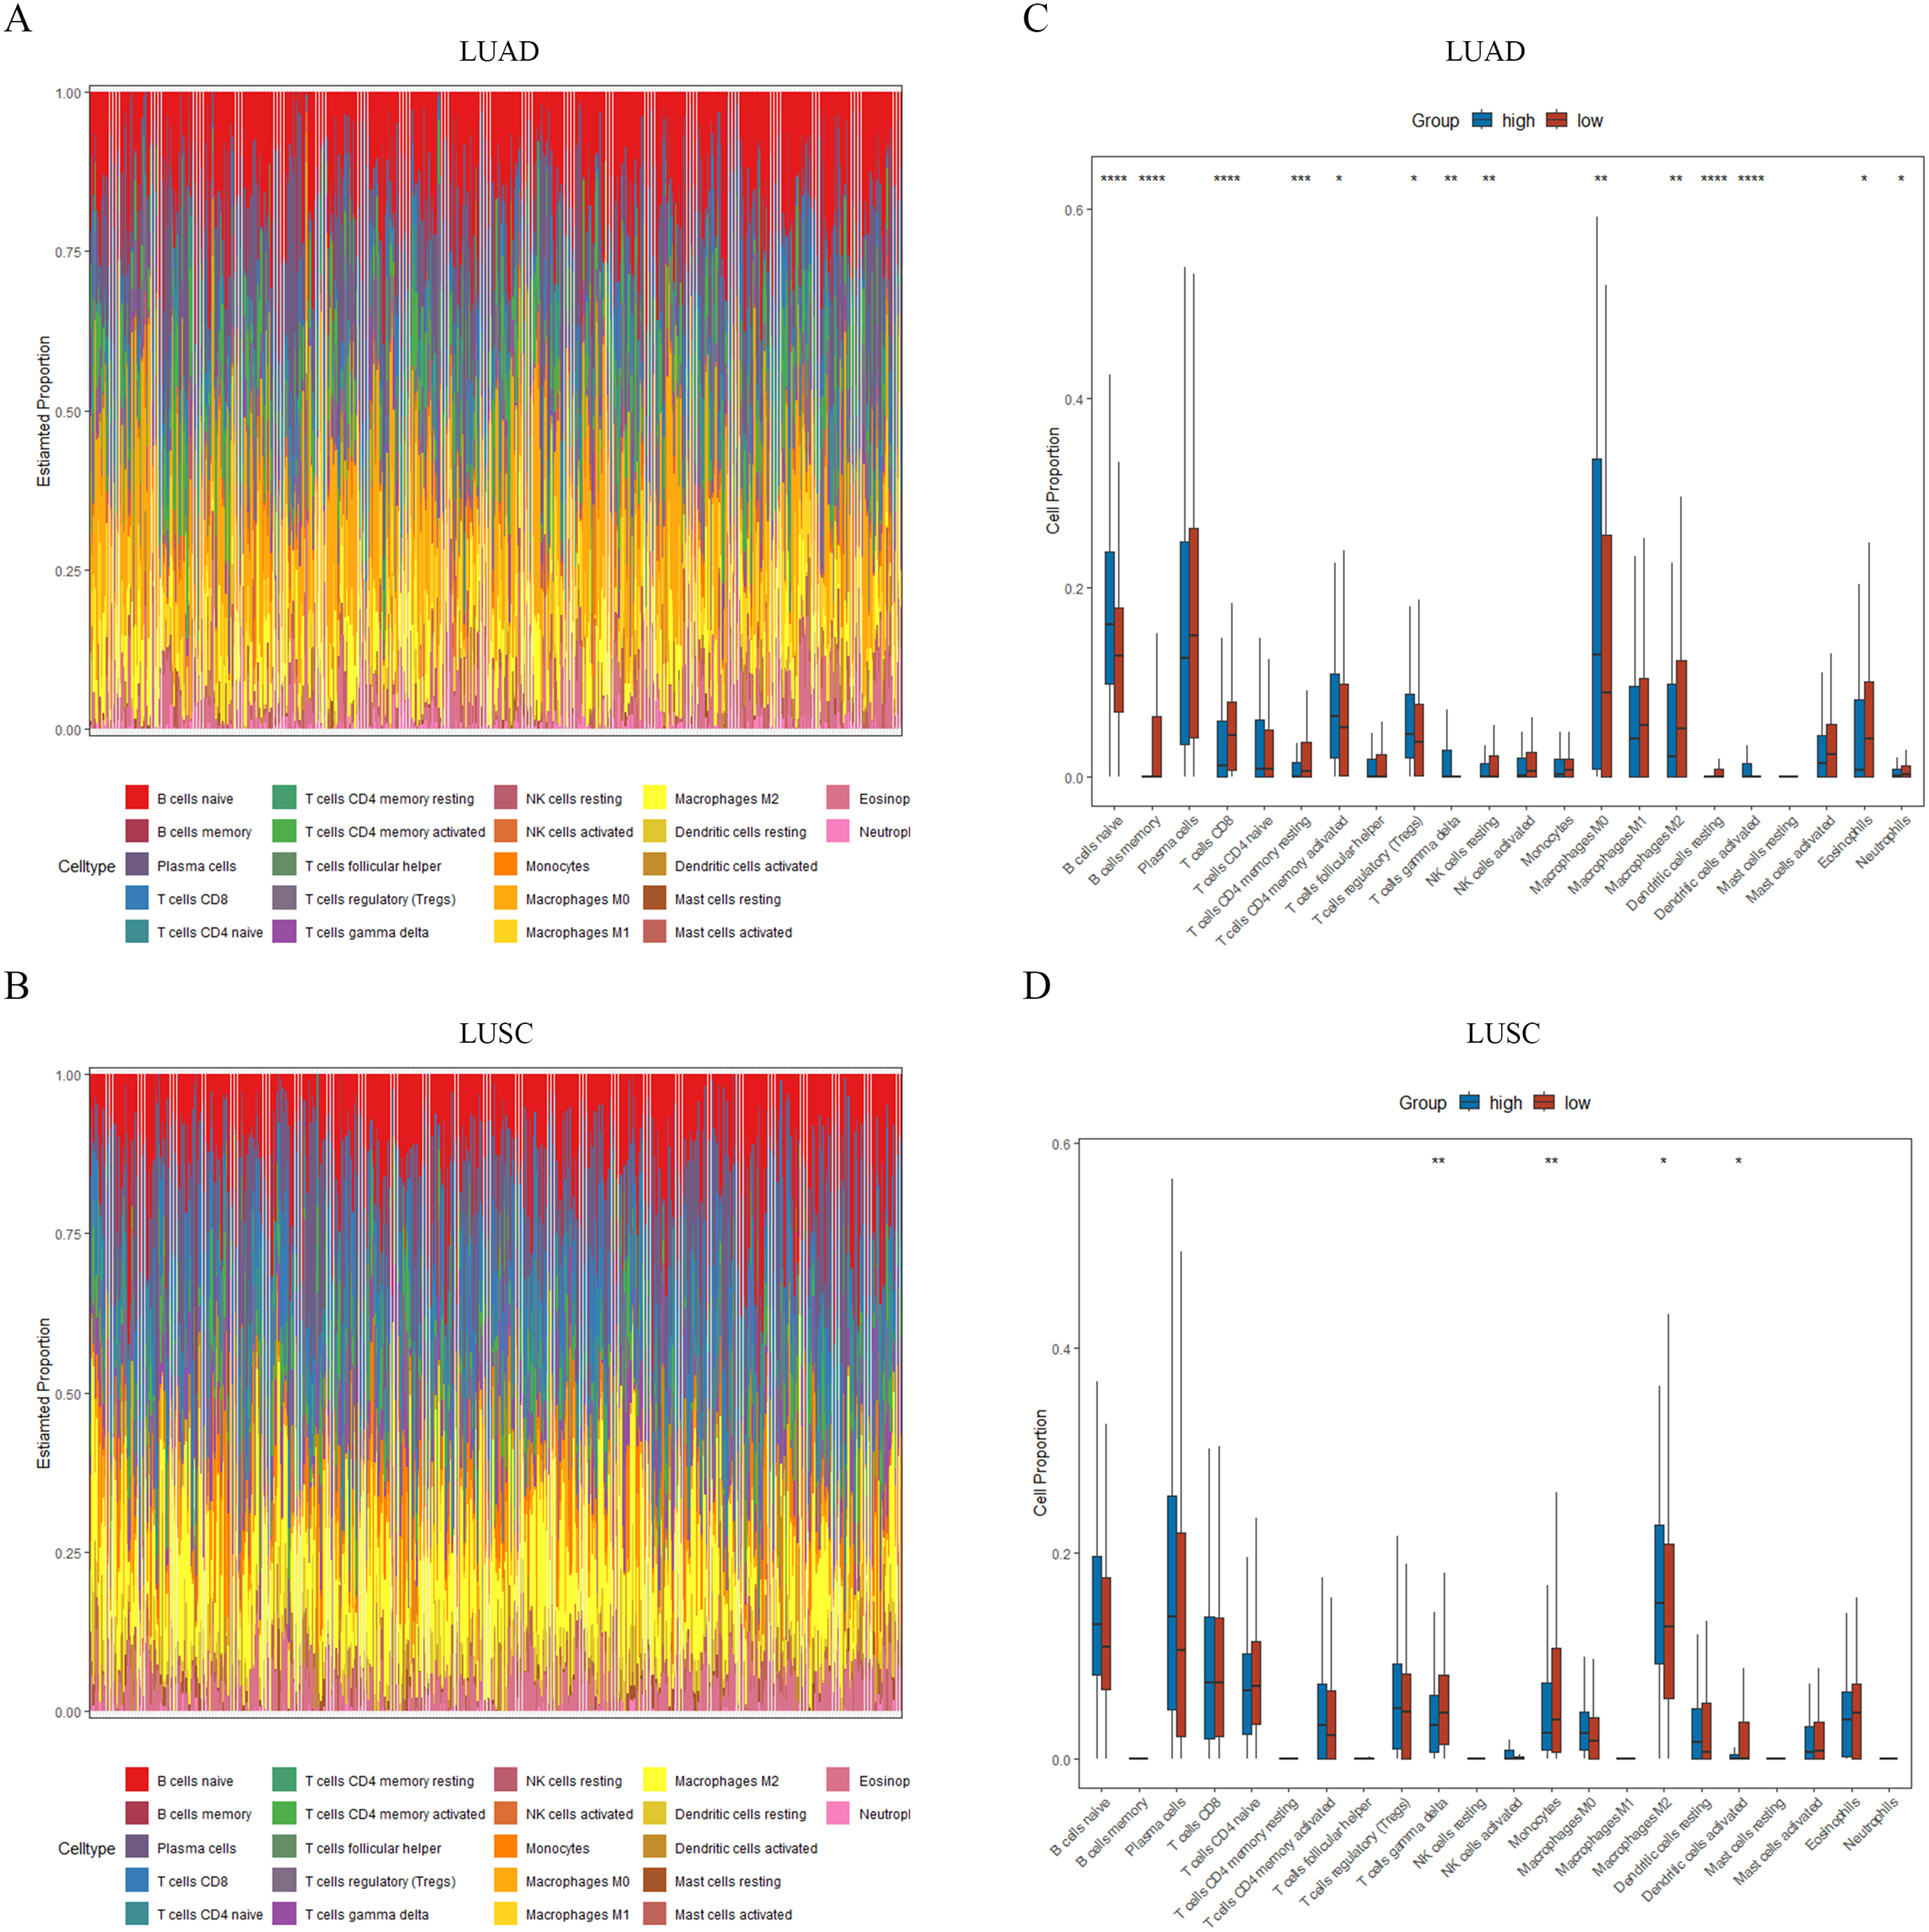
The differences in immune microenvironment analysis between the two risk groups. (A–B) Stack bar graph of the proportion of 22 types of immune cells in LUAD and LUSC samples. (C–D) Difference analysis of infiltration density of 22 immune cells between two risk groups (*P < 0.05, **P < 0.01, ***P < 0.001, ****P < 0.0001).
Functional and pathway enrichment analysis of ExoDEGs between high and low-risk groups
We conducted differential expression analysis of ExoDEGs in high and low-risk groups, and obtained 18 ExoDEGs with significant differences between LUAD risk groups and 19 ExoDEGs with significant differences between LUSC risk groups (Table S1). GSEA enrichment analysis was performed on the obtained differential ExoDEGs, and the first 5 gene sets that were significantly enriched were selected for display (Figure 7A and B). In LUAD, the GO analysis showed that the top BP terms were regulation of mitotic sister chromatid separation and mitotic sister chromatid separation, the top CC terms were pronucleus and outer kinetochore, and the top MF term was extracellular matrix structural constituent (Figure 7C). In LUSC, the GO analysis showed that the top BP terms were regulation of heterotypic cell-cell adhesion and peptide cross-linking, the top CC terms were platelet alpha granule lumen and multivesicular body, and the top MF terms were extracellular matrix structural constituent conferring tensile strength and cargo receptor activity (Figure 7D). Meanwhile, the KEGG analysis revealed that the differential ExoDEGs between LUAD high and low-risk group were associated p53 signaling pathway, but LUSC differential ExoDEGs were only associated complement and coagulation cascades (Figure 7E).
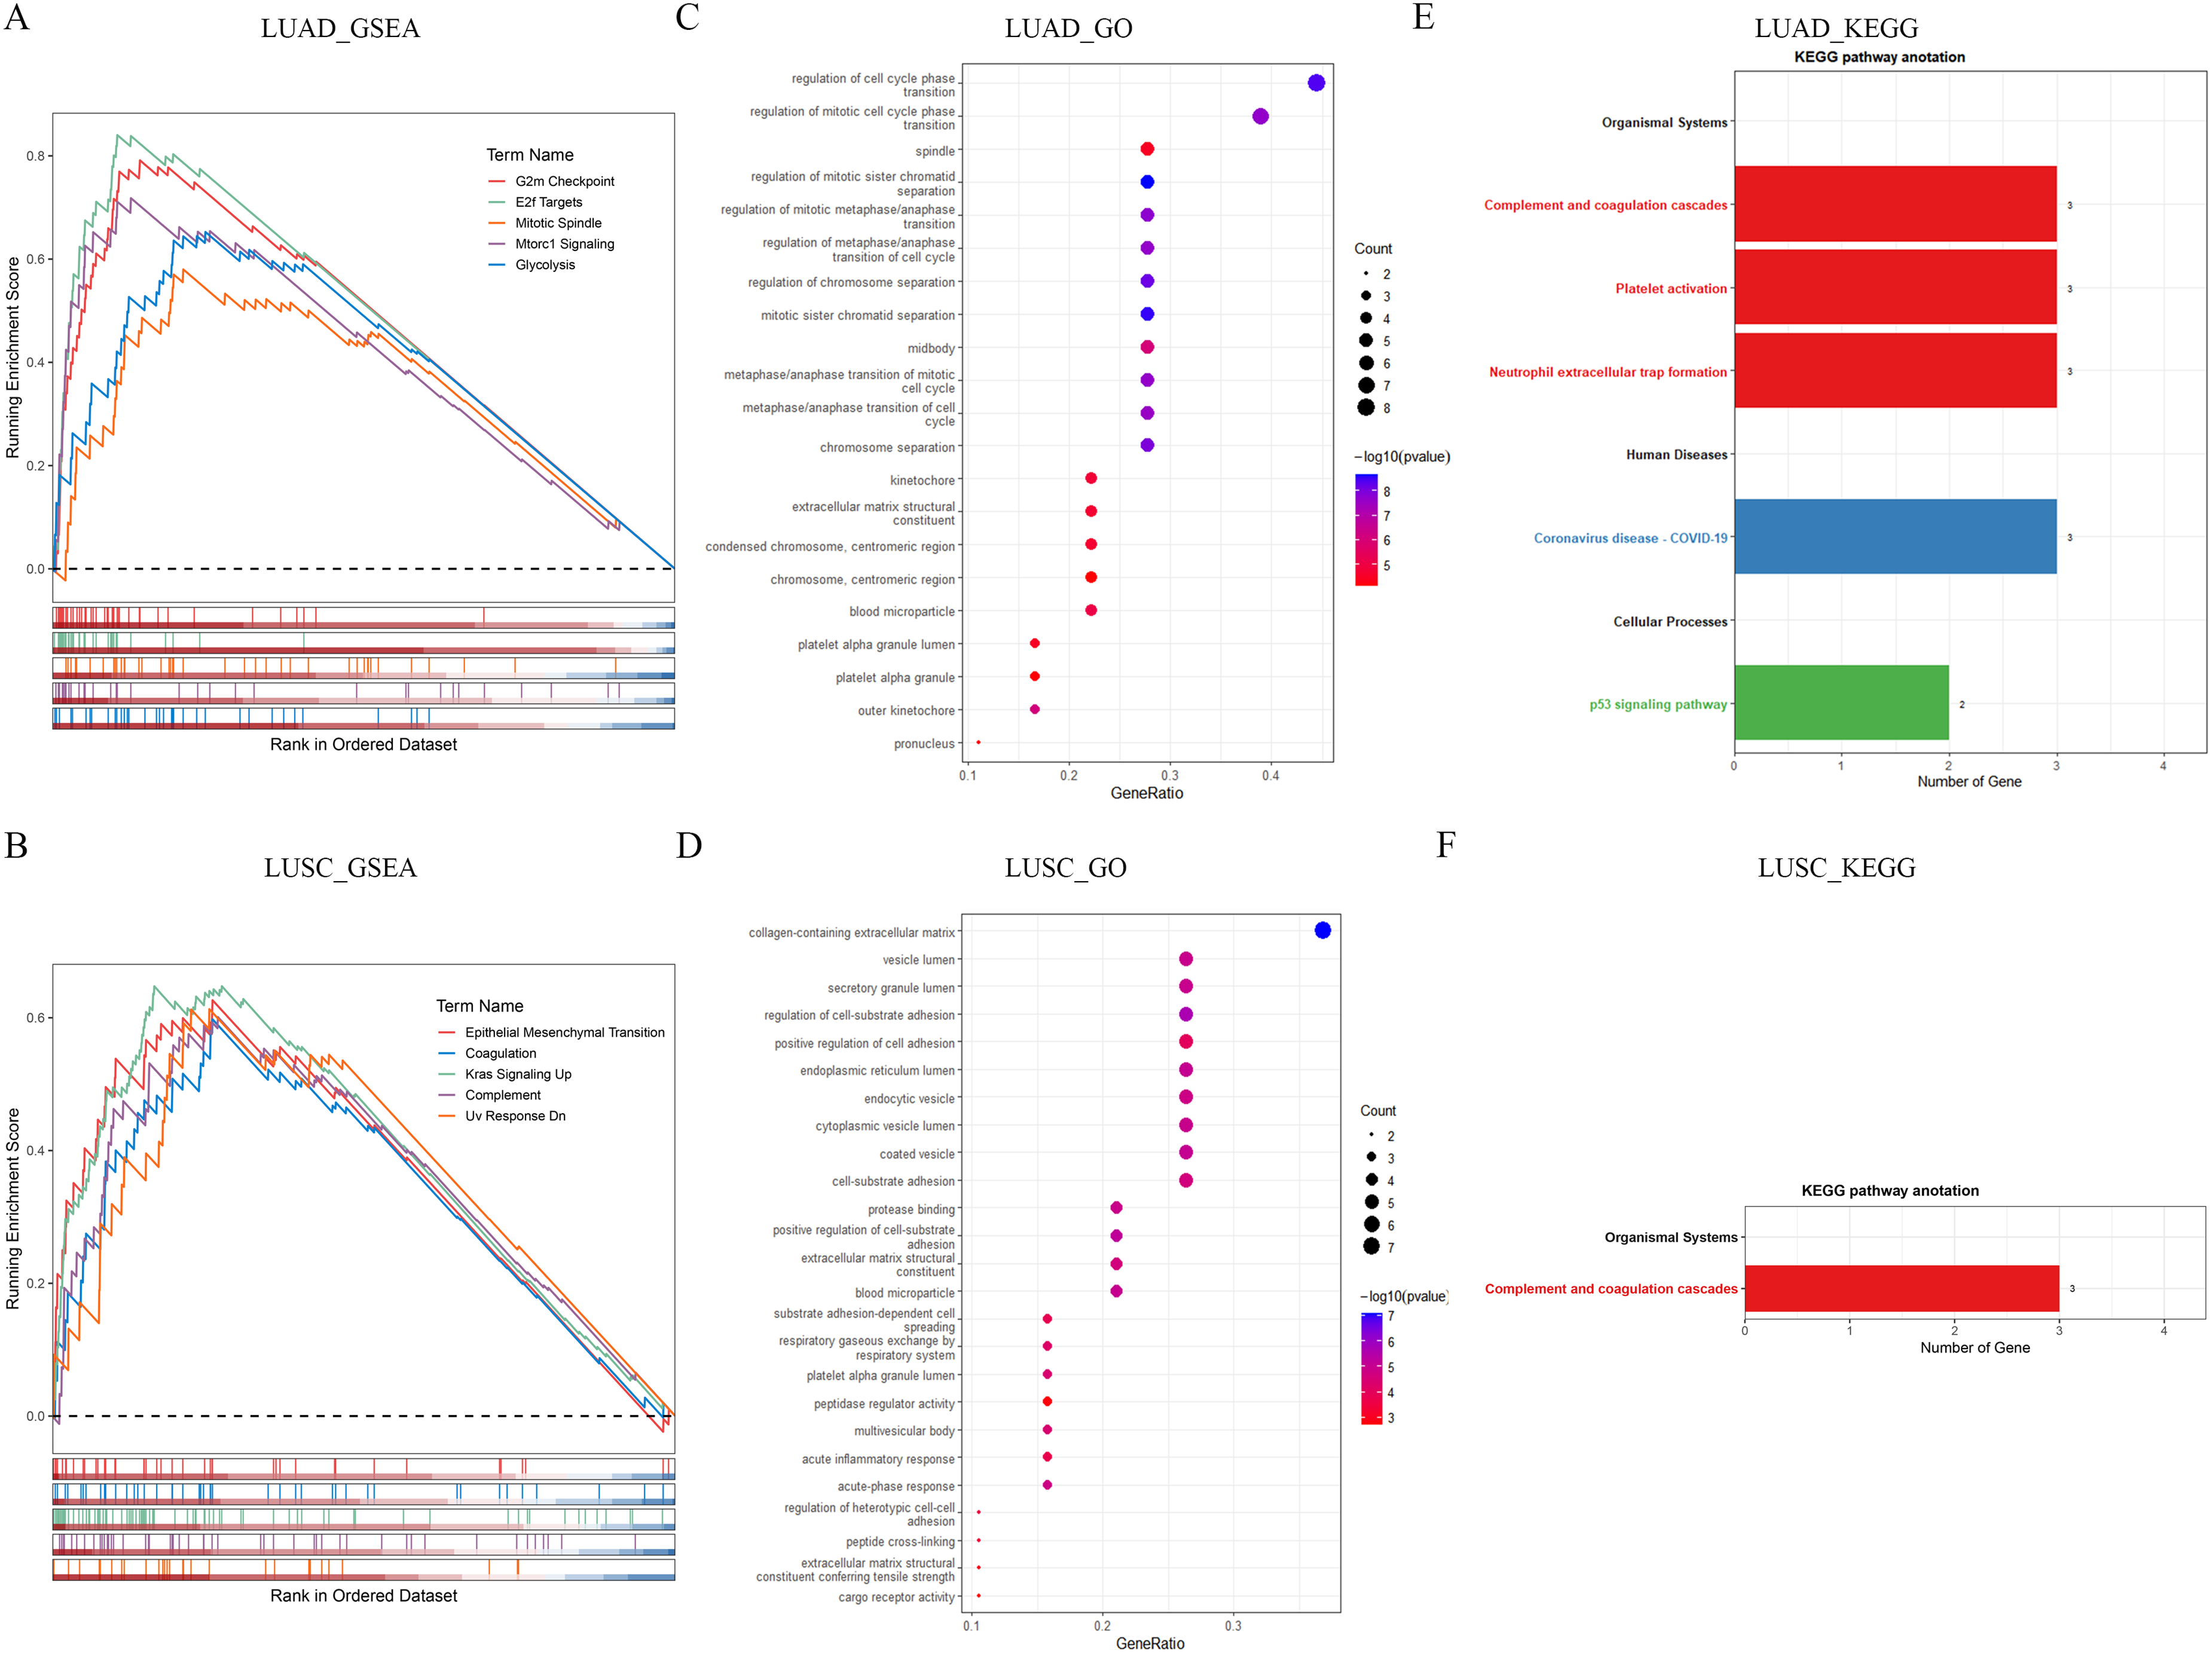
The enrichment analysis of differential expression ExoDEGs between high and low-risk groups. (A–B) GSEA analysis. (C–D) GO analysis. (E–F) KEGG analysis.
Discussion
LC is the most common malignancy and the leading cause of cancer deaths. 16 Due to smoking, environmental pollution and other factors, the incidence of LC is gradually increasing and showing a trend of younger people.17,18 Screening and early diagnosis of high-risk groups can improve the survival rate of LC patients and effectively avoid tumor invasion and distant metastasis, which is the key factor to improve the prognosis of patients.
Exosomes are a kind of extracellular vesicles that carry abundant biological information. The contents of nucleic acids, proteins and lipids in exosomes play an important role in the regulation of intercellular communication and tumor microenvironment (TME). 19 Numerous studies have shown that exosomes are essential for understanding mechanisms related to the development, metastasis and drug resistance of LC. 20 LC-derived exosomes can promote tumor invasion, angiogenesis, and drug resistance, help cancer cells escape from the host immune system, and are non-invasive prognostic biomarkers for LC.21–24
In this study, we collected LC-derived exosomes mRNA information in Vesiclependia database, and combined with SCLC, LUAD, LUSC and LCC mRNA information in GEO database and USCS database for comprehensive analysis. Unfortunately, the analysis of LCC and SCLC was not carried out to the end due to the lack of sample information. Initially, we identified 5391 SCLC DEGs, 4732 LUAD DEGs and 6232 LUSC DEGs between tumors samples and corresponding paracancerous tissues samples, and intersected them with LC-derived exosomes mRNA respectively to obtain 1114 SCLC ExoDEGs, 1238 LUAD ExoDEGs and 1746 LUSC ExoDEGs. Furthermore, we combined the ExoDEGs obtained above with clinical follow-up data of patients and established a LUAD risk model composed of 12 ExoDEGs (CDH17, DAAM2, FKBP3, FLNC, GSTM2, PGAM4, HPCAL1, FERMT2, LYPD1, SNRNP70, KIR3DL2 and GPX3) and a LUSC risk model composed of 7 ExoDEGs (FGA, ERH, HID1, CSNK2A1, SLC7A5, ACOT7 and FUNDC1). Among them, DAAM2, GSTM2, KIR3DL2 and GPX3 are protective factors in LUAD risk model, and the rest are risk factors; ERH and FUNDC1 are protective factors in LUSC risk model, and FGA, HID1, CSNK2A1, SLC7A5 and ACOT7 are risk factors. Stratification survival analysis confirmed that risk scores possessed an accurate predictive value for prognostic in LUAD or LUSC. The calibration curves for the 1-, 3- and 5-year nomogram models show that the nomogram predictions have a good fit with the observed results. Notably, the 1-, 3- and 5-year AUC values of ROC curves for the LUAD risk model was higher than 0.75, while the AUC values of ROC curves for the LUSC risk model also was higher than 0.65. These results indicate that the LUAD risk model and LUSC risk model established in this study have reliable prognostic value for LUAD and LUSC.
The TME is a complex ecosystem that plays an important role in tumor invasion and metastasis. Tumor cells, immune cells and supporting cells are the main immune components in LC TME. Studies related to the LC TME have shown that B cells can promote tumor activity and immunosuppression, 25 T cells regulatory can promote tumor growth by inhibiting anti-tumor response, 26 Macrophages M2 can contribute to tumor growth and immunosuppression, 27 but CD8 T cells, Dendritic cells, Macrophage M1 and NK cells can inhibit LC.27–30 In this study, B cells naive, T cells CD4 memory activated, T cells regulatory, T cells gamma delta, Macrophages M0 and Dendritic cells activated have higher infiltration density in LUAD high-risk group, while B cells memory, T cells CD8, T cells CD4 memory resting, NK cells activated, Macrophages M2, Dendritic cells resting, Eosinophils and Neutrophils had lower density than in the risk group. Furthermore, compared with the LUSC low-risk group, the infiltration density of Macrophages M2 was significantly increased in the high-risk group, but T cells gamma delta, Monocytes and Dendritic cells activated was significantly decreased. These indicate that the expression level of ExoDEGs for building the LUAD and LUSC risk models in this study is significantly correlated with immunosuppressive activity of LUAD and LUSC patients, while the immunosuppressive activity is lower in the high-risk groups.
There are still several limitations to the study. First, the sample sizes of SCLC and LCC in GEO database and UCSC database were insufficient, which failed to establish prognostic models. Second, the prognostic value of ExoDEGs used to establish the model in LUAD and LUSC patients has not been externally validated due to our lack of sufficient available data. Finally, our results are only a proof-of-concept and need to be confirmed by more in vivo and in vitro tests.
Conclusions
We established a LUAD prognostic model with 12 ExoDEGs and a LUSC prognostic model with 7 ExoDEGs, which can be used as independent prognostic indicators for LUAD patients and LUSC patients. These ExoDEGs may be as prognostic markers and new candidate targets for treatment of LUAD and LUSC.
Supplemental Material
sj-docx-1-cbm-10.1177_18758592251317400 - Supplemental material for Identifying diagnostic markers and establishing prognostic model for lung cancer based on lung cancer-derived exosomal genes
Supplemental material, sj-docx-1-cbm-10.1177_18758592251317400 for Identifying diagnostic markers and establishing prognostic model for lung cancer based on lung cancer-derived exosomal genes by Yongxiang Zhang, Feng Chen, Yuqi Cao, Hao Zhang, Lingling Zhao and Yijun Xu in Cancer Biomarkers
Supplemental Material
sj-xlsx-2-cbm-10.1177_18758592251317400 - Supplemental material for Identifying diagnostic markers and establishing prognostic model for lung cancer based on lung cancer-derived exosomal genes
Supplemental material, sj-xlsx-2-cbm-10.1177_18758592251317400 for Identifying diagnostic markers and establishing prognostic model for lung cancer based on lung cancer-derived exosomal genes by Yongxiang Zhang, Feng Chen, Yuqi Cao, Hao Zhang, Lingling Zhao and Yijun Xu in Cancer Biomarkers
Supplemental Material
sj-xls-3-cbm-10.1177_18758592251317400 - Supplemental material for Identifying diagnostic markers and establishing prognostic model for lung cancer based on lung cancer-derived exosomal genes
Supplemental material, sj-xls-3-cbm-10.1177_18758592251317400 for Identifying diagnostic markers and establishing prognostic model for lung cancer based on lung cancer-derived exosomal genes by Yongxiang Zhang, Feng Chen, Yuqi Cao, Hao Zhang, Lingling Zhao and Yijun Xu in Cancer Biomarkers
Supplemental Material
sj-xls-4-cbm-10.1177_18758592251317400 - Supplemental material for Identifying diagnostic markers and establishing prognostic model for lung cancer based on lung cancer-derived exosomal genes
Supplemental material, sj-xls-4-cbm-10.1177_18758592251317400 for Identifying diagnostic markers and establishing prognostic model for lung cancer based on lung cancer-derived exosomal genes by Yongxiang Zhang, Feng Chen, Yuqi Cao, Hao Zhang, Lingling Zhao and Yijun Xu in Cancer Biomarkers
Supplemental Material
sj-xls-5-cbm-10.1177_18758592251317400 - Supplemental material for Identifying diagnostic markers and establishing prognostic model for lung cancer based on lung cancer-derived exosomal genes
Supplemental material, sj-xls-5-cbm-10.1177_18758592251317400 for Identifying diagnostic markers and establishing prognostic model for lung cancer based on lung cancer-derived exosomal genes by Yongxiang Zhang, Feng Chen, Yuqi Cao, Hao Zhang, Lingling Zhao and Yijun Xu in Cancer Biomarkers
Supplemental Material
sj-xls-6-cbm-10.1177_18758592251317400 - Supplemental material for Identifying diagnostic markers and establishing prognostic model for lung cancer based on lung cancer-derived exosomal genes
Supplemental material, sj-xls-6-cbm-10.1177_18758592251317400 for Identifying diagnostic markers and establishing prognostic model for lung cancer based on lung cancer-derived exosomal genes by Yongxiang Zhang, Feng Chen, Yuqi Cao, Hao Zhang, Lingling Zhao and Yijun Xu in Cancer Biomarkers
Supplemental Material
sj-xls-7-cbm-10.1177_18758592251317400 - Supplemental material for Identifying diagnostic markers and establishing prognostic model for lung cancer based on lung cancer-derived exosomal genes
Supplemental material, sj-xls-7-cbm-10.1177_18758592251317400 for Identifying diagnostic markers and establishing prognostic model for lung cancer based on lung cancer-derived exosomal genes by Yongxiang Zhang, Feng Chen, Yuqi Cao, Hao Zhang, Lingling Zhao and Yijun Xu in Cancer Biomarkers
Supplemental Material
sj-xls-8-cbm-10.1177_18758592251317400 - Supplemental material for Identifying diagnostic markers and establishing prognostic model for lung cancer based on lung cancer-derived exosomal genes
Supplemental material, sj-xls-8-cbm-10.1177_18758592251317400 for Identifying diagnostic markers and establishing prognostic model for lung cancer based on lung cancer-derived exosomal genes by Yongxiang Zhang, Feng Chen, Yuqi Cao, Hao Zhang, Lingling Zhao and Yijun Xu in Cancer Biomarkers
Supplemental Material
sj-xls-9-cbm-10.1177_18758592251317400 - Supplemental material for Identifying diagnostic markers and establishing prognostic model for lung cancer based on lung cancer-derived exosomal genes
Supplemental material, sj-xls-9-cbm-10.1177_18758592251317400 for Identifying diagnostic markers and establishing prognostic model for lung cancer based on lung cancer-derived exosomal genes by Yongxiang Zhang, Feng Chen, Yuqi Cao, Hao Zhang, Lingling Zhao and Yijun Xu in Cancer Biomarkers
Footnotes
Acknowledgments
This research was funded by Tianjin Key Medical Discipline (Specialty) Construction Project (NO. TKYXZDXK-018A and NO. TJYXZDXK-049A).
Author contributions
For every author, his or her contribution to the manuscript needs to be provided using the following categories: Conception: Yijun Xu, Yongxiang Zhang; Interpretation or analysis of data: Feng Chen, Yuqi Cao, Hao Zhang; Preparation of the manuscript: Yongxiang Zhang; Revision for important intellectual content: Lingling Zhao, Yijun Xu; Supervision: Yijun Xu.
Funding
The authors received no financial support for the research, authorship, and/or publication of this article.
Declaration of conflicting interests
The authors declared no potential conflicts of interest with respect to the research, authorship, and/or publication of this article.
Data availability
The original contributions presented in the study are included in the article/Supplementary Material. Further inquiries can be directed to the corresponding authors.
Supplemental material
Supplemental material for this article is available online.
References
Supplementary Material
Please find the following supplemental material available below.
For Open Access articles published under a Creative Commons License, all supplemental material carries the same license as the article it is associated with.
For non-Open Access articles published, all supplemental material carries a non-exclusive license, and permission requests for re-use of supplemental material or any part of supplemental material shall be sent directly to the copyright owner as specified in the copyright notice associated with the article.