Abstract
BACKGROUND:
Biomarker studies revealed important clinical significance of exosome for cancer patients. However, there is currently no consensus on exosome quantification methods.
METHODS:
Bicinchoninic acid (BCA) method, acetylcholinesterase (AChE) method and nanoparticle tracking analysis (NTA) were utilized to quantify 20 plasma exosome samples, and interrelations between these three methods were explored. Associations of plasma exosome levels with characteristics and prognosis of 208 non-small-cell lung cancer (NSCLC) patients were investigated.
RESULTS:
Results of the three methods for exosome quantification were significantly correlated with each other. Correlation coefficient between AChE and NTA (
CONCLUSIONS:
Plasma exosome level correlates with tumor stage and the history of chronic obstructive pulmonary disease, and may serve as a prognostic factor for NSCLC.
Introduction
Exosomes are membrane-enclosed extracellular vesicles (EVs) originating from endosomes, with a diameter of 30–100 nm [1]. Almost all cell types can secrete exosomes under normal and stressful conditions, such as reticulocytes, dendritic cells, adipocytes, endothelial and epithelial cells [2]. Exosomes carry many kinds of biological molecules, including proteins, RNAs, DNAs and lipids [2, 3]. Some of these molecules were found to be diagnostic or prognostic biomarkers [4, 5, 6, 7, 8].
It has been reported that circulating exosome concentration was higher in cancer patients than that in non-malignant patients or healthy individuals [9, 10, 11, 12]. Kanwar et al. developed “ExoChip” to capture and quantify serum exosomes [10]. ExoChip was a microfluidic device which utilized antibodies against CD63, an antigen commonly overexpressed in exosomes, to capture exosomes [10]. The captured exosomes were stained with membrane specific DiO dyes and then detected using a micro-plate reader [10]. With the ExoChip device, it was revealed that exosome level in pancreatic cancer patients was higher than that in healthy individuals [10]. Using mass spectrometry analyses, Melo et al. identified that GPC1 was specifically enriched on cancer-cell-derived exosomes [13]. More importantly, GPC1+ exosomes were detected in the serum of pancreatic cancer patients with absolute specificity and sensitivity, distinguishing healthy subjects and patients with a benign pancreatic disease from patients with early- and late-stage pancreatic cancer [13]. Interestingly, highly metastatic cell lines were reported to secrete more exosomes than poorly metastatic cells [14]. These lines of evidence suggested that circulating exosome level may be used as a cancer diagnostic and prognostic biomarker.
Lung cancer is a leading cause of cancer death in the world [15]. Non-small-cell lung cancer (NSCLC) represents about 80%–85% of all lung cancer cases [16, 17]. The predicted 5-year survival rate is only 15.9% for patients with NSCLC [18]. Clinical factors are major predictors for the prognosis of NSCLC, such as tumor stage, histological type and treatment modality. Recently, some blood-based biomarkers, such as circulating tumor cells and circulating tumor DNA [19, 20, 21], have been shown with significant prognostic value. Since elevated concentration of circulating exosome was reported in some malignant tumors including lung cancer [9, 10, 11, 22], we hypothesize that circulating exosome level may serve as a prognostic factor of NSCLC. This study was designed to test this hypothesis.
So far, there is no well-established method for exosome quantification. Some published studies have employed the bicinchoninic acid (BCA) method, acetylcholinesterase (AChE) activity detection, and nanoparticle tracking analysis (NTA) to quantitate exosome levels [23, 24]. BCA assays quantify total exosomal proteins to estimate the exosome concentration. AChE is enriched in exosomes [25], and its enzymatic activity has been used to reflect exosome amount [24, 26]. Both BCA and AChE methods only need a widely equipped microplate reader and relevant reagents. The NTA is a laser-based optical technique that detects Brownian motion of individual particles in solution and determines the diameter and concentration of detected particles via the Stokes-Einstein equation [27]. In recent years, NTA has become a prevailing method for sizing and counting synthetic particles as well as exosomes [27]. Though NTA could count individual particle, this method requires specially equipped instruments. In this study, we utilized these three methods to quantify circulating exosome and compared the efficiency and accuracy of these methods. Since NTA method has been reported to deliver the most reproducible and valid data for exosome number determination [28], we evaluated the BCA and AChE methods by assessing their correlation with NTA. We then apply the better-correlated method to detect circulating exosome of NSCLC patients for prognosis study.
Methods
Patients and samples
Patients with NSCLC newly diagnosed histologically were recruited at Xinqiao Hospital of the Third Military Medical University in Chongqing, China from October 2012 to December 2014. The TNM stage of disease was defined according to the 7th edition of the International Association for the Study of Lung Cancer classification system. Patients were excluded if they had a history of heart, liver, and kidney disease, or diabetes mellitus. History of chronic obstructive pulmonary disease (COPD) was determined based on explicit diagnosis recorded in the medical history. Never smokers were defined as individuals who had smoked less than 100 cigarettes during their lifetime. Former smokers were defined as individuals who had quitted smoking for at least one year at the survey time. Clinical and demographic information was obtained from each study subject by a combination of a structured subject interview and medical records. Blood (10 ml) was collected for each patient. Plasma was separated immediately and stored at
Pearson correlations between different quantification methods. Plasma exosome samples from twenty NSCLC patients were quantified with AChE, BCA, and NTA methods. For AChE method, exosomal AChE activity contained in 10 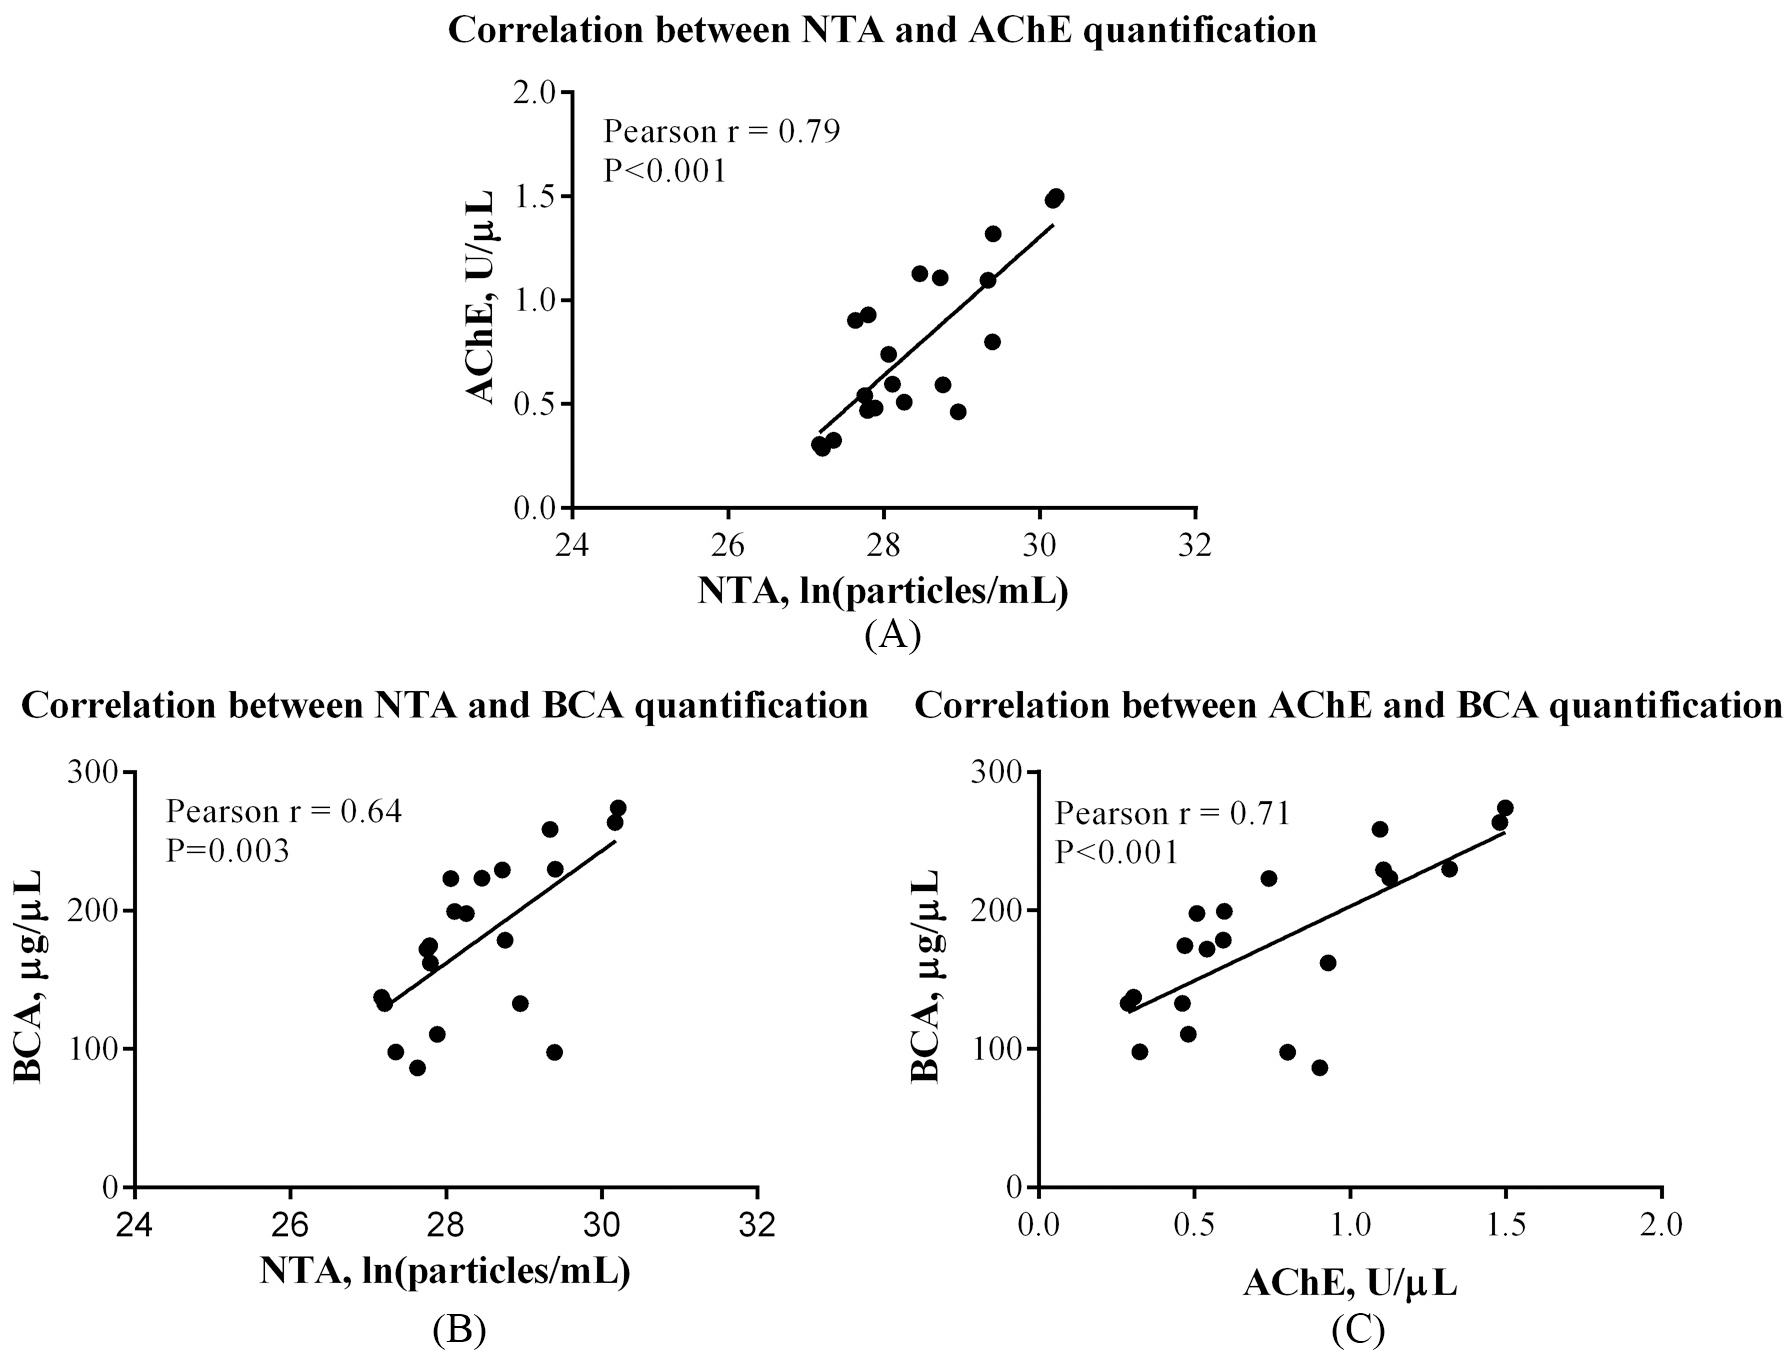
Exosomes were isolated from plasma of NSCLC patients using ExoQuick Exosome Precipitation Solution kit (System Biosciences, Mountain View, CA, USA). Isolated exosomes were resuspended in phosphate-buffered saline (PBS), which was filtrated with a 0.22
Exosome quantification
AChE activity was assayed following a previously described procedure with minor modification [24]. Briefly, 1.9
Statistical analysis
Correlations of the three quantification methods were evaluated by Pearson correlation coefficients. For prognosis study, exosome concentration was determined as low or high level using cutoff identified by X-tile, which is a bio-informatics tool for outcome-based cut-point optimization [30]. X-tile plots provide a single, global assessment of every possible way of dividing a population into low and high level marker expression. Because it is statistically invalid to test multiple divisions and accept the best P value, rigorous statistical evaluation is achieved by defining divisions in a “training set” and then validating them in a separate patient cohort (“validation set”). The X-tile software provides a method of dividing a single cohort into training and validation subsets for P value estimation. In addition, the software can perform standard Monte Carlo simulations (e.g., cross-validation) to produce corrected P values to assess statistical significance of data assessed by multiple cut-points [30].
Exosome level differences between groups based on patients’ characteristics were assessed using one-way analysis of variance (ANOVA) or t-tests. The Kaplan-Meier curve and log-rank test were used to demonstrate and compare survival rates of patients with different exosome levels. A backward selection process was used to select potential confounders: Age at diagnosis, gender, smoking status, stage, histologic types, chemotherapy, radiotherapy, surgery and history of COPD. The significant variables were retained as covariates in subsequent multivariate analyses. A multivariate Cox proportional hazard model was employed to assess association between circulating exosome level and overall survival (OS). Statistical analyses were performed by using SPSS software package (Version 13.0, SPSS Inc., Chicago, IL, USA). Kaplan-Meier curves were generated using GraphPad Prism (Version 6.04 for Windows, SanDiego, CA, USA). All reported p values were two-sided with a significance level of 0.05.
Demographic and clinical characteristics of NSCLC patients
Demographic and clinical characteristics of NSCLC patients
Associations between circulating exosome level and patients’ characteristics
Comparison of the BCA, AChE and NTA quantification methods
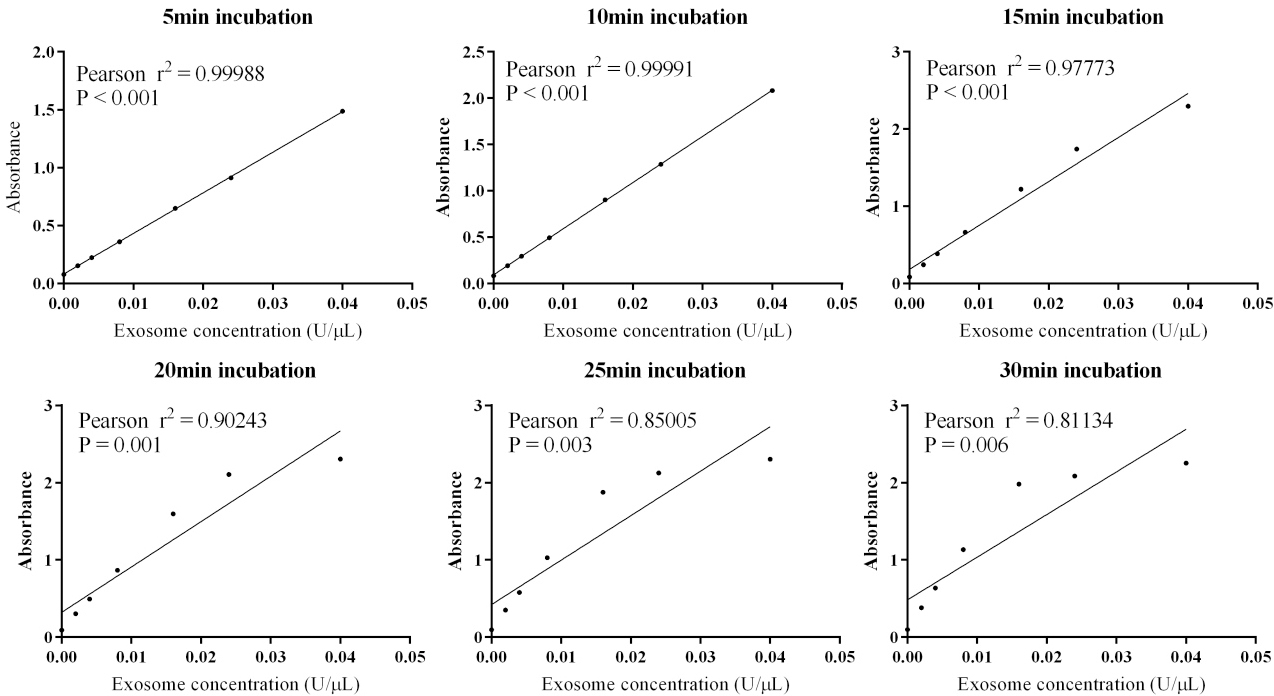
The isolated plasma exosome was characterized as previously reported [29]. Twenty exosome samples of NSCLC patients were all assessed with BCA, AChE, and NTA methods. For AChE activity assays, absorbance was measured at the incubation time of 5 min, 10 min, 15 min, 20 min, 25 min, and 30 min. Standard curve at 10 min has the best linearity (Pearson
NTA results revealed that the median exosome concentration in plasma was 2.10
There were significant correlations between any two of the three quantification methods (Fig. 1). Results of AChE method correlated to NTA results (Pearson
Association between circulating exosome levels and characteristics of NSCLC patients
To explore the association between circulating exosome levels and characteristics of NSCLC patients, 208 plasma exosome samples were assayed with AChE method. Demographic and clinical characteristics of the patients were shown in Table 1. The median follow-up time was 14.40 months (range: 3.43–36.87 months), and 78 (37.5%) patients were dead at the end of study. Circulating exosome level was significantly higher in stage IIIb-IV patients than that in stage I-IIIa (
Kaplan-Meier curves of NSCLC patients based on circulating exosome levels.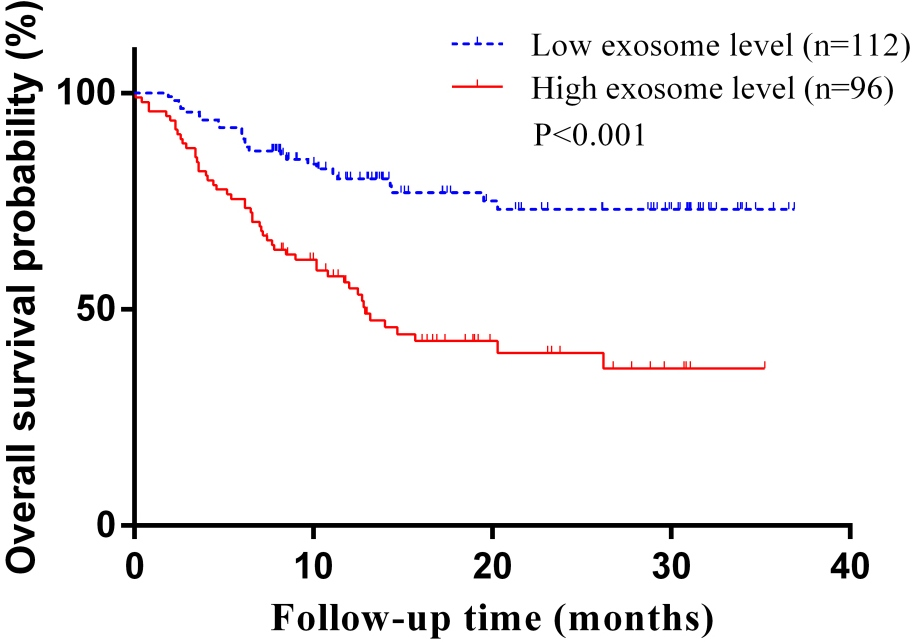
Circulating exosome concentration quantified by AChE method was determined as low or high level using the bioinformatics program X-tile as described in Methods. There were 96 and 112 patients with high and low exosome level, respectively. Univariate analysis indicated that higher exosome level was significantly associated with a shorter OS (
Discussion
Our study employed three methods to perform exosome level quantification, which was a basic need for exosome-related researches. The AChE method correlated better with NTA method than the BCA method did. The AChE quantification method revealed higher circulating exosome concentration in patients with advanced stage or with a history of COPD. In addition, we demonstrated that circulating exosome level was an independent predictor for OS in NSCLC patients.
Exosomes were known to act as garbage bags that expelled excess and/or nonfunctional cellular constituents since their discovery in 1983 [31, 32]. Later on, exosome was found to participate in immune modulation and tumorigenesis [1, 32]. Although exosome researches develop rapidly, relevant methodologies are still not favorable enough to distinguish exosomes from other EVs and microparticles [2, 33]. This is because different EVs and microparticles share overlapping physical properties and molecular compositions [2]. Despite fast development of quantification techniques [34, 35, 36], there is still no general agreement on the gold-standard of exosome concentration determinations. Thus, it is important to compare and evaluate the performance of the current techniques. To the best of our knowledge, the present investigation was the first one to evaluate correlations between BCA, AChE and NTA quantification methods in NSCLC. The BCA and AChE methods are very feasible, and easy to standardize. Moreover, both methods require only a small amount of samples. These features are beneficial for biomarker researches and applications. Correlation analyses indicated that the AChE method was arguably more suitable for exosome quantification than the BCA method.
Using AChE method, this study uncovered the associations of circulating exosome level with patients’ characteristics and OS. These findings suggested that exosome production may be enhanced along with lung cancer progression. Recently, Matsumoto et al. reported that plasma exosome concentration was higher in esophageal cancer patients than that in non-malignant patients, but there was no statistical difference for exosome concentration between different clinical stages [9]. Surprisingly, they demonstrated that a low exosome amount predicted a poor prognosis in esophageal squamous cell carcinoma patients, which seemed inconsistent with our findings in NSCLC. While in the study of Silva et al., they found that plasma exosome level in colorectal cancer patients was statistically higher than that in healthy controls (
The present study revealed that circulating exosome level was higher in NSCLC patients who had a history of COPD. Smoking is one of the major causes for both COPD and lung cancer. Airway remodeling, in which the differentiation of fibroblasts to myofibroblasts plays a pivotal role [38], is one major characteristic of COPD. Recently, Fujita et al. found that exosomes from human bronchial epithelial cells (HBECs) induced with cigarette smoke extract (CSE) could promote myofibroblast differentiation in lung fibroblasts [38]. Further investigation indicated a novel mechanism of airway remodeling through autophagy regulation by exosomal miRNA cargo in response to cigarette smoke exposure in COPD pathogenesis [38]. These results provided interesting clues on the relationship of exosomes with COPD.
Despite some interesting findings, there are several limitations for the present study. Firstly, the precipitated exosomes may co-isolate with some contaminants. It was reported that precipitated exosome contaminated with albumin [23]. Because there were overlapping characteristics among exosomes, microvesicles, and lipoproteins [23, 39], some unwanted particles were probably co-isolated with exosomes. Secondly, all the three quantification methods used in our work have some disadvantages. There is currently no “gold standard” method for exosome quantification, and the NTA method was used as the reference in this study. However, some factors could influence the results of NTA, such as aggregation of exosomes, co-isolation of very-low density lipoprotein or chylomicrons [23]. As for BCA and AChE methods, total protein and AChE activity were deemed as surrogates of total exosomes, respectively. But their representativeness needs more careful investigation. Thirdly, the sample size of the NSCLC prognosis cohort was small.
For the first time, this study evaluated and compared the BCA, AChE and NTA quantification methods for plasma exosome in NSCLC patients. The results demonstrated circulating exosome level as an independent prognostic factor for NSCLC. These findings warrant more stringent, comprehensive investigations in larger NSCLC cohorts.
Footnotes
Acknowledgments
This work was supported by the National Natural Science Foundation of China (No. 81472190, 81672316 and 81171903 to L. Yafei; No. 81370139 to L. Bai), the Chongqing Natural Science Foundation of China (No. CSTC2015jcyBX0110 to L. Yafei). Third Military Medical University Foundation for Clinical Rearch from Xiaoqiao Hospital (No. 2015YLC21 to Z.B. Yu and No. 2014YLC13 to L. Bai).
Conflict of interest
The authors declare no conflict of interest.
Appendix
Supplementary material
Characteristics of samples for correlation analysis and prognosis analysis
Characteristics
Samples for correlation analysis
Samples for prognosis analysis
(
(
Age at diagnosis, mean
59.35
58.73
0.786
Gender
0.378
Male
16 (80.00%)
147 (70.67%)
Female
4 (20.00%)
61 (29.33%)
Smoking status
0.158
Current smoker
9 (45.00%)
108 (51.92%)
Never smoker
5 (25.00%)
71 (34.13%)
Former smoker
6 (30.00%)
29 (13.94%)
Histological type
0.083
Adenocarcinoma
7 (35.00%)
123 (59.13%)
Squamous cell carcinoma
11 (55.00%)
77 (37.02%)
other NSCLC
2 (10.00%)
8 (3.85%)
Pathological stage
0.078
I-IIIa
6 (30.00%)
103 (49.52%)
IIIb-IV
14 (70.00%)
93 (44.71%)
Unknown
0 (0.00%)
12 (5.77%)
History of COPD
0.057
Yes
5 (25.00%)
22 (10.58%)
No
15 (75.00%)
186 (89.42%)
Standard curves of the AChE method at different incubation time.