
Abstract
Background
Precise recognition of neck lymph node metastasis (LNM) is essential for choosing the suitable scope of operation for papillary thyroid cancer(PTC) patients.
Objective
The purpose of our study was to establish an effective nomogram integrating both gene biomarkers and clinicopathologic features for preoperatively predicting LNM in PTC patients.
Methods
We gathered clinical information and gene expression data for PTC samples from The Cancer Genome Atlas database (TCGA). WGCNA and differential analysis were applied to identify LNM-related differentially expressed genes in PTC patients. We developed a risk score based on the 3-gene signature predicting LNM using the LASSO regression analysis. Furthermore, multivariate logistic regression analysis was performed to establish a nomogram. We evaluated the discriminative ability of the nomogram by calculating the area under the ROC curve. Besides, we applied the decision curve analyses and calibration curve to assess the nomogram's actual benefits and accuracy.
Results
Significant predictors of LNM in PTC patients were eventually screened to develop a nomogram, which included age, histological type, focus type, T stage, and risk score calculated based on IQGAP2, BTBD11 and MT1G expression levels. The AUC value of the nomogram for training and validation set was 0.802 (95% CI 0.750–0.855) and 0.718 (95% CI 0.624–0.811). Moreover, the nomogram has outstanding calibration and actual clinical patient benefits.
Conclusions
We identified a nomogram based on the 3-gene signature and clinical characteristics that effectively predicted LNM in PTC patients, which offers guidance for the preoperative assessment the appropriate scope of operation in PTC patients.
Introduction
Thyroid cancer (TC) accounts for 2% to 3% of all human malignant tumors, the frequency of which has increased in the past few decades in different regions around the world because of advancements in diagnostic techniques. In the United States, there will be approximately 43720 new cases of thyroid cancer in 2023. 1 Among the thyroid cancers, 80–85% are papillary thyroid cancers (PTC). PTC generally behaves as indolent tumors clinically, and extensive literature has reported that most PTC patients have advantageous prognoses with high overall survival rates.2–4
PTC tends to metastasize to regional lymph nodes despite showing less aggression. According to reports, the frequency of cervical lymph node metastasis (CLNM) varies between 30 and 80%, and the incidence of lateral lymph node metastasis (LLNM) can reach 64%.5,6 Accumulating evidence has shown that the size and number of metastatic lymph nodes are associated with higher recurrence risk and worse prognosis in PTC patients.7,8 For this reason, the latest American Thyroid Association (ATA) risk stratification system classifies the risk of recurrence in PTC patients based on the size and quantity of metastatic lymph nodes. 9
Surgery was the primary treatment strategy for PTC patients. 10 However, the aggressive lymph node dissection (LND) may result in a variety of postoperative complications, such as hypoparathyroidism, chylous leakage, cervical plexus injury, recurrent laryngeal nerve impairment, neck numbness, etc. thereby reducing the quality of life.11,12 Reducing unnecessary LND dissection must be the foundation for lowering the occurrence of complications. Therefore, precise recognition of neck lymph node metastasis (LNM) is essential for choosing the suitable scope of operation for treating PTC patients.
Ultrasonography is the routine examination for preoperative assessment of neck LNM in PTC patients. Due to air in the trachea, it is not as accurate for the central lymph node compartment, which is the most frequent site of PTC lymph node metastases. 13 Moreover, the diagnostic performance of neck ultrasound varies among physicians. Previous research has indicated that clinicopathological characteristics, such as age, tumor size, multifocality, and thyroid capsular invasion, correlate closely with lymph node metastases in PTC patients.14–16 Currently, some nomograms have been developed to improve the accuracy of predicting LNM, combining clinical and sonographic features, but their performance is not satisfactory.17–19 Accordingly, discovering new diagnostic biomarkers is necessary to improve the accuracy for predicting LNM in PTC patients. In our research, we sought to identify the molecular biomarkers correlated with LNM in PTC patients and then to develop and validate the effectiveness of the nomogram that combines gene biomarkers and clinicopathologic factors for predicting the LNM in PTC patients preoperatively.
Materials and methods
Raw data
We downloaded the clinicopathology data and gene expression data of papillary thyroid carcinoma from The Cancer Genome Atlas database (TCGA). Cases of non-PTC samples and unknown lymph node status were not included. Following the exclusion of patients with insufficient clinical data, 378 samples of papillary thyroid carcinoma were enrolled. According to the
WGCNA co-expression network construction and module correlated with LNM identification
We selected the genes whose expression with highest 25% of the variance (4895 genes) to perform co-expression network analysis with the “WGCNA” package. To begin with, we performed sample clustering in order to exclude outlier samples. Subsequently, we generated an eigengene adjacency heatmap between modules and a cluster dendrogram among modules. For the association between clinical traits and gene modules, the Pearson test was used to find clinically significant modules. We chose an interesting module, which was a gene module that was statistically significant and related to LNM, to perform further analysis.
Enrichment analysis
The top 50 genes from the brown module were submitted to the DAVID database to conduct the Kyoto Encyclopedia of Genes and Genomes (KEGG) and The gene ontology (GO) enrichment analysis. We used the R packages “ggplot2” and “GOplot” to visualize the enrichment results.
Identification of differentially expressed genes(DEGs)
We employed the R package “edgeR” to identify the DEGs related to LNM in patients with PTC among the N0 and N1 PTC samples from the TCGA dataset. p < 0.05 and log2 fold-change (logFC) > 1 were the cut-off value.
Building a gene signature
The Least absolute shrinkage and selection operator (LASSO) regression analysis was performed in order to determine the potential molecular biomarkers for LNM in PTC. Dimension reduction was carried out by the LASSO regression analysis to identify major predictive variables for establishing a gene signature. We used the R package “glmnet” for the LASSO regression analysis. Then, We calculated the risk score based on the level of gene expression and the LASSO regression coefficient of the gene in the built gene signature. The R package “pROC” was used to plot the receiver operating characteristic (ROC) curve and calculate the area under the ROC curve (AUC).
Nomogram construction
In order to identify factors related to LNM in PTC patients, we executed multivariate logistic regression analysis, including the risk score and clinicopathological factors. A forward-backwards stepwise model selection method was applied to select the optimal model according to Akaike's information criterion (AIC). The nomogram for LNM prediction was created using the R package “rms”. The contribution of every factor for predicting LNM in PTC patients was reflected by the length of the line in the nomogram. The ability of discrimination for the nomogram was assessed by plotting the ROC curve and calculating the AUC value. Besides, we used the calibration curve and decision curve analyses (DCA) to evaluate the accuracy and actual benefits of nomogram for clinical patients.
Statistical analysis
We used the R software v3.6.0 (https:// www.r-project.org/) to conduct statistical analysis. For continuous variables, the Student's t test was used, and for categorical variables, the chi-squared or Fisher's exact test was performed. The Wilcoxon test was applied to analyze the gene expression difference among normal thyroid samples, N0 PTC samples and N1 PTC samples. Multivariate logistic regression using the forward-backwards stepwise method was performed to analyze the independent variables related to the LNM. Two-tailed value of p < 0.05 was considered statistically significant.
Results
Clinical features in the TCGA database for PTC patients
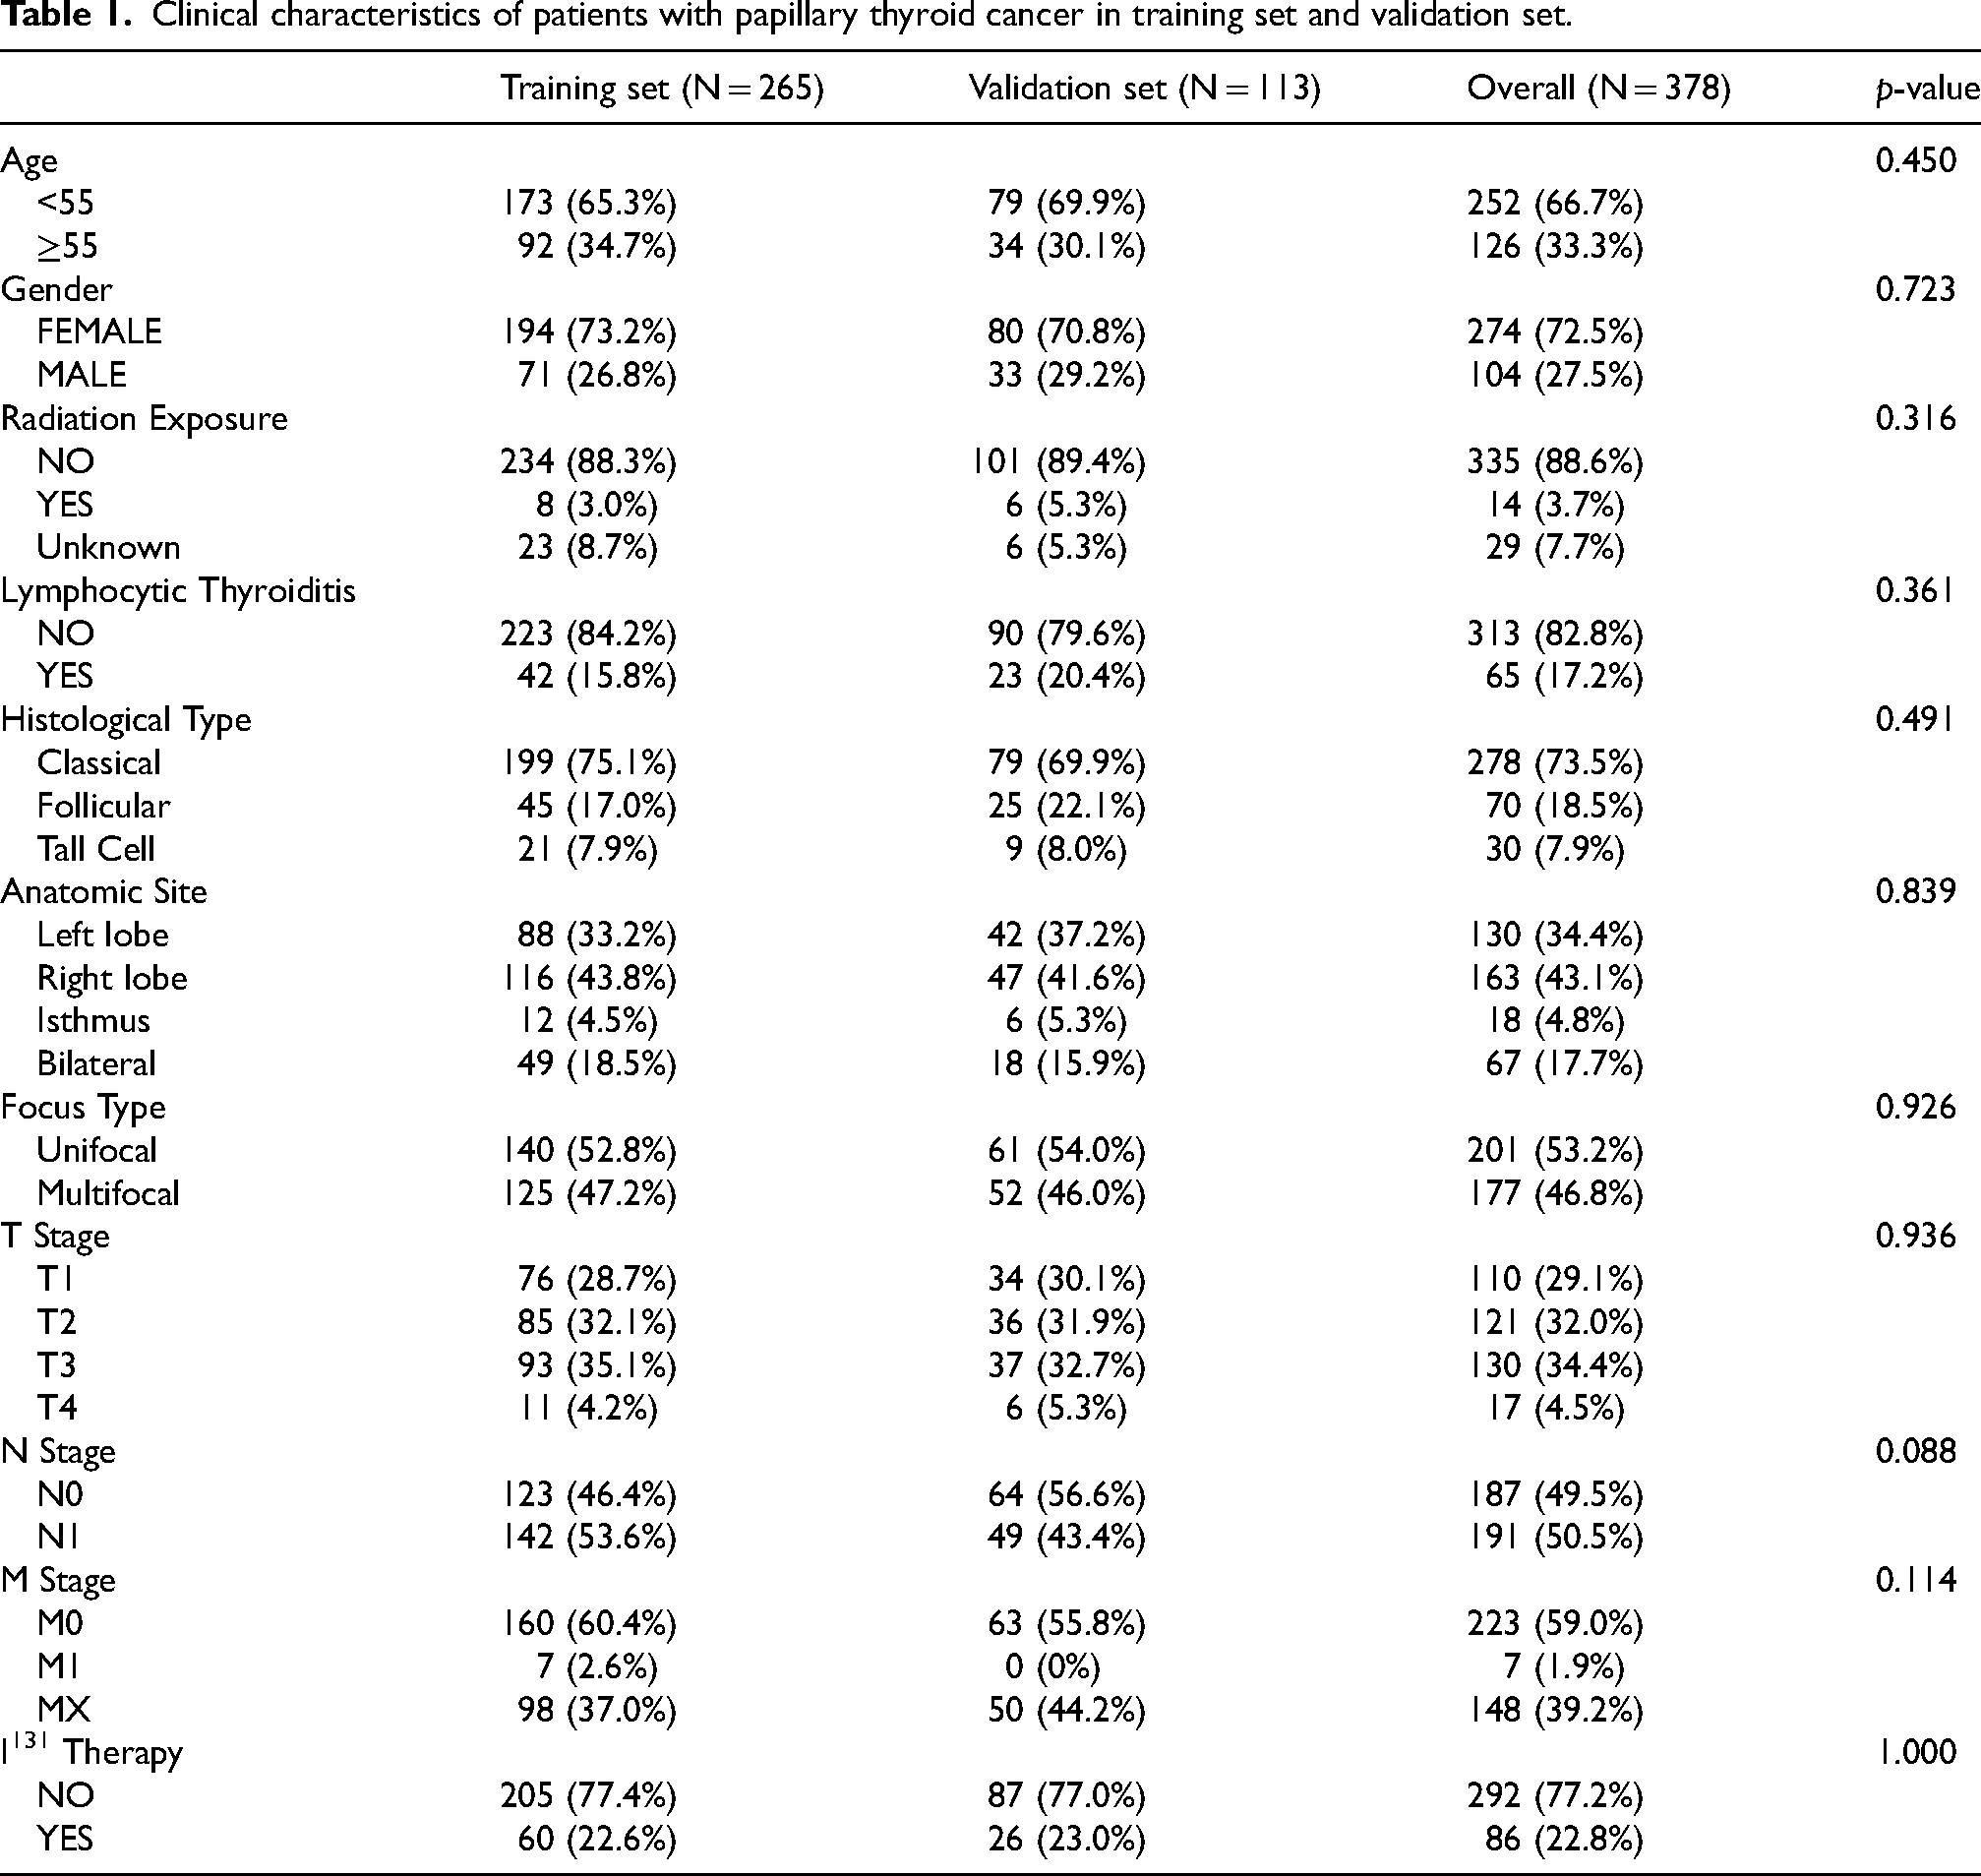
A total of 378 samples had the N stage in our study, of which 187 samples were stage N0 (49.5%) and 191 samples were stage N1 (50.5%). A training set (N = 265) and a validation set (N = 113) were generated from 378 samples based on the lymph node status. The baseline clinical features are shown in Table 1. There was no significant difference between the training and validation sets.
Clinical characteristics of patients with papillary thyroid cancer in training set and validation set.
Identification of LNM-related genes
Fifteen modules were established based on the WGCNA analysis, and we assessed the association between modules and clinical characteristics (Figure 1(a)). The brown module, with a strong association with the N stage, was chosen as a hub module. Subsequently, we draw a scatterplot for the brown module, showing Module Membership vs Gene Significance (Figure 1(b)). We selected the top 50 intra-module connection genes as LNM-related genes. Afterwards, We used the DAVID database to perform KEGG enrichment analysis and GO enrichment analysis in order to learn more about the functions of LNM-related genes. The majority of genes participated in the thyroid hormone generation process, protein metabolic process and cellular response to electrolyte according to the GO enrichment analysis. Four KEGG pathways were significantly enriched, which include protein processing in the endoplasmic reticulum, metabolic pathways, protein export and thyroid hormone synthesis (Figure 2).
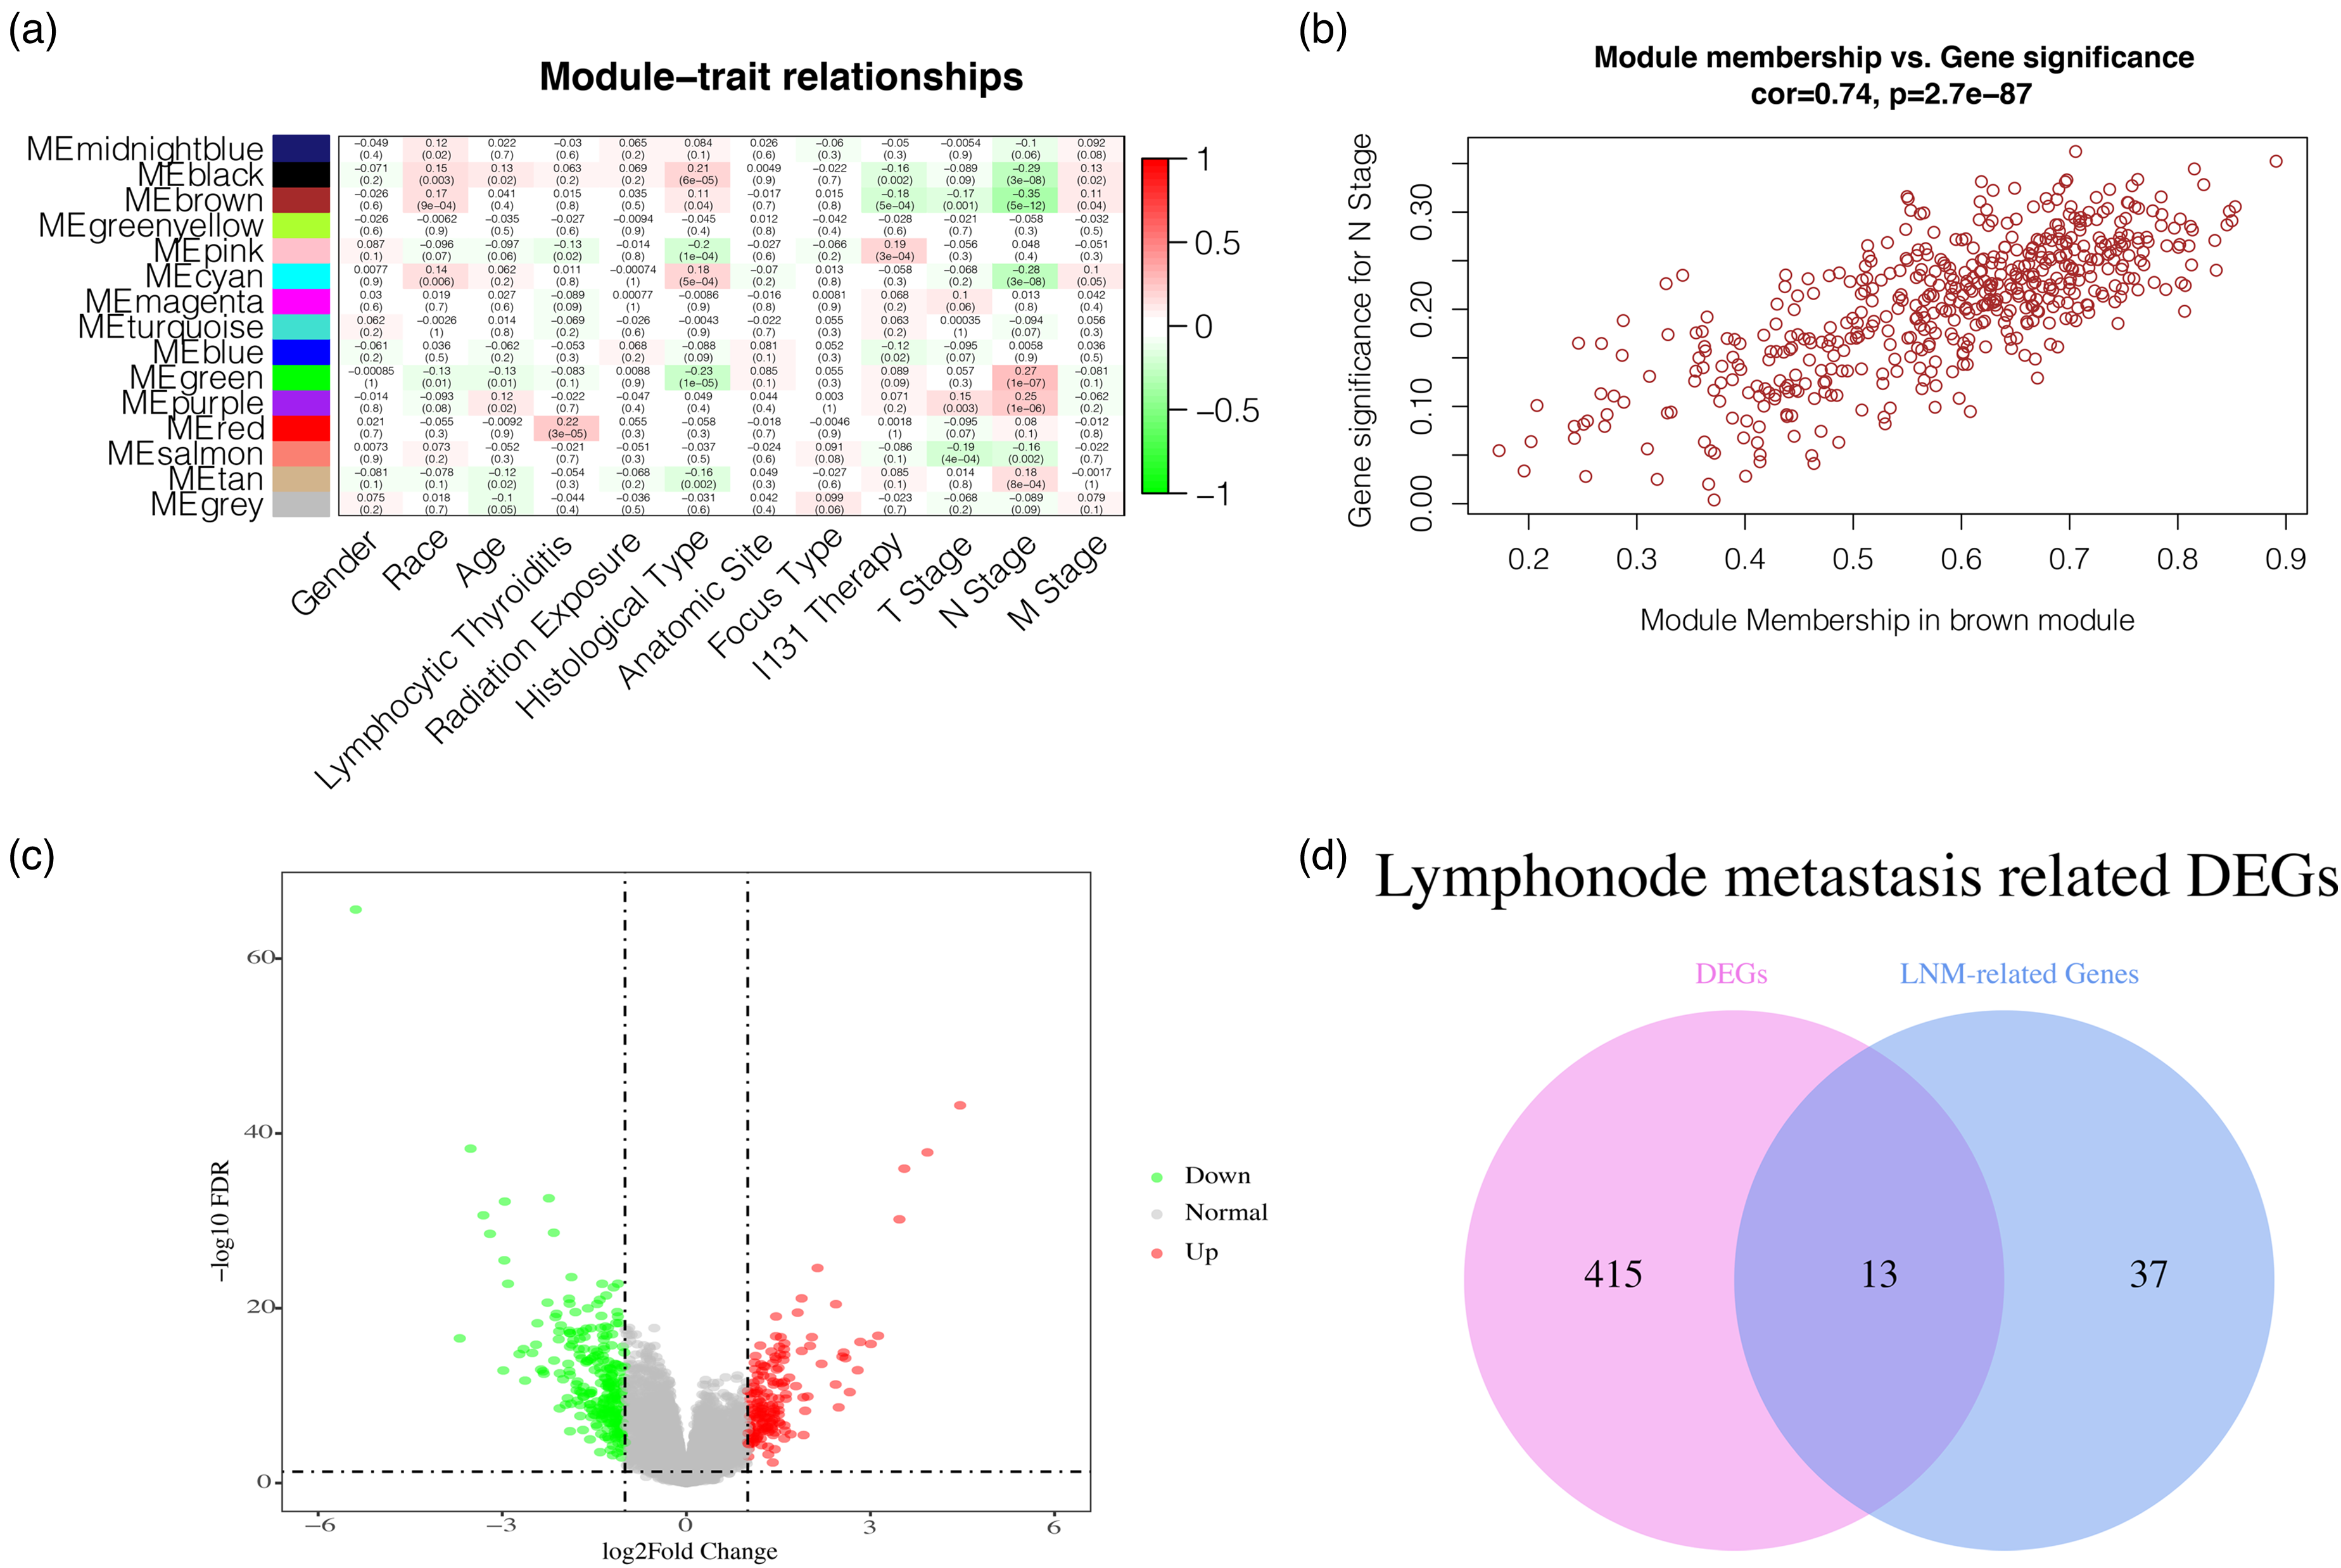
Determination of lymph node metastasis (LNM) related differentially expressed genes(DEGs) in patients with papillary thyroid cancer (PTC). (a) Correlation between clinical characteristics and the gene module. (b) Scatterplot of Module Membership (MM) in the brown module vs Gene Significance (GS) for N stage. (c) Volcano diagram of DEGs comparing N0 PTC samples and N1 PTC samples, which include 263 down-regulated genes and 165 up-regulated genes. (d) The overlap of DEGs and LNM-related genes result in thirteen crossing genes which were chosen as LNM-related DEGs, also known as hub genes.
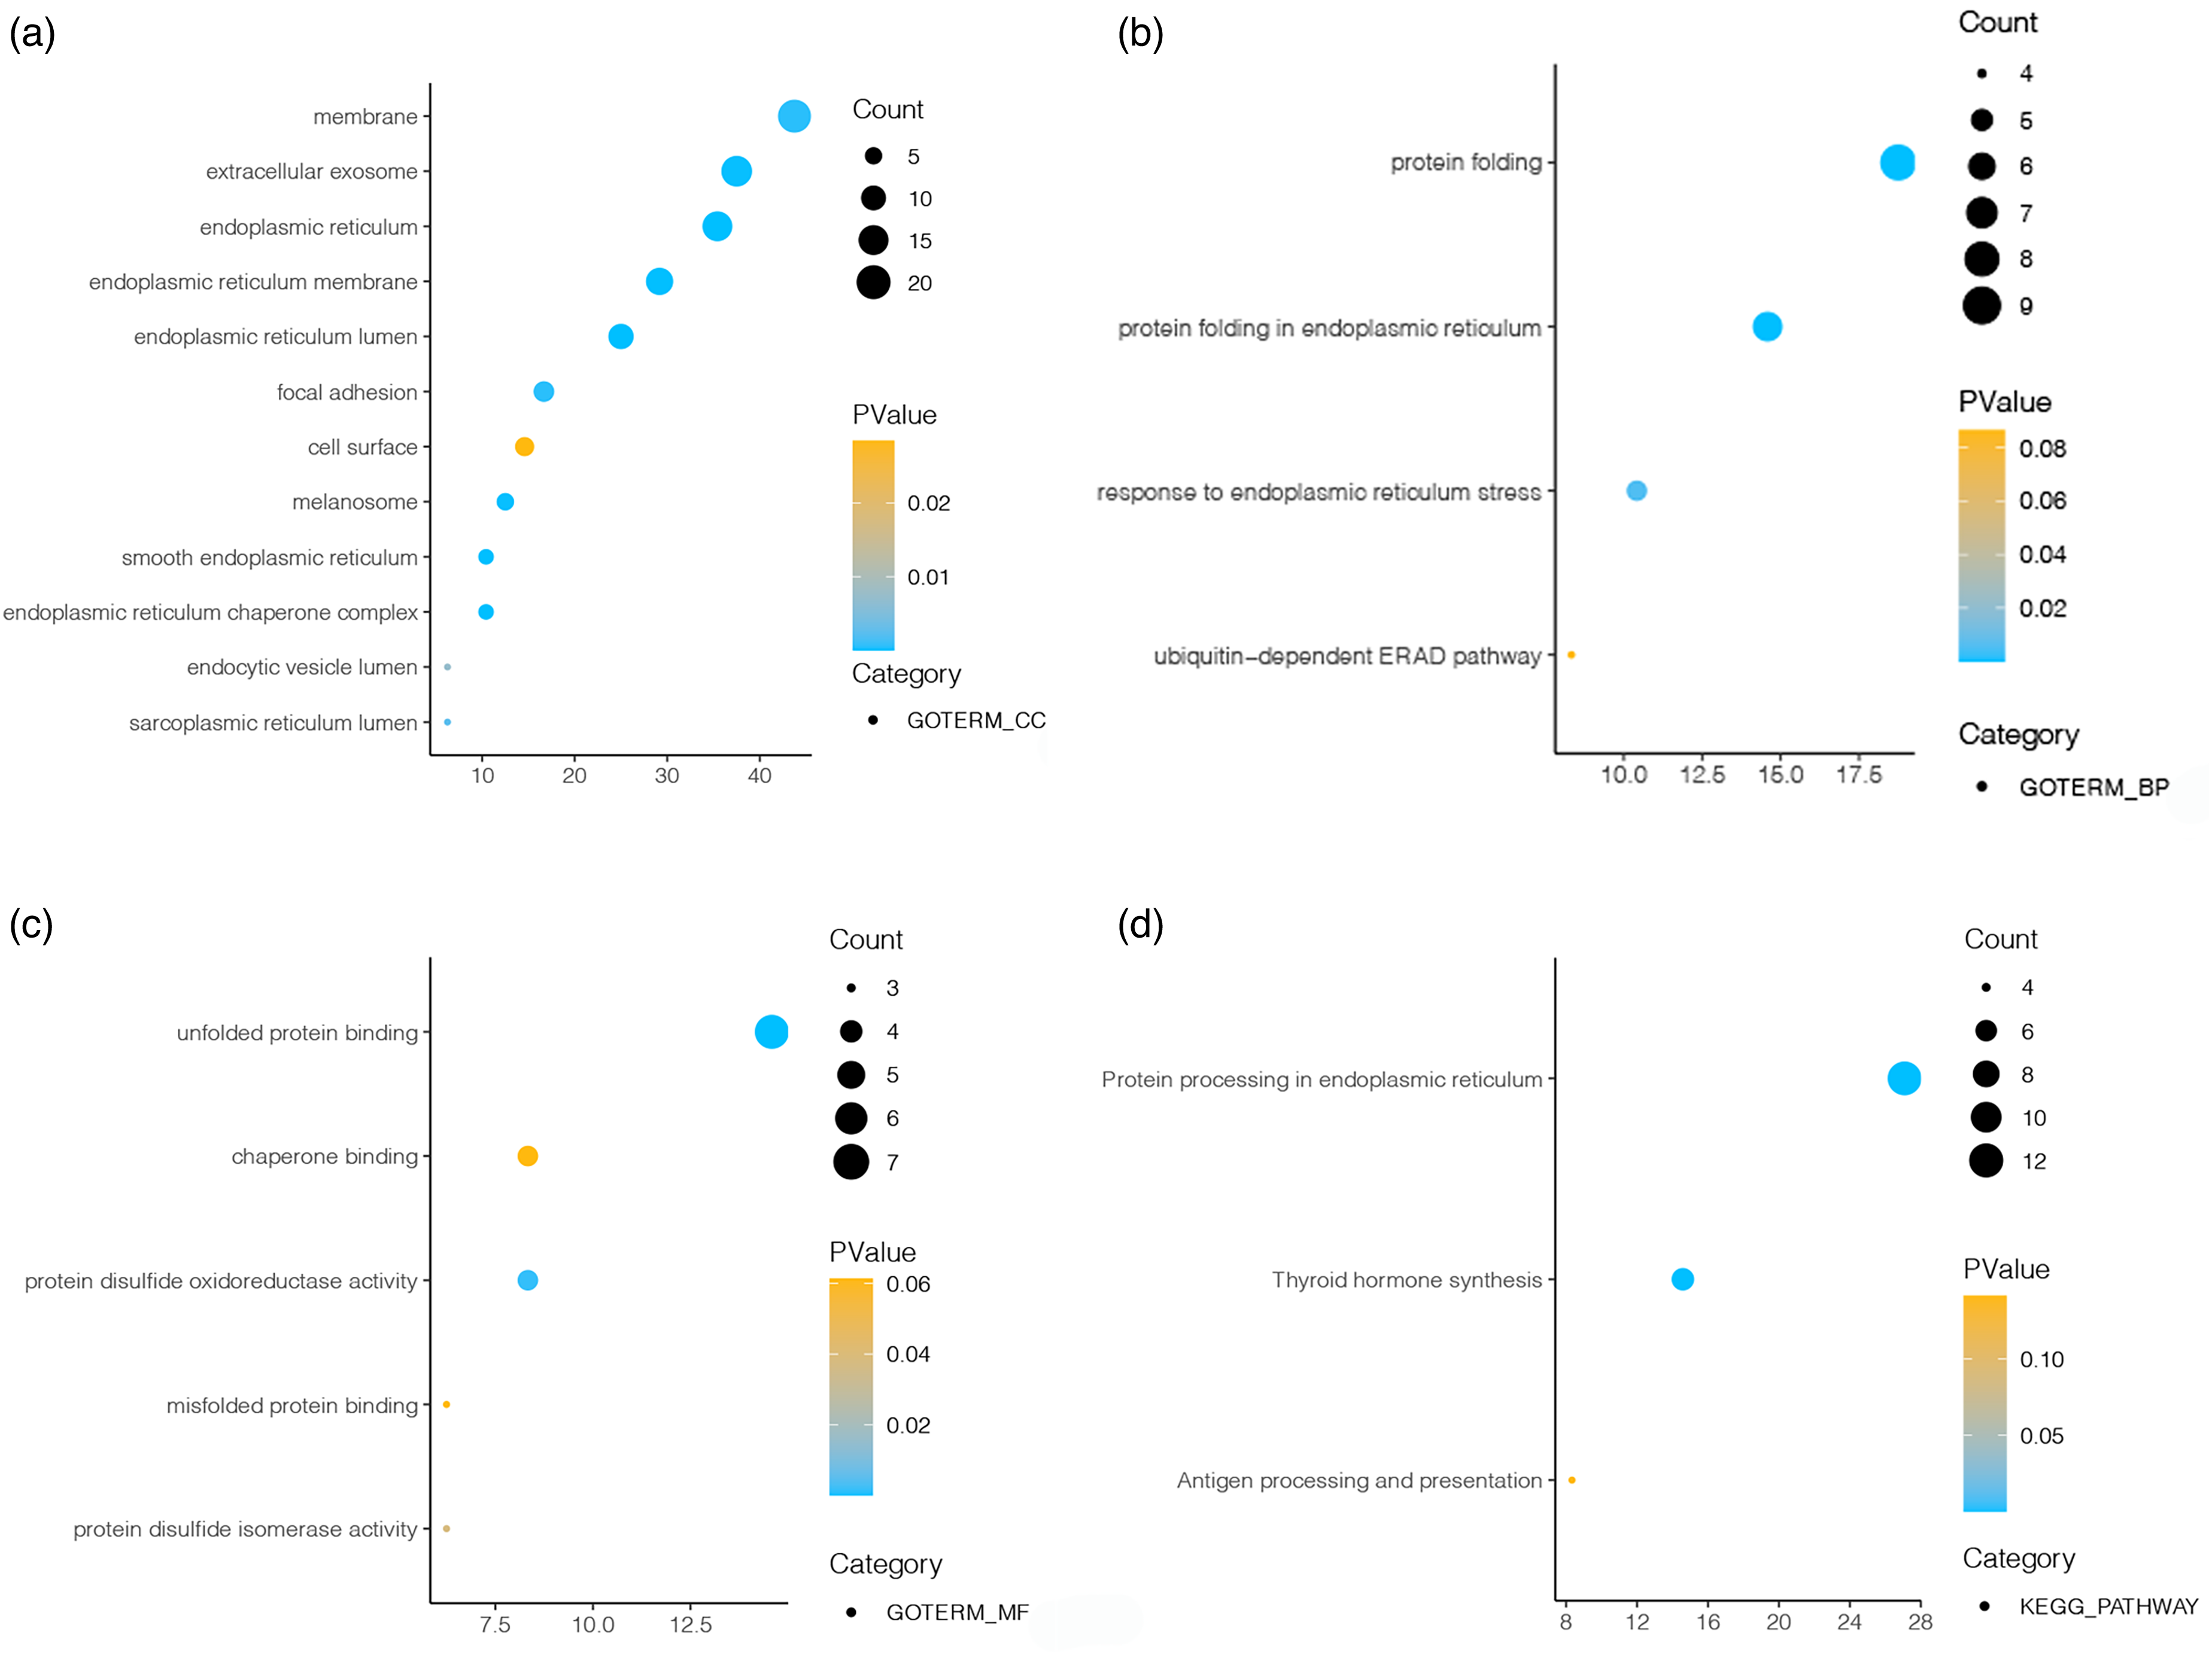
The KEGG and GO enrichment analysis of LNM-related genes. (a–c) GO enrichment analysis shows cellular component(CC), molecular function(MF) and biological process(BP) the LNM-related genes. (d) KEGG pathway enrichment analysis of the LNM-related genes.
Identification of DEGs
In the TCGA database, 428 DEGs were found by comparing N0 PTC samples and N1 PTC samples. Of these, 263 down-regulated genes and 165 up-regulated genes (|logFC| > 1 and FDR < 0.05). Figure 1(c) shows the volcano plot for the down- and up-regulated genes. The intersection analysis was performed between the LNM-related genes and the DEGs, and thirteen overlapped genes were chosen as hub genes, including TPO, HGD, SLC4A4, SORBS2, IQGAP2, ELMO1, SLC26A4, FAM167A, ZMAT4, SLC5A8, BTBD11, MT1F and MT1G (Figure 1(d)). Besides, we confirm the difference in expression of 13 hub genes among normal thyroid samples, N0 of PTC samples and N1 of PTC samples (Figure 3).
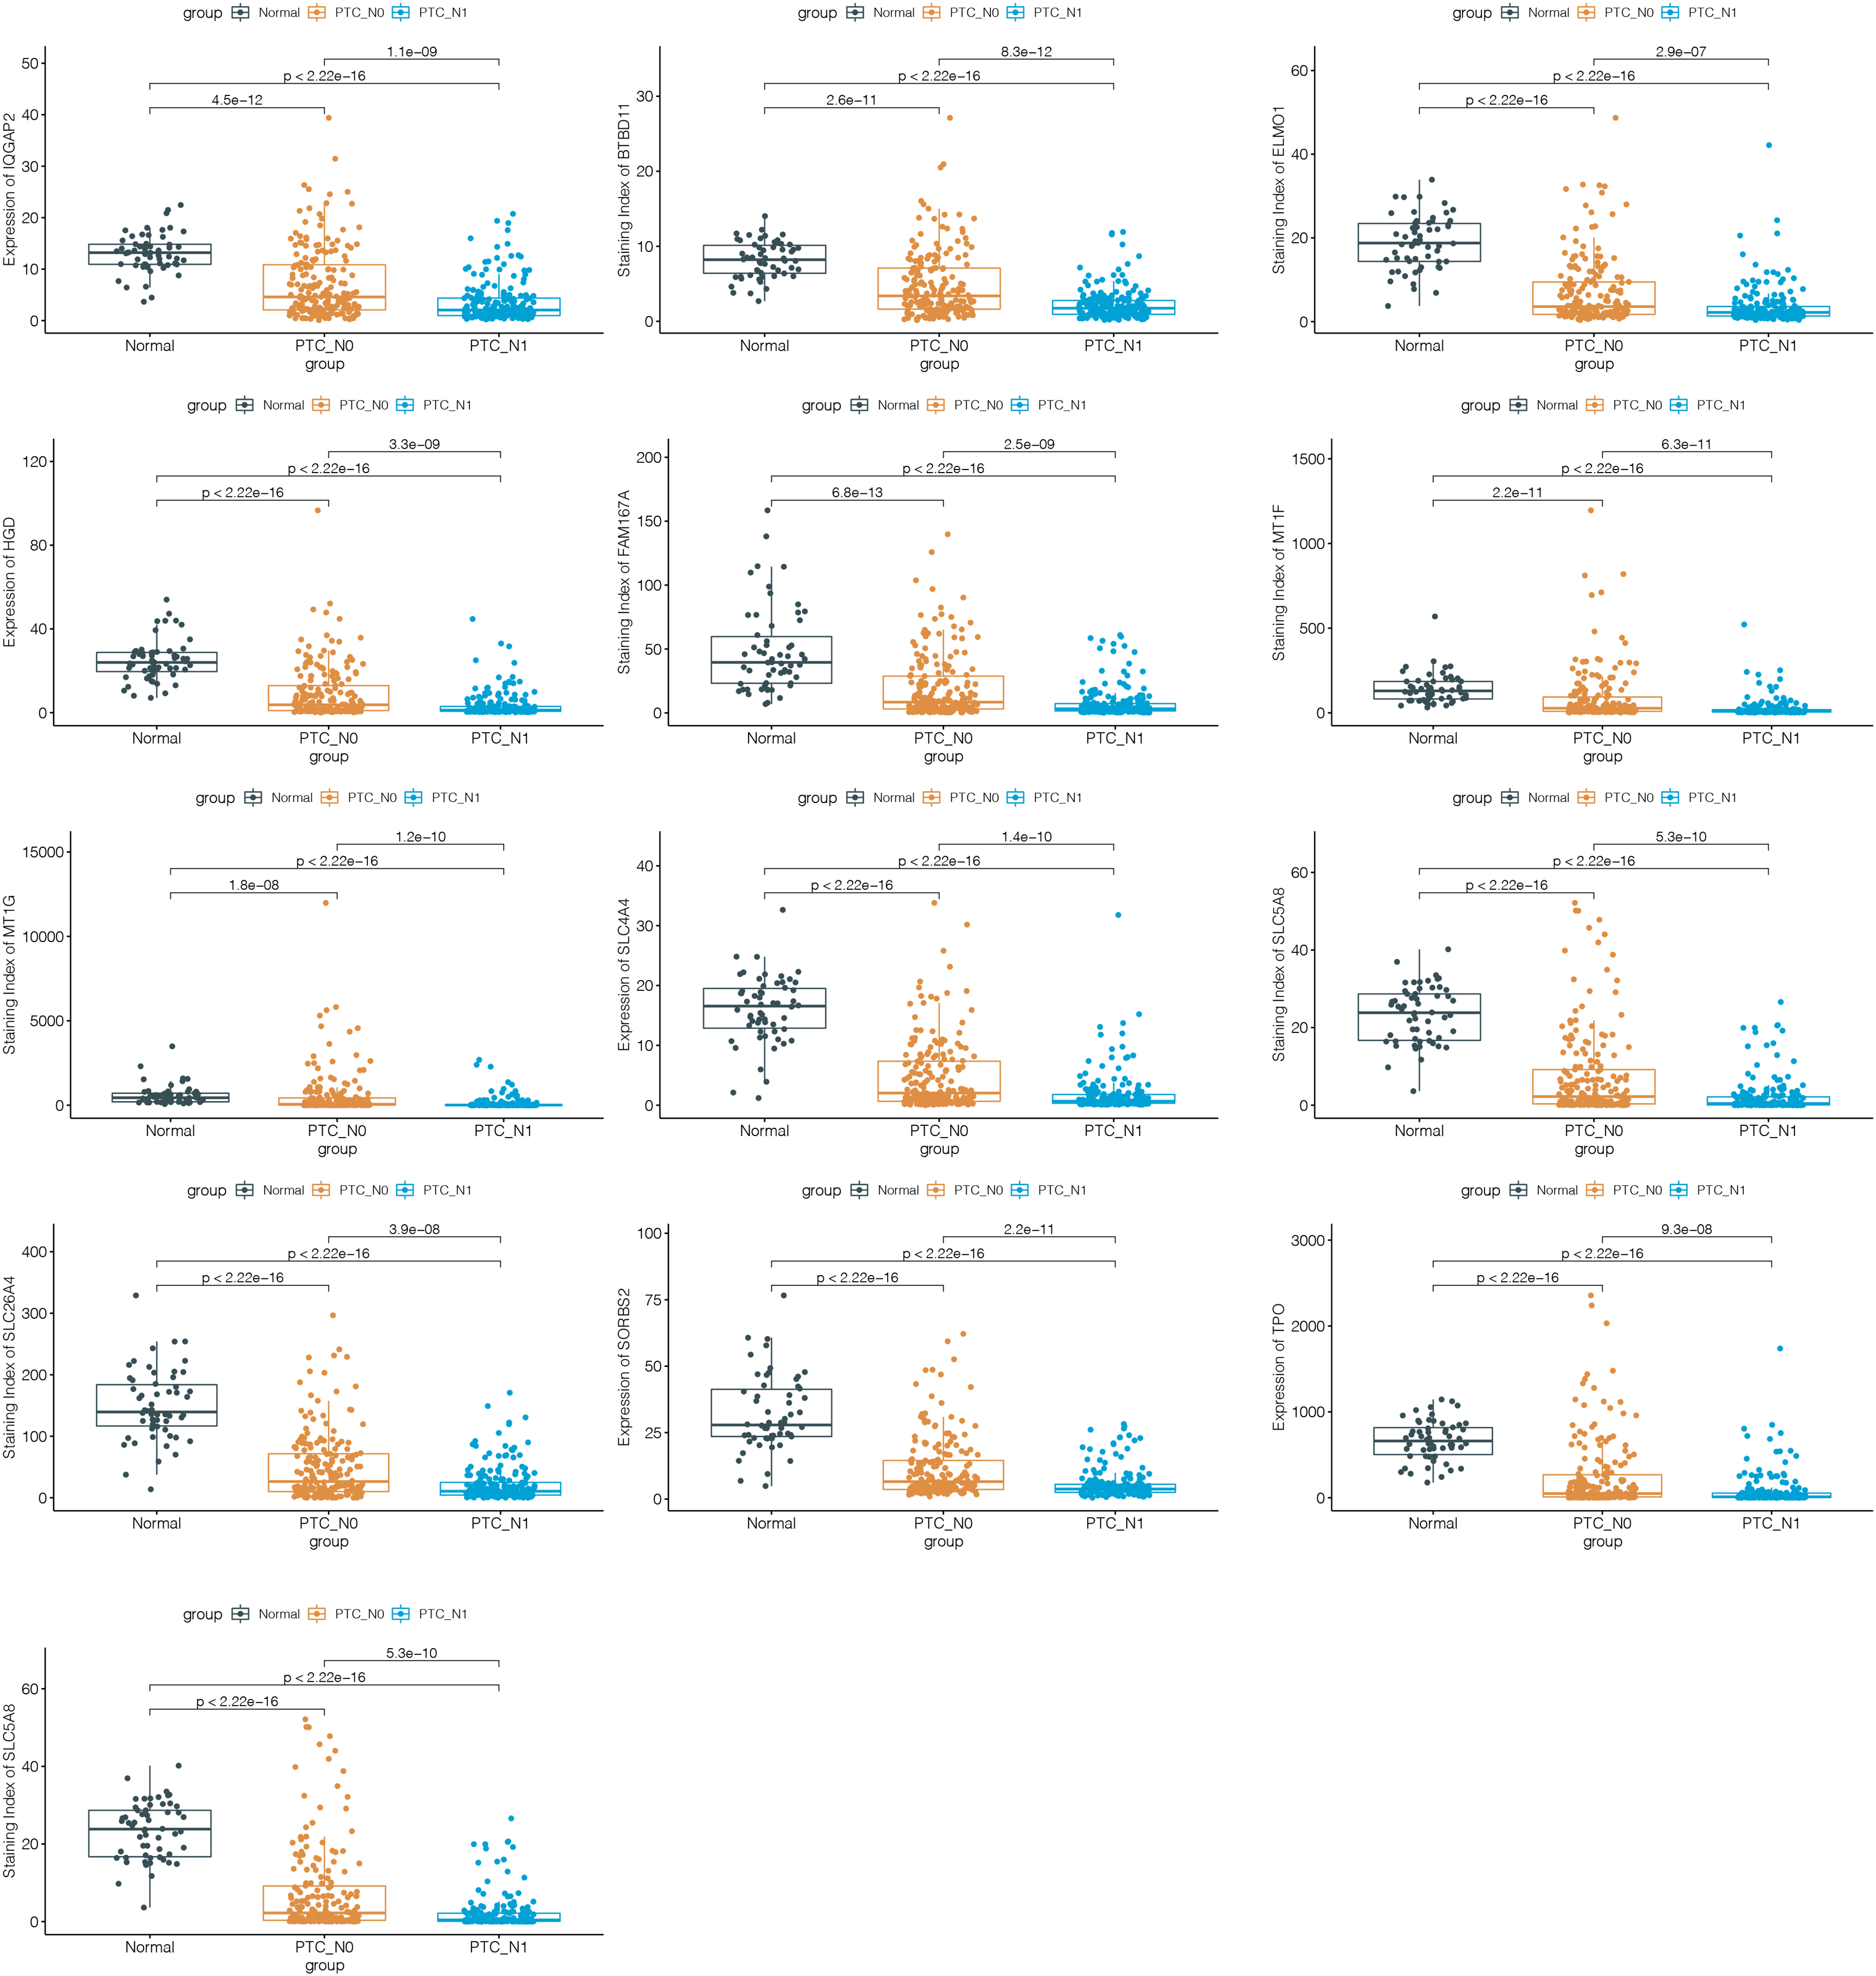
Differentiated expression of hub genes among normal thyroid samples, N0 of PTC samples and N1 of PTC samples, which was assessed by the Wilcoxon test.
Construction and verification of risk score for predicting LNM in PTC patients
In the training set, we conducted LASSO regression analysis among the 13 hub genes to identify potential prognostic genes for predicting LNM. Ultimately, a 3-gene signature model was established, and the risk scores of each patient were calculated, including IQGAP2, BTBD11 and MT1G (Figure 4(a) and (b)). Then, the ROC curves of risk scores predicting LNM were generated and the AUC value of risk scores was calculated. The AUC value of risk scores was 0.733 [95% confidence interval (CI): 0.672–0.794], indicating that risk scores behaved well in predicting the LNM in PTC patients (Figure 4(c)).
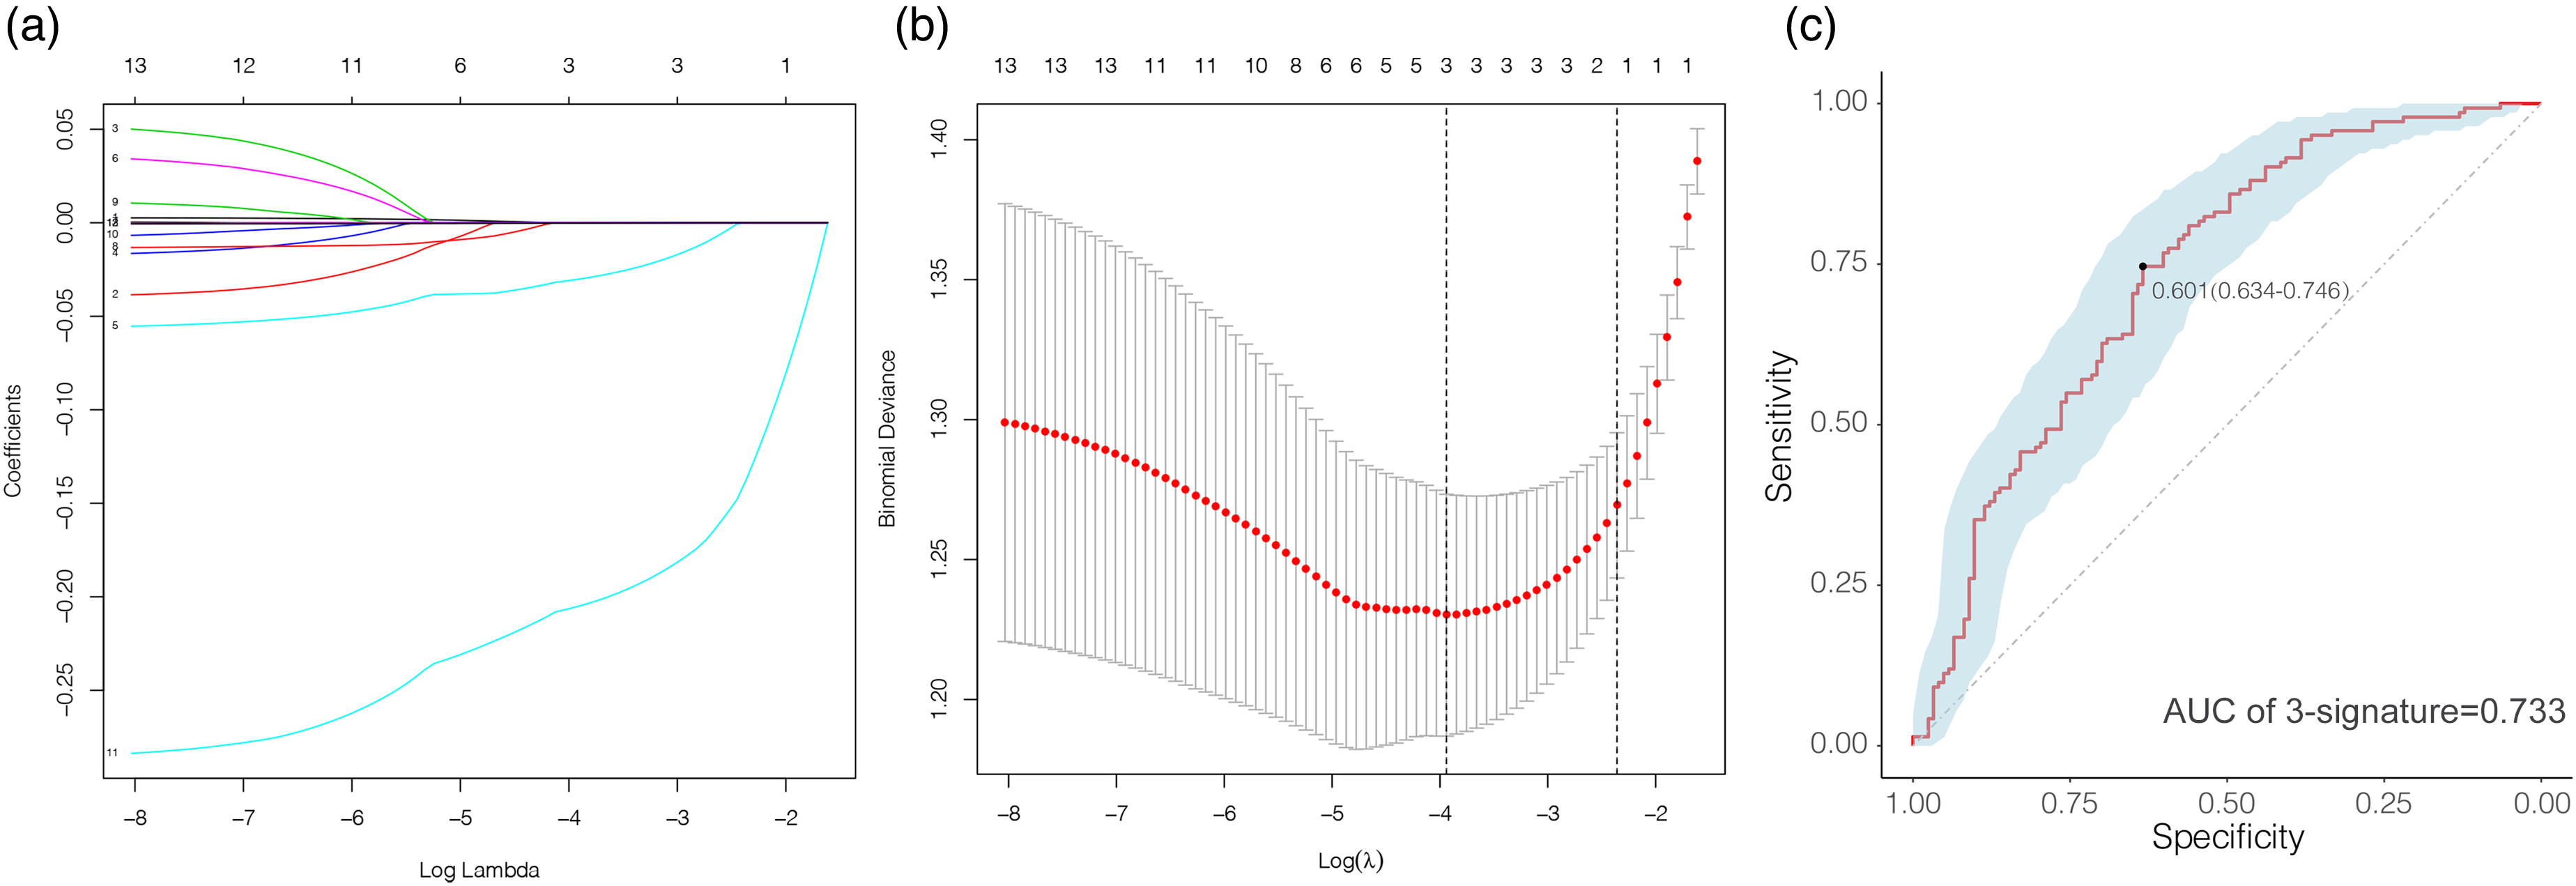
Predictive value of 3-gene signature for LNM in PTC patients. (a, b) Determination of the 3-gene signature by least absolute shrinkage and selection operator(LASSO) regulation analysis. (c) Receiver operating characteristic (ROC) curve of 3-gene signature for predicting LNM in PTC patients.
Constructing the optimal model for predicting LNM in PTC patients
Patients were divided into two groups: high-risk (risk score ≥0.601) and low-risk (risk score <0.601) based on the best cut-off identified by the ROC curve (0.591). Using the risk score group and clinical features (age, gender, radiation exposure, histological type, lymphocytic thyroiditis, anatomic site, focus type, T stage) as covariates, the logistic regression with forwards backwards step-wise AIC was run to obtain optimal model based on the Akaike criterion. The results indicated age(≥55 vs <55 odds ratio (OR) = 0.440, 95% CI: 0.231–0.837, p = 0.012), histological type(follicular vs classical OR = 0.167, 95% CI: 0.062–0.453, p < 0.001), focus type (multifocal vs unifocal OR = 2.079, 95% CI: 1.127−3.835, p = 0.019), T stage(T3 vs T1 OR = 3.904, 95% CI: 1.839−8.289, p < 0.001; T4 vs T1 OR = 32.231, 95% CI: 3.341−310.911, p = 0.003) and risk score group(high-risk group vs low-risk group OR = 3.494, 95% CI: 1.857−6.574, p < 0.001) were significant predictors of LNM in PTC patients (Figure 5(a)). Subsequently, we displayed the outcomes of logistic regression analysis and developed a nomogram in order to offer a quantitative approach to estimate a patient's probability of LNM for the clinician (Figure 5(b)).
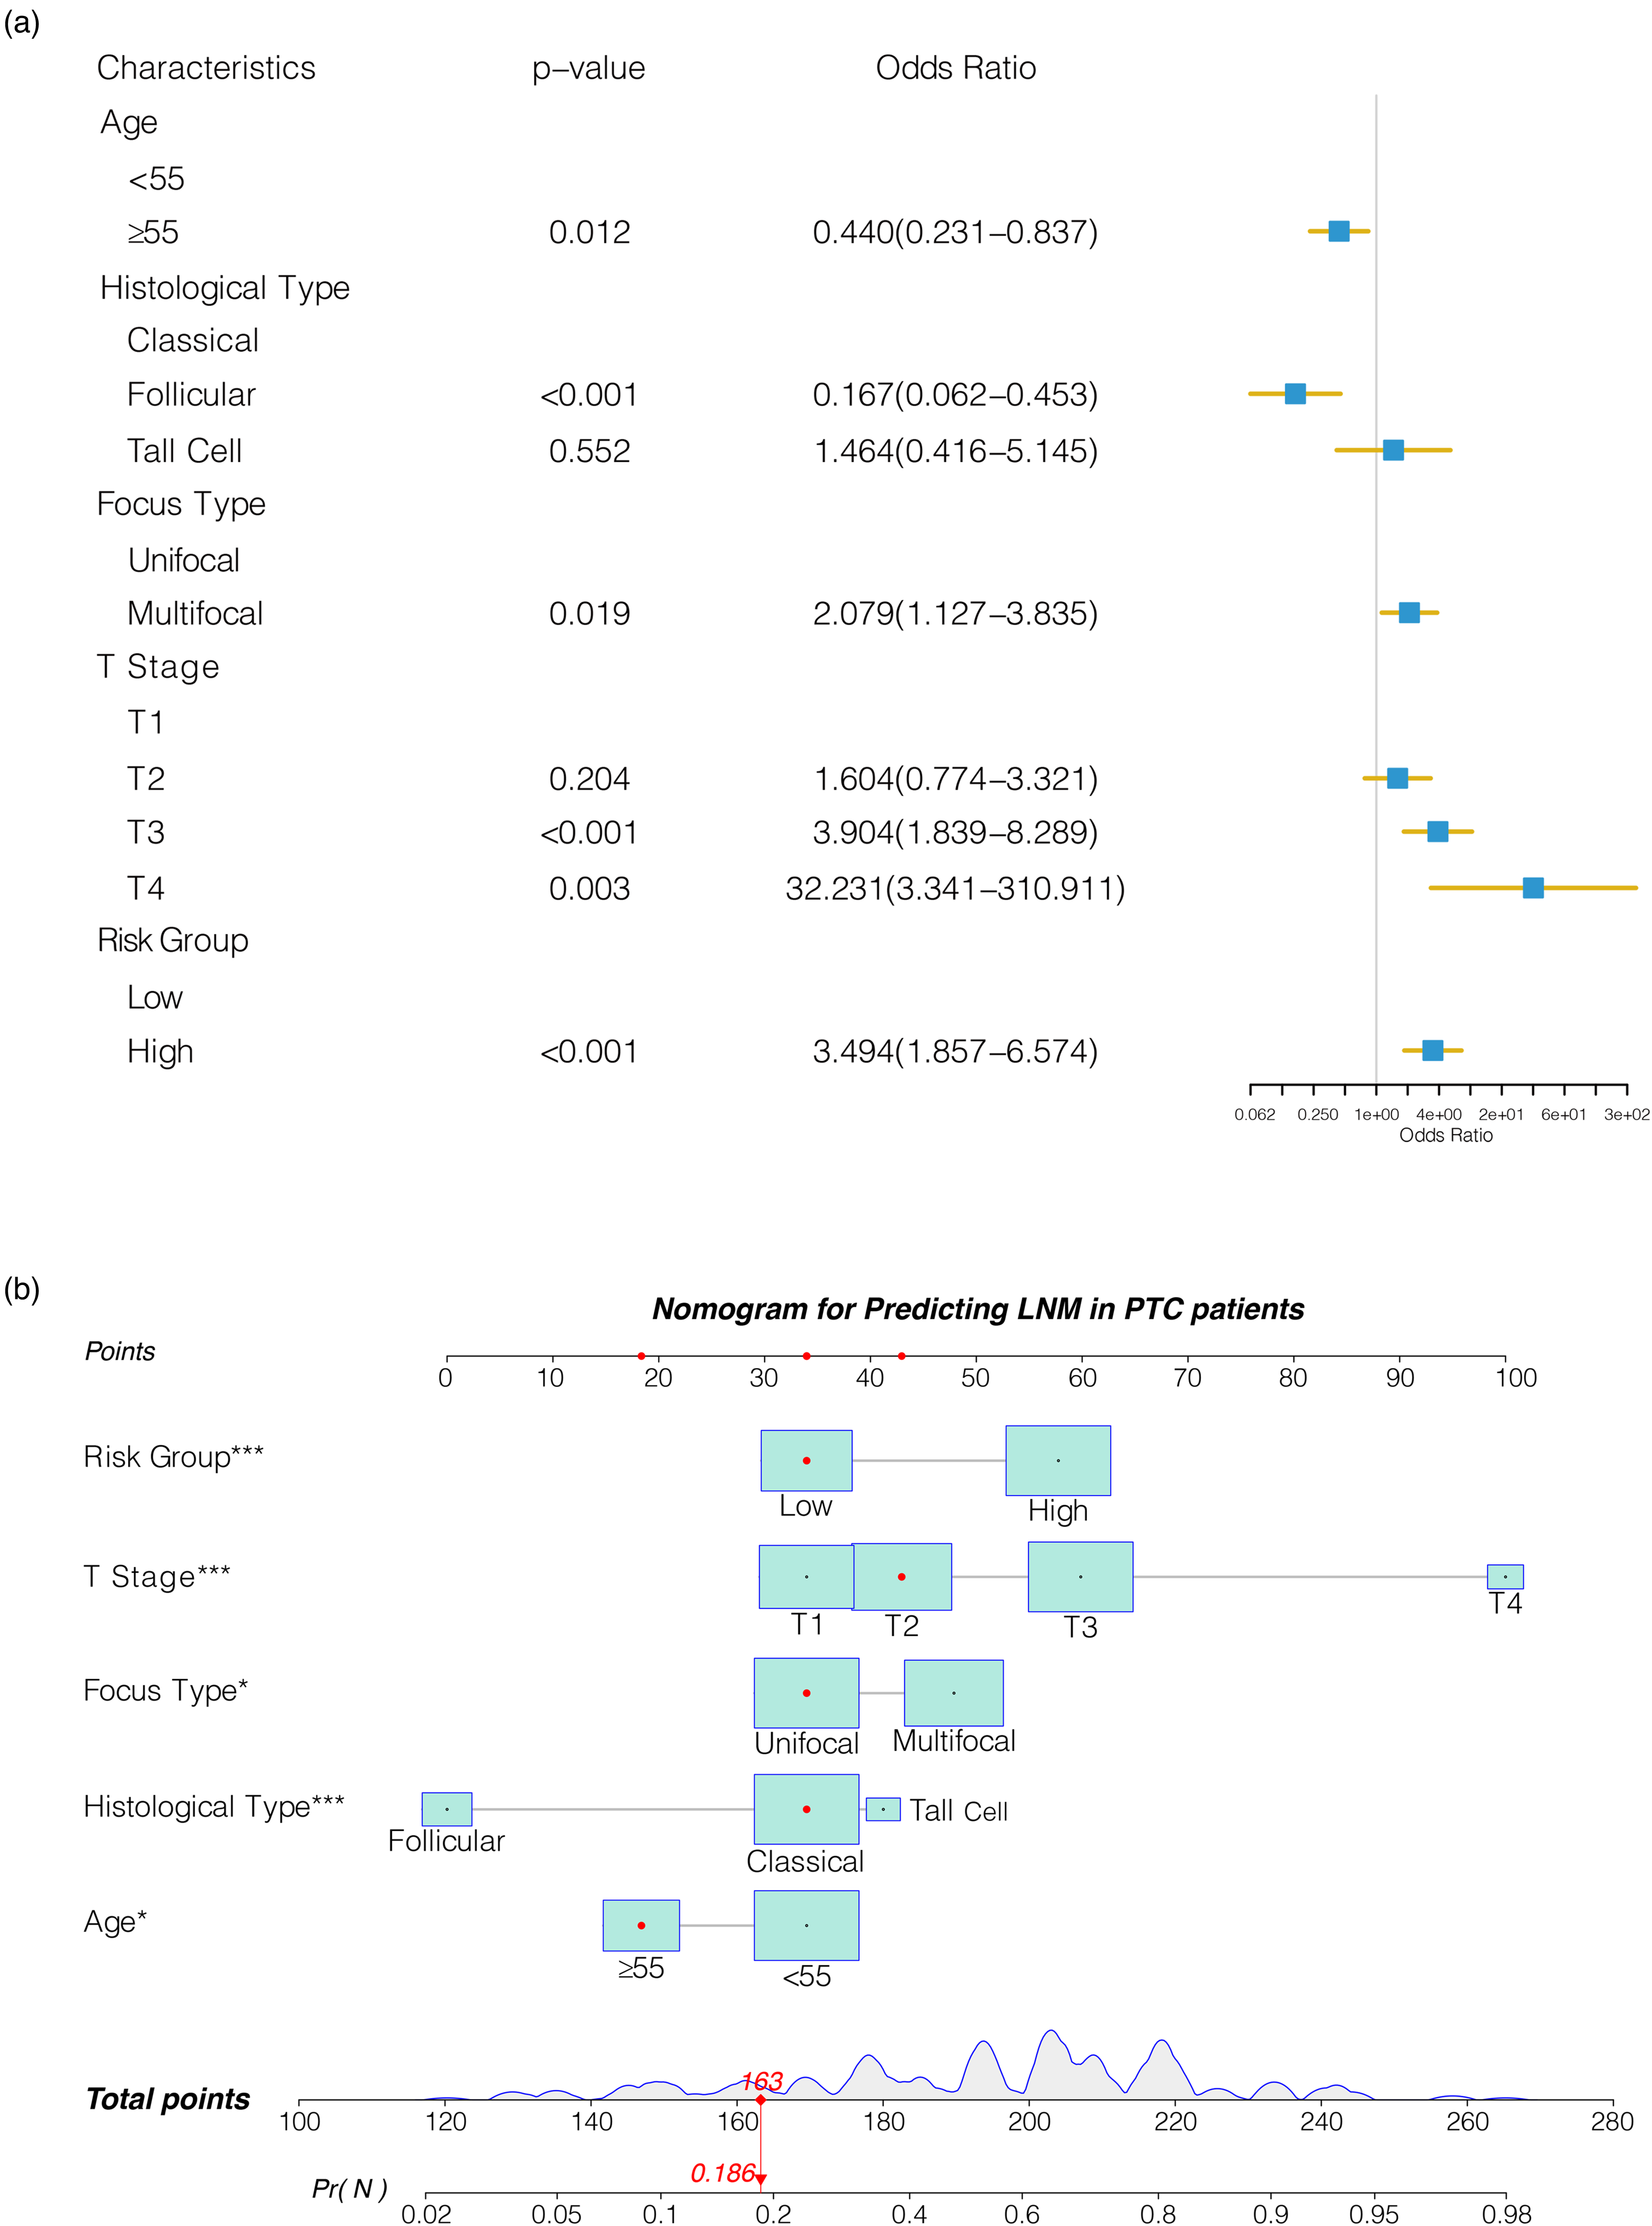
Establishment of nomogram for predicting LNM in PTC patients. (a) Forest diagram of multivariable logistic regression analysis. (b) Nomogram that combines risk score group and clinicopathological characteristics.
Performance of nomogram
The performance of the nomogram was assessed using ROC curves, calibration curves and DCA curves. Firstly, we depicted the ROC curve in the training set and validation set, which results presented that the AUC values of nomogram were 0.802 (95% CI 0.750–0.855) in the training set and 0.718 (95% CI 0.624–0.811) in the validation set. Besides, we compared the prediction performance of the nomogram and the model constructed only by clinical features, and the results demonstrated that the nomogram's prediction performance outperformed the model built only by clinical features (Figure 6(a) and (b)). Then, the bootstrap method was used to develop the calibration curve. The calibration curve demonstrated an excellent consistency between the predicted value based on the nomogram and the actual state of LNM, which was further verified in the validation set. Meanwhile, the DCA curve displayed that the nomogram provided a significantly greater net benefit level than the “full intervention” and “non-intervention” schemes, indicating that the nomogram has actual clinical patient benefits.
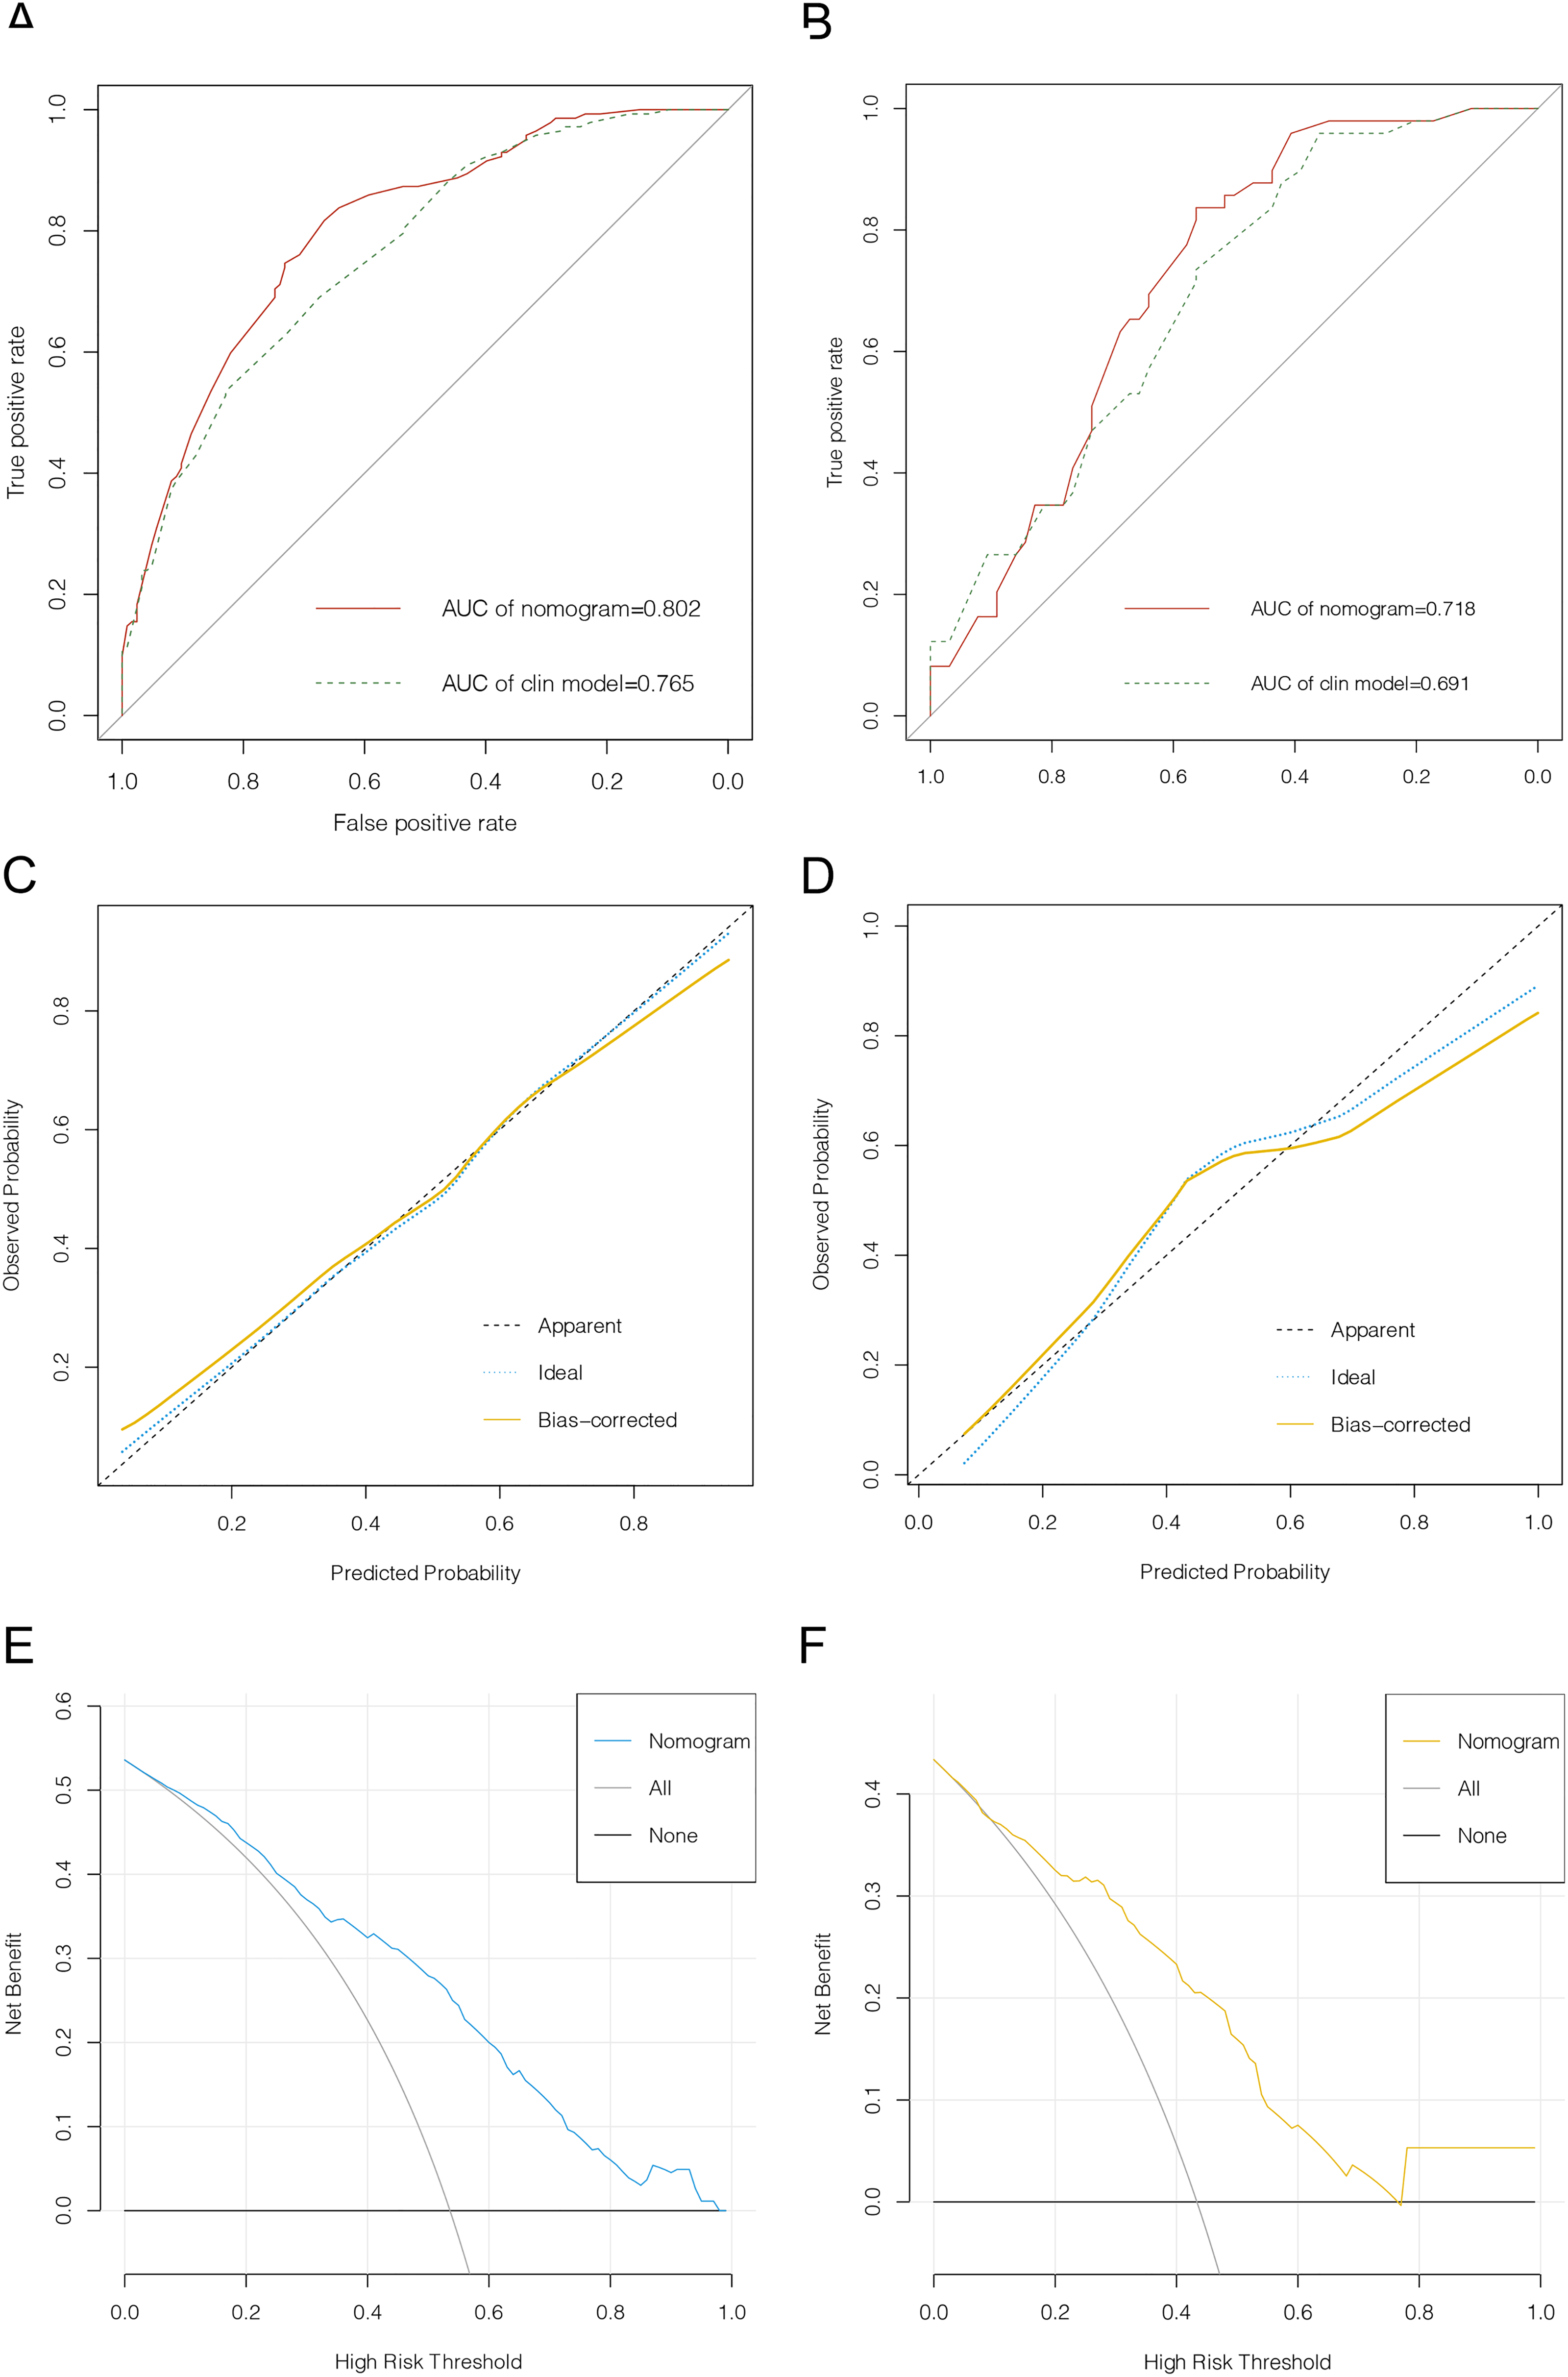
Evaluation of nomogram for predicting LNM in PTC patients. (a) ROC curve of nomogram for training cohort. (b) ROC curve of nomogram for validation cohort. (c)Calibration curve of nomogram for training cohort. (d)Calibration curve of nomogram for validation cohort. (e)Decision curve analyses of nomogram for training cohort. (f) DCA of nomogram for validation cohort.
Discussion
The status of lymph nodes is important for selecting the surgical scope of patients with papillary thyroid carcinoma. While neck ultrasonography (US) is frequently employed in clinical practice to assess lymph node status, the diagnostic ability of neck US varies among clinicians. Consequently, greater accuracy tools are required to evaluate the risk of LNM in patients with PTC. In our research, we developed a nomogram for predicting lymph node metastasis based on the clinicopathological features and mRNA signature to estimate the probability of lymph node metastasis, which will help to formulate a precise strategy for lymph node dissection. Moreover, identifying biomarkers associated with LNM is also helpful in researching the underlying mechanisms of LNM in patients with PTC.
Reviewing some previous articles related to LNM in PTC, our study confirmed their results that younger age, multifocality, larger tumor size and extrathyroidal invasion were independent risk factors for LNM in patients with PTC. 15 Our studies showed LNM was positively related to the T stage, as the later of the T stage, the incidence of LNM increased, which indicated the larger tumor and extrathyroidal extension (T4 stage refers to gross extrathyroidal extension invading surrounding tissues from a tumor of any size excluding invading only strap muscles) were the risk factors for LNM. Therefore, the status of lymph nodes should be evaluated more carefully for PTC patients with the above risk factors.
In recent years, many have attempted to discover the best approach for clinically assessing the status of lymph nodes in PTC patients. Feng et al. analyzed the clinical characteristics of PTC patients from the SEER database and developed a nomogram to predict cervical lymph node metastasis in PTC patients. 14 Although their training nomogram achieved a C-index of 0.733, this index was still unsatisfactory. There were many nomograms based on ultrasound features for predicting LNM of PTC.20–22 However the US signature was evaluated using subjective criteria, which may cause biased results. With the growth of bioinformatics technology and high-throughput sequencing, a few LNM biomarkers have been discovered in studies that have already been published. Some studies demonstrated BRAFV600E mutation status was statistically significantly related to regional lymph node metastases.23–25 After analyzing the expression levels of miRNAs in paraffin-embedded PTC tissue samples, Daina et al. found a correlation between higher expression levels of miR-146b, miR-222, miR-21, and miR-221 and LNM in PTC patients. 26 Wang and colleagues identified 21 DEGs related to lymph node metastases in PTC patients based on TCGA database analysis and finally found hypomethylation and hyper-expression of TM4SF1 are related to LNM in PTC patients. 27 In our study, we identified 13 LNM-related DEGs through WGCNA and differential analysis. Then, a 3-gene signature for predicting lymph node metastases in patients with PTC was constructed using the LASSO regression analysis. Furthermore, a nomogram was developed and validated that incorporates 3-genes signature and clinicopathological properties for individualized prediction of lymph node metastases in PTC patients, which was more objective and has a higher C-index than the nomogram constructed with clinicopathological characteristics and ultrasound features. The AUC value of the training set was 0.802 and the validation set was 0.718. Meanwhile, the calibration curves indicated that the nomogram was well calibrated, and the DCA curve demonstrated that the nomogram has actual clinical benefits for patients. Compared with previous similar studies,28,29 our 3-gene signature contained fewer genes while achieving higher AUC values, indicating that it might be readily applicable in clinical practice.
Even though our nomogram has a favourable predictive capacity, there are still some limitations to our research, which we will tackle in the following studies. Firstly, the nature of this research is retrospective. Generally speaking, retrospective studies usually have more biases and errors than prospective research. Secondly, Our study's clinical and transcriptome data were only derived from publicly available TCGA datasets. Therefore, the accuracy of the nomogram should be further assessed using clinical samples, which limits its clinical application. Additionally, the sample size was insufficient to demonstrate the significance of several potential factors, so more research with a bigger sample size is required.
Conclusions
In conclusion, we identified 3 LNM-related DEGs in PTC patients, which was helpful to explore the underlying mechanisms of LNM in PTC patients. More importantly, the nomogram was constructed and validated that incorporates 3-genes signature and clinicopathological properties for predicting LNM in PTC patients, which can accurately estimate LNM before surgery and offer some guidance for assessing the condition of patients with PTC and the selection of clinical diagnosis and treatment strategies.
Footnotes
Author contributions
Yan Yang and Da-Song Wang played a role in conception and design of the study. Lei Yang, Yun-Hui Huang and Yu He were participated in revising the article for important intellectual content. Mao-Shan Chen, Zheng-Yan Wang and Li Fan contributed to interpret data. Hong-Wei Yang read and approved the final version of the submitted manuscript and coordinated the whole process.
Funding
The authors received no financial support for the research, authorship, and/or publication of this article.
Declaration of conflicting interests
The authors declared no potential conflicts of interest with respect to the research, authorship, and/or publication of this article.