
Abstract
Objective
Preoperative evaluation of lateral lymph node metastasis (LLNM) in patients with papillary thyroid carcinoma (PTC) has been one of the major clinical challenges. This study aims to develop and validate iodine nutrition-related nomogram models to predict lateral cervical lymph node metastasis in patients with PTC.
Methods
This is a retrospective study. Urinary iodine concentration (UIC) and serum iodine concentration (SIC) were measured in 187 LLNM patients and 289 non-LLNM (NLLNM) patients. All patients were randomized 3:1 into the training cohort (n = 355) and the validation cohort (n = 121). Using logistic regression analysis, we analyzed the influence of iodine nutrition-related factors and clinicopathological characteristics on LLNM in PTC patients. Lasso regression method was used to screen risk factors and construct a nomogram for predicting LLNM. The receiver operating characteristic curve (ROC curve), calibration curve, and decision curve analysis (DCA) of the nomogram models were carried out for the training and validation cohorts.
Results
Gender, SIC, smoking history, drinking history, family history of PTC, multifocality, bilateral or unilateral tumors, TSH, Tg, and tumor size were included in the nomogram model predicting LLNM, with an area under the curve (AUC) of .795. The nomogram model showed good calibration and clinical benefit in both the training and validation cohorts.
Conclusion
The nomogram model based on iodine nutrition and other clinicopathological features is effective for predicting the lateral lymph node metastasis in PTC patients.
Introduction
Thyroid cancer is the most common endocrine malignancy. According to the latest global cancer statistics report, thyroid cancer is the 11th largest malignant tumor in the world, with 3.0% of new cases and .4% of deaths. 1 While papillary thyroid carcinoma (PTC) is the most common thyroid malignancy, accounting for 85% of the cancers. In recent years, thanks to the feasibility and sensitivity of ultrasound examination, the diagnosis of thyroid cancer, especially papillary thyroid cancer, has increased rapidly, and its incidence remains increasing after the exclusion of these factors.2-4 PTC is less malignant, but it is characterized by lateral lymph node metastasis (LLNM). LLNM is significantly associated with local recurrence and distant metastasis in PTC patients, which is an important factor affecting the prognosis of patients. 5
Iodine is an essential trace element for thyroid hormone synthesis and normal thyroid function.6,7 There is a U-shaped relationship between iodine intake and thyroid diseases (including thyroid cancer). 8 A meta-analysis of 16 case–control studies showed a positive correlation between high iodine levels and PTC. 9 Urinary iodine concentration (UIC) is considered to be the gold standard for evaluating the iodine status of the population because about 90% of dietary iodine is excreted through urine. 10 Some studies have pointed out that indicators including serum iodine concentration (SIC), serum thyroid-stimulating hormone (TSH), and thyroglobulin (Tg) concentrations11-13 are also biomarkers that can be used to evaluate iodine nutrition status. In the clinic, the detection of thyroid-stimulating hormone (TSH), free triiodothyronine (FT3), free thyroxine (FT4), thyroglobulin (TGAb) antibody, antithyroid microsomal antibody (TMAb), and serum thyroid globulin (TG) are the basic tests reflecting the thyroid function of patients.
Many risk factors for thyroid cancer have been identified, such as female hormones, family history, radiation exposure, chemical carcinogens, and iodine nutritional status. 14 Age, gender, tumor size, extrathyroidal extension (ETE), bilateral tumor, and multifocal tumor are important risk factors for LLNM of PTC.15-17 PTC is prone to early lymph node metastasis, but the existing screening methods cannot accurately determine its aggressiveness. In the current situation of conservative monitoring of thyroid nodules and non-surgical treatment for small or isolated cancerous nodules, 18 identification of LLNM before treatment has a significant impact on the surgical method of patients and whether to implement radioiodine therapy after surgery.19,20 We found that there is no study to predict LLNM by combining iodine nutritional status with clinical information of patients; therefore, new risk prediction models are urgently needed to predict the probability of LLNM in PTC patients. Therefore, we combined iodine nutrition-related biomarkers with important risk factors for PTC and LLNM, collected relevant information of PTC patients, and developed and validated a nomogram model based on iodine nutrition and clinical characteristics of PTC to predict LLNM.
Materials and methods
Study design
This study is a retrospective study. The study was approved by the Harbin Medical University Cancer Hospital Ethics Review Committee. The approval number is HRBMUECDC 20210410. All patients agreed to include their blood and urine examination and clinicopathological information in the study and signed written consent. The patient data was collected from 2015 to 2018. The inclusion criteria were as follows: 1. Patients with first diagnosis of PTC; 2. patients who plan to undergo neck dissection (lateral lymph node dissection) in Harbin Medical University Cancer Hospital; those with the following conditions were excluded: 1. Taking iodine-containing drugs; 2, previously diagnosed with other thyroid diseases; 3. patients with abnormal liver and kidney function. In this study, all patients with PTC underwent the neck lymph node dissection. LLNM was defined as ≥1 LLNM found by surgical dissection, otherwise, defined as non-LLNM(NLLNM). Finally, 476 patients were included. All patients were randomly divided into a training cohort and a validation cohort in a 3:1 ratio. There are 355 people in the training cohort and 121 in the validation cohort. Univariate logistic regression was performed on the training cohort to find possible independent prognostic factors. Then the prediction model was established by lasso regression. Validation was performed using the validation cohort. Screening flow chart of all patients is shown in Figure 1. The reporting of this study conforms to TRIPOD guidelines.
21
Flowchart for inclusion and exclusion of patients with PTC. Patients in the training cohort were used to screen independent risk factors and establish a nomogram. Testing cohort was used to test the accuracy of the model.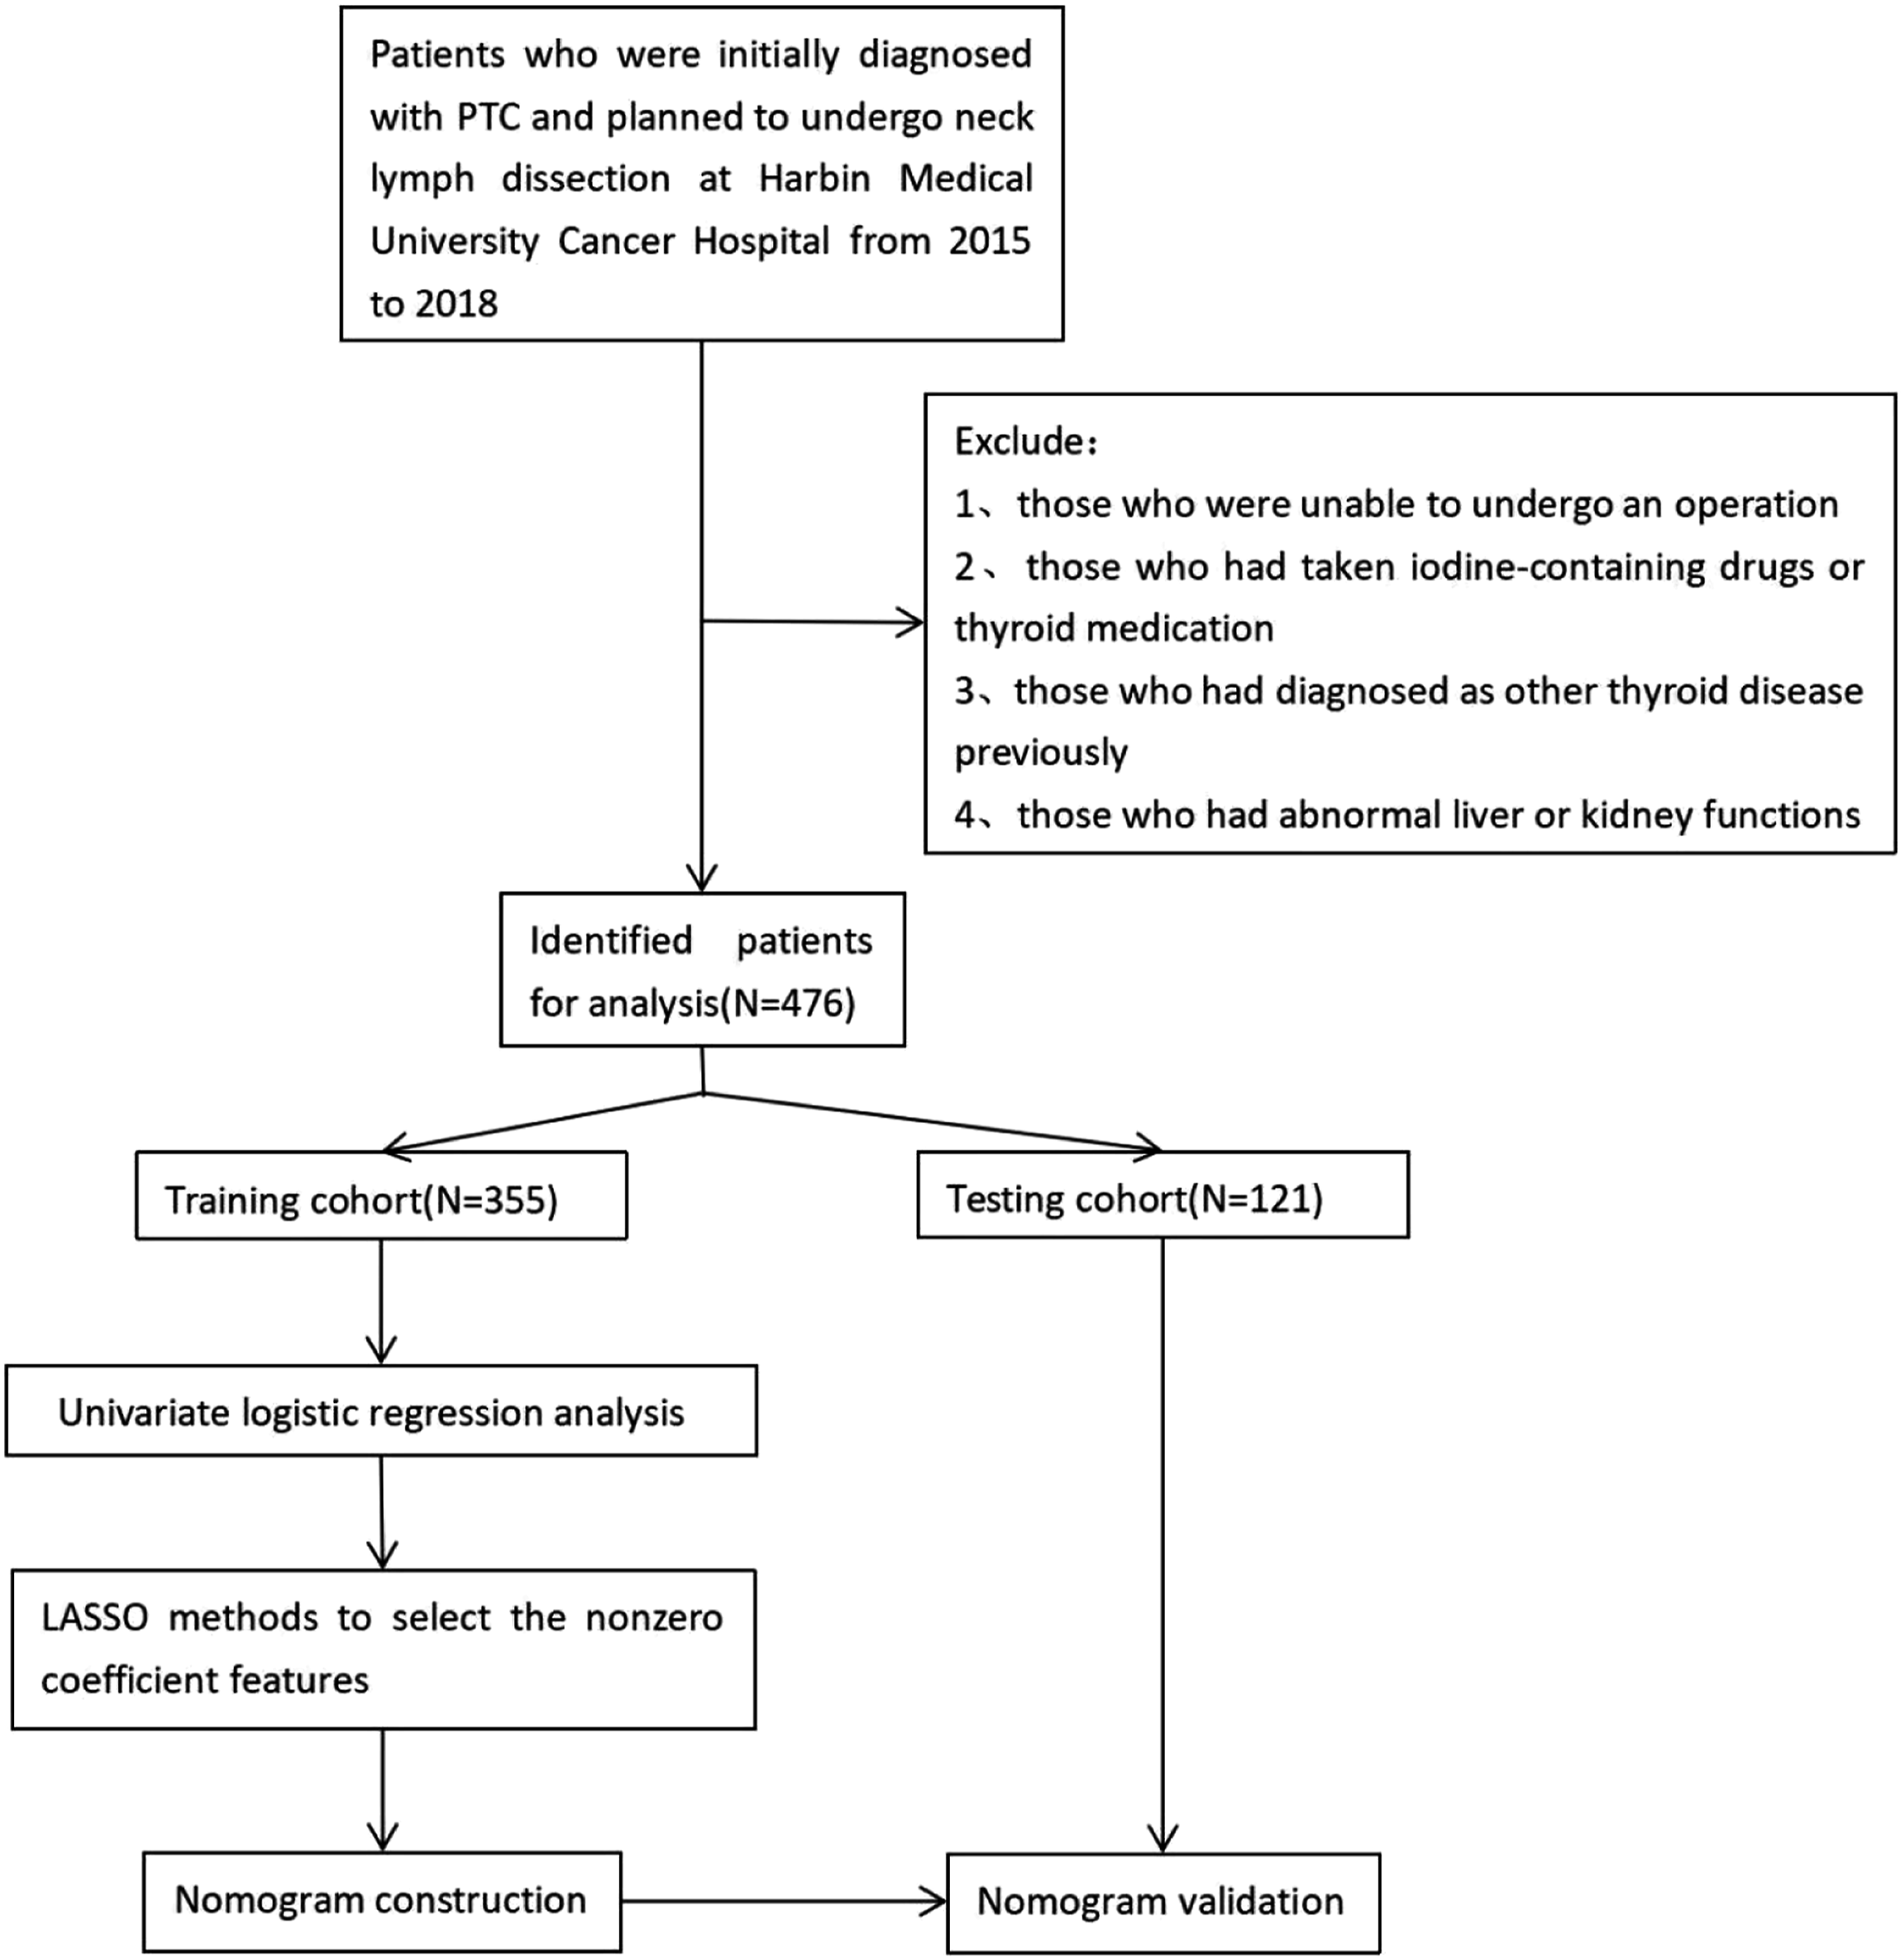
Sample Collection
The patient was informed to have a normal diet and avoid consuming foods high in iodine prior to collecting the biological samples. After fasting, abstaining from alcohol and medication for 12 hours, 5 mL of whole blood and 10 mL of urine were collected from each participant. For the blood samples, serum was collected after centrifugation for 1 hour, and each sample was divided into 400 μL aliquots and stored at
Test Methods
The levels of iodine in serum and urine were measured using the arsenic–cerium catalytic spectrophotometry method. During this assay, iodine acts as a catalyst in the arsenic–cerium oxidation–reduction reaction, where yellow Ce4+ is reduced to colorless Ce3+. The remaining Ce4 + absorbance is used to calculate the iodine level. 23 Thyroid function, including TSH, FT3, FT4, TGAb, TMAb, and TG, was assessed using the chemiluminescence technique.
The normal ranges for the thyroid function markers are as follows: TSH: .27 to 4.2 IU/mL, FT3: 3.1 to 6.8 pmol/L, FT4: 12 to 22 pmol/L, TGAb: 10 to 115 IU/mL, TMAb: 5 to 34 IU/mL, and TG: 1.4 to 78 ng/mL. The normal range for serum iodine concentration (SIC) is from 45 to 90 μg/L. 24 The participants were categorized into different groups based on their thyroid function markers and iodine levels. The lower group included values below the normal range, the higher group included values above the normal range, and the normal group included values within the normal range. The urinary iodine concentration (UIC) was also divided into three groups: <100, 100∼300, and >300 μg/L. 22
Statistical Analysis
Continuous variables (such as age and weight) were described by mean ± standard deviation and median and interquartile distance, while categorical variables (such as gender and SIC,) were described by percentage. Chi-square test and ANOVA were used to compare the statistical differences among different groups. The differences between the training and validation cohort were compared, and no differences between the groups indicated that there was no grouping bias.
Univariate logistic regression analysis was used to preliminarily explore the possible risk factors and calculate OR. Lasso regression method was used to screen out a significant combination of risk factors for predicting LLNM in PTC patients to construct a prediction model and draw a nomogram. Lasso regression method is a compression estimation method based on the idea of reducing the variable set (price reduction). It achieves the purpose of variable selection by constructing a penalty coefficient (λ), compressing the coefficients of variables, and making some regression coefficients become zero.25,26 In this study, risk factors with non-0 regression coefficient were selected in the lasso regression model to screen out the best prediction model for LLNM. 27 Then, the selected risk factors from the lasso regression model were integrated, introducing the multivariate logistic regression analysis to construct a nomogram. The area under the curve (AUC) of the model was calculated, and the ROC curve was drawn to evaluate the discrimination of the model. Calibration curves were drawn using 1000 bootstrap resampling method to evaluate the calibration of the model and conduct internal validation of the model. Decision curve analysis was performed on the model, and DCA curve was drawn to evaluate the clinical effectiveness of the model. Validation was performed using the validation cohort.
In order to further explore the contribution of iodine nutrition indicators to the model, we compared the AUC between the model constructed with iodine nutrition indicators and without iodine nutrition indicators to evaluate the model. We also used stepwise regression to screen variables and construct a model and evaluated the model by comparing the AUC with the aforementioned model. The models in the published articles were compared with the model we selected, and the AUC was used to determine which model was better. The statistical tests for the difference in AUC were performed using the DeLong test. 28
All statistical analyses were performed using R software 4.2.0 and SPSS 26.0. p < .05 was considered statistically significant.
Results
Baseline Characteristics and Simple Correlation Analysis
A total of 476 PTC patients were enrolled in this study. They were randomly divided into a training cohort (N = 355) and a validation cohort (N = 121) at a 3:1 ratio. The differences between the training cohort and the validation cohort were compared, and the results are showed that there is no significant difference in all clinicopathological characteristics of the patients between the training and validation cohort, indicating that there is no grouping bias in our study.
Baseline Characteristics of the Patients and the Results of the Univariate Logistic Regression.

Risk Factor Selection
Of the 20 clinically probable risk factors, 11 risk factors were of non-zero factors according to the lasso algorithm (Figure 2). Age, gender, SIC, smoking, drinking, family history, multifocality, bilateral or unilateral tumors, TSH, and Tg were included (Table S1). These risk factors were introduced into the multivariate logistic model, and the results are shown in Table 2. We observed that age is an important risk factor, with every additional year reducing the risk of LLNM by 6.2% (OR: .938, 95%CI: .914–.963). High levels of SIC significantly increase the risk of LLNM, with a 3.302-fold increase in risk observed in the high SIC group relative to the low SIC group (OR: 3.302, 95%CI: 1.009–10.799). High levels of Tg similarly increase the risk of LLNM (OR: 1.022, 95%CI: 1.012–1.032). The effects of other risk factors such as gender, smoking history, drinking history, family history, multifocality, unilateral or bilateral, TSH, and size on LLNM cannot be disregarded. Characteristics selection using the LASSO logistic regression model. (A) Selection of the optimal parameter (logλ) in the lasso model, the x-axis is the tuning parameter logλ, the y-axis is the regression coefficients, and each color line in the figure represents a variable. As logλ increases, the coefficient of the variable is compressed until it becomes zero. (B) Distribution of lasso coefficients for the 20 variables. The x-axis is the tuning parameter logλ, and the y-axis is the binomial deviance. The logλ corresponding to the smallest binomial deviation, that is, the lowest point in the figure, is the optimal logλ. At this time, the remaining non-0 variables are the variables of the optimal model. Introduction of 11 Risk Factors Into the Results of the Multivariate Logistic Regression Model.

Development of the Nomogram for Predicting LLNM in PTC Patients
The 11 risk factors selected by lasso regression were included in the multivariate logistic analysis model and a nomogram was constructed (Figure 3). The value of each variable is expressed as a score, and a vertical line is drawn up from the corresponding variable value position to the upper points’ line to obtain a score for each variable. The scores of each variable are added together to obtain a total score. This total score is then positioned on the total score line. Next, a vertical line is drawn from this location point to intersect with the diagnostic possibility line, obtaining the corresponding LLNM probability. Suppose a patient with an age of 30, gender of female, SIC of <45 μg/L, no smoking history, drinking history, or family history of tumor, single and unilateral tumor lesions, TSH content is 4IU/mL, Tg content is 51 ng/mL, and the tumor size is ≤ 2 cm. The total score of each variable is 58. The diagnostic probability of LLNM for this patient was .62. Nomogram predicting PTC patients’ LLNM.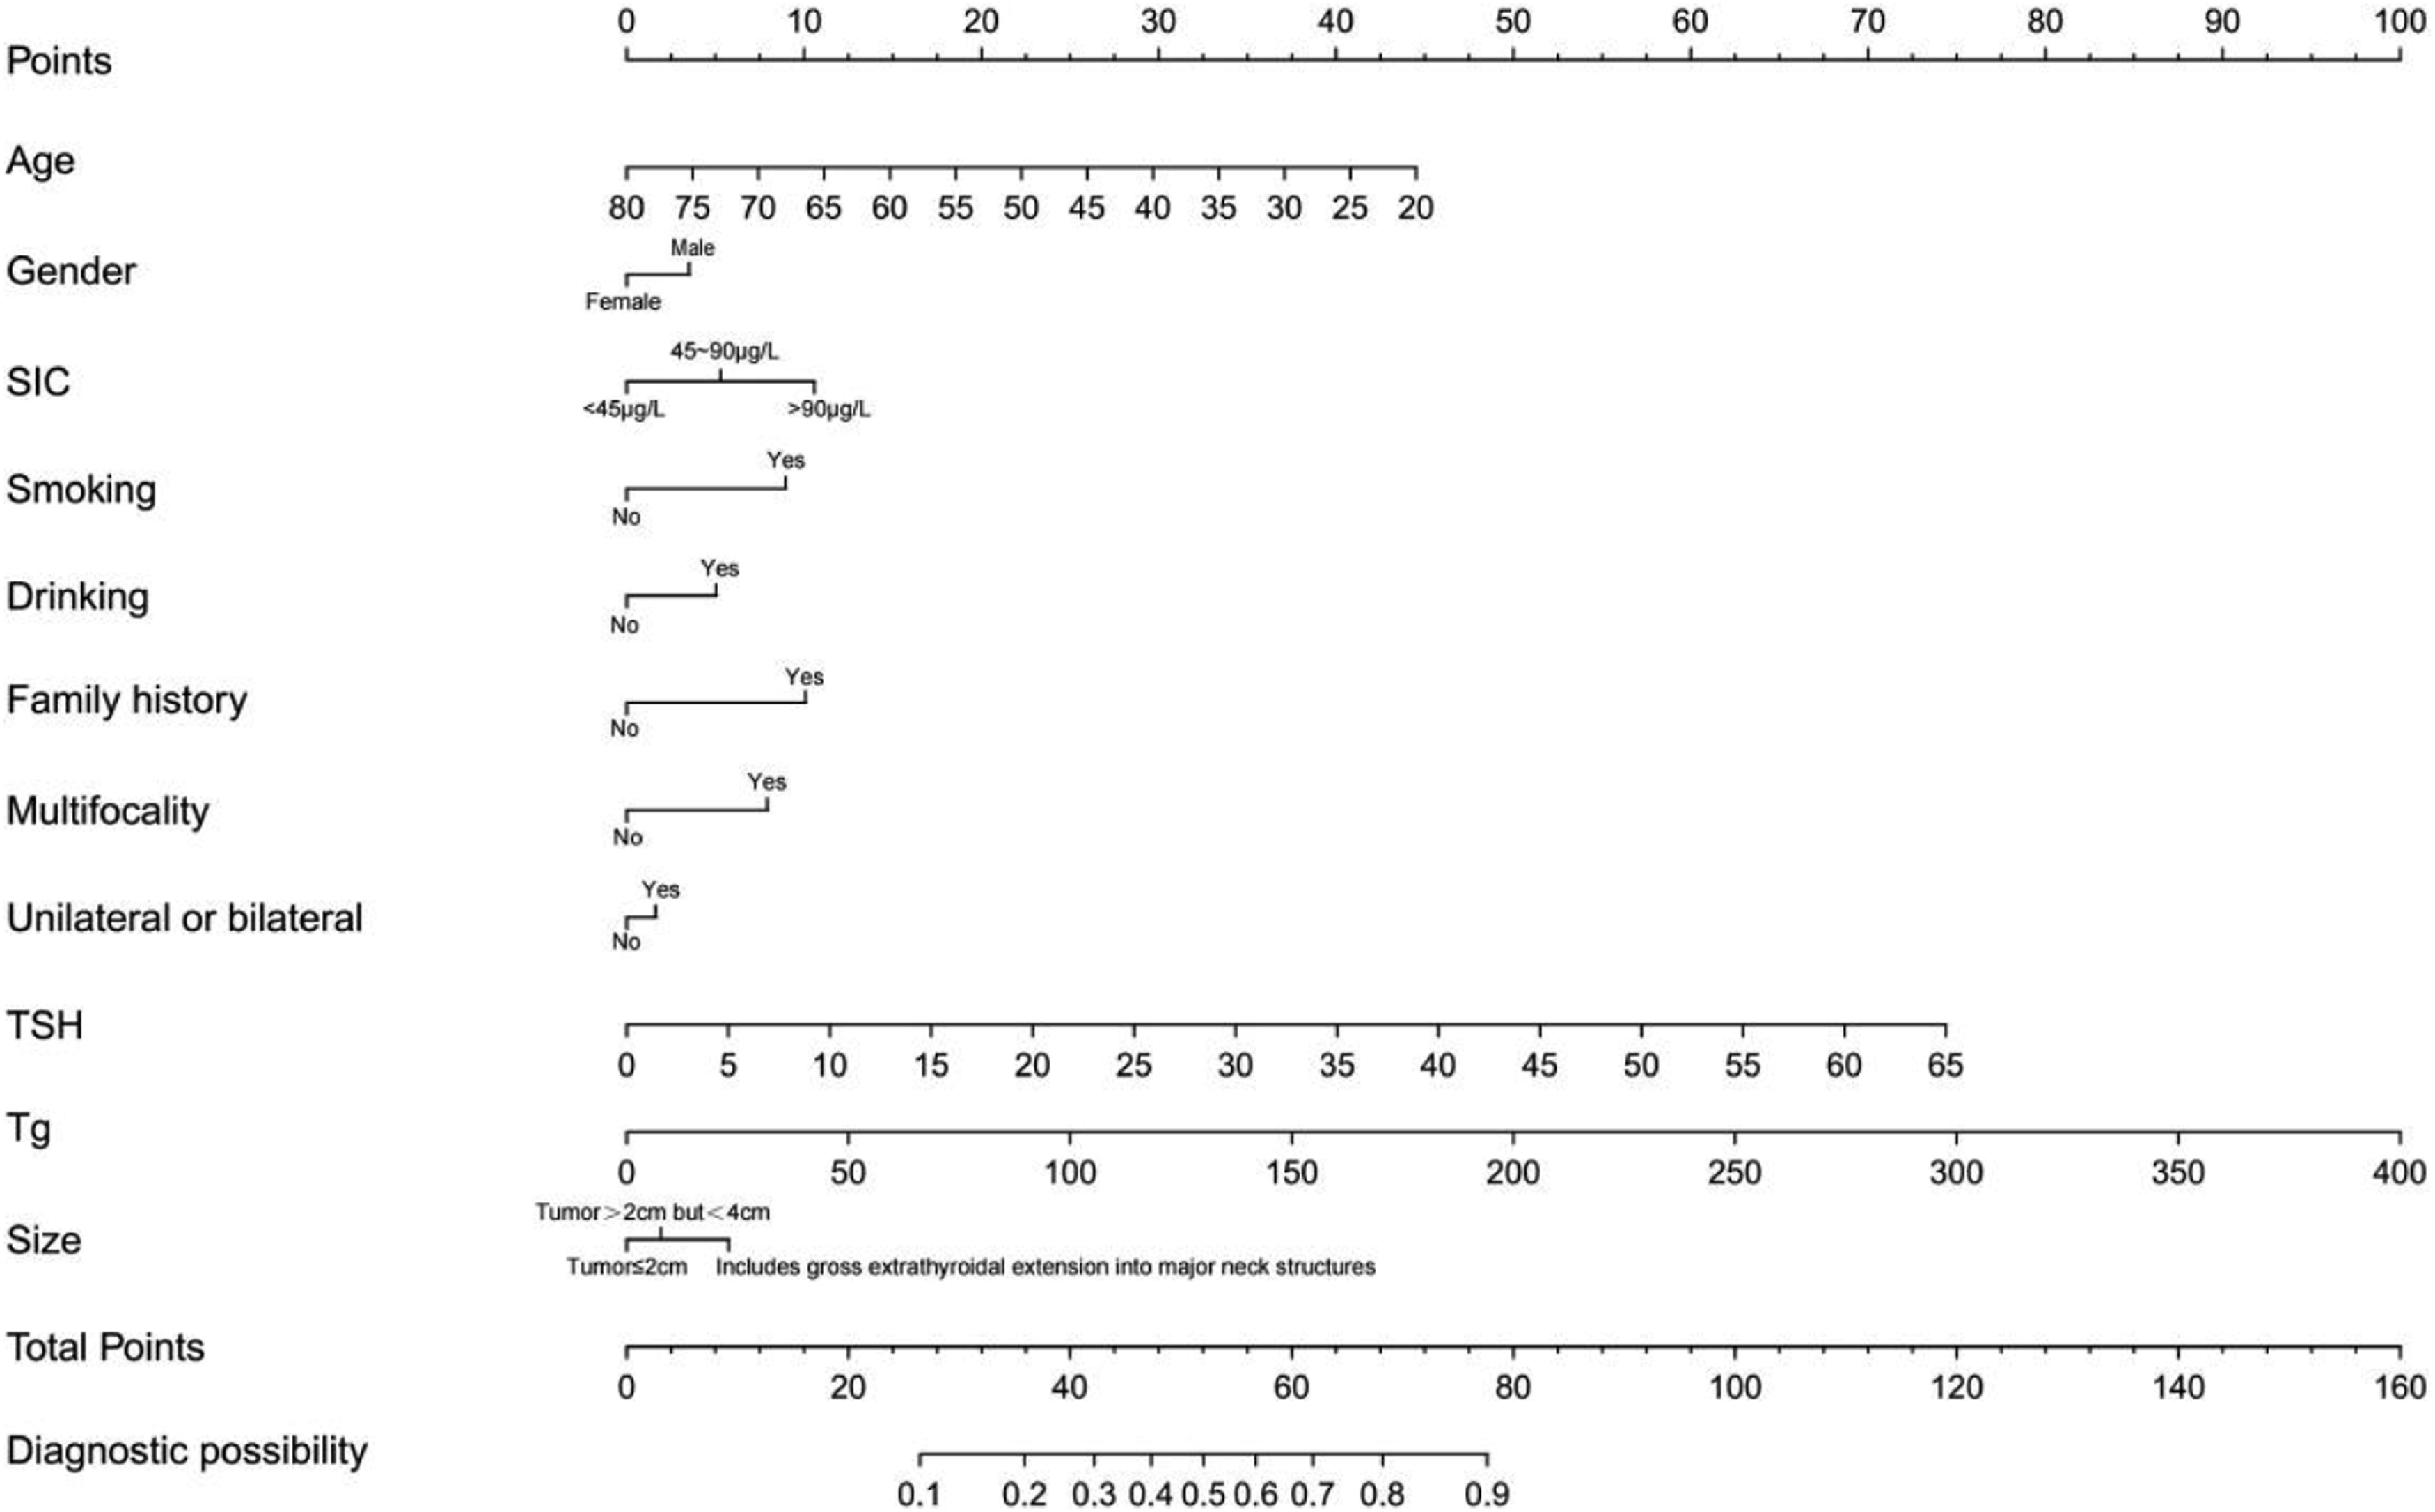
Validation and Clinical Utility of the Nomogram
Internal validation was used to test the discrimination of the nomogram, and the ROC curves are shown in Figures 4(A) and 4(B). AUC was considered to be an effective indicator to evaluate the effectiveness of the model. AUC in the training cohort is .795 (cutoff value: .367, sensitivity: .725, and specificity: 0.757), and AUC in the validation cohort is .792 (cutoff value: .310, sensitivity: .716, and specificity: 0.800). It shows that the nomogram has a good discrimination degree. ROC curve and optimal cutoff value between the training cohort and testing cohort. (A) The ROC curve of the training cohort. (B) The ROC curve of the testing cohort.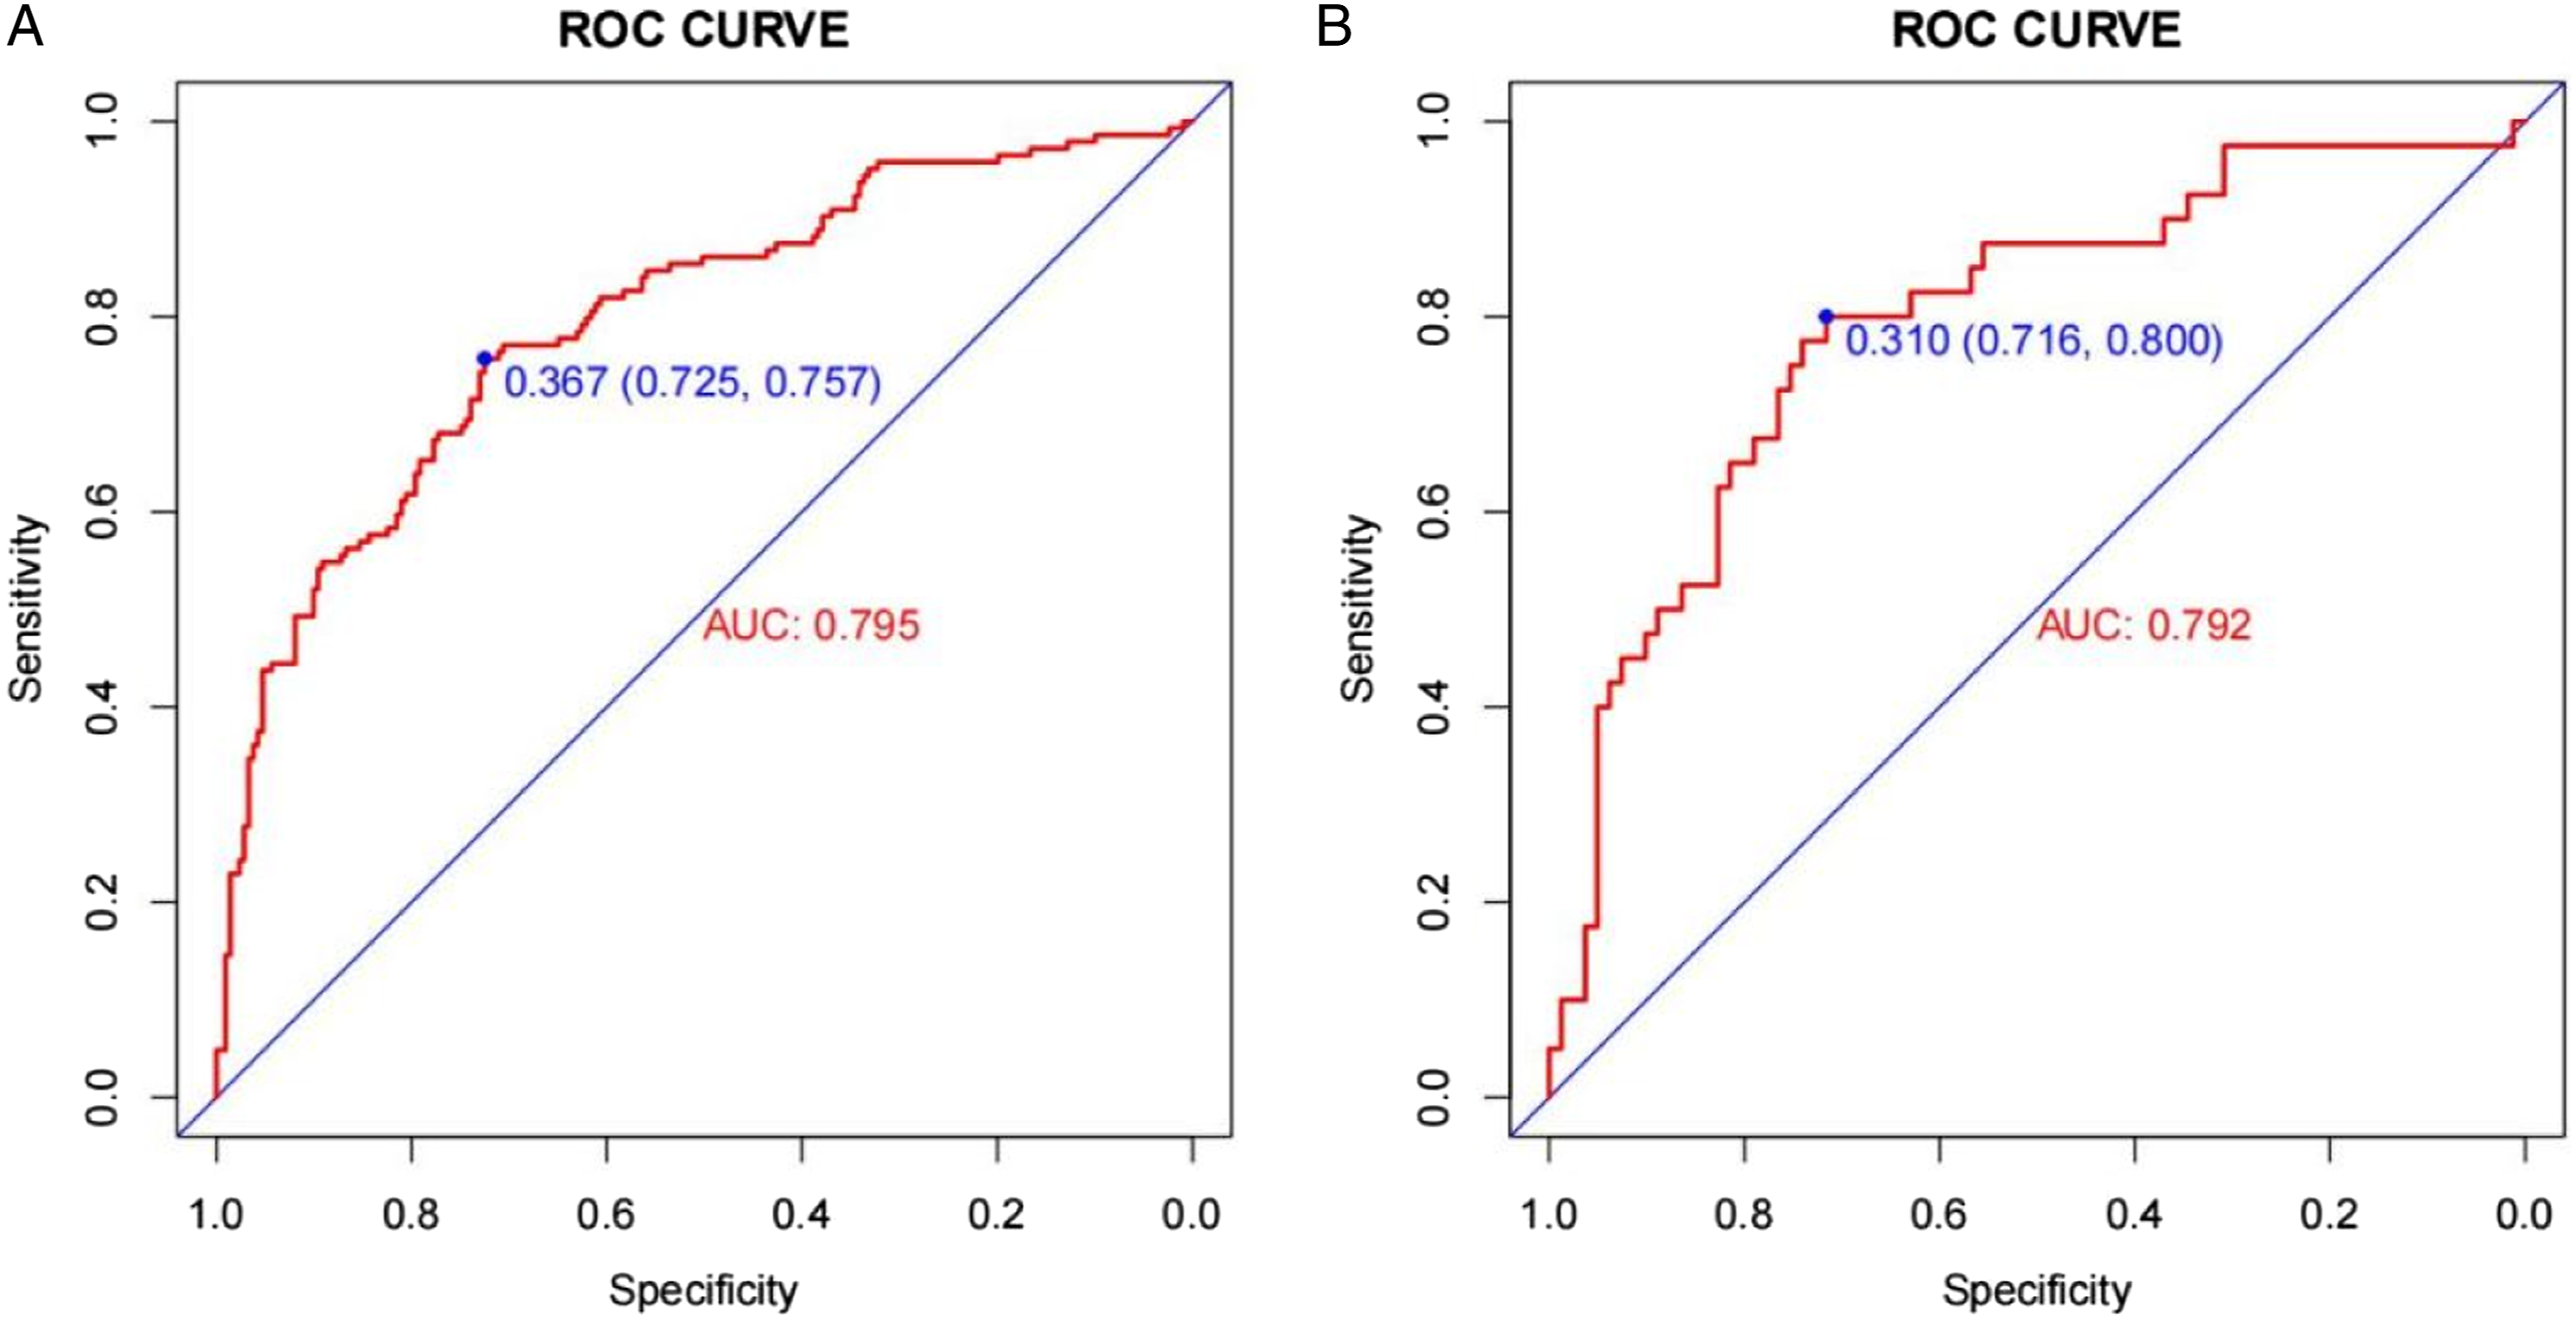
In addition, Bootstrap resampling was used for internal validation and calibration plots. In both the training and validation cohorts, the predicted values on the calibration curve showed a good agreement with the actual observations (Figure 5), indicating good calibration of the model. The Hosmer–Lemeshow test had a good goodness of fit (P = .203), indicating that the nomogram had a good calibration ability. Calibration curve between the training cohort and testing cohort. (A) The calibration curve of the training cohort. (B) The calibration curve of the testing cohort.
The clinical decision curves for the training and validation cohorts are shown in supplementary Figures S1(A) and (s)1(B). The nomogram has good clinical utility in both the training and validation cohort. The PTC patients may benefit from the nomogram to predict the risk of LLNM.
Model Comparison
Deleting the iodine nutrition-related indicators (SIC, TSH, and Tg) in the 11 risk factors of the final model, and the remaining clinicopathological-related indicators were used to refit the model, calculate the predictive value of the model and draw the ROC curve. The AUC of iodine nutrition deleted model was .722 (cutoff value: .407, sensitivity: .697, and specificity: 0.653), which was less than .795 of the original model (Figure 6(A)). The difference between AUCs has been tested and found to have a P-value of less than .001, indicating a statistically significant difference. It is known that the introduction of iodine nutrition-related indicators will optimize the model. Model comparison. (A) The model comparison between the lasso model and iodine nutrition deleted model. (B) The model comparison between the lasso model and stepwise model.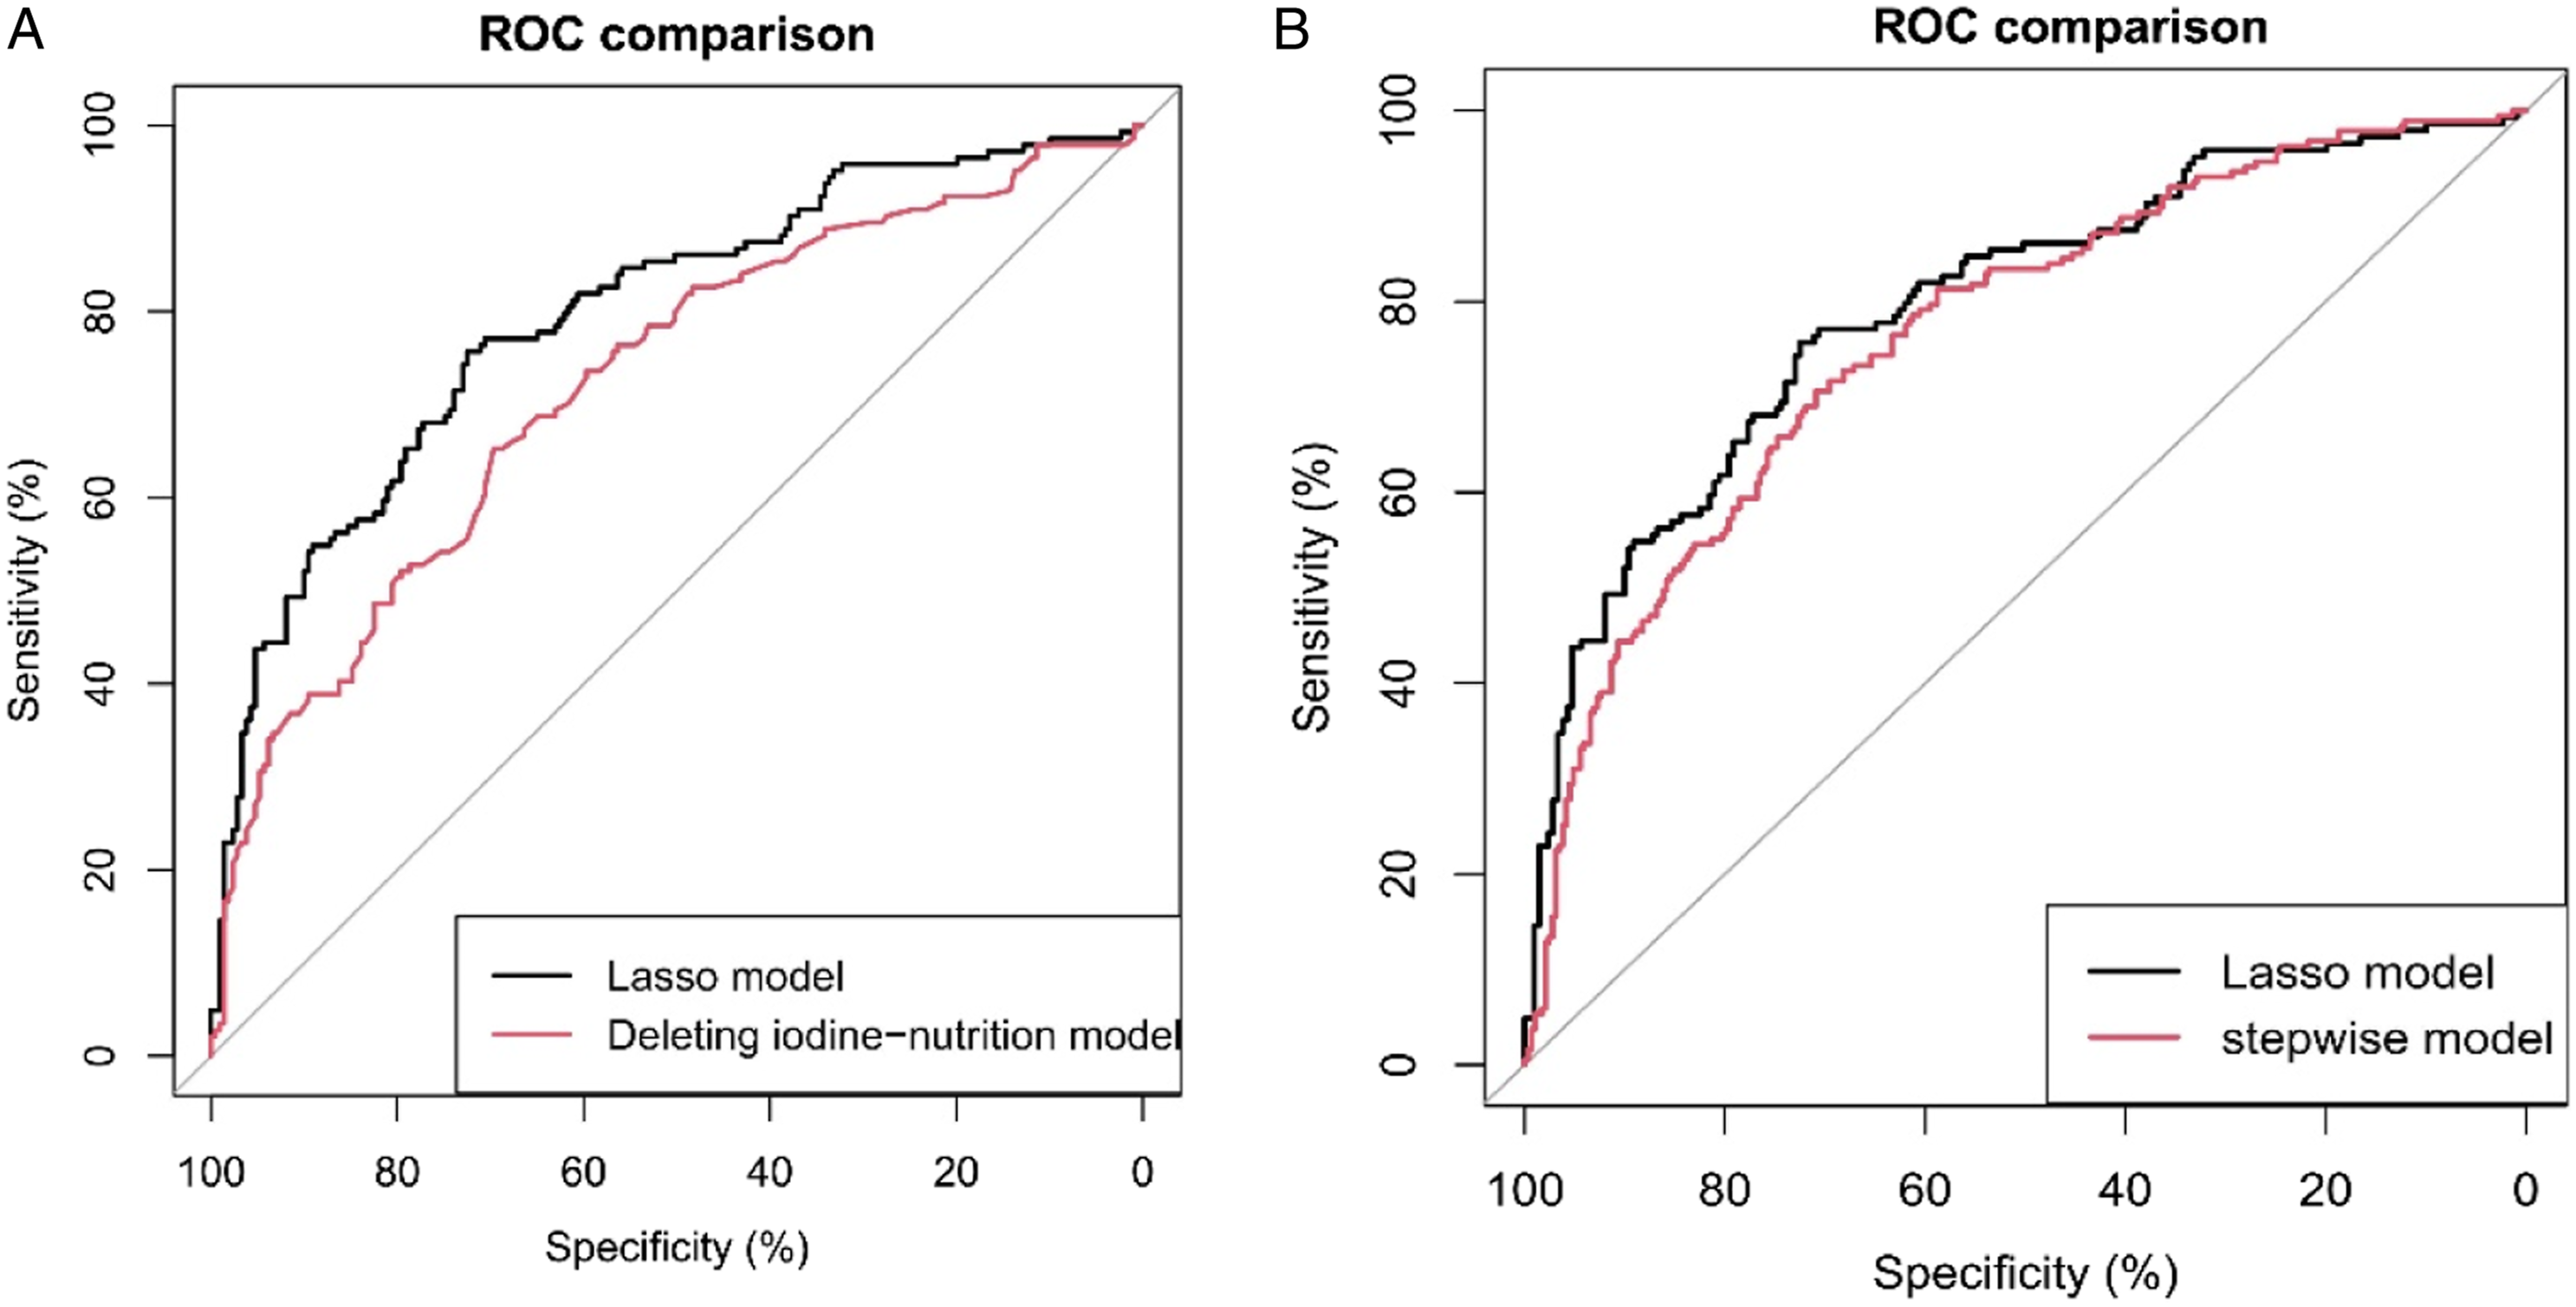
In addition, stepwise regression was used to screen variables, including age, SIC, smoking, multifocality, TSH, and Tg. The model was fitted and the predictive value of the model was calculated, and the ROC curve was drawn and compared with the lasso model (Figure 6(B)). The AUC of the stepwise regression model was .766 (cutoff value: .388, sensitivity: .709, and specificity: 0706;). The difference between AUCs has been tested using a statistical test and found to have a P-value of .036. Considering the optimization of the model and the easy availability of gender, drinking, family history, unilateral or bilateral, size, and other indicators in clinical practice, the lasso model was considered to be better.
Finally, most of the previous articles predicted the outcome of LLNM based on single indicators such as age, gender, tumor size, and preoperative Tg. Therefore, we drew the ROC curves of the original model and multiple single factors to predict LLNM in one figure (Figure S2). It can be seen that our model has the greatest advantage over other single risk factors.
Discussion
PTC has a good prognosis, but LLNM increases the risk of relapse and significantly reduces the quality of life of patients. Neck dissection is an important part of PTC surgery for patients with LLNM. However, due to the complexity of the operation, neck dissection is prone to accidental injury and complications, including bleeding, chylous leakage or lymphatic leakage, nerve injury, and flap necrosis. It is necessary to treat each patient seriously, ensure the radical effect while protecting the function, and reduce the occurrence of complications. 29 Although the treatment of low-risk NLLNM patients is controversial, the current trend is to recommend reducing the scope of dissection and reducing surgical injury.30,31 Radioiodine is often used in patients with LLNM after surgery, while radioiodine is not currently used in patients with low-risk thyroid cancer. 19 The extent of surgery largely depends on the preoperative evaluation of lateral cervical lymph nodes, which is also closely related to postoperative recurrence and prognosis. This requires a more accurate assessment of preoperative LLNM by the surgeon.
UIC is considered to be the gold standard for evaluating the iodine status of the population, and most of the published studies use UIC as a biomarker of iodine status. 10 SIC is an important biomarker of iodine metabolism reflecting recent iodine intake. 32 Therefore, timely detection of abnormal SIC can to some extent predict high-risk groups before subclinical or clinical thyroid diseases.33,34 Tg is synthesized and secreted by thyroid follicular epithelial cells, including follicular epithelial cells in normal thyroid, tumor tissue, and metastatic lymph nodes. Tumor cells may destroy the follicular structure and cause Tg to be released into peripheral blood.35,36 TSH secretion increases with decreasing iodine intake to promote iodine absorption and promote thyroid hypertrophy and hyperplasia. 37 TSH was higher in patients with malignant thyroid nodules than in patients with benign thyroid nodules, and TSH increased proportionally in more aggressive tumors. 38 Iodine intake is considered a risk factor for thyroid cancer. The incidence of thyroid cancer, especially PTC, increased due to the increase of iodine intake caused by salt iodization and iodine supplementation.37,39,40
In recent years, many studies have explored the predictors of LLNM in PTC patients. Feng, JW, So, YK, Hou, J et al demonstrated that tumor size, extrathyroidal extension(ETE), unilateral or bilateral tumor, multifocality, and age were all risk assessment markers for LLNM.15-17 Most of the decisive factors involved in the published literature are independent and single, including age, gender, tumor size, and preoperative Tg.41-44 Therefore, our study not only included the clinicopathological features closely related to LLNM but also introduced iodine nutrition-related markers, including SIC, TSH, and Tg.
Our univariate logistic regression found that SIC was an important factor affecting the occurrence of LLNM in PTC patients. Compared with normal UIC, high UIC may be a risk factor for LLNM. This is the same as the study by Zhang,XQ et al. 45 The prediction model established by lasso regression and inclusion of multiple factors also showed that higher SIC was a risk factor for LLNM in PTC patients. 46 In addition, the prediction model also showed that high TSH and Tg were also risk factors for LLNM. This is the same as described by Leif Schiffmann et al. 47
Based on the risk factors affecting LLNM in our analysis after screening by lasso regression method, gender, SIC smoking, drinking, family history, multifocality, unilateral or bilateral tumor, TSH, Tg, and tumor size were included in the nomogram model of LLNM. The nomogram was further successfully evaluated by internal and external validation cohorts. The AUC of the prediction model was .795, and the AUC of the validation cohort was .792. The prediction effect of the model was good. The calibration curves of the 1000 Bootstrap internal validation group and the external validation group also showed that the model had good calibration. The decision curve also graphically shows the clinical benefit of the model.
We also compared the models. The AUC of the model with iodine nutrition-related indicators was .795, while the AUC of the model constructed by only clinicopathological indicators was .722. Compared with the model established by only clinicopathological indicators, the inclusion of iodine nutrition-related indicators would improve the discrimination of the model. The AUC obtained by stepwise regression was .766, which was also lower than .795 of our model. The single risk factor predicting LLNM and our multivariate model were plotted in the same ROC curve, which further intuitively illustrates the excellent predictive ability of our constructed model. Using our nomogram, clinicians can effectively assess the likelihood of preoperative lymph node metastasis, which can help them make surgical decisions.
In recent years, the relationship between immune molecules and iodine nutrition in papillary thyroid carcinoma (PTC) has attracted extensive attention. The mutation of immune molecules, especially BRAF V600 E, is closely related to the occurrence of PTC. 48 Many researchers have conducted related studies on the relationship between immune molecules, especially BRAF V600 E mutation, and iodine nutrition. Serhat et al found through a retrospective study of PTC patient data from 2000 to 2012 that BRAFV600 E mutation is associated with adverse clinical pathological parameters, and long-term iodine exposure appears to be unrelated to BRAFV600 E. 49 The study by Hye Jeong Kim et al. 50 found that relatively low and excessive iodine intake in the Korean population seems to be an important risk factor for thyroid BRAF mutations. Therefore, more prospective studies may be needed in the future to demonstrate the correlation among iodine nutrition, immune molecules, and the occurrence of PTC.
Nonetheless, there are some limitations to this study. First, as a single-center study, there are inherent biases. Therefore, more multicenter prospective studies are needed in the future. Second, our study was conducted in an iodine supplement area in China. Although the subjects in this study all consumed iodized salt and did not change their dietary habits before blood and urine collection, multicenter studies are needed to validate our findings. Finally, our nomogram model included 11 predictors, indicating that more influencing factors need to be streamlined in the future to further improve the predictive power and clinical utility of the model.
Conclusion
We found that nutrition-related indicators help to predict the occurrence of LLNM. In order to predict LLNM, a nomogram model based on iodine nutrition level combined with clinicopathological characteristics of patients was established. The use of this model helps clinicians to evaluate the likelihood of LLNM and make surgical decisions before surgery.
Supplemental Material
Supplemental Material - Nomogram Model Based on Iodine Nutrition and Clinical Characteristics of Papillary Thyroid Carcinoma to Predict Lateral Lymph Node Metastasis
Supplemental Material for Nomogram Model Based on Iodine Nutrition and Clinical Characteristics of Papillary Thyroid Carcinoma to Predict Lateral Lymph Node Metastasis by Junrong Wang, Yuzhang Gao, Yuxuan Zong, Weitong Gao, Xueying Wang, Ji Sun, and Susheng Miao in Cancer Control.
Footnotes
Acknowledgments
We would like to show sincere appreciation to the editors and reviewers for critical comments on this article.
Authors Contribution
WJ, GY, ZY were responsible for the conceptualization of the project and all data analysis, and they drafted the initial version of this article. GW, WJ made contributions to the collection of specimens, data processing, analysis, and interpretation. WX, SJ, MS provided guidance on data analysis and manuscript writing.
Declaration of Conflicting Interests
The author(s) declared no potential conflicts of interest with respect to the research, authorship, and/or publication of this article.
Funding
This work was supported by Postdoctoral Scientific Research Developmental Fund of Heilongjiang Province (LBH-Q18088).
Ethical Approval
This study was approved by the Medical Ethics Review Committee of Harbin Medical University.
Statement of Human and Animal Rights
All procedures in this study were conducted in accordance with the ethics committee-approved protocols.
Statement of Informed Consent
Written informed consent was obtained from the patients for their anonymized information to be published in this article.
Data Availability Statement
Supplemental Material
Supplemental material for this article is available online.
References
Supplementary Material
Please find the following supplemental material available below.
For Open Access articles published under a Creative Commons License, all supplemental material carries the same license as the article it is associated with.
For non-Open Access articles published, all supplemental material carries a non-exclusive license, and permission requests for re-use of supplemental material or any part of supplemental material shall be sent directly to the copyright owner as specified in the copyright notice associated with the article.