
Abstract
A strong oscillation of electoral preferences took place in Chile between the election of the members of the Constitutional Convention in May 2021 and the election of the members of the Constitutional Council in May 2023. This is surprising because, until the national-scale social uprising in 2019, there was a broad consensus that Chile was a highly institutionalised party system where political preferences tended to be stable. In this research note, we study how the electoral choices made by citizens shifted between both elections, using the ecological inference approach based on a Bayesian hierarchical model developed elsewhere. We find that a vast majority of the new voters that resulted from the compulsory voting policy implemented between both elections opted for centre-right to right-wing candidates. However, this evidence is insufficient to determine whether these new voters predominantly align with right-leaning ideologies or hold anti-systemic viewpoints.
Keywords
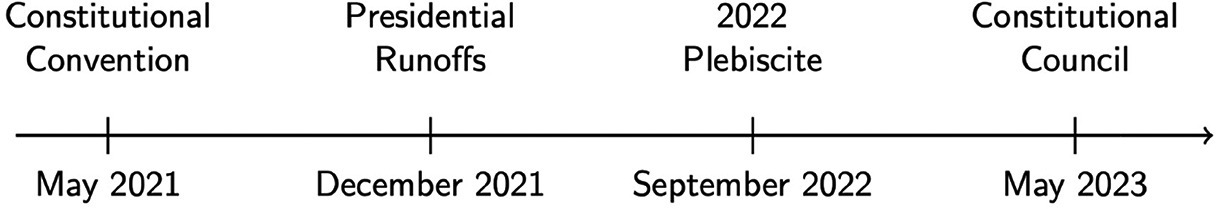
The number of elections that have taken place in Chile in recent years is unprecedented. In a little over two years, Chileans voted in fifteen elections, four of which were part of two processes aimed at drafting a new Constitution. 1
 .
.
The four elections we focus on in our analysis are outlined in the above timeline. First, the May 2021 vote that elected the members of the Constitutional Convention responsible for writing and presenting the draft for a new constitution. This election was agreed upon by most political parties in November 2019 to provide an institutional solution to the political crisis that followed the social uprising (a.k.a. “estallido social”) that began a month earlier. This election resulted in a resounding victory of candidates from the left, with right and centre-right candidates having their worst showing since the return to democracy in 1990. The second election is the presidential election runoff that took place in December 2021 between Gabriel Boric, a candidate to the left of traditional left-wing parties, and José Antonio Kast, a candidate to the right of conventional right-wing parties. Consistent with the first election, this election resulted in a victory for Gabriel Boric, who received 56 per cent of the votes. The third election we consider is the September 2022 referendum on the constitutional proposal drafted by the previously elected convention. This election, which was also part of the November 2019 agreement between most political parties, resulted in a conclusive rejection by 62 per cent of voters. This rejection was followed by a new agreement across political parties to draft another constitutional proposal and led to the May 2023 election of the members of the new body in charge of writing this proposal, resulting in a landslide victory for centre-right and right-wing candidates.
To analyse the drastic change in the electoral results during this exceptional electoral cycle, we compare the outcomes of the May 2021 and May 2023 votes, because both elected the members of a body in charge of writing a constitutional proposal. There is no other pair of elections with as similar as these two during the period considered. The main conclusions from our analysis can be obtained by analysing the transitions between these elections alone. We consider the December 2011 runoff and the September 2022 Plebiscite in addition to the previous elections, however, to show that there was already evidence for the trends that we wish to highlight in elections prior to the election for the members of the Constitutional Council. 2 If we split the votes in the May 2021 and May 2023 elections into what are roughly votes for centre-left to left-wing candidates and votes for centre-right to right-wing candidates, the difference between the results from both elections is stark: In May 2021, centre-right and right-wing candidates received only 21 per cent of votes, in contrast to 62 per cent of the votes they received two years later, albeit from a much larger voting pool (see Figure 1). Furthermore, in the May 2023 elections, a single far-right party, the Partido Republicano, had the best electoral outcome of any political party in a national election in Chile since 1965, electing twenty-three out of the fifty-one seats of the Constitutional Council.
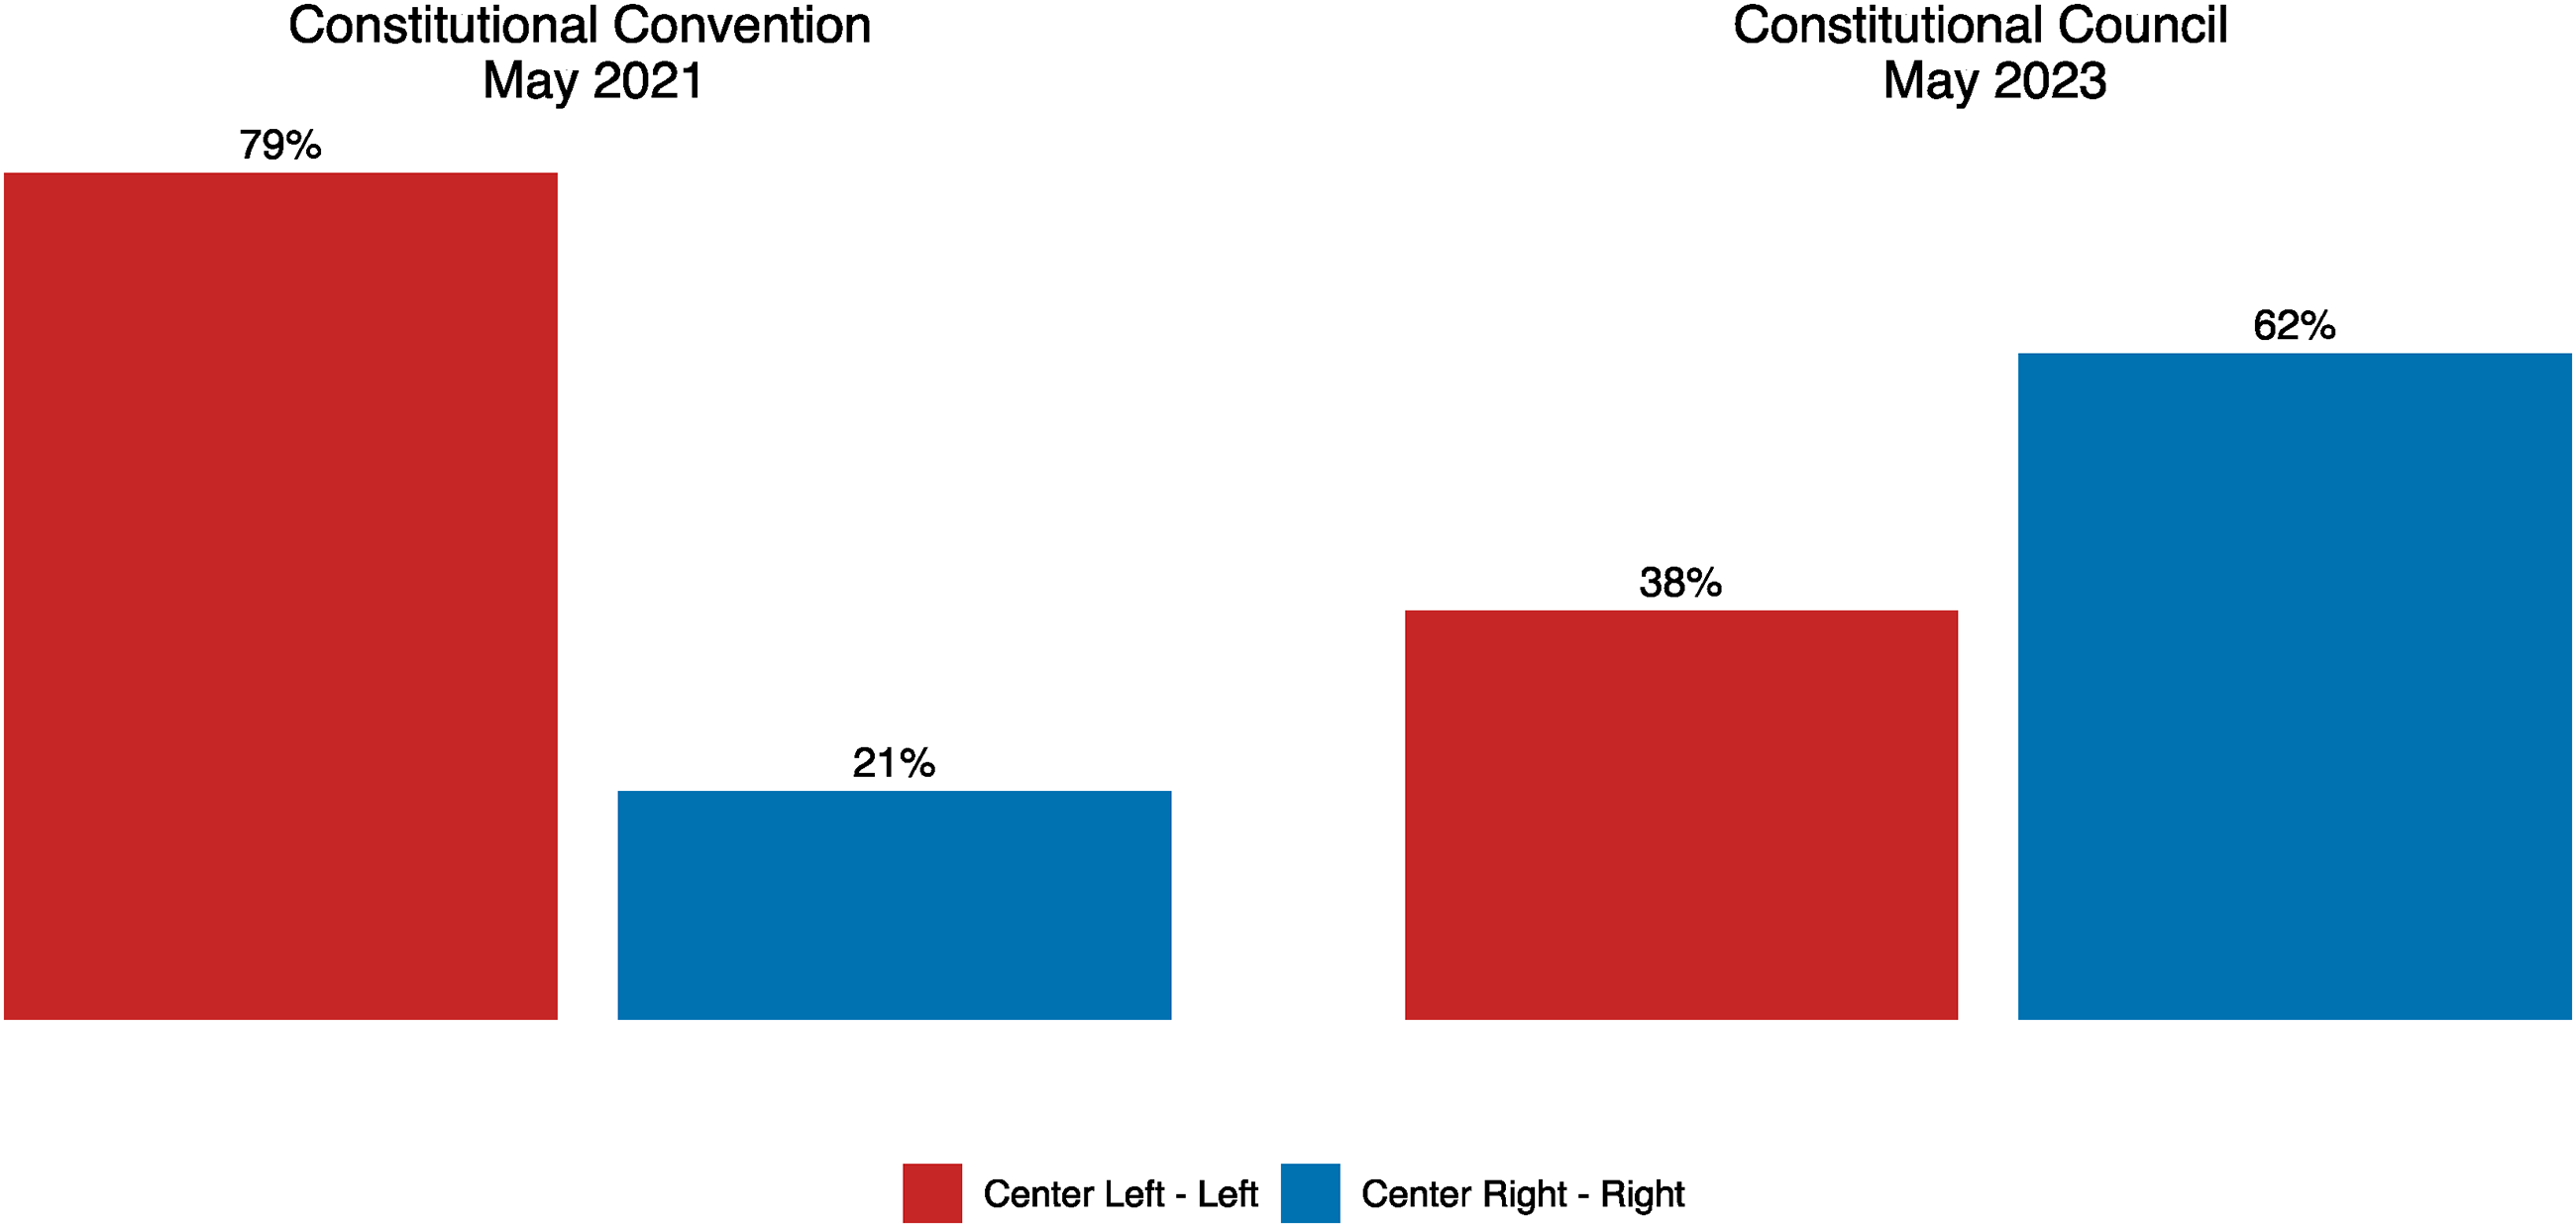
The Constitutional Convention in May 2021 and the Constitutional Council in May 2023.
What puzzles us the most is that until the national-scale social uprising in 2019, there was a broad consensus that Chile was an example of a highly institutionalised party system (Coppedge, 1998; Mainwaring and Scully, 1995; Payne et al., 2003; Siavelis, 2000, to mention just a few), which concomitantly is associated with stable inter-party competition, for many, a precondition of a healthy democracy (Kuenzi and Lambright, 2001).
The stability and regularity of party competition are considered critical aspects of a high degree of party system institutionalisation (hereafter PSI). The traditional view of PSI pivoted around four crucial elements: party competition; party roots in society; the level of party legitimacy in society; and well-developed party organisations. The specialised literature considered that these four dimensions are correlated and evolve jointly (Mainwaring, 1999). However, in the early 2010s, some research (see Zucco, 2010) started to challenge this understanding of PSI, using the category of “hydroponic parties” (e.g. stable party competition without roots in society). In this regard, Luna and Altman (2011) show that the Chilean party system combined very low national-level volatility with low levels of rootedness and legitimacy in society and weak partisan organisations.
Mainwaring and Scully (1995) operationalise the rootedness of a party system in society as the stability of citizens’ electoral preferences between presidential and legislative elections. 3 If political parties were rooted in society, citizens would vote more frequently based on party labels and would tend to vote for the same label in legislative and presidential elections. In other words, minor differences in the vote in both elections suggest higher levels of party influence and significance (of course, conditioning on the concurrency of both polls). Even though Mainwaring (2018) modified his operationalisation of PSI, the link between citizens and parties remains a critical component.
Chileans witnessed substantial partisan dealignment in recent years (Bargsted and Somma, 2016; Meléndez, 2022). 4 In this context, focusing on political parties would cast doubt on the validity of the results of our study. Therefore, we decided to base our analysis on the electoral results of groups of parties. By taking political pacts as units of study, following Luna and Altman (2011), González et al. (2008), and Altman (2004), we relax the ideological structuring of distinctive brands. 5
Hypotheses and Methods
The electoral results described above raise the question of why the Chilean electorate went from choosing a left-leaning Constitutional Convention in 2021 to electing a right-leaning Constitutional Council just two years later. What explains that right-leaning parties increased their percentage of the votes threefold between both elections? Interestingly, voting was voluntary in the first election and compulsory in the second election, with turnout increasing from 56 per cent to 86 per cent of eligible voters between both elections. 6 This raises the question of whether the move from voluntary to compulsory voting explains the shift in the composition of both bodies in charge of drafting a Constitution, that is, between the first and last of the four elections we focus on. This requires that we determine how the voters brought on by compulsory voting (“compulsory voters” in what follows) voted. Did the shift to the right occur because they voted overwhelmingly for parties in this sector, while voters from previous elections (“voluntary voters” in what follows) kept their party loyalties? In this case, the answer to our main question would be that moving from voluntary to compulsory voting led to a significant influx of right and centre-right voters, as Meléndez et al. (2021) argue was the case in the September 2022 Plebiscite. If this was the case, we would expect these new voters both to vote to reject the constitutional proposal in the September 2022 Plebiscite and to vote for right-leaning candidates in the May 2023 elections.
Alternatively, it could be the case that the shift to the right was similar among “compulsory” and “voluntary” voters because these are non-ideological voters seeking alternatives that have not governed so far or are – at least – independent from the conventional partisan offers. Titelman and Sajuria (2023) provide some experimental evidence supporting the latter hypothesis, showing that independent candidates in Chile have an electoral advantage compared with candidates affiliated with political parties. Thus, a second hypothesis we consider is that a significant number of voters, both among those who voted in the first two elections when voting was voluntary and new voters who emerged when voting became compulsory in the third and fourth elections, are anti-systemic voters who tend to vote against the candidate or option closest to the coalition that is currently in power, regardless of the traditional left–right political axis. Did the shift to the right take place because a large fraction of “compulsory” and “voluntary” voters are anti-systemic voters? In this case, the answer to our main question would be that moving from voluntary to compulsory voting led to a major influx of anti-systemic voters. Also, that part of the left-leaning vote of the first election was anti-systemic and opted for right-wing options in the last election. 7 This hypothesis does not necessarily imply that these voters do not have preferences regarding the constitution, but it does imply that their constitutional preferences are not the key determinant of their behaviour in these elections, since their main driver would be the search for candidates not affiliated to the party in power at the time. Voters with strong political preferences would not fall into this category. For example, a voter voting for far left-leaning candidates in the May 2021 elections and for far right-wing parties in the May 2023 elections would be hard to reconcile using a framework where ideological preferences regarding the constitution are the most important factor influencing this voter's decision. In other words, what we label anti-systemic voters are voters whose behaviour in these elections suggests that motivations other than constitutional preferences (e.g. the preference for candidates not affiliated with the party in power) are the main explanatory factors for their behaviour. Given the shift in the votes attained by left-leaning and right-leaning options in the May 2021 and May 2023 elections, we believe that this is a plausible hypothesis regarding this type of voter. Furthermore, we cannot speak on voter's preferences about constitutional change based on the data at hand alone, but only determine whether or not their voting behaviour is consistent with an anti-systemic vote.
There are, of course, other possible explanations for the patterns of voter behaviour observed in these elections, such as the potential importance of disaffected voters in the September 2022 Plebiscite. As was previously outlined, however, the salient fact that we wish to analyse is the switch in results shown in Figure 1 between left-wing and right-wing alternatives, and we believe that, together, both of the previous hypotheses provide a plausible explanation for this change. Therefore, while other explanations may be valuable when analysing these elections, we choose to limit the scope of this article to considering the competing alternatives described above.
To illustrate the questions we want to address and the two hypotheses we consider, we summarise the results of the elections of the Constitutional Convention of 2021 and the Constitutional Council of 2023 in Table 1. As with Figure 1, we split the votes in both elections into what are roughly votes for centre-left to left-wing candidates and votes for centre-right to right-wing candidates. Yet, to highlight the role of voter participation and in contrast with Figure 1, we include a third group of voters, which we label N-B-A in what follows. This group consists of voters who did not turn out (absentees) or turned out but expressed no preference (voted null or blank).
The Constitutional Convention and Council of 2021 and 2023.
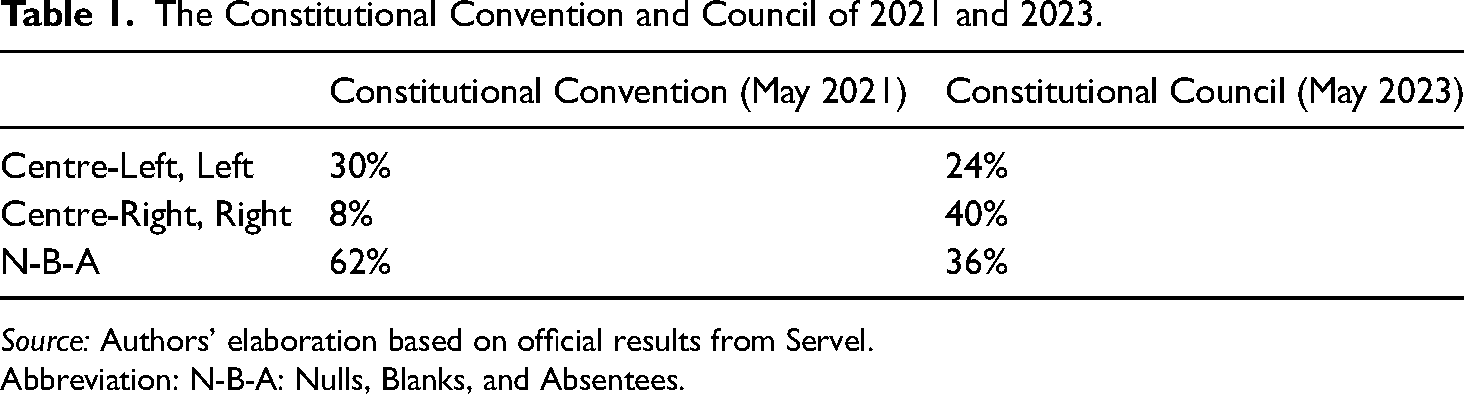
Source: Authors’ elaboration based on official results from Servel.
Abbreviation: N-B-A: Nulls, Blanks, and Absentees.
As shown in Table 1, the votes for centre-left to left-wing candidates decreased from 30 per cent to 24 per cent between both elections. If a significant fraction of those who voted for this sector in 2021 switched to voting for centre-right or right-wing candidates in 2023, it would provide evidence in support of the hypothesis of anti-systemic voters. For instance, if “voluntary voters” consistently voted for a candidate in both elections, the 6 percentage points decrease in votes for the left between the two elections would contribute to the 40 per cent of the votes received by centre-right to right-wing candidates in the 2023 election, indicating that at least 6 per cent of eligible voters would be anti-systemic.
Table 1 also reveals that the “N-B-A” group decreased from 62 per cent to 36 per cent between the two elections. If the 36 per cent of eligible voters who did not vote in 2023 also did not vote in 2021, 26 per cent of eligible voters would be “compulsory voters.” If most voted for centre-right to right-wing candidates in 2023, this could be interpreted as providing evidence supporting the hypothesis that “compulsory voters” are primarily right-leaning. However, since we have no evidence on how these voters would have voted in the first election had voting been compulsory, the possibility that a fraction of them is anti-systemic (and would have voted for left-leaning candidates in that election) cannot be dismissed.
As shown in Table 1, the votes for centre-right to right-wing candidates increased from 8 per cent to 40 per cent between both elections. If the 8 per cent of voters consistently voted for centre-right to right-wing candidates in both elections, the 32 percentage points increase in votes for the right would be accounted for by 6 per cent of anti-systemic voters and 26 per cent of a combination of “compulsory voters” and anti-systemic voters, under the simplifying assumptions of voter transitions between both elections we have made. However, other voter transitions are also plausible, providing different explanations for the 32 percentage points increase in votes received by candidates for the right.
We formally address the above questions by estimating voter transitions between these elections. Specifically, for all pairs of consecutive elections, we estimate the fraction of voters for each voting option in the earlier election that voted for each voting alternative in the following election. This implies estimating three voter transition matrices. We also estimate the voter transitions between the election for the Constitutional Convention and the election for the Constitutional Council directly. This would be trivial if we had access to individual-level voting data; however, for each election, we only have access to the total votes received by each voting option at some level of aggregation. Hence, the obstacle to obtaining these estimates lies in the well-known ecological inference problem, which involves making individual-level inferences using aggregate data. The fundamental problem of ecological inference is that many individual behaviours are consistent with the observed aggregated data (see for instance Freedman, 2001; King, 1997; King et al., 2004; Shively, 1969).
We use the ecological inference approach based on the Bayesian model developed by Rosen et al. (2001). Specifically, we employ a hierarchical multinomial-Dirichlet model with hyperpriors given by exponential distributions. 8 This approach and its variants have been used in similar problems of voter transition estimation for the United States and developing countries (e.g. Altman, 2002; Herron and Sekhon, 2005; King et al., 2008; Kopstein and Wittenberg, 2009; Lupu and Stokes, 2009; Núñez, 2016; Sandoval and Ojeda, 2023; Santucci, 2016).
The voting data is available at the polling station level. On average, a polling station consists of approximately 350 voters, for a national total of almost 43,000 stations. We aggregate the data further at the 345 municipalities due to a change in the composition of the polling stations between elections. In its simplest form, the Bayesian model assumes that the voters in both elections are the same. This is not true, since some voters die between both elections and others become eligible to vote only in the second election. However, since the number of voters registered for only one election is relatively small, we can apply the Bayesian model by incorporating these voters into the N-B-A category for the election they were not registered for. 9
Results
Table 2 presents the transition matrix between the first pair of elections we consider, the Constitutional Convention and the presidential runoff. In the Constitutional Convention, we classify candidates into three groups other than the N-B-A group: (i) La Lista del Pueblo, which consisted of several electoral lists of independent candidates, (ii) the left and centre-left candidates, which consisted both of traditional left-wing coalitions, new left-wing parties, and left and centre-left independents not belonging to La Lista del Pueblo, and (iii) right and centre-right electoral lists, which consisted of the conventional right-wing coalition as well as newer, non-traditional right-wing parties. We use the natural division between Boric and Kast voters in the presidential runoffs.
Transition Matrix Between the Constitutional Convention and the Presidential Runoff.
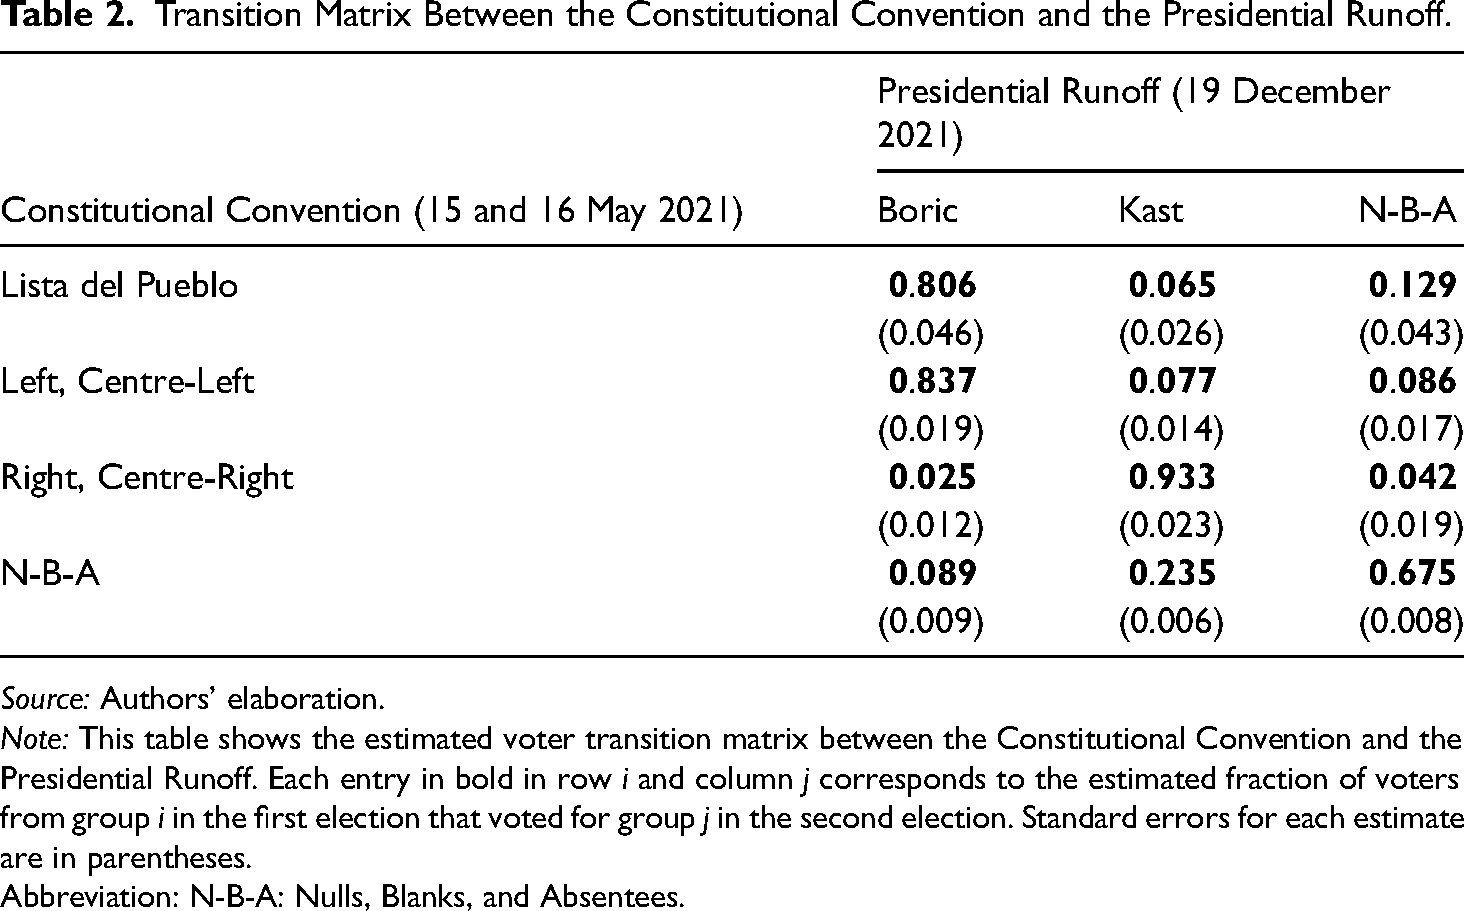
Source: Authors’ elaboration.
Note: This table shows the estimated voter transition matrix between the Constitutional Convention and the Presidential Runoff. Each entry in bold in row i and column j corresponds to the estimated fraction of voters from group i in the first election that voted for group j in the second election. Standard errors for each estimate are in parentheses.
Abbreviation: N-B-A: Nulls, Blanks, and Absentees.
There are several results of note. First, ∼ 13 per cent of voters for La Lista del Pueblo did not vote for either Boric or Kast in the presidential runoffs, despite the natural expectation that they may strongly prefer Boric. Second, ∼ 8 per cent of voters of Left and Centre-Left candidates in the Constitutional Convention voted for Kast, which is explained by the fact that Boric campaigned under a coalition to the left of the traditional left-wing parties and by the heterogeneity in the candidates grouped under this label in the May 2021 elections. Also, only 34 per cent of N-B-A voters voted for either candidate in the presidential runoffs, which points to the persistence of absenteeism. Among the latter voters, ∼ 70 per cent voted for Kast (and the remaining 30 per cent for Boric). This pattern persists in the next elections, which ultimately means that the inclination of new voters to vote for right-wing candidates was already present in 2021.
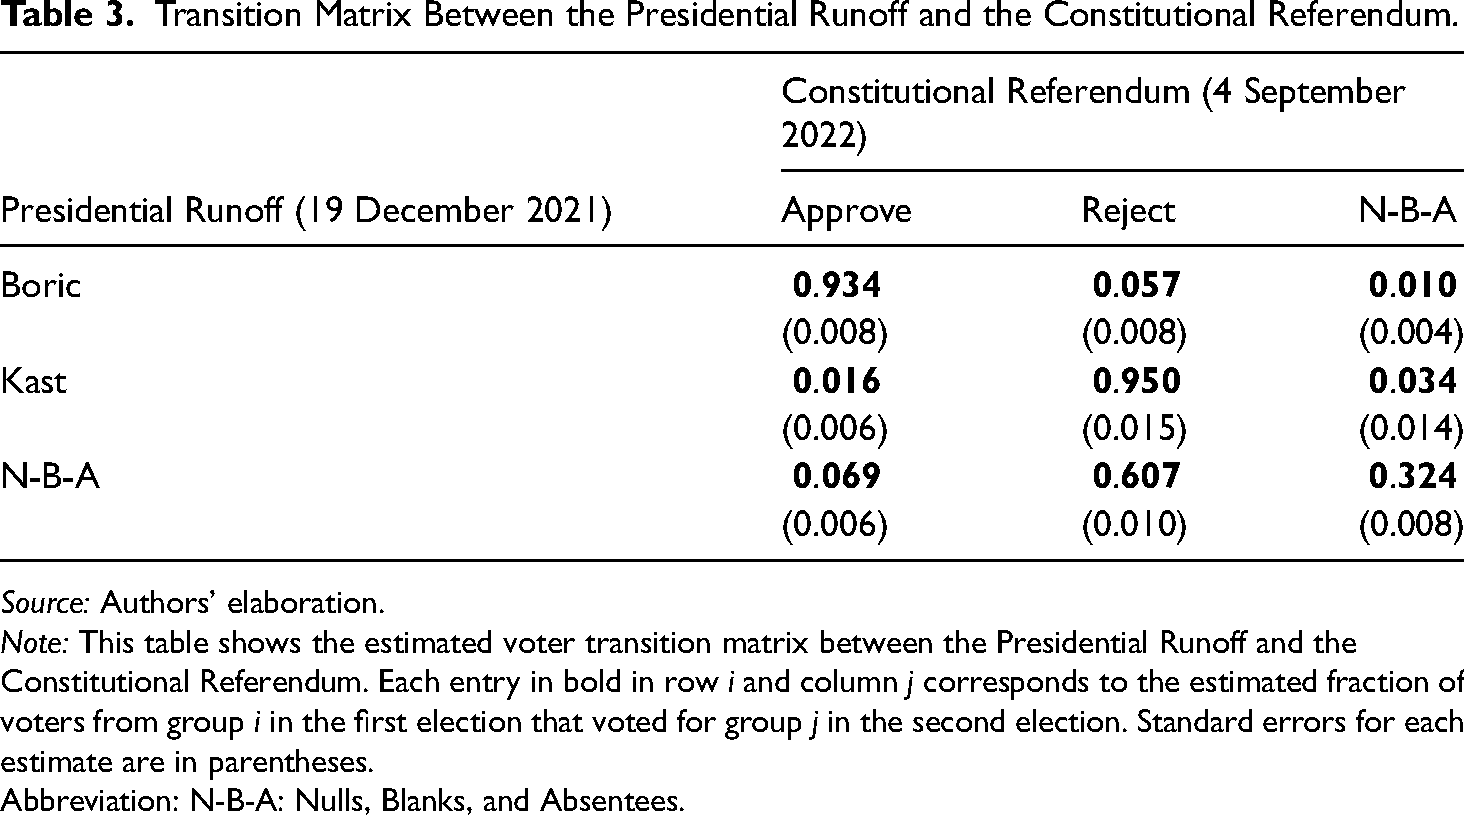
Table 3 presents the voter transition matrix for the second pair of elections (i.e. from the presidential runoff to the constitutional referendum), where we group voters in each election into two alternatives and the N-B-A group. 10
Transition Matrix Between the Presidential Runoff and the Constitutional Referendum.
Source: Authors’ elaboration.
Note: This table shows the estimated voter transition matrix between the Presidential Runoff and the Constitutional Referendum. Each entry in bold in row i and column j corresponds to the estimated fraction of voters from group i in the first election that voted for group j in the second election. Standard errors for each estimate are in parentheses.
Abbreviation: N-B-A: Nulls, Blanks, and Absentees.
Most Boric voters voted to approve the new constitution, while Kast voters overwhelmingly voted to reject it. Interestingly, very few Boric voters rejected the constitutional draft, which is not evident from aggregate results given the ample victory for the option to reject. The wide margin of victory for this alternative came from new voters. Due to the compulsory voting policy adopted starting in the constitutional referendum, almost 70 per cent voted for one of the alternatives in the referendum rather than not voting or issuing a null or blank vote. And ∼ 95 per cent of these voters chose to reject the constitutional draft. This is evidence of the overwhelming rejection of the constitutional draft among the newly incorporated part of the electorate, which was a common hypothesis among analysts immediately following the results of the Constitutional Plebiscite.
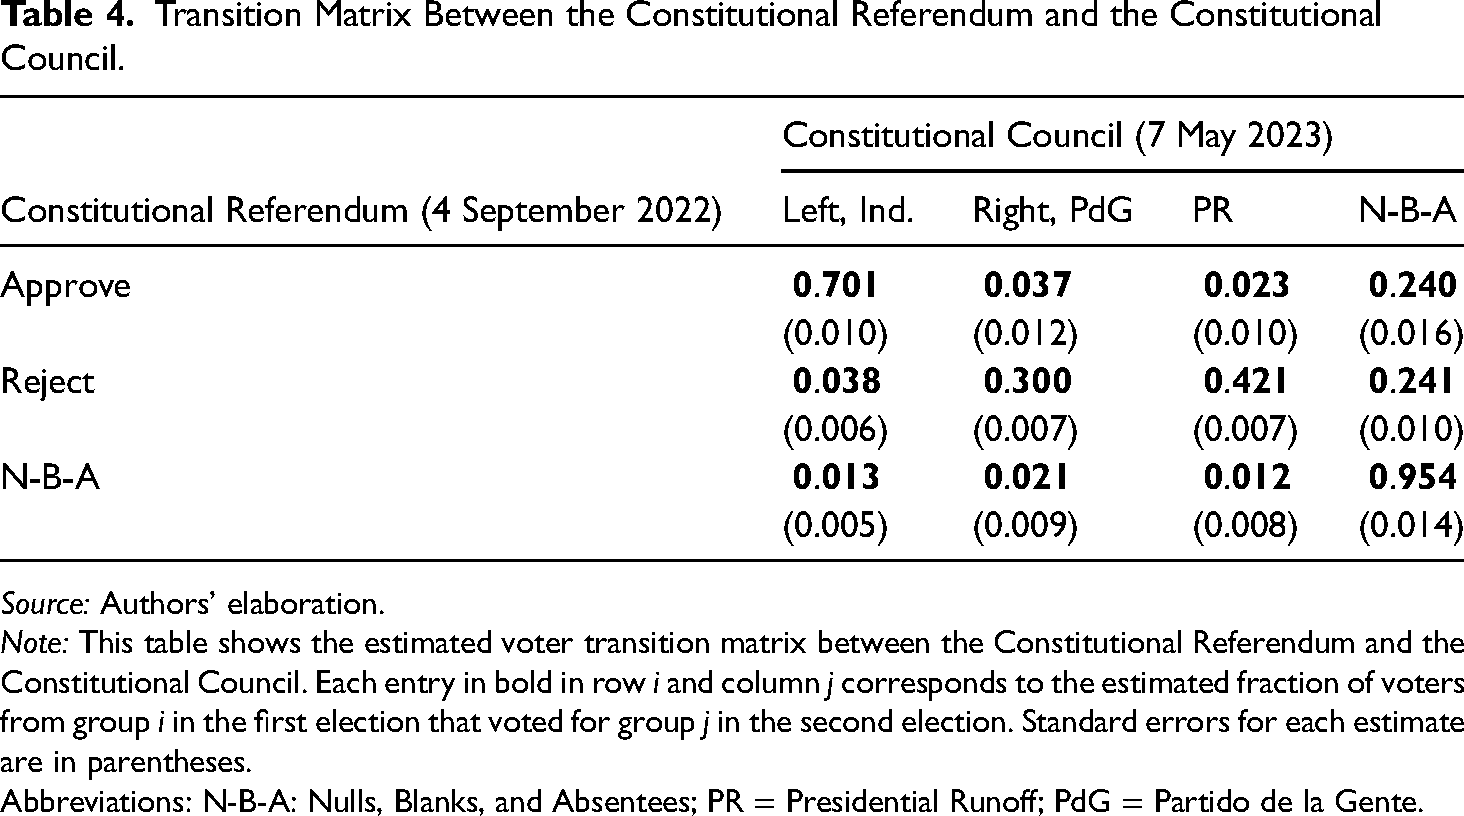
Table 4 presents the final transition matrix, between the 2022 referendum and the constitutional council. We divide voters into three groups besides the N-B-A group for the constitutional council elections. The first comprises left and centre-left coalitions and three independent candidates who received insignificant votes for the results. The second includes the traditional right-wing parties and the populist Partido de La Gente (PdG). 11 The last group consists of candidates from the Partido Republicano (PR), a right-wing party to the right of the conventional right and centre-right coalition.
Transition Matrix Between the Constitutional Referendum and the Constitutional Council.
Source: Authors’ elaboration.
Note: This table shows the estimated voter transition matrix between the Constitutional Referendum and the Constitutional Council. Each entry in bold in row i and column j corresponds to the estimated fraction of voters from group i in the first election that voted for group j in the second election. Standard errors for each estimate are in parentheses.
Abbreviations: N-B-A: Nulls, Blanks, and Absentees; PR = Presidential Runoff; PdG = Partido de la Gente.
The first results of note are the fraction of Approve and Reject voters who voted either null, blank, or did not vote in the election for the Constitutional Council, which is ∼ 24 per cent for both groups. This is consistent with the almost 2.5 million null and blank and 5 million N-B-A votes in the elections for the constitutional council. The results for the transition matrix suggest a similar proportion of approve and reject voters that voted either null, blank, or abstained. The reasons not to vote for some candidate in the Constitutional Council may differ between both groups of voters, but we cannot speak to these differences based on these results alone. Reject voters, on the other hand, who are composed mainly of the new electorate brought on by mandatory voting, voted more for the Partido Republicano than for the group consisting of traditional right and centre-right parties and the Partido de la Gente. The N-B-A group, mainly composed of voters who chose not to vote despite mandatory voting policies and the possibility of a fine, chose overwhelmingly not to vote again.
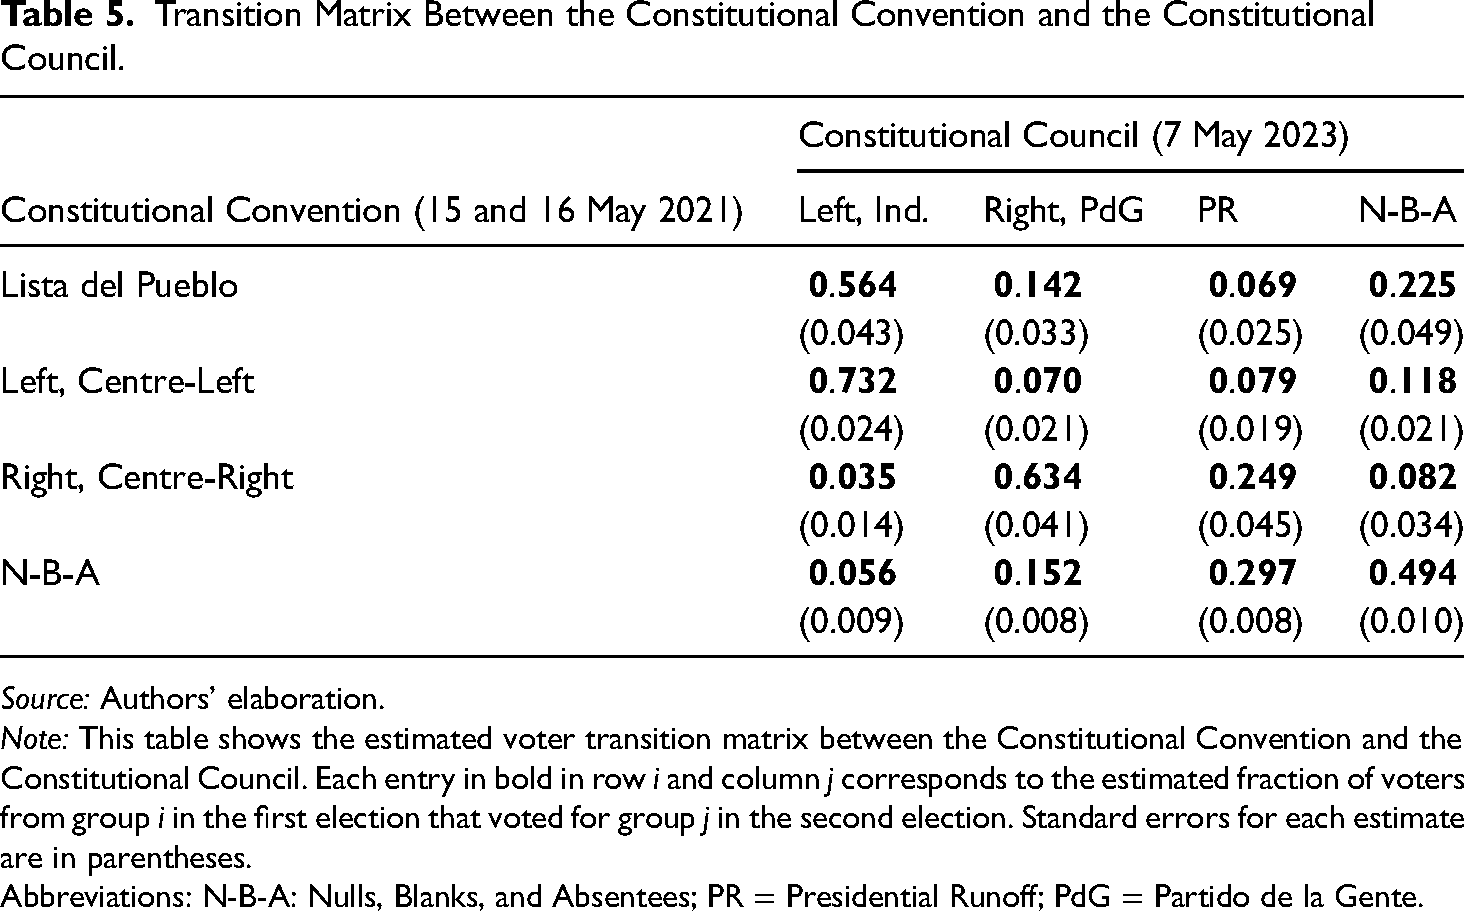
The final voter transition matrix we estimate is for the transition between the election for the Constitutional Convention and the Constitutional Council directly, in the same way as we have for the previous pairs of elections. Results are presented in Table 5.
Transition Matrix Between the Constitutional Convention and the Constitutional Council.
Source: Authors’ elaboration.
Note: This table shows the estimated voter transition matrix between the Constitutional Convention and the Constitutional Council. Each entry in bold in row i and column j corresponds to the estimated fraction of voters from group i in the first election that voted for group j in the second election. Standard errors for each estimate are in parentheses.
Abbreviations: N-B-A: Nulls, Blanks, and Absentees; PR = Presidential Runoff; PdG = Partido de la Gente.
Of the people who voted for the Lista del Pueblo, 21 per cent voted for candidates in one of the right-wing parties. 12 About 57 per cent voted for left-wing candidates, while many voted null, blank, or did not vote. Furthermore, of the voters who had not voted in the Constitutional Convention, roughly half voted for some candidate in the elections for the Constitutional Council. Among these, 90 per cent voted for right-wing candidates, and most of these (66 per cent) for candidates from the Partido Republicano. Only 10 per cent of valid votes among these voters were for left-wing and independent candidates. This is in line with all the previous evidence, where we have consistently found that N-B-A voters vote for right-wing candidates or alternatives supported by right-wing parties.
Table 5 also summarises the evidence we found for the two hypotheses we focused on. The first hypothesis, the “new voters” hypothesis, is that the move from voluntary to compulsory voting between both elections benefitted mainly political parties from the right. The second hypothesis, the “anti-systemic voters” hypothesis, is that a significant fraction of the population is not voting along the traditional right–left axis but instead opting for options perceived as anti-systemic. These options vary over time, for example, an anti-systemic political party loses this label when it transitions from the opposition to the government.
The second row in Table 5, describing the evolution of those who voted for the Lista del Pueblo in the first election, which consisted of various lists of independent candidates critical of traditional political parties and mostly at the extreme left of the political spectrum, provides evidence for the anti-systemic hypothesis. This row's second and third entries indicate that ∼ 21 per cent of these voters – that is, ∼ 200,000 voters – opted for candidates from traditional parties on the right and the Partido Republicano in the second election.
The third row of Table 5, describing the evolution of those who voted for candidates on the left in the first election, also provides evidence for the anti-systemic hypothesis. This row's second and third entries indicate that ∼ 15 per cent of these voters opted for candidates on the right in the second election. Viewed through the lens of the anti-systemic hypothesis, they abandoned political parties (such as the Communist Party and the parties in the Frente Amplio) because these parties moved from the opposition to the government between both elections. The anti-systemic stance that identified these parties while being in the opposition became a hard sell once they became the leading parties in the government coalition, as they had become part of the system. This row also includes voters for Non-Neutral Independents, a list of centre-left candidates with an anti-political-party stance that obtained 9 per cent of the total valid votes in the first election. These voters moved from a left-of-centre anti-systemic option to an anti-systemic option on the right. Adding up both groups, we obtain ∼ 400,000 anti-systemic voters in this row. 13
The last row of Table 5 offers evidence in favour of the “new voters” hypothesis. This row's first and second entries indicate that among the voters who only voted in the second election, when voting had become compulsory, those who voted for political parties on the right were 2.7 times as many as those who voted for political parties on the left. This marks a difference of ∼ 600,000 voters in favour of political parties of the right. 14
Finally, we have that ∼ 30 per cent of the N-B-A voters from the first election voted for the Partido Republicano in the second election (see the third entry of the last row of Table 5). These are ∼ 2.8 million voters. Since the Partido Republicano is a party with an anti-systemic stance that has never been in government and a political party on the far right of the political spectrum, these voters can be ascribed to both hypotheses under consideration.
Even though our interpretation of the entries in Table 5 considering the two hypotheses we consider involves some simplifications, we believe that the overall picture that emerges is a good summary of where we stand. We find similar numbers of voters consistent with each of the two hypotheses we consider (800,000 anti-systemic voters vs. 600,000 new voters), and a much larger number (2.8 million voters) for which we need to analyse the results from future elections to elucidate the relative importance of both types of voters among them.
Preliminary Conclusions
The aim of this article is to contribute to the understanding of the major shift from the left to the right that took place between the elections in 2021 and 2023 of bodies in charge of drafting constitutional proposals in Chile (see Figure 1). One explanation for the previous results is that the elections for the Constitutional Convention in May 2021 were preceded by the referendum to determine whether a new constitution would be written, where the option to write a new constitution won with 80 per cent of the votes. The overwhelming result of this election might have discouraged right-wing voters from voting in the May 2021 election, which was the next election following said referendum. The mandatory voting policies would have brought them back into the voting pool. This is also consistent with other results.
For instance, if new voters brought on by the mandatory voting policies implemented starting in the September 2022 elections were right-leaning, we would expect them to Reject in the September 2022 Plebiscite and to continue to vote for right-leaning candidates in the following elections, which is the result we observe in Table 3, where N-B-A voters mostly voted to Reject, in Table 4, where Reject voters (composed in a great part of past N-B-A voters) mostly voted for right-leaning candidates, and in Table 5, where the vote for left-leaning candidates among the N-B-A group is small when compared to the vote for right-leaning candidates. However, this alone does not explain the results of the presidential runoff and the Constitutional Council, where there might be other motivations at play that we cannot evaluate based on the available data alone. For example, the result in Table 5 that 21 per cent of voters for the Lista del Pueblo in the Constitutional Council voted for right-wing parties suggests the presence of at least some degree of what we call anti-systemic voters.
The evidence presented here is not enough to distinguish whether new voters are right-wing voters or anti-systemic voters, and the presence of a robust anti-systemic vote is still possible. The most likely explanation is that, ultimately, the presence of both types of voters led to the results of all these elections. However, our estimations provide strong evidence for the tendency of N-B-A voters in each election to vote for right-wing candidates and that this tendency has been present since the first pair of elections in 2021. Further, our evidence suggests that the compulsory voting policy implemented starting in the 2022 constitutional plebiscite significantly impacted the results of both following elections, whatever the reasons explaining the tendency of new voters to vote for right and centre-right candidates.
Footnotes
Acknowledgements
We are grateful to the anonymous reviewers and the Editor of JPLA for their valuable comments. This work was supported by ANID Fondecyt 1230221.
Declaration of Conflicting Interests
The author(s) declared no potential conflicts of interest with respect to the research, authorship, and/or publication of this article.
Funding
The author(s) disclosed receipt of the following financial support for the research, authorship, and/or publication of this article: This work was supported by the Fondo Nacional de Desarrollo Científico y Tecnológico (grant number 1230221).
Notes
Author Biographies
Appendix
In this appendix, we provide a description of the composition of the groups that were considered for estimating the transition matrix between the May 2021 and May 2023 elections. The composition of the groups in the other two elections we focus on in this research note is straightforward.
The electoral lists (listed by the letters assigned to them by the Chilean Electoral Service) included in each group in the election for the Constitutional Convention (the May 2021 election) are the following:
Lista del Pueblo: E, G, J, N, Q, S, WD, WJ, XC, XD, XJ, XT, YL, YP, ZD, ZE, ZI, ZN. Left, Centre-Left: A, D, F, H, I, L, P, T, W, WB, WE, WI, WK, XA, XB, XF, XG, XH, XI, XL, XM, XN, XR, XV, YB, YD, YE, YF, YI, YK, YO, YQ, YS, YT, YU, YV, YZ, ZA, ZB, ZF, ZH, ZK, ZL, ZM, ZQ, ZR, ZT, ZW, ZY, ZZ, and independents competing out of electoral pacts. Right, Centre-Right: XP, YX. N-B-A: Nulls, Blanks, and Absentees.
Within the “Left, Center-Left” group, most of the votes came from three pacts: Lista del Apruebo (YB), Apruebo Dignidad (YQ), and Independientes no Neutrales, which was composed of various lists. The rest of the votes are composed of approximately 300,000 votes for smaller parties that presented candidates in their own pacts, independent candidates competing outside of any pact, and smaller electoral lists. The most successful of these smaller lists received ∼ 40,000 votes.
Within the “Right, Center-Right” group, most of the votes came from the Vamos por Chile (XP) pact. The remaining votes were contributed by two fringe far-right conservative parties that presented candidates under a common pact (YX).
The electoral lists (listed by their names) included in each group in the election for the Constitutional Council (the May 2023 election) are the following:
Left, Ind: Unidad para Chile, Todo por Chile, and independents. Right, PdG: Chile Seguro, Partido de la Gente. PR: Partido Republicano. N-B-A: Nulls, Blanks, and Absentees.
Within the “Left, Ind” group, the majority of the votes were for either Unidad para Chile or Todo por Chile. Independent candidates received only around 50,000 votes. Within the “Right, PdG” group, most of the votes were for Chile Seguro.