
Abstract
Conventional wisdom indicates that politicians in Latin America are all wealthy. However, the literature on both political elites and social origins of political parties indicates that we should expect differences in the capital accumulation of politicians depending on their ideological position. This study seeks to explore that question using financial disclosure forms made available in six Latin American countries: Argentina, Bolivia, Brazil, Chile, Peru, and the Dominican Republic. We calculate the median wealth of the main political parties in each country and compared them according to their ideological position on the left–right continuum. We consistently find that the most right-leaning party in each country had a higher median wealth than the most left-leaning one. This relation is non-linear since centrist parties often represent anomalies in the distribution of wealth. When there are no ideological differences, we do not observe significant wealth differences either.
Introduction
In Latin America, corruption scandals, current global debates about socio-economic inequalities, and a succession of wealthy presidents feed people’s fantasies about politicians’ wealth, entrenching the idea that elected officials of all stripes are all very rich. This idea that politicians form a homogeneous group of wealthy individuals deserves to be put under scrutiny, as we do in this exploratory analysis, because it challenges previous research on the social origins of Latin American political parties and sociological studies of Latin America political elites.
As various works show, left-leaning parties have historically represented the working class, organised labour movements, and underprivileged groups (Collier and Collier, 1991), and conservative parties are the institutional representation of elite interests who support them financially and electorally (Gibson, 1992, 1996; Middlebrook, 2000; Power, 2000). Moreover, sociological research on political elites establishes a relationship between, on the one hand, politicians’ position on the left–right divide and, on the other hand, their capital accumulation (Costa and Codato, 2013; Miguel et al., 2015) and their trajectories and political careers (Joignant et al., 2014; Marenco and Serna, 2007). By assuming a socio-economic closeness between represented groups and their political representatives, it would be reasonable to think that only right-wing politicians are indeed wealthy people, and not their left-wing colleagues. This is reinforced by the fact that wealthy presidents are more often than not from the right, 1 and by the recent tendency of successful entrepreneurs to be nominated as ministers in right-wing cabinets (Schneider and Karcher, 2012: 17–18).
In this research, we analyse the distribution of economic capital among Latin American parliamentarians according to the left–right divide by using their asset disclosures. Such undertaking is only possible because, following a worldwide trend toward transparency (Djankov et al., 2010), several Latin American countries have required elected officials to fill out financial and asset disclosure forms. Although the first purpose of these declarations is to help in tracking down corrupt politicians (Organization for Economic Co-operation and Development [OECD], 2011), these documents, as it turns out, also provide original and useful empirical data on politicians’ wealth in the region.
Such empirical material recently started to be used for national case studies (da Fonseca Engler, 2018), but our exploratory research constitutes, to our knowledge, the first attempt to use politicians’ disclosure data for comparative purposes on a larger scale. We are fully aware that politicians’ declarations only contain what they are willing to disclose, without audits or further verifications of their veracity. We consider nonetheless that using them to assess how much wealth right-wing and left-wing Latin American politicians do disclose is a worthy undertaking. It contributes to filling existing gaps in the vast literature on parliamentary elites in Latin America by providing a missing piece of the empirical puzzle regarding the socio-economic profile of parliamentarians (Costa and Codato, 2013; Joignant et al., 2014; Marenco and Serna, 2007; Miguel et al., 2015). It also contributes to the literature on money and politics, because the level of wealth disclosed by parliamentarians can give us an idea of how much personal wealth matters for political success (Barndt, 2014; Eduardo and Araújo, 2016; González-Bustamante, 2015; Krause et al., 2020).
Methodological Challenges to Assess Politicians’ Wealth
Case Selection and Data Collection
For this exploratory research, the case selection is driven by the availability of data. In the region, parliamentarians are required by law to disclose their finances and assets in seventeen out of the nineteen Spanish- and Portuguese-speaking countries (Djankov et al., 2010). Only in eight of them (Argentina, Bolivia, Chile, the Dominican Republic, Ecuador, Mexico, Nicaragua, and Peru), parliamentarians’ asset declarations are accessible to anyone by law. 2 Nevertheless, we should discard Mexico, Nicaragua, and Ecuador. First, Mexico and Nicaragua only allow public access to parliamentarians’ disclosures under strict conditions, rendering them inaccessible in practice. Second, in Ecuador a significant number of disclosure forms were missing on the Comptroller General of the State’s website.
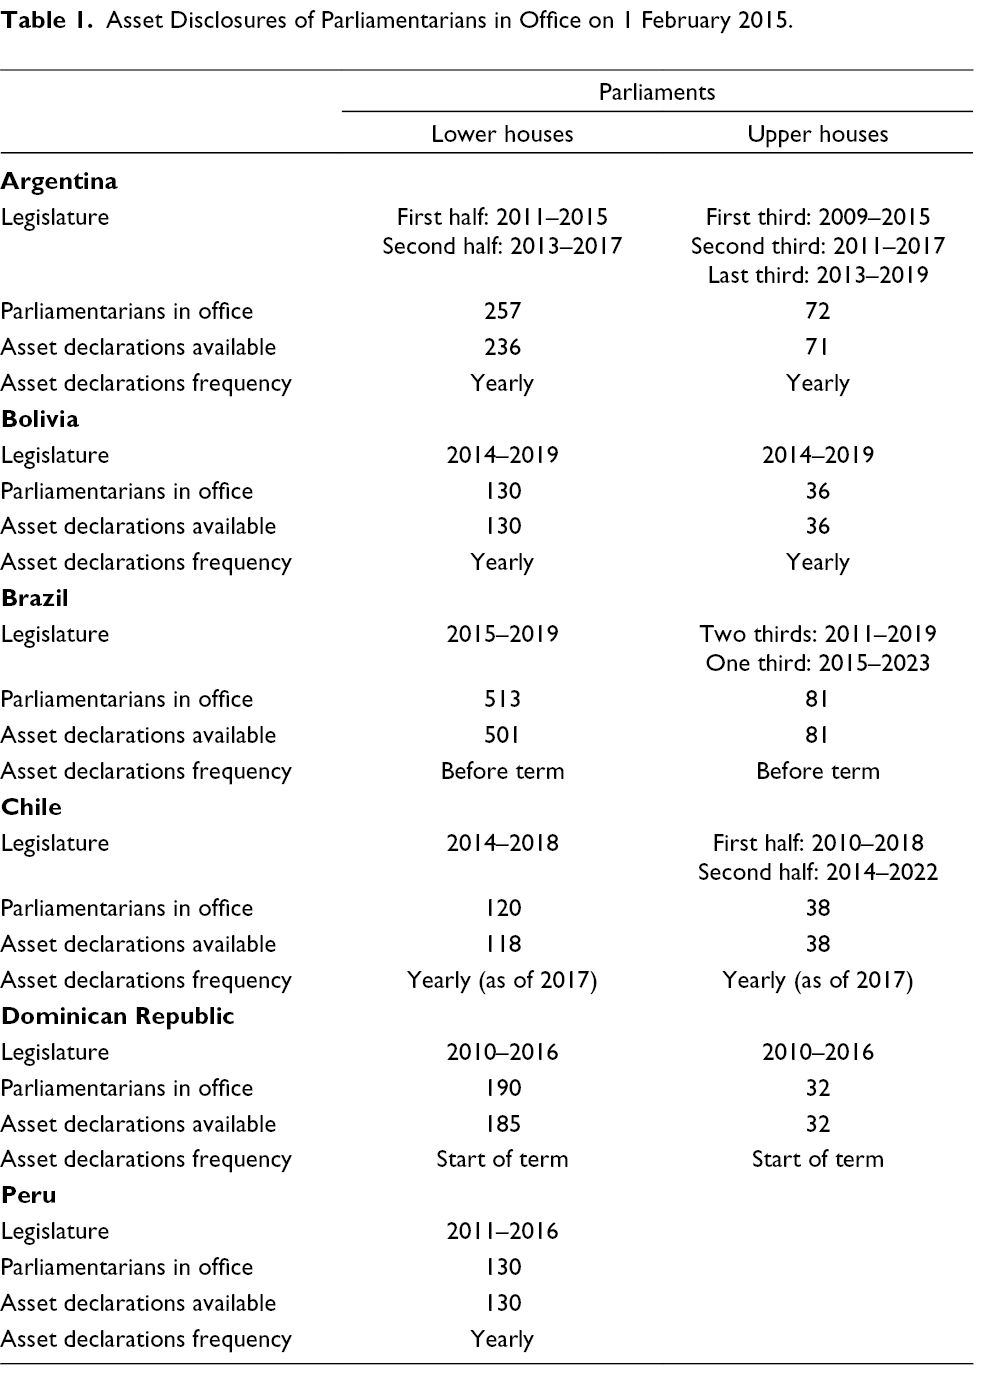
In the remaining countries, data are available online. In Argentina, a group of civil society organisations launched an online platform with detailed data. 3 In Chile, the Comptroller General of the Republic and the Council for Transparency publish the information online. In Bolivia and Peru, each Comptroller General makes available online a summary of the asset disclosure form of each parliamentarian. In the Dominican Republic, the information is not centralised by a single agency on a unique website but can be found on the websites of both legislative houses. Along with those five countries, we can also add Brazil. Despite that Brazilian parliamentarians’ disclosure forms are not public, electoral law requires a complete and public asset disclosure for all candidates running for elected offices. We cover eleven legislatures from six countries (Table 1). We examine the disclosure forms of 1,300 MPs and 258 senators who, for comparative purposes, were in office on 1 February 2015. 4
Asset Disclosures of Parliamentarians in Office on 1 February 2015.
Data Processing: Synchronicity, Uniformity and Actualisation
All the data used to assess politicians’ wealth are not necessarily from 2015. In the Dominican Republic, only the declarations submitted by parliamentarians when taking office in 2010 are available. In Brazil, the information we have for the 2015–2018 legislature stems from the candidates’ declarations given to the Superior Electoral Court (Tribunal Superior Eleitoral, TSE) in 2014. In Argentina, Bolivia, Chile, and Peru, elected officials are required to give an updated declaration of their assets to the Comptroller General every year. Nevertheless, not all elected officials comply with the rule every year, and for some of them, the only declaration available is the one submitted upon taking office, which can vary even within the same legislature. Sometimes, the declaration from 2015 was no longer available online because it had been substituted by a more recent one by the time of our research. Therefore, even though the available data allowed us to focus on the assets disclosed in 2015, we broadened the time period in order to include every member of the considered legislatures.
What is made public depends on national legislations. In Argentina, Brazil, and the Dominican Republic, full and detailed declarations are available. In these countries, the disclosure forms generally include the following categories: real estate (houses, apartments, offices, or land); goods and chattels (e.g. cars, boats, jewellery, furniture, paintings, livestock, and agricultural goods); bonds and investments (e.g. shares); savings (bank accounts, including overseas, and cash); financial revenues (salaries, rents, and sales); family inheritance (e.g. cash, real estate); debt securities and also debt obligations; and sometimes a detailed account of living expenses. In Bolivia and Peru, however, by law, only a summary of the declarations filled out by parliamentarians is available. These concise documents merely include the total values of income, assets, and debts of each parliamentarian. The summaries from Peru mention that the disclosed value consists of an addition of both real estate and personal assets. In Chile, only the total value of each category of assets (real estate, shares, personal goods, and securities) is available.
Thus, we consider the following categories of assets usually present in their declarations: real estate, goods and chattels, cash and savings, family inheritance, bonds and investments, and other securities. We do not assess if the value of each asset represents its fair market value at the time of disclosure. If the politician reports the price paid at the time of purchase, we consider it as the asset’s market value. When only a summary of the declarations is available, as in Bolivia and Peru, we only consider the total value of assets disclosed by parliamentarians. Since accounting for liabilities would complicate the exercise because not every jurisdiction demands their disclosure, we prefer to report only gross wealth instead of net wealth, that is, total value of assets minus liabilities. Moreover, we do not use politicians’ revenues for our analysis because our purpose is to report on how much wealth politicians disclose rather than how much they earn.
A second issue with the raw data concerns the moment when each legislature asks their members to report. Every country has its own electoral cycle, affecting the moment of disclosure. Also, the value of most assets is in the respective national currency. We have brought to present value, at 31 December 2016, all reported figures associated with values for each disclosed asset. That is, we have accounted for the inflation of 2016, measured by the consumer price index as reported by The World Bank. Finally, the value in national currency was converted to US dollars at the exchange rate of the last working day of 2016, as reported by each national central bank.
The exception is Argentina. Figures for the country’s variation in consumer prices are considered unreliable for the years 2015 and 2016. As a result, there is no comparable value of inflation to bring to present value the figures disclosed before those years. Furthermore, there were numerous reports about the inaccuracy of the official exchange rate in those same years. These unfortunate events led us to treat Argentinean data differently. First, values disclosed before 2014 are presented at 2014 values, which in turn are considered equivalent to the values reported in 2015, due to the lack of consumer prices variation data necessary to calculate the present value for 2015. Given the existence of a parallel market for US dollars, we decided to report Argentinean figures in national currency (ARS) and US dollars converted through both exchange rates, the official (USD) and the parallel (P-USD), for the last day of 2015. 5 Although this allows the inclusion of Argentina in cross-national comparisons, the nature of this data and the compromises needed to include this information force us to take it with great caution.
Moreover, to analyse the difference between the Left and the Right, we rely on the indicator of the Parliamentarian Elites in Latin America (PELA) project at the University of Salamanca, Spain about how MPs place their own parties. 6 Because in several countries of our sample, there is considerable party fragmentation, we focus on the main parties within each case. Finally, we estimate the median wealth of each party, rather than the average, because that measure is less sensitive to the presence of outliers within the sample.
The Distribution of Personal Wealth Between the Left and the Right
Argentina
In Argentina, the median value of assets disclosed by leftist politicians is lower than the median disclosed by their rightist counterparts. The party furthest to the right in Congress is the relatively conservative and corporation-based Propuesta Republicana (Republican Proposal, PRO) (Barndt, 2016). It exhibits a median wealth of USD 148,602 (ARS 1,937,775). This is 2.5 times the median value disclosed by members of the Partido Socialista (Socialist Party, PS), the party most to the left (Table 2). A similar imbalance also exists between the median wealth of the centre-left Peronist Frente para la Victoria (Front for Victory, FPV) and the right-wing PRO, even if the gap is lower.
Composition and Wealth of the Argentine National Congress on 1 February 2015.
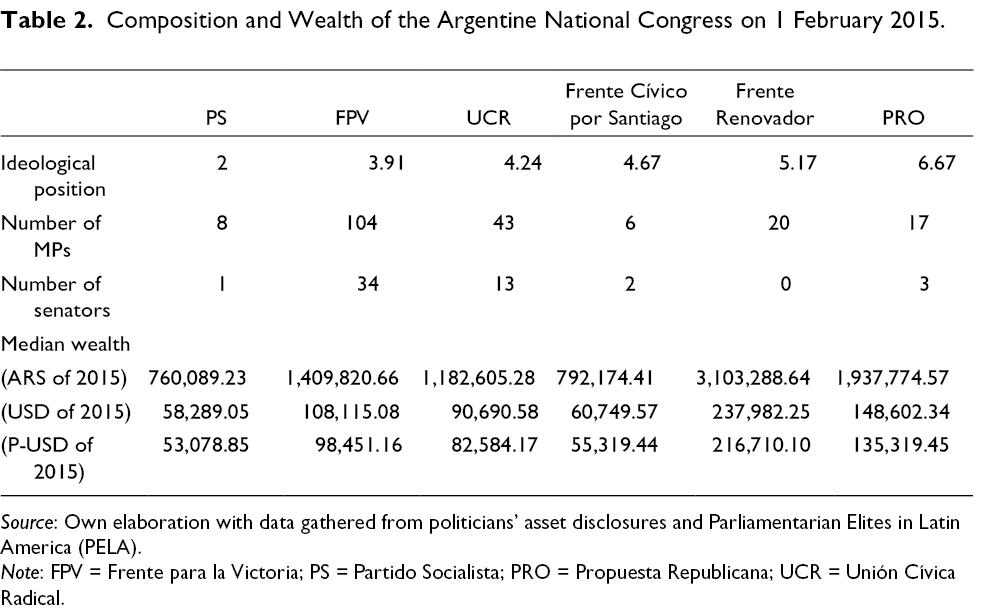
Source: Own elaboration with data gathered from politicians’ asset disclosures and Parliamentarian Elites in Latin America (PELA).
Note: FPV = Frente para la Victoria; PS = Partido Socialista; PRO = Propuesta Republicana; UCR = Unión Cívica Radical.
Although right-leaning politicians seem to be wealthier than left-leaning politicians, this relation between ideological position and wealth is not linear (Figure 1). First, the median wealth of the centre-right Frente Renovador (Front for Renewal) (USD 237,982 – ARS 3,103,289) is clearly higher than that of Mauricio Macri’s PRO (USD 148,602 – ARS 1,937,775). Second, the median wealth of centrist politicians from both the Unión Cívica Radical (Radical Civic Union, UCR) and the Frente Cívico por Santiago (Civic Front for Santiago) is lower than that of the FPV. Further research is required to explain why members of the FPV, close to the workers, seem wealthier than their colleagues from the UCR, which historically represents the middle classes.
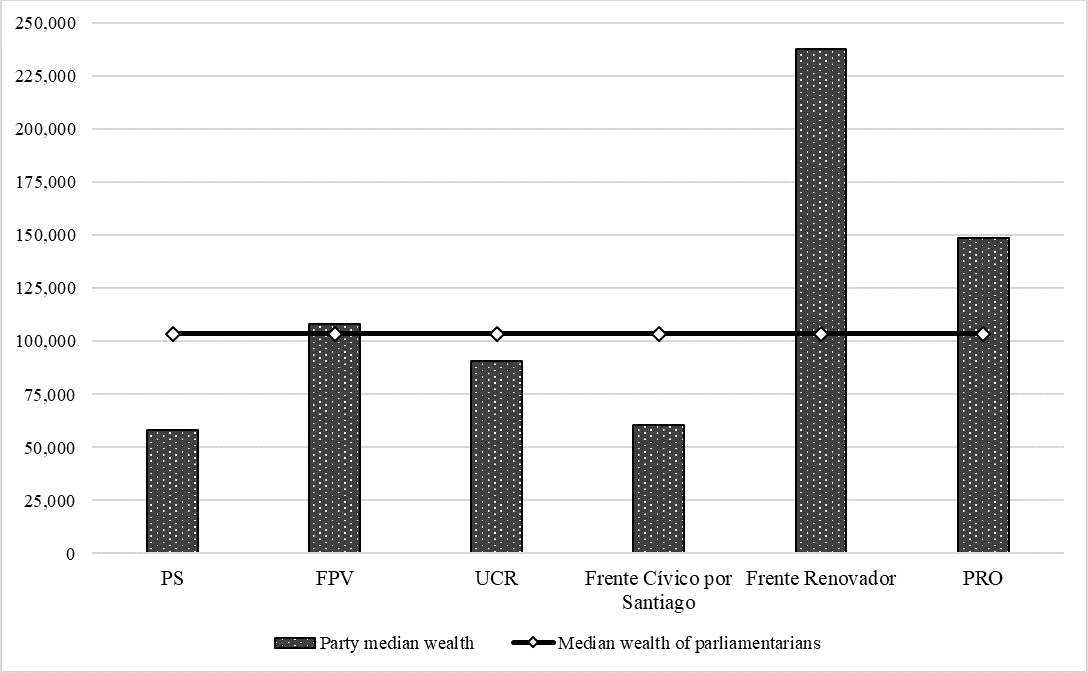
Politicians’ Median Wealth in Argentina by Political Party in 1 February 2015 (USD of 2015). PS: Partido Socialista; FPV: Frente para la Victoria; UCR: Unión Cívica Radical; PRO: Propuesta Republicana.
The non-linearity in the Argentinean case is also affected by Peronism’s idiosyncrasies. The FPV is its main representative in the legislature studied here. Peronism is difficult to classify: it is a labour-related political party, which would normally be placed on the left of the political spectrum, but it also has hierarchical-authoritarian characteristics of the kind observed in right-leaning movements (Ostiguy, 2009). Another finding concerns the regionally oriented centrist Frente Cívico por Santiago, which displays a wealth almost as low as that of the PS.
Bolivia
In Bolivia, the variation in terms of wealth is linear: left-wing politicians disclose less assets than their counterparts from the Right. With a median wealth of USD 105,904, MPs and senators from the left-wing Movimiento al Socialismo (Movement to Socialism, MAS) are those who disclose the least in the Bolivian parliament. Such a result was to be expected considering the MAS’s grass-root origins and its resistance to professionalisation (Anria, 2018). This movement-based party actually exhibits the second lowest median wealth per politician of all the political parties considered in this research 7 (Table 3), right after the Communist Party of Chile (USD 100,645) and just before the left-leaning Gana Perú (USD 109,325). Comparatively, politicians from the MAS disclose half the amount of those from the Brazilian Workers’ Party (USD 211,204), a professionalised movement-based party (Goirand, 2014).
Composition and Wealth of the Plurinational Legislative Assembly of Bolivia on 1 February 2015.
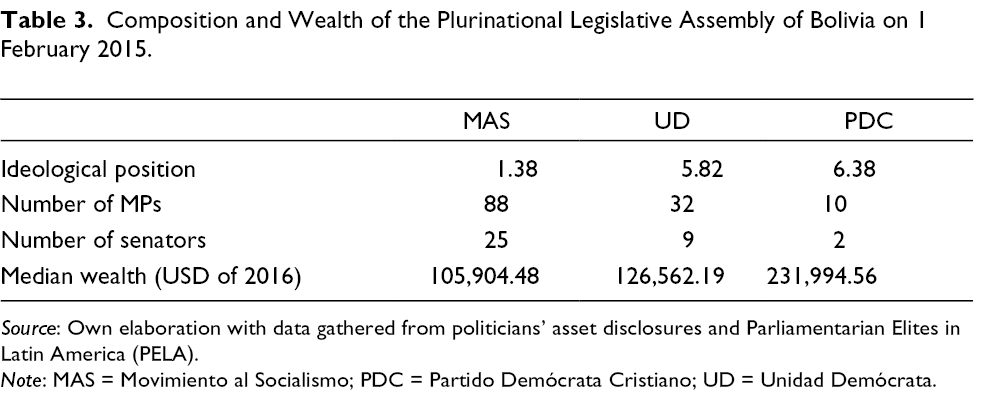
Source: Own elaboration with data gathered from politicians’ asset disclosures and Parliamentarian Elites in Latin America (PELA).
Note: MAS = Movimiento al Socialismo; PDC = Partido Demócrata Cristiano; UD = Unidad Demócrata.
At the centre of the political spectrum, parliamentarians from the Unidad Demócrata (Democrat Unity, UD) declare about USD 126,562 of assets. The gap with the MAS is then not that important (Figure 2). This is surprising, since the UD is the party of Samuel Doria Medina – “the wealthiest man in Bolivia” (Centellas, 2015: 95) – we could expect parliamentarians from his party to be wealthy entrepreneurs as well.
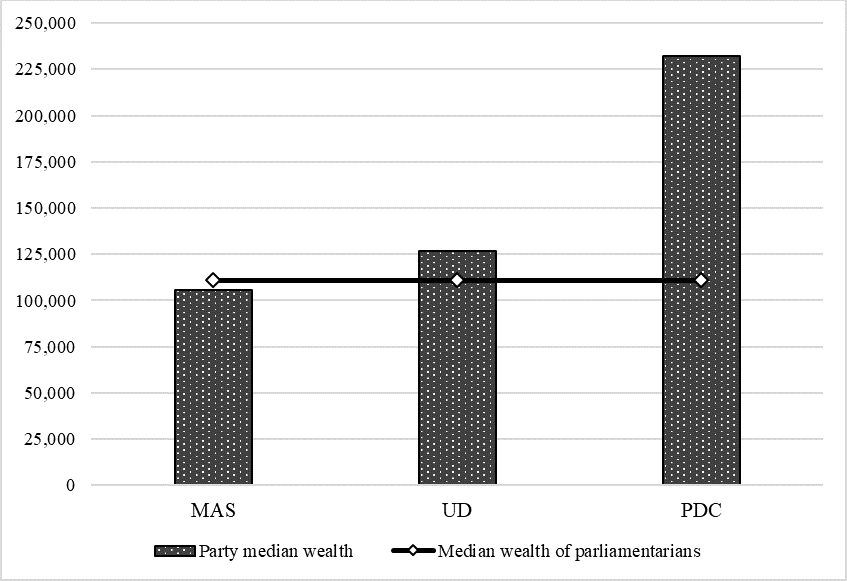
Politicians’ Median Wealth in Bolivia by Political Party on 1 February 2015 (USD of 2016). MAS: Movimiento al Socialismo; UD: Unidad Demócrata; PDC: Partido Demócrata Cristiano.
Elected officials from the opposition right-wing Partido Demócrata Cristiano (Christian Democratic Party, PDC) seem to be the wealthiest politicians in Bolivia (USD 231,995), with twice the amount disclosed by their MAS’s colleagues (USD 105,904). Nonetheless, a cross-national comparison puts into perspective the wealth of the Bolivian Right. Indeed, politicians from the PDC are far from being as rich as right-wing politicians from Brazil, Chile, and the Dominican Republic, and they hardly disclose more assets than those from the left-wing Workers’ Party, the “poorest” politicians in Brazil.
Brazil
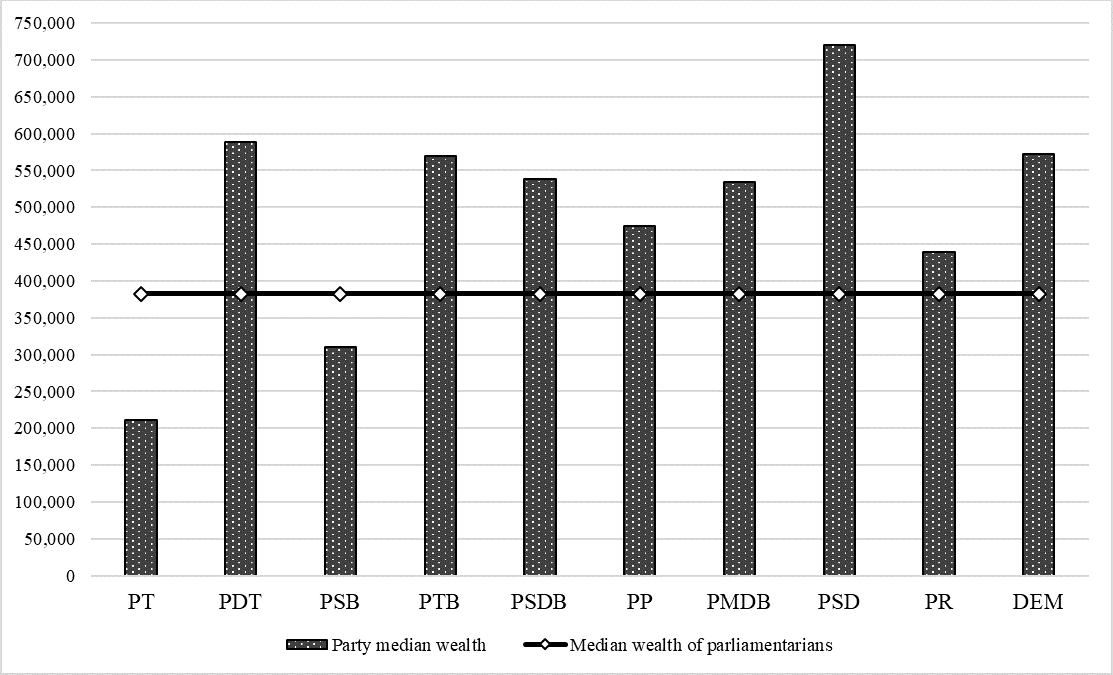
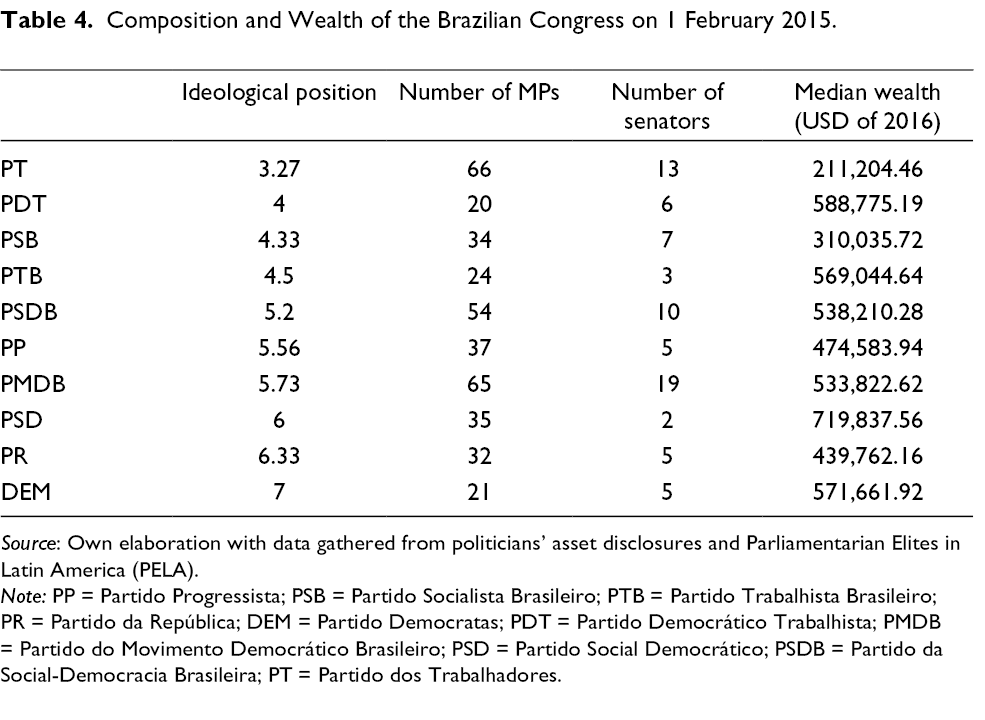
The Brazilian party system is considered ideologically fluid and very fragmented (Lucas and Samuels, 2010). This means that a clear classification on the left–right axis is not a clear-cut exercise. Four parties have been important since democratisation; from left to right, these are the Partido dos Trabalhadores (Workers’ Party, PT), the Partido da Social-Democracia Brasileira (Brazilian Social Democracy Party, PSDB), the Partido do Movimento Democrático Brasileiro (Party of the Brazilian Democratic Movement, PMDB), and the Partido Democratas (Democratic Party, DEM). Therefore, we present the four main parties from left to the right along with six other parties that have significant representation in Congress. We can verify that the party furthest to the right on the ideological spectrum, namely the DEM, has a median wealth bigger than the party furthest to the left, the PT (Figure 3). Indeed, the results show that the median parliamentarian from the DEM owns almost three times (USD 571,662) what a parliamentarian from the PT owns (USD 211,204). This is not surprising considering that, historically, the PT represents the workers’ interests (Goirand, 2014) and the DEM can be viewed as “an exclusive elite party” (Samuels and Zucco, 2016: 343). The gap between the PT and the centre-right PSDB and PMDB is also striking: the centre-right parties have a median wealth 2.5 times higher than that of the PT (Table 4). If it were not for the new levels of professionalisation instituted by the PT and the subsequent change in the socio-economic profile of its parliamentarians that fosters upper-middle class backgrounds (Louault, 2012), the median wealth might well have been even lower.
Politicians’ Median Wealth in Brazil by Political Party on 1 February 2015 (USD of 2016). PT: Partido dos Trabalhadores; PDT: Partido Democrático Trabalhista; PSDB: Partido da Social-Democracia Brasileira; PMDB: Partidodo Movimento Democrático Brasileiro; PSD: Partido Social Democrático; DEM: Partido Democratas; PSB: Partido Socialista Brasileiro; PTB: Partido Trabalhista Brasileiro; PP: Partido Progressista; PR: Partido da República.
Composition and Wealth of the Brazilian Congress on 1 February 2015.
Source: Own elaboration with data gathered from politicians’ asset disclosures and Parliamentarian Elites in Latin America (PELA).
Note: PP = Partido Progressista; PSB = Partido Socialista Brasileiro; PTB = Partido Trabalhista Brasileiro; PR = Partido da República; DEM = Partido Democratas; PDT = Partido Democrático Trabalhista; PMDB = Partido do Movimento Democrático Brasileiro; PSD = Partido Social Democrático; PSDB = Partido da Social-Democracia Brasileira; PT = Partido dos Trabalhadores.
Two anomalies are worth mentioning. First, the Partido Social Democrático (Democratic Social Party, PSD) – a post-authoritarian party (Power, 2018) – is the party with the highest median wealth among those presented above, even if the DEM is farther to the right. Second, the Partido Democrático Trabalhista (Labour Democratic Party, PDT) – despite being just beside the PT in its left-leaning positioning – presents a median wealth comparable to the PMDB and PSDB, two parties considerably farther to the right.
Chile
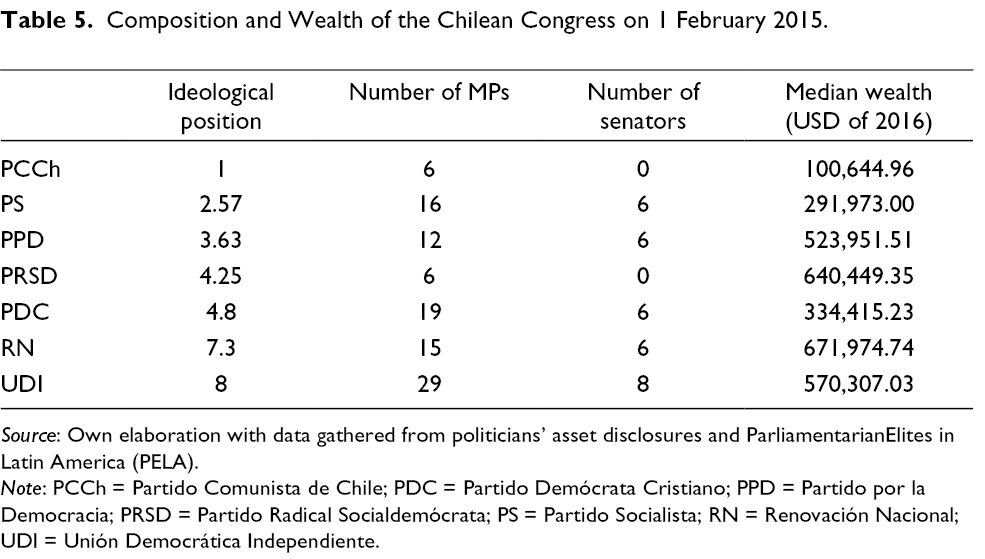
In Chile, we verify that the Partido Comunista de Chile (Communist Party, PCCh), which is the furthest left, has the lowest median wealth (USD 100,645). The most right-leaning party in our sample, meanwhile, the Unión Democrática Independiente (Independent Democratic Union, UDI), exhibits almost six times the median wealth of the PCCh (Table 5). Since the socio-economic elite that most benefited from the neoliberal reforms under Pinochet constitute the core constituency of the conservative UDI (Luna, 2010), we could expect their representatives to come from the same socio-economic strata. Even when we consider the parties sided immediately next to the two extremes, the PS on the left and Renovación Nacional (National Renovation, RN) on the right, the assessment that right-leaning parties present a higher median wealth than their left-leaning counterparts still holds, with some qualifications – RN presents a higher median wealth (USD 671,975) than the UDI (USD 570,307), regardless of their relative position on the left–right continuum – meaning that the relation between median wealth and right-leaning politics is non-linear. Moreover, the Chilean Right is, with the Brazilian Right, one of the richest political groups in the region.
Composition and Wealth of the Chilean Congress on 1 February 2015.
Source: Own elaboration with data gathered from politicians’ asset disclosures and ParliamentarianElites in Latin America (PELA).
Note: PCCh = Partido Comunista de Chile; PDC = Partido Demócrata Cristiano; PPD = Partido por la Democracia; PRSD = Partido Radical Socialdemócrata; PS = Partido Socialista; RN = Renovación Nacional; UDI = Unión Democrática Independiente.
A significant issue is the non-conformity of centrist parties. Both the Partido por la Democracia (Party for Democracy, PPD) and the Partido Radical Socialdemócrata (Republican Social-Democrat Party, PRSD) present a median wealth comparable to that of the right-wing UDI and RN (Figure 4). This is all the more surprising given how the PPD received during the 1970s former members of the PCCh (Cuevas Valenzuela, 2015). Conversely, the PDC, even if it is classified as centrist (Huneeus, 2003), presents a median wealth comparable to that of the PS, which is found far to the left.
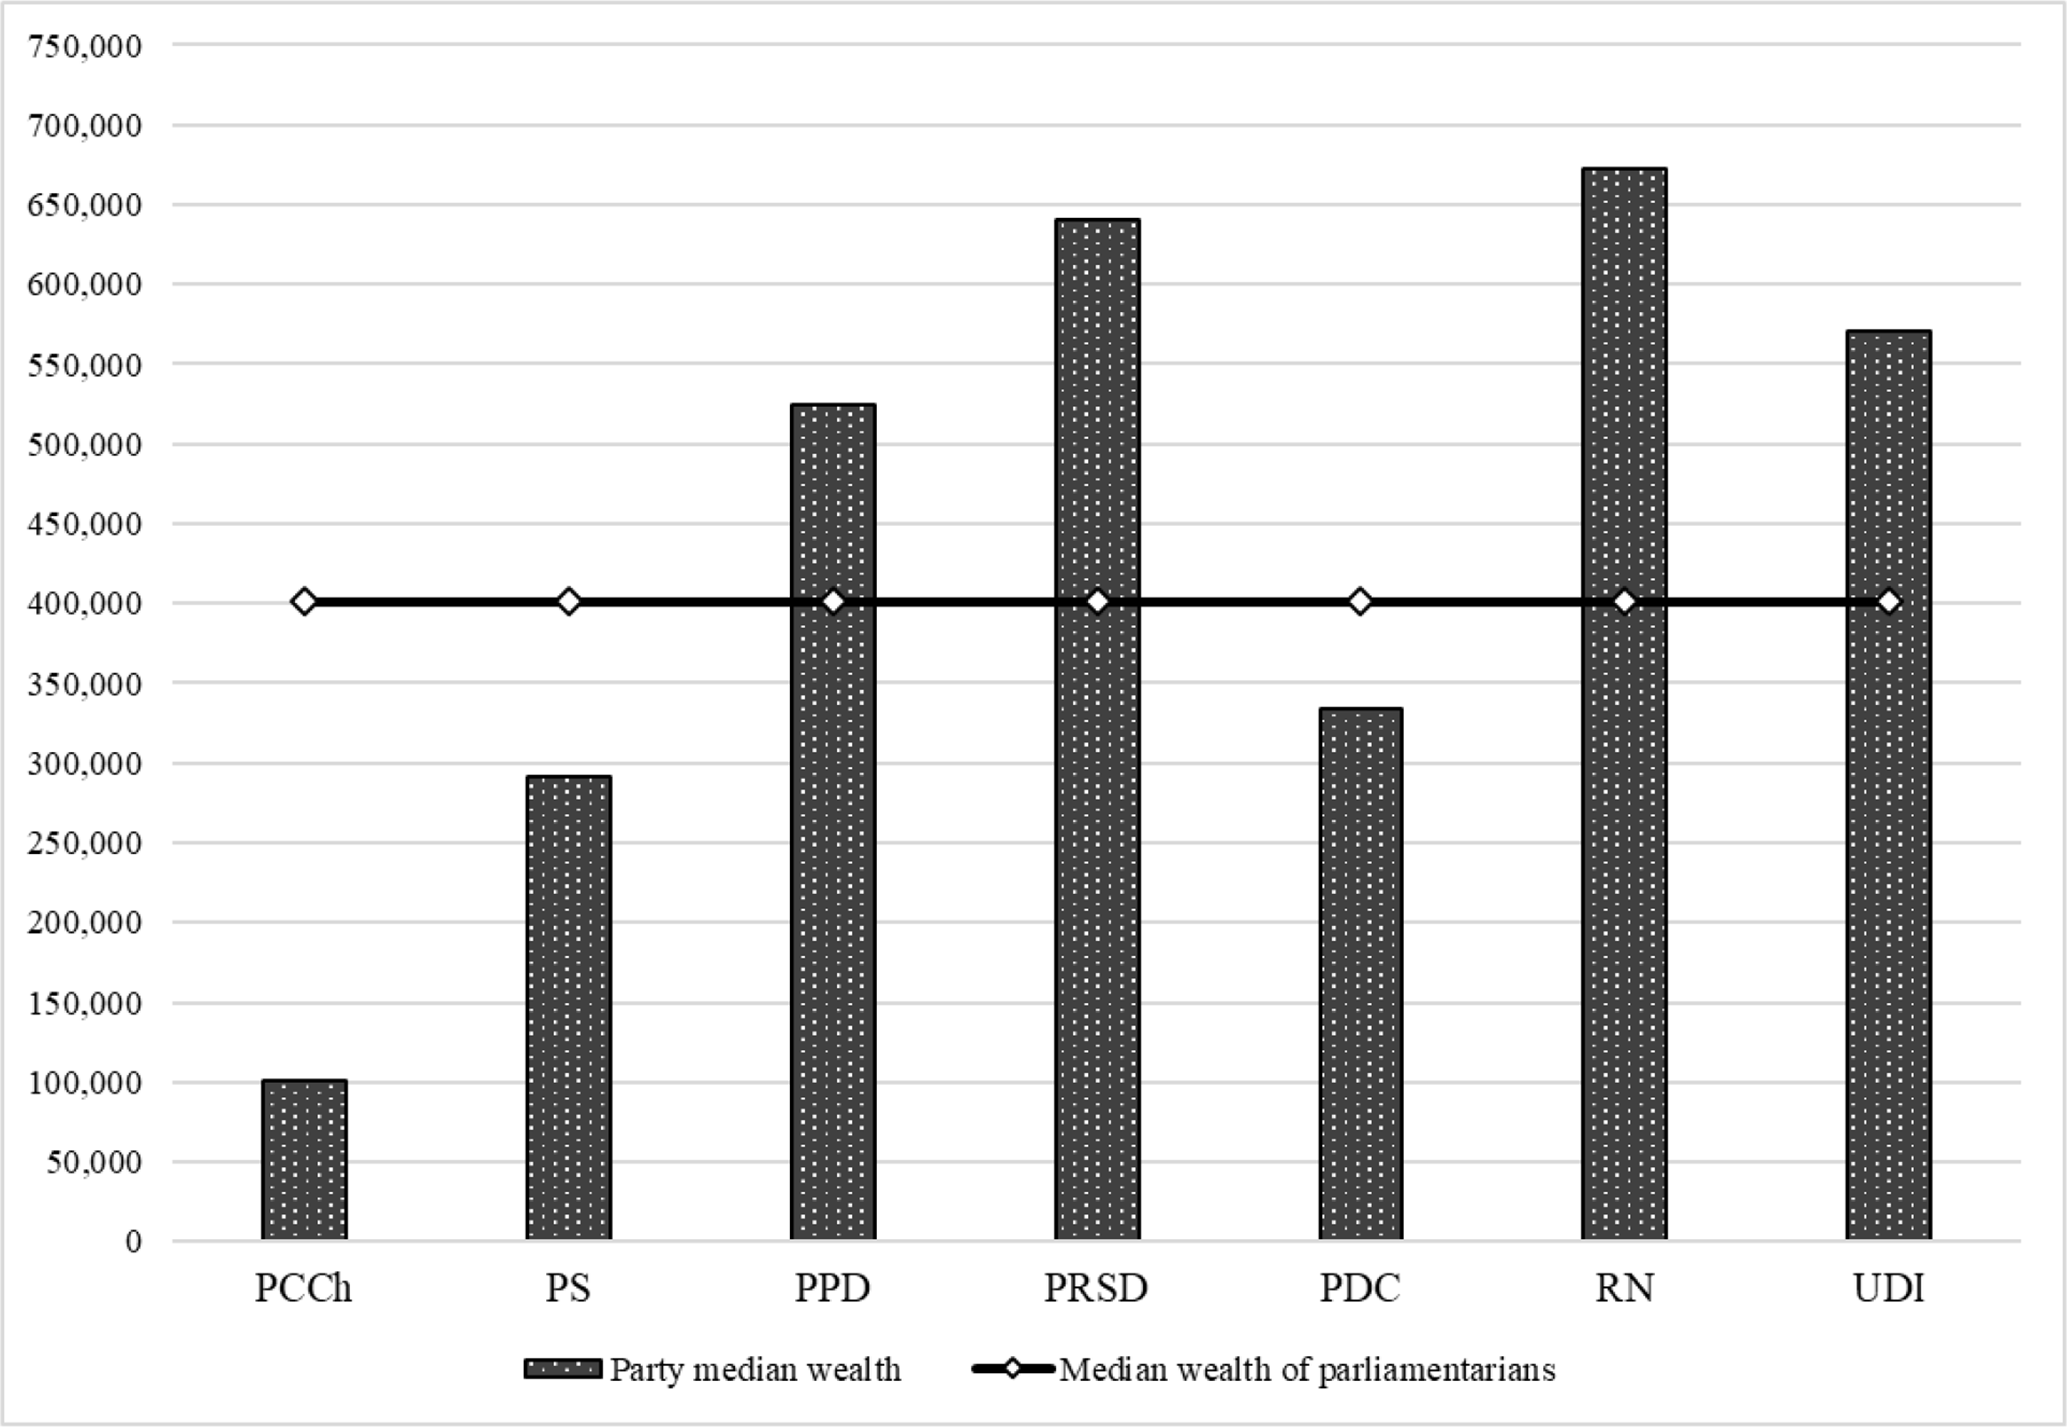
Politicians’ Median Wealth in Chile by Political Party on 1 February 2015 (USD of 2016). PCCh: Partido Comunista de Chile; PS: Partido Socialista; PPD: Partido por la Democracia; PRSD: Partido Radical Social Demócrata; PDC: Partido Demócrata Cristiano; RN: Renovación Nacional; UDI: Unión Democrática Independiente.
Peru
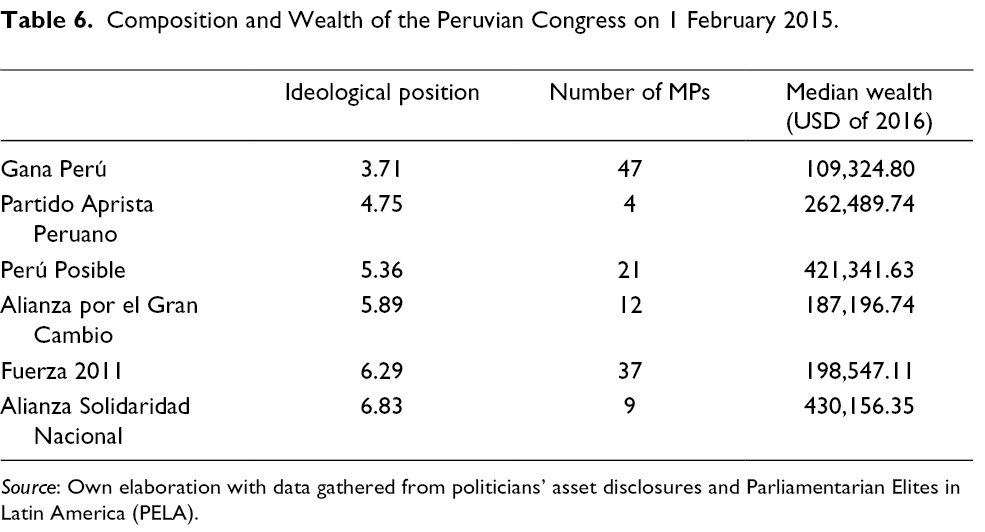
Politicians’ wealth in Peru for February 2015 shows significant variations across political parties (Table 6). The median wealth of Humala’s Gana Perú (Peru Wins; USD 109,325) is the lowest in Peru. It is also one of the lowest in the region behind the PCCh and the Bolivian MAS. Conversely, the median wealth of Luis Castañeda’s Alianza Solidaridad Nacional (National Solidarity Alliance; USD 430,156) is the highest in the country, without reaching the values disclosed by the richest politicians in Brazil and Chile.
Composition and Wealth of the Peruvian Congress on 1 February 2015.
Source: Own elaboration with data gathered from politicians’ asset disclosures and Parliamentarian Elites in Latin America (PELA).
Though Ollanta Humala won the 2011 elections by moving to the centre, his party Gana Perú (Peru Wins) is viewed as left-leaning (Tanaka, 2011). According to PELA, Alianza Solidaridad Nacional is at the other extreme of the political spectrum. The gap between them is significant since a parliamentarian from the Alianza Solidaridad Nacional owns four times the assets disclosed by a colleague from Gana Perú. Moreover, the median wealth of Perú Posible (Possible Peru), Alianza por el Gran Cambio (Alliance for the Great Change), and Fuerza 2011 (Strength 2011), which are all considered as centre-right or right-wing parties (Levitsky, 2011; Lupu, 2012), is always higher than that of Gana Perú.
In Peru, results are also non-linear (Figure 5). Indeed, politicians from the Fujimori’s Fuerza 2011 disclose less than their peers from Perú Posible, and their difference from the left-leaning Gana Perú (+USD 89,222) is not as significant as their difference from the ideologically close Alianza Solidaridad Nacional (−USD 231,609). Overall, we observe that Fujimoristas are among the “poorest” right-wing politicians in the region. Although we know that Fujimoristas regularly manage to win support among lower-class constituents (Roberts and Arce, 1998), the comparatively low median wealth of Fuerza 2011 raises questions about the socio-economic profile of the party’s parliamentarians.
Politicians’ Median Wealth in Peru by Political Party on 1 February 2015 (USD of 2016).
The Dominican Republic
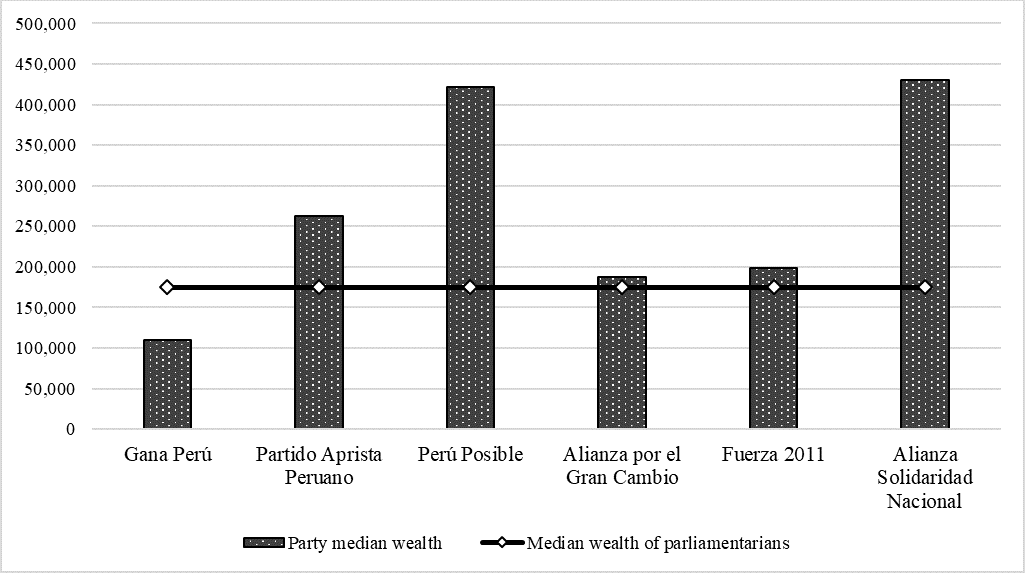
A left–right comparison of assets disclosed by politicians is analytically and statistically irrelevant in the Dominican Republic (Figure 6). Indeed, the legislative elections of 2010 enshrined the shift toward a two-party system with a weak ideological polarisation and a lack of programmatic competition (Sánchez and Belén, 2010). Since then, the Partido de la Liberación Dominicana (Party of the Dominican Liberation, PLD) and the Partido Revolucionario Dominicano (Dominican Revolutionary Party, PRD) have dominated the political landscape, and both exhibit similar ideological positions on the centre-right (Sánchez and Belén, 2010: 65–66).
Politicians’ Median Wealth in the Dominican Republic by Political Party on 1 February 2015 (USD of 2016). PRD: Partido Revolucionario Dominicano; PLD: Partidode la Liberación Dominicana; PRSC: Partido Reformista Social Cristiano.
Nonetheless, we observe that, with a median wealth of USD 497,723, politicians from the opposition PRD disclose more than those from the PLD, in power since 2004. They also disclose more than politicians from the right-wing Partido Reformista Social Cristiano (Social Christian Reformist Party, PRSC). But the gap is not that large, since members of the PRD own only about USD 55,000 more than their colleagues from the PLD and approximately USD 81,000 more than those from the PRSC (Table 7). The Dominican case, where there are no significant ideological differences between parties, therefore, serves as a counterfactual for the hypothesis of differences in wealth across the left–right divide. These results reinforce our hypothesis.
Composition and Wealth of the Dominican Congress on 1 February 2015.
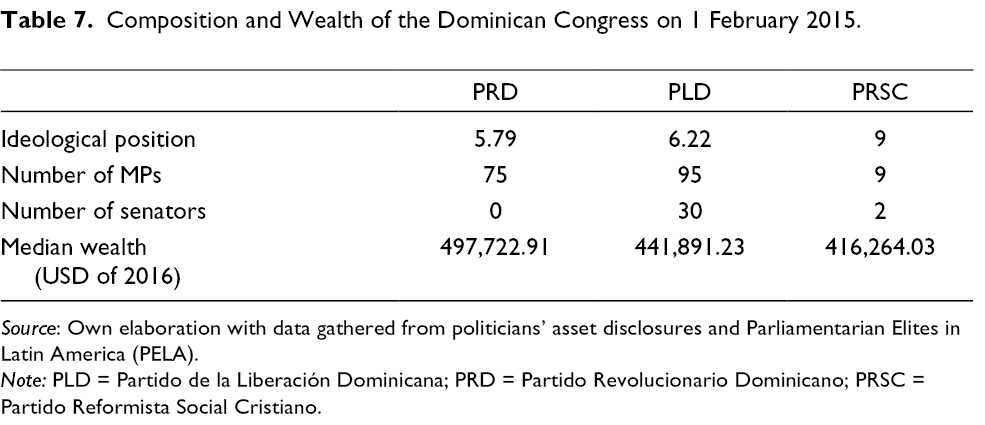
Source: Own elaboration with data gathered from politicians’ asset disclosures and Parliamentarian Elites in Latin America (PELA).
Note: PLD = Partido de la Liberación Dominicana; PRD = Partido Revolucionario Dominicano; PRSC = Partido Reformista Social Cristiano.
Conclusion
In this research, we examined the distribution of personal wealth among politicians in six Latin American countries to verify whether politicians of all stripes are very well-off people. We constantly found that the most right-leaning parties were wealthier than the most left-leaning ones. Sometimes, as in Brazil and Chile, the asset gap between left- and right-wing parties is quite significant. This contradicts the perception of parliamentary elites as a homogenous group of immensely rich people. However, the variation is not linear, as some centrist parties present, for instance, a higher median wealth than those from the right. The Dominican Republic, where a true leftist political force is totally lacking, serves as a counterfactual for our hypothesis insofar as we found no significant differences between the median wealth of the main parties. Even though we selected our cases based on data availability and not based on any particular variable, the absence of both a clear left–right division and wealth differences of Dominican politicians potentially points to the same direction that our research does, that is, on the median, ideological differences are associated with differences in capital accumulation.
Our analysis is only exploratory, and further research is needed to understand the idiosyncrasies of each national case. Analysing data on parliamentarians’ wealth and information regarding their sociological profile – such as profession, education, family capital, and political careers (da Fonseca Engler, 2018) for each political party – will provide a more in-depth analysis about politicians’ wealth in Latin America. This would complement the preliminary results presented here. Also, our analysis is synchronic as we chose to scrutinise the distribution of parliamentarians’ personal wealth in office on 1 February 2015. Hence, a diachronic approach would allow us to examine the left–right distribution of personal wealth in the long term. It would be extremely relevant for the purpose at hand considering the continuous political changes that some countries examined here (i.e. Argentina, Brazil, and Chile) have been through for the past ten years.
Supplemental Material
Supplementary Material 1 - Supplemental material for Are They All the Same? The Distribution of Personal Wealth Between the Left and the Right in Latin America
Supplemental material, Supplementary Material 1, for Are They All the Same? The Distribution of Personal Wealth Between the Left and the Right in Latin America by Nordin Lazreg, Alejandro Angel and Denis Saint-Martin in Journal of Politics in Latin America
Footnotes
Declaration of Conflicting Interests
The author(s) declared no potential conflicts of interest with respect to the research, authorship, and/or publication of this article.
Funding
The author(s) disclosed receipt of the following financial support for the research, authorship and/or publication of this article: This research was supported by the Social Sciences and Humanities Research Council of Canada (SSHRC)
Supplemental Material
Supplemental material for this article is available online.
Notes
Author Biographies
E-mail:
E-mail:
E-mail:
References
Supplementary Material
Please find the following supplemental material available below.
For Open Access articles published under a Creative Commons License, all supplemental material carries the same license as the article it is associated with.
For non-Open Access articles published, all supplemental material carries a non-exclusive license, and permission requests for re-use of supplemental material or any part of supplemental material shall be sent directly to the copyright owner as specified in the copyright notice associated with the article.