
Abstract
Background:
Increasingly, more evidence has shown that inflammation stress and the tumor microenvironment pose a negative effect on targeted therapy. The neutrophil-to-lymphocyte ratio is considered to be a surrogate biomarker of inflammation and can predict pazopanib treatment effect in non-adipocytic soft-tissue sarcoma (STS). The role of the pan-immune-inflammation value (PIV) in STS is still yet to be determined.
Objectives:
We sought whether the pre-treatment PIV could be applied to predict the response of pazopanib in STS.
Design:
We conducted a retrospective analysis of 75 patients who had been treated with pazopanib for recurrent or metastatic non-adipocytic STS.
Methods:
Our cohort was stratified into either a pre-treatment high PIV group with PIV ⩾310 (n = 45) or a low PIV group with PIV <310 (n = 30). We compared their clinical features and outcomes. Cox regression analysis was employed to determine the risk factors of disease progression and mortality. Kaplan–Meier survival curves were utilized to assess both the progression-free survival (PFS) and overall survival (OS).
Results:
The results revealed that a pre-treatment high PIV (⩾310) is a risk factor for progression under pazopanib (hazard ratio: 1.91; 95% confidence interval: 1.08–3.36; p = 0.025). The median PFS and OS of the pre-treatment high PIV group were found to be significantly lower than the low PIV group (0.33 vs 0.75 years; p = 0.023, 0.46 vs 1.63 years; p = 0.025).
Conclusion:
High pre-treatment PIV in STS patients may indicate an elevated risk of disease progression and mortality. Pre-treatment PIV reflects inflammation stress and acts as a practical biomarker for STS patients treated with pazopanib.
Background
Soft-tissue sarcomas (STSs) constitute heterogeneous groups of tumors involving more than 100 different histologic and molecular subtypes. 1 Treatment is tailored according to the histology subtypes, tumor location, disease extent, and molecular profiles. Multidisciplinary management, including surgery, chemotherapy, targeted therapy, and radiation, is required. 2 Among the targeted therapies, pazopanib has emerged as a viable option, demonstrating improved progression-free survival (PFS) in patients with metastatic non-adipocytic STSs following standard chemotherapy failure. 3 However, with a median PFS of 4.6 months for pazopanib, the need for surrogate markers becomes imperative in the era of precision medicine.
Pazopanib is an orally administered multi-kinase inhibitor, targeting the vascular endothelial growth factor receptors, platelet-derived growth factor receptors, and stem-cell factor receptor c-kit. 4 Inflammation stress and the tumor microenvironment (TME) play important roles in enhancing tumorigenesis and angiogenesis.5,6 In our hypothesis, elevated inflammation status may negatively impact the efficacy of anti-angiogenic therapy, including pazopanib.
Previous studies have shown that the neutrophil-to-lymphocyte ratio (NLR), which reflects one’s inflammation status, can act as a predictive marker of pazopanib treatment in STS.7,8 Other inflammation stress markers, such as the platelet-to-lymphocyte ratio (PLR) and lymphocyte-to-monocyte ratio have also been proposed.9,10 The pan-immune-inflammation value (PIV) has recently emerged as a composite biomarker reflecting inflammation stress. Its value is calculated by integrating neutrophil, platelet, monocyte, and lymphocyte count. The utility has been tested in several cohorts.11–13 However, no previous studies have examined the significance of PIV in STS, making it necessary to establish the cutoff value of PIV from the ground up. In this study, we aim to explore the role of pre-treatment PIV in an STS population undergoing targeted therapy with pazopanib.
Methods
Patients
The medical records of 87 consecutive STS patients diagnosed with STS between January 2010 and December 2021 at Taichung Veterans General Hospital, Taiwan, were retrospectively reviewed. Well-differentiated liposarcoma (LPS) histology subtypes were not included. Patients whose records were not comprehensive (n = 8) or had gone without pazopanib treatment (n = 4) were excluded. Consequently, a total of 75 patients were included in this study. To investigate the clinical characteristics and prognostic significance of pre-treatment PIV, these 75 patients were stratified into either a high PIV group with pre-treatment PIV ⩾310 (n = 45) or a low PIV group with pre-treatment PIV <310 (n = 30). The pre-treatment PIVs were measured on the day or a few days before pazopanib administration, to minimize the impact of acute infection or inflammation on the value. The PIVs at STS diagnosis were also measured. The PIV was calculated using the equation: (neutrophil count (103/mm3) × platelet count (103/mm3) × monocyte count (103/mm3))/lymphocyte count (103/mm3). 11 All the blood cells were measured from peripheral blood samples. A cutoff point of 310 was established based on a prior literature review. 13 Inflammation-related biomarker NLR was also computed. The cutoff value of NLR was set as 3 according to previous literature, which showed that NLR less than 3 was associated with better PFS. 7
Patient-specific details including age, gender, tumor histology, disease location, and disease stage were collected for each individual in the cohort. All patients were categorized as having a good performance status and were deemed suitable for initial chemotherapy. The Charlson comorbidity index (CCI) score was utilized to evaluate the overall health status of the study participants. The characteristics of tumor samples, including histology, tumor size (n = 67), mitosis index (n = 47), and Fédération Nationale des Centres de Lutte Contre le Cancer grading (n = 45) were assessed through examination by an experienced pathologist. There were missing values because of small or fragmented specimens in some patients. Some patients had no frontline surgery information and could not be traced in the retrospective chart review. The histology was classified according to the World Health Organization (WHO) classification of tumors, 5th Edition.
The Institutional Review Board of Taichung Veterans General Hospital approved this study. Informed consent from patients was not required for this study according to the regulations set by the Institutional Review Board, as it was a retrospective study design (Registered number CE23375B).
Treatment, clinical response, and survival analysis
Following diagnosis, treatment plans were initiated under the guidance of physicians. Disease status was deemed metastatic if multiple metastases were present without the possibility of complete surgical resection. Chemotherapy regimens, either adjuvant or palliative, were selected based on physician evaluation during the study period. Initial chemotherapy encompassed adriamycin-based or gemcitabine-based regimens, included for subsequent analysis. Pazopanib was utilized in second-line treatment or later based on the judgment of experienced physicians. The dosage was adjusted in response to side effects, with a maximum target of 800 mg. The washout period between pazopanib and prior chemotherapy was measured. In addition, subsequent therapies following pazopanib treatment and the total number of therapy lines were documented.
The clinical response was evaluated based on the Response Evaluation Criteria in Solid Tumors, version 1.1. The PFS of pazopanib treatment was defined as the duration from the day of pazopanib usage to disease progression. Overall survival (OS) was defined as the duration from the day of pazopanib usage until either mortality or the censor day, December 31, 2022.
Statistical analysis
Continuous and categorical variables between the high PIV and low PIV groups were compared using the Mann–Whitney U test and the Chi-squared test, or the Fisher’s exact test as appropriate. Numerical data are presented as median and interquartile range (IQR) to attenuate the effect of extreme values. Pearson correlation was used to measure the correlation between pre-treatment PIV and PIV at diagnosis. Univariate and multivariate Cox regression models were used to determine the prognostic relevance quantified as hazard ratios (HRs), with 95% confidence intervals (CIs). Kaplan–Meier survival curves were utilized to estimate both the PFS and OS. Statistical analyses were performed using the Statistical Package for the Social Sciences (IBM SPSS version 22.0; International Business Machines Corp., Armonk, NY, USA). The statistical significance was set at p < 0.05.
Results
Histology subtypes of the cohort
In our STS cohort, well-differentiated LPS cases were excluded. The most common histology subtype was leiomyosarcoma (LMS) (n = 36, 48%) with 12 (33.3%) of these originating in the uterus. Other histology subtypes included undifferentiated sarcoma (n = 13, 17.3%), fibrosarcoma (n = 4, 5.3%), angiosarcoma (n = 4, 5.3%), malignant peripheral nerve sheet tumor (MPNST) (n = 3, 4.0%), malignant phyllodes tumor of breast (n = 3, 4.0%), synovial sarcoma (n = 2, 2.7%), myxofibrosarcoma (n = 2, 2.7%), dedifferentiated LPS (n = 2, 2.7%), desmoplastic small round cell tumor (n = 1, 1.3%), BCOR rearranged sarcoma (n = 1, 1.3%), adenosarcoma with sarcomatous overgrowth (n = 1, 1.3%), alveolar soft part sarcoma (n = 1, 1.3%), malignant inflammatory myofibroblastic tumor (n = 1, 1.3%), and Ewing-like undifferentiated sarcoma (n = 1, 1.3%).
Undifferentiated sarcoma was further sub-classified into three categories, which were pleomorphic sarcoma (n = 5, 6.7%), spindle cell sarcoma (n = 5, 6.7%), and undifferentiated uterine sarcoma (n = 3, 4.0%). The distribution of these subtypes was illustrated in a pie chart (Figure 1). For simplification, subtypes represented by only one sample were grouped under “Others” in Figure 1.

Histology of soft-tissue sarcoma patients who had received pazopanib between January 2010 and December 2021 in Taichung Veterans General Hospital.
Comparison of clinical features between the pre-treatment low PIV and high PIV groups
The clinical features of age, gender, CCI score, tumor size, location, histology subtype, disease stage, mitosis index, and grade were not significantly different between the two groups. There were also no treatment differences between the groups, including frontline surgery, frontline chemotherapy, total lines of therapy, or timing of pazopanib. The PIV at diagnosis and washout period before pazopanib showed no differences between groups (Table 1). The median value of total lines of therapy in our cohort was 3 (IQR 2–4). The following treatments after pazopanib were highly heterogeneous according to each patient’s condition and physician’s choice. These included gemcitabine, docetaxel, cisplatin, liposomal doxorubicin, eribulin, ifosfamide, dacarbazine, bevacizumab, methotrexate, cyclophosphamide, trabectedin, ufur, nivolumab, pembrolizumab, palliative radiotherapy, or salvage surgery.
Clinical characteristics of patients.

Data were compared using the Mann–Whitney U test, Chi-square test, and Fisher’s exact test.
CCI, Charlson comorbidity index; FNCLCC, Fédération Nationale des Centres de Lutte Contre le Cancer; H&N, head and neck; HPF, high-power field; IQR, interquartile range; LMS, leiomyosarcoma; PIV, pan-immune-inflammation value.
The Pearson correlation coefficient between pre-treatment PIV and PIV at diagnosis was −0.02 (r = −0.02, p = 0.856), indicating no significant linear correlation (Figure 2).

Pearson correlation of pre-treatment PIV and PIV at diagnosis showed a correlation coefficient r = −0.02 (p = 0.856).
Pre-treatment high PIV is a risk factor associated with disease progression
We employed Cox regression analysis to investigate the impact of pre-treatment PIV on progression in STS patients who had received pazopanib therapy. Univariate analysis revealed that a high pre-treatment PIV was the only parameter significantly associated with a higher risk of progression (HR: 1.91; 95% CI: 1.08–3.36; p = 0.025). No other factors demonstrated a significant effect on the risk of progression with pazopanib treatment (Table 2).
Risk factors of progression.
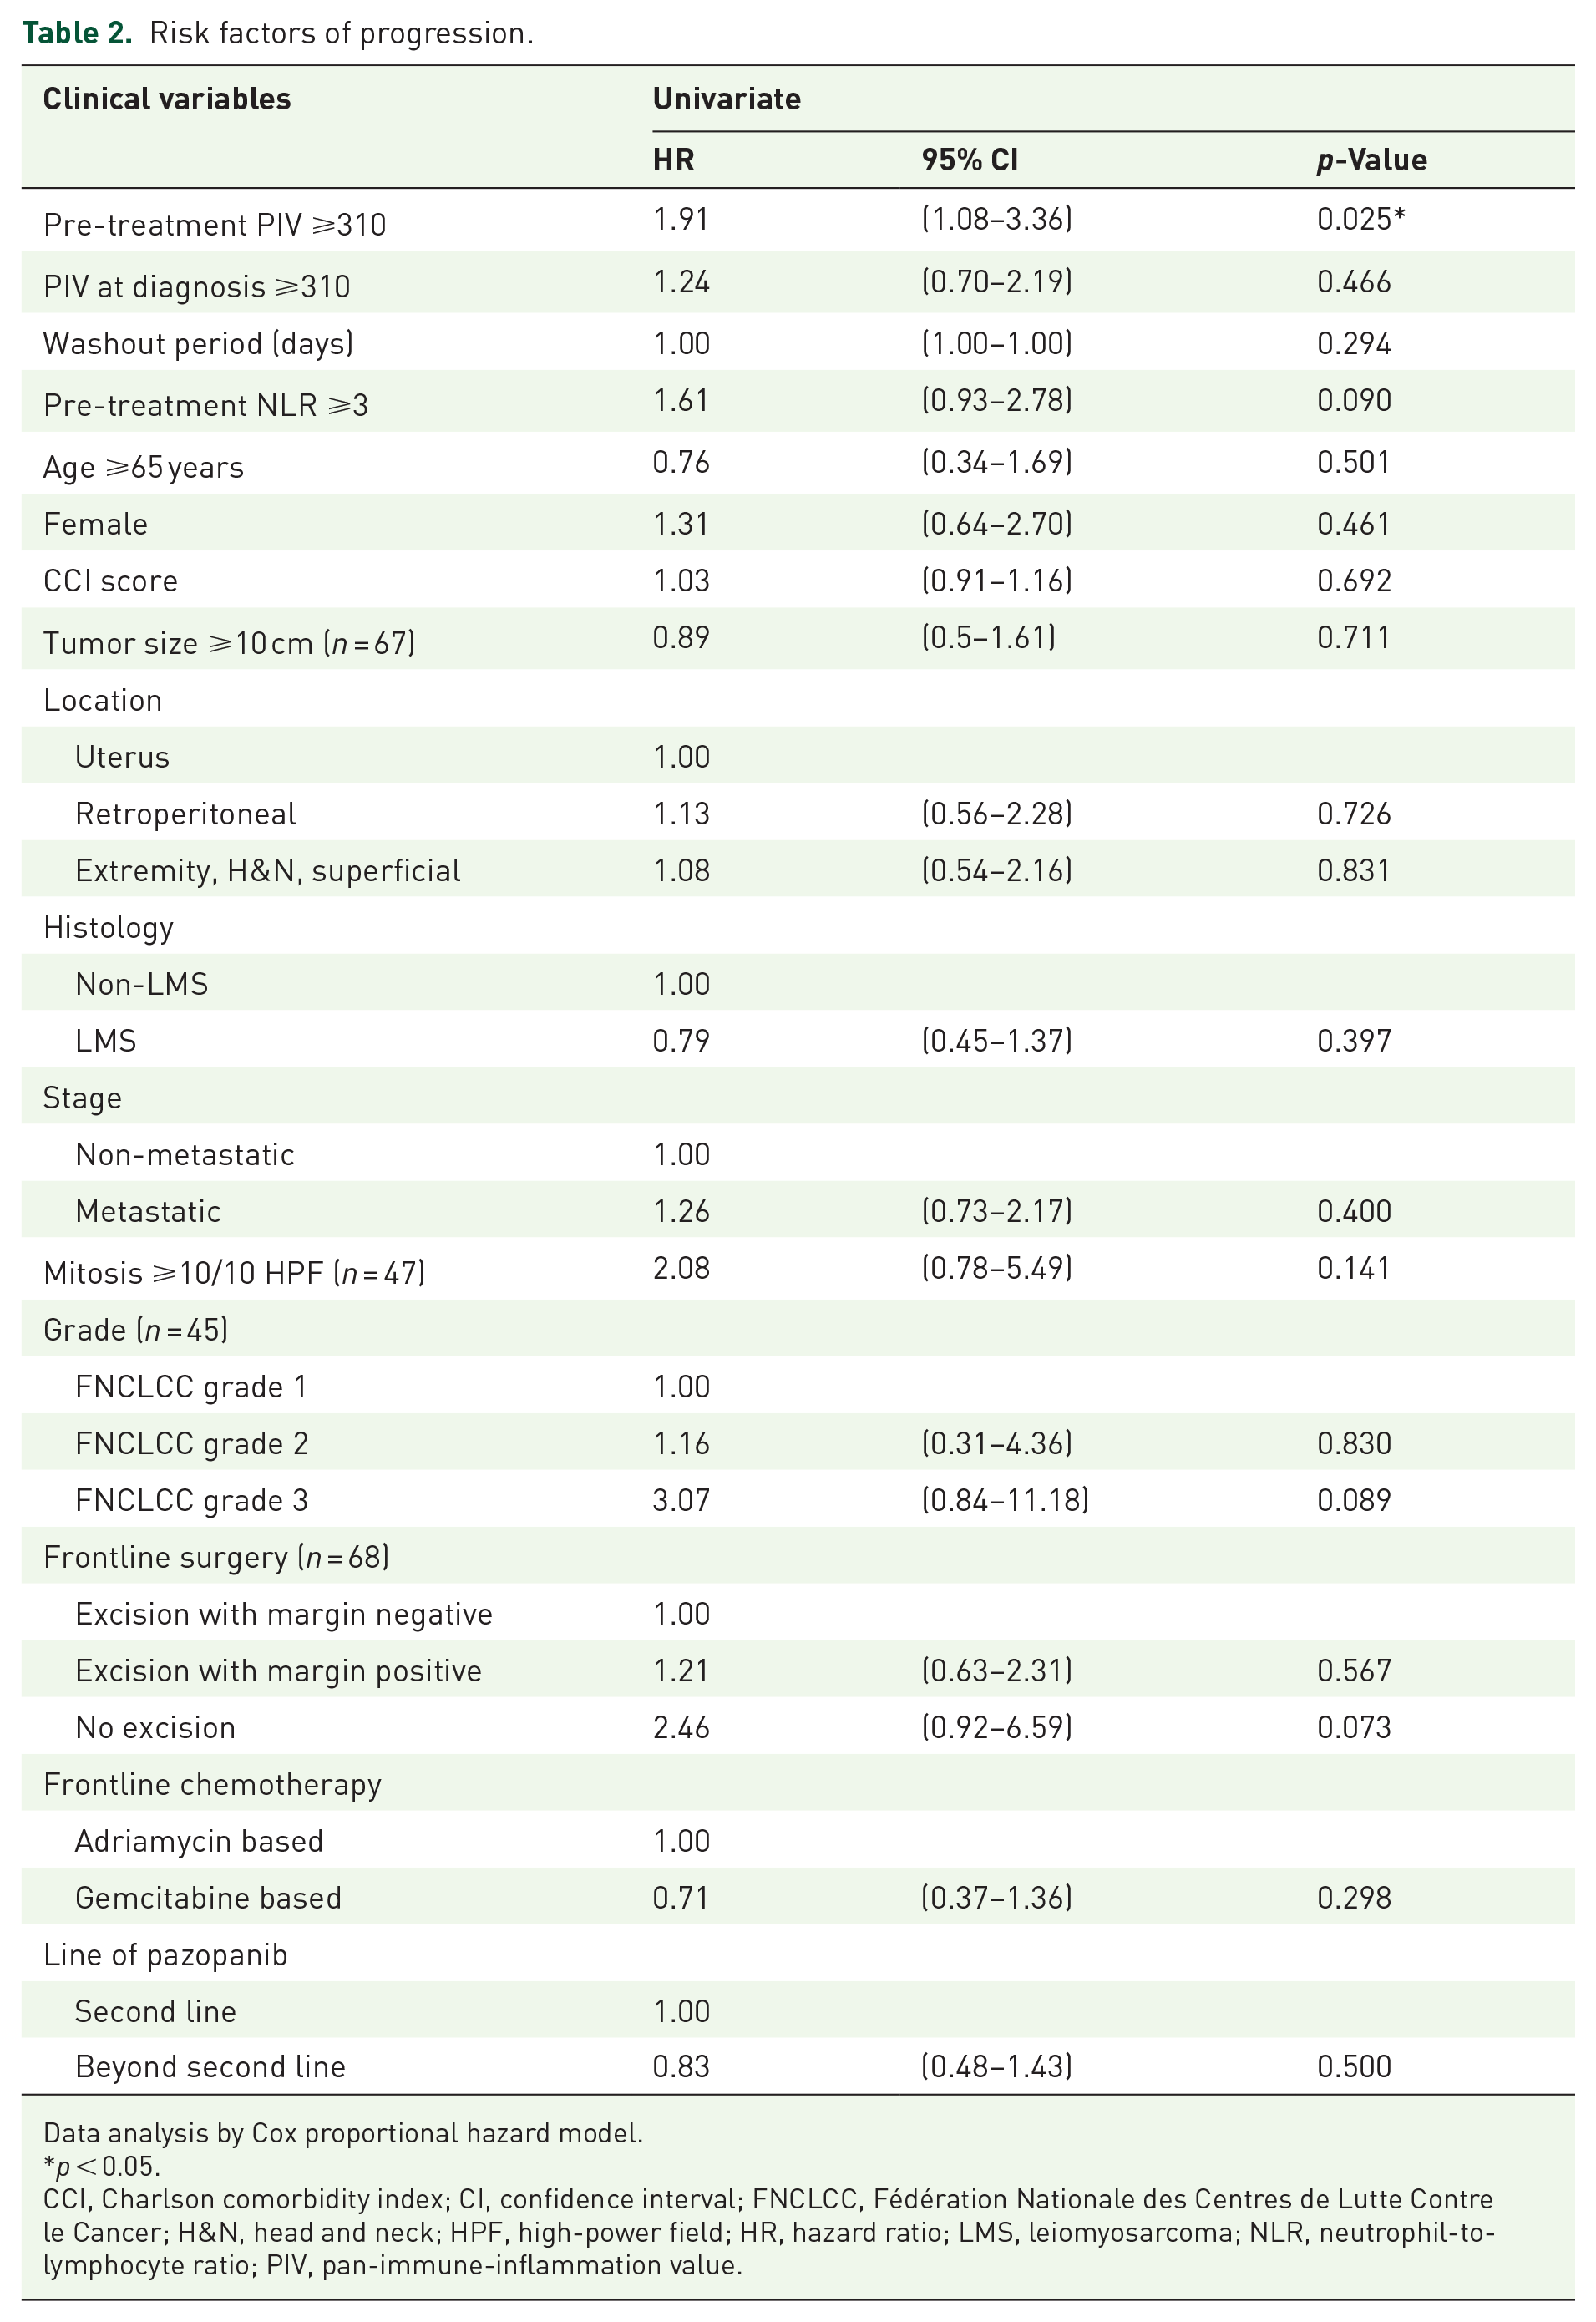
Data analysis by Cox proportional hazard model.
p < 0.05.
CCI, Charlson comorbidity index; CI, confidence interval; FNCLCC, Fédération Nationale des Centres de Lutte Contre le Cancer; H&N, head and neck; HPF, high-power field; HR, hazard ratio; LMS, leiomyosarcoma; NLR, neutrophil-to-lymphocyte ratio; PIV, pan-immune-inflammation value.
Risk factors associated with mortality
Univariate analysis revealed that a high pre-treatment PIV (HR: 1.80; 95% CI: 1.07–3.04; p = 0.027), high pre-treatment NLR (HR: 2.01; 95% CI: 1.20–3.34; p = 0.007), and high mitosis index (HR: 5.50; 95% CI: 1.31–23.10; p = 0.020) were significantly associated with a higher risk of mortality. Multivariate analysis showed high mitosis index (HR: 6.43; 95% CI: 1.50–27.48; p = 0.012) was the independent risk factor for mortality (Table 3). Although the mitosis index showed a significant effect in multivariate analysis, the analytical number was limited (n = 47) because the variable cannot be measured in some specimens.
Risk factors of mortality.

Data analysis by Cox proportional hazard model.
p < 0.05. **p < 0.01.
CCI, Charlson comorbidity index; CI, confidence interval; FNCLCC, Fédération Nationale des Centres de Lutte Contre le Cancer; H&N, head and neck; HPF, high power field; HR, hazard ratio; LMS, leiomyosarcoma; NLR, neutrophil-to-lymphocyte ratio; PIV, pan-immune-inflammation value.
Outcome comparison between the high PIV and low PIV groups
Survival analysis was performed on patients who had received pazopanib. In our cohort, STS patients who had received pazopanib achieved a median PFS of 0.41 years. The median PFS of patients with a high pre-treatment PIV and low PIV were 0.33 and 0.75 years (p = 0.023) (Figure 3). The median OS of all the STS patients after receiving pazopanib in our cohort was 0.67 years. The median OS of patients with a high pre-treatment PIV and low PIV were 0.46 and 1.63 years, respectively (p = 0.025) (Figure 4).

The median progression-free survival rates among patients with low pre-treatment PIV and high PIV were 0.75 and 0.33 years (p = 0.023).

The median overall survival rates among patients with low pre-treatment PIV and high PIV were 1.63 and 0.46 years (p = 0.025).
Discussion
In our cohort, most of the patients’ histological records indicated LMS (n = 36, 48.0%) (Figure 1), with the predominant ratio of LMS being far higher than the normal incidence rate in Taiwan, which is approximately 7.6%. 14 The high proportion of uterine LMS amongst the LMS subjects (n = 12, 33.3%) suggested that these patients first undergo debulking surgery followed by a gemcitabine and docetaxel combination treatment. 15 Two samples were not initially identified as dedifferentiated LPS due to their poorly differentiated morphology. However, upon thorough review of the slides during this study, they were reclassified as dedifferentiated LPS. Common histology subtypes in Taiwan were found in our cohort, including angiosarcoma, fibrosarcoma, MPNST, and synovial sarcoma. 14 Spindle cell sarcoma, pleomorphic sarcoma, and undifferentiated uterine sarcoma were categorized into undifferentiated sarcoma to better fit the WHO classification of tumors, 5th Edition. However, due to the retrospective nature of our study and the exclusion of LPS, our cohort may not entirely represent the incidence of STS subtypes.
The precise cutoff value of PIV varied across different cohorts, reflecting the absence of a current consensus on a standardized cutoff. A meta-analysis suggested a wide-ranging PIV cutoff, spanning from 164.6 to 600.0, influenced significantly by multiple factors, including disease type, population variations, sample size, and assay methods. 16 Determining the optimal threshold can be achieved through diverse approaches such as the use of median values, the maximally selected rank test, receiver operating characteristic curve analysis, or past empirical knowledge.11–13,16 No studies have proposed the significance of PIV in STS before. Notably, within cancer patient populations, the value typically ranged from 300 to 400.11–13 In our specific cohort, a pre-treatment PIV of 310 was adopted, derived from a reference in a prior study that targets the population of breast cancer. 13 Utilizing the maximally selected rank test, we calculated a cut point of 613 for PIV, revealing significant differences in median PFS and OS between the high and low PIV groups. However, the cutoff value of 613 was far from the previous description of PIV in malignancy. Further research with more sample numbers was needed to validate the optimal cutoff value of PIV. One notable limitation of our STS cohort was the restricted sample size, impeding the generation of a broadly representative cutoff value.
It was found that the high PIV group constituted 60.0% of our cohort. There was no significant difference in clinical characteristics between the high pre-treatment PIV and low PIV groups (Table 1). The PIV at diagnosis showed no significant difference between groups. To investigate the correlation between pre-treatment PIV and PIV at diagnosis, we used the Pearson correlation test to check if there was a linear correlation. The results showed no linear correlation between pre-treatment PIV and PIV at diagnosis, supporting the hypothesis that the current PIV reflects the inflammation status at a specific time point (Figure 2). The median washout periods before pazopanib were 35 (IQR 26–63.5) days and 64 (IQR 15.75–330.5) days in the high pre-treatment PIV and low PIV group. The washout period was deemed reasonable, as blood cell counts typically recover within 14–21 days following chemotherapy. To evaluate whether the timing of pazopanib administration influenced the pre-treatment PIV, the cohort was divided into the second line and beyond the second line group. The median pre-treatment PIV and sample numbers also showed no significant difference (Supplemental Table 1). Our finding suggested that pre-treatment PIV appeared to be an independent variable, reflecting inflammatory pressure. 17 This equitable distribution between groups minimized selection bias during subsequent survival analysis.
Previous investigations exploring PIV as a biomarker in both immunotherapy and targeted therapy have been conducted.12,18 Our findings indicated that the high pre-treatment PIV group exhibited a higher risk of progression and lower PFS under pazopanib therapy (Table 2 and Figure 3). These observations suggest that PIV, as a reflection of inflammation, could potentially affect pazopanib efficacy. Notably, the median PFS in our overall cohort (0.41 years, 4.93 months) aligned well with the 4.6 months observed in the PALETTE trial. 3 The overall median OS in our cohort was 0.67 years (8.04 months), which was less than the median OS in the PALETTE trial experimental arm (12.5 months). Despite this difference, the real-world data from our cohort remained reasonable and reliable.
In terms of survival outcomes, our study revealed that patients with high pre-treatment PIV experienced a lower OS than those with low PIV. The observed difference in PFS due to pazopanib use translated into an OS discrepancy between these groups (Figure 4). Other risk factors regarding mortality included pre-treatment NLR ⩾3 and an increased mitosis index. In multivariate analysis, a high mitosis index showed significant results and can therefore be considered as an independent risk factor (Table 3). However, limited samples were used in multivariate analysis (n = 47) and might affect the result. The METASARC cohort suggested that LMS histology, locoregional control, and frontline combination chemotherapy were all associated with better survival rates. 19 In our cohort, a trend toward a worse outcome in non-LMS histology and high grades was observed. However, due to our small sample size (n = 75), these results were not statistically significant.
A previous study involving 141 recurrent or metastatic non-round cell STS patients demonstrated that a pre-treatment NLR ⩾3 correlated with poorer outcomes in pazopanib-treated STS patients. 7 Our study corroborated that a higher NLR was linked to an increased risk of progression. However, the NLR cutoff value of 3 did not exhibit a significant difference in PFS. This lack of significance might be attributed to the exclusion of the well-differentiated LPS population and the smaller sample size used in our cohort. Our results also suggested that pre-treatment PIV, incorporating monocytes and platelets into the calculation, might serve as a more prominent biomarker.
Uncontrolled inflammation leads to carcinogenesis by modulating the TME, including increasing secretions of pro-inflammatory cytokines and chemotaxis of the immune-tolerant tumor-associated macrophage (TAM).5,20 There has been clinical evidence showing that high inflammation pressure was associated with patient frailty, advanced disease stage, worse treatment outcome, and poor prognosis.21–24 Previous studies have proposed that NLR reflects the balance of the immune system and systemic inflammation. 25 Neutrophil was considered to play a role in promoting tumor progression, while lymphocytes act as a means toward elimination of tumor cells. 26 Platelets may promote tumor growth and metastasis, while an elevated PLR was found to be related to a higher risk of lymph node and distant metastasis in breast cancer patients.10,27 Monocyte counts could reflect numbers of TAM, which suppress the immune response in the TME. 28 PIV cooperates with all pro-inflammatory cells that are taken into account with a strong biological rationale, which may result in better risk stratification. 17 The evaluation of TME has been improving with the assistance of both sequencing methods and spatial profiling.29,30 Further research was needed to determine the role of PIV in the tumor sample and TME. However, cutting-edge techniques have yet to be widely applied in clinical practice. Our study utilized the peripheral blood PIV, rather than tumor samples, as a potential predictive tool for the efficacy of pazopanib in STS. This approach offers a faster and more practical method for predicting treatment outcomes.
Conclusion
In summary, our study suggests that high pre-treatment PIV levels in STS patients may indicate an elevated risk of disease progression and mortality. In addition, high pre-treatment PIV is associated with a poorer PFS while undergoing pazopanib treatment, ultimately leading to worse OS. Pre-treatment PIV serves as an indicator of inflammatory stress and may function as a valuable biomarker for guiding treatment decisions in STS patients receiving pazopanib therapy.
Supplemental Material
sj-docx-1-tam-10.1177_17588359241292255 – Supplemental material for Pre-treatment pan-immune-inflammation value as a prognostic marker of pazopanib in soft tissue sarcoma
Supplemental material, sj-docx-1-tam-10.1177_17588359241292255 for Pre-treatment pan-immune-inflammation value as a prognostic marker of pazopanib in soft tissue sarcoma by Cheng-Han Wu, Cheng-Lun Lai, Yong-Chen Hsu, Chiann-Yi Hsu, Yu-Chao Wang and Hsin-Chen Lin in Therapeutic Advances in Medical Oncology
Footnotes
References
Supplementary Material
Please find the following supplemental material available below.
For Open Access articles published under a Creative Commons License, all supplemental material carries the same license as the article it is associated with.
For non-Open Access articles published, all supplemental material carries a non-exclusive license, and permission requests for re-use of supplemental material or any part of supplemental material shall be sent directly to the copyright owner as specified in the copyright notice associated with the article.