
Abstract
Background:
Solitary fibrous tumours (SFT) are soft tissue sarcomas molecularly defined by the presence of the NAB2::STAT6 intrachromosomal fusion gene. Recently, a prospective phase II trial evaluating the role of the antiangiogenic tyrosine kinase inhibitor pazopanib in SFT has been conducted (NCT02066285).
Methods:
Here, we analysed the mRNA and protein expression levels of the tumour suppressor and angiogenesis regulator p53 (TP53) in pre-treatment tumour samples from 22 patients with low aggressive (or typical) SFT and 28 patients with high aggressive (26 malignant and 2 dedifferentiated) SFT enrolled in the aforementioned pazopanib phase II trial. These results were correlated with radiological progression-free survival (PFS) and objective response. Univariate and multivariate Cox regression analyses were also performed, including known clinic-pathological prognostic factors.
Results:
Diffuse immunohistochemistry (IHC) expression of p53 was only found in patients with aggressive SFT and was associated with significantly shorter PFS [hazard ratio (HR): 4.39, 95% confidence interval (CI): 1.19–16.14). TP53 mRNA levels were significantly higher in the low aggressive SFT group. Only in the high aggressive SFT group, relatively higher levels of TP53 were significantly associated with shorter PFS (HR: 4.16, 95% CI: 1.46–11.89) as well as to a lower rate of disease control following treatment with pazopanib. In the multivariate analysis, the only independent prognostic factor in the whole cohort was mitotic count.
Conclusion:
Diffuse p53 IHC expression and higher TP53 mRNA levels are associated with worse prognosis in the subset of aggressive SFT patients treated with pazopanib.
Introduction
Solitary fibrous tumours (SFT) are translocation-associated soft tissue sarcomas with a pronounced hemangiopericytoma-like vascular pattern, molecularly defined by the presence of the NAB2::STAT6 intrachromosomal gene fusion.1,2 SFT are very heterogeneous: they can virtually arise in any anatomical location; more frequently, they are diagnosed in the thorax or the abdomen, less often in all the other locations, including intracranially.1,2 Based on mitotic count, necrosis and nuclear pleomorphism, pathologists used to distinguish ‘typical’ SFT and ‘malignant’ SFT. This potentially misleading nomenclature has been more recently replaced, respectively, with ‘low aggressive’ and ‘high aggressive’ STF, as both subtypes – despite different clinical behaviour – can metastasize over time. A third variant, ‘dedifferentiated SFT’, is represented by those SFT abruptly transitioning to clinically aggressive high-grade sarcomas.1,2
Systemic treatments for advanced SFT include chemotherapy and antiangiogenic drugs.3–6 In particular, the tyrosine kinase inhibitor pazopanib has been prospectively evaluated in a phase II clinical trial (NCT02066285), in progressive typical SFT 7 and malignant/dedifferentiated SFT. 8 Molecular characteristics able to stratify patients who might derive a larger benefit from this treatment are however largely unknown.
The tumour suppressor p53 is one of the most important regulator of cancer angiogenesis 9 and its alterations have been suggested as potential predictive biomarkers for the use of antiangiogenic drugs in different malignancies, including sarcomas. 10 In SFT, mutations or deletions of the p53 gene (TP53), often coupled with loss of the wild-type allele, have been retrospectively reported in 20–40% of the aggressive cases.11–13 Most of the available studies address p53 mutational and immunohistochemical status in SFT, while little is known on the expression levels of TP53 mRNA and their clinical significance in the context of treatment with pazopanib.
Taking advantage of tumour samples prospectively collected within the above-mentioned phase II clinical trial on pazopanib in advanced SFT, we investigated TP53 mRNA and p53 protein expression levels in SFT and their correlation to radiological progression-free survival (PFS) and response to pazopanib.
Material and methods
Immunohistochemistry
Four-micrometre-thick tissue sections from paraffin blocks were baked for 30 min at 65°C. Antigen retrieval was performed with a PT Link instrument (Agilent, Santa Clara, CA, USA), using ethylenediaminetetraacetic acid buffer. Sections were immersed in H2O2 aqueous solution (Blocking peroxidase reagent, Leica Biosystems, Deer Park, IL, USA) for 10 min to exhaust endogenous peroxidase activity and then covered with 1% blocking reagent (Roche, Mannheim, Germany) in phosphate-buffered saline, to block nonspecific binding sites. Sections were then incubated with primary antibody anti-p53 (DO-7; Ventana, Roche) 1 h at ambient temperature, in a humid chamber. Later, horseradish peroxidase polymer-conjugated secondary antibodies (Leica Biosystems) were applied for 1 h, at ambient temperature in a humid chamber and 3,3-diaminobenzidine were applied for 5 min to develop immunoreactivity. Slides were then counterstained with haematoxylin and mounted in dibutyl phthalate in xylene. The expression of p53 was analysed as negative (0–4% of cells), 1+ (5–24% of cells) and 2+ (⩾25% of cells). Two pathologists expert in soft tissue sarcomas (JM and RR) were responsible for reviewing p53 protein expression, blinded to clinical data.
Gene expression analysis
As part of the trial, pathology was reviewed centrally and gene expression biomarker analyses, including TP53, were conducted on formalin-fixed paraffin-embedded tumour tissue collected before treatment, as previously reported, using the Immuno-Oncology assay (HTG Molecular Diagnostics, Tucson, AZ, USA). Data normalization was also performed as described.7,8 TP53 expression is presented in log2 of read counts.
Statistical analyses
Distribution of the most important clinic-pathologic prognostic factors, Eastern Cooperative Oncology Group (ECOG) performance status and number of mitosis (per 10 high-power fields) were, respectively, reported as percentages and median (interquartile range) and compared using chi-square and Mann–Whitney tests. Contingency tables derived from immunohistochemistry (IHC) results were analysed using Fisher’s exact test.
TP53 RNA expression data were transformed to log2 values. All subsequent analyses used this parameterization. TP53 expression levels in the cohort of ‘malignant’ and ‘dedifferentiated’ high aggressive SFT (SFTHIGH) were compared to those of the ‘typical’ low aggressive SFT (SFTLOW) using the Mann–Whitney test. To evaluate the impact of TP53 expression on survival in each group, we dichotomized TP53 expression data within each group determining group-specific cut-off values using Evaluate Cutpoints, a tool that allows optimal cut-off determination. 14 The resulting TP53 high (TP53HIGH) and low (TP53LOW) expression groups were used in subsequent analyses.
PFS was defined as the time from the date of the first cycle of therapy to disease progression or death, whichever happened first. The Kaplan–Meier method was used to estimate survival curves and the log-rank test was used to compare survival times between groups. Hazard ratio (HR) and 95% confidence intervals (CIs) were reported. A multivariable Cox proportional hazards model was then estimated to evaluate the prognostic effect of p53 IHC and TP53 mRNA expression after adjusting for the two known prognostic features.
Radiological outcomes assessed by Choi criteria 15 were analysed based on the dichotomized TP53 expression groups in each histological subtype: the disease control (DC) group included patients with complete response, partial response and stable disease. The remaining patients were categorized as progressive disease (PD). Contingency tables were analysed using the chi-square test.
Consent for translational research and ethical approval of this study were part of the original trial protocol.7,8
All reported p values were two-sided, and CIs were at the 95% level. A p value <0.05 was considered statistically significant. Statistical analyses were performed using IBM SPSS Statistics version 26.0 (IBM Corp, Armonk, NY, USA) and GraphPad Prism version 8.2 (GraphPad Software, La Jolla CA, USA).
Results
Baseline distribution of clinic-pathologic prognostic factors and PFS results
The SFTLOW cohort comprised 22 patients, whereas the SFTHIGH cohort comprised 28 patients (26 ‘malignant’ and 2 ‘dedifferentiated’ SFT). Detailed characteristics of the original populations have already been reported in the original trial publications.7,8 A distribution of the two most important clinic-pathologic prognostic factors (ECOG and number of mitosis) in the two populations is reported (Table 1). As expected, the number of mitosis was significantly higher in the SFTHIGH group.
Baseline distribution of known prognostic factors.

ECOG, Eastern Cooperative Oncology Group; PS, performance status; SFT, solitary fibrous tumours.
The median PFS in the whole population of SFT patients treated with pazopanib was 7.4 months (95% CI: 5.6–10.1). In the SFTHIGH and SFTLOW groups, the median PFS values were, respectively, 5.6 months (95% CI: 3.4–7.8) and 9.4 months (95% CI: 5.0–13.8). The difference in PFS was statistically significant (HR: 1.92, 95% CI: 1.04–3.50, p = 0.04, Figure 1).
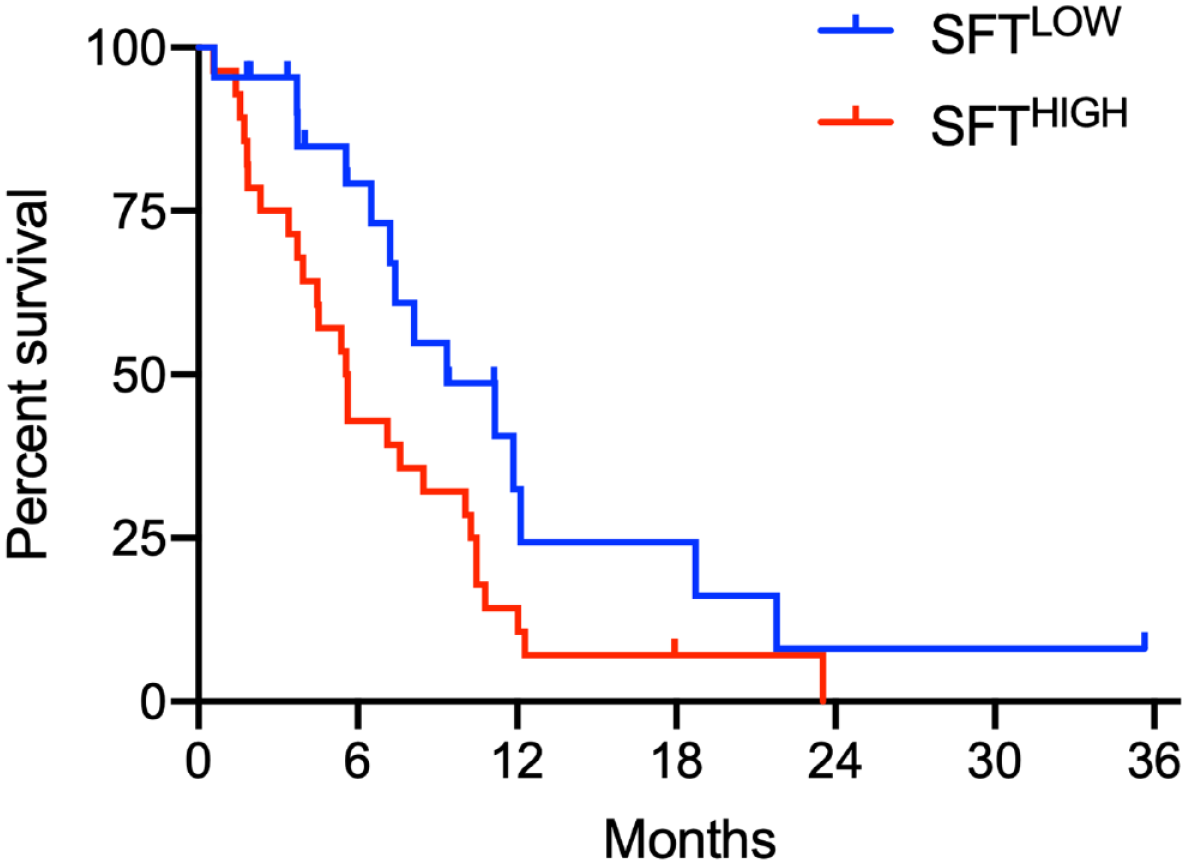
PFS in the different SFT groups.
P53 IHC analysis in SFT subgroups
IHC for p53 was available for 16/22 patients with SFTLOW and for 27/28 patients with SFTHIGH (Figure 2(a)). The IHC expression of p53 varied between histological subtypes: in SFTLOW, 11/16 (68.7%) of the samples did not show expression of p53 and the remaining 5/16 (31.3%) showed 1+ p53 expression; in SFTHIGH, 19/27 (70.4%) of the samples did not show expression of p53, 2/27 (7.4%) showed 1+ expression and 6/27 (22.2%) showed 2+ expression (Figure 2(b)).

IHC p53 analysis. Representative IHC of a negative, 1+ and 2+ sample (a); distribution of p53 IHC expression levels among groups (b); PFS in the different SFT groups based on p53 IHC expression (c).
Positive expression of p53 (either 1+ or 2+) did not significantly vary between the two groups. IHC expression 2+ was exclusively found in the SFTHIGH group (p = 0.07).
In the SFTHIGH group, IHC expression of p53 2+ was associated with significantly shorter PFS compared to negative or 1+ expression (HR: 4.39, 95% CI: 1.19–16.14, p = 0.03), while SFTHIGH patients with negative or 1+ p53 expression had the same survival of SFTLOW patients (Figure 2(c)).
TP53 expression analysis in SFT subgroups
TP53 expression data were available for all 50 SFT patients. In the SFTLOW group, mean TP53 expression was 13.56 (95% CI: 13.37–13.74), whereas the mean TP53 expression in the SFTHIGH subtype was 10.04 (95% CI: 9.64–10.43). The difference was statistically significant (p < 0.0001, Figure 3(a)). No correlation was seen between TP53 mRNA levels and p53 IHC in the whole cohort, nor in the individual subgroups.

Normalized expression levels of TP53 in the different SFT subgroups, with group-specific cut-offs (a); PFS based on TP53 expression levels in SFTLOW (b); PFS based on TP53 expression levels in SFTHIGH (c).
In the SFTLOW group, the optimal cut-off point estimated from the continuous PFS data was a TP53 expression level of 13.84. Therefore, 5 (22.7%) and 17 (77.3%) patients were, respectively, categorized TP53HIGH and TP53LOW. The median PFS of the TP53HIGH group was 12.1 months (95% CI: 7.8–16.4 months), whereas the median PFS of the TP53LOW group was 8.1 months (95% CI: 6.7–9.6 months). This difference was not statistically significant (Figure 3(b)).
In the SFTHIGH group, the optimal cut-off point in this group was a TP53 expression level of 10.99. Accordingly, 4 (15.4%) and 22 (84.6%) patients were, respectively, categorized as TP53HIGH and TP53LOW. Median PFS time in the TP53HIGH group was 2.1 months (95% CI: 0.9–2.7 months), compared to a median PFS in the TP53LOW group of 6.3 months (95% CI: 2.3–9.0 months). The difference in PFS was statistically significant (HR: 4.16, 95% CI: 1.46–11.89, p = 0.004, Figure 3(c)).
Prognostic value of p53 IHC and TP53 expression
We then estimated univariate and multivariate Cox regression models to evaluate the prognostic effect of p53 IHC and TP53 expression (Table 2). In univariate analysis, the variables significantly associated with PFS were mitosis, histologic subtype and p53 IHC expression. In the multivariable analysis, the only variable that maintained its statistically significant association with PFS was mitosis.
Cox regression analysis for PFS.

CI, confidence interval; ECOG, Eastern Cooperative Oncology Group; HR, hazard ratio; IHC, immunohistochemistry; PFS, progression-free survival; PS, performance status; SFT, solitary fibrous tumours.
Effects of p53 protein and TP53 mRNA expression on radiological response to pazopanib
No correlation was seen between p53 IHC levels and best radiological response to pazopanib in the whole cohort or considering the individual SFT subtypes.
Considering TP53 expression levels, in the SFTHIGH subtype patients with PD were 2/4 (50.0%) in the TP53HIGH group and 2/22 (9.1%) in the TP53LOW group (p = 0.04). In the SFTLOW subtype, patients with PD were 0/5 in the TP53HIGH group and 1/17 (5.9%) in the TP53LOW group (p = 0.1).
Discussion
Recently, TP53 mutations or deletions have been reported in 20–40% of SFTHIGH.11–13 Consistently, here we show that IHC expression of p53 in more than 25% of the cells, a potential surrogate of TP53 activating mutations, was found in ~20% of SFTHIGH and never observed in SFTLOW. Diffuse expression of p53 was associated in univariate analysis with shorter PFS. These results argue against a positive predictive role of TP53 mutations in predicting response to pazopanib in SFT, as previously suggested in sarcomas. 10 In the multivariate analysis, diffuse p53 expression lost its independent negative prognostic role, which remains to be assessed in larger cohorts.
Importantly, our analysis shows for the first time that in SFT there is no significant association between p53 mRNA and protein levels, suggesting extensive post-transcriptional and/or post-translational regulation of p53. In fact, a significant difference in TP53 gene expression levels between SFTLOW and SFTHIGH was observed, with the latter showing significantly lower levels compared to the former. Our finding suggests that SFTLOW and SFTHIGH might therefore be more divergent in gene expression and biology than previously hypothesized. In particular, significant downregulation of TP53 transcription might represent a specific pro-tumoral adaptation of SFTHIGH. Importantly, only within the SFTHIGH group, relatively higher levels of TP53 were significantly associated with shorter PFS as well as to a lower rate of DC following treatment with pazopanib. Although this phenomenon might be difficult to reconcile with the generally lower levels of TP53 levels in SFTHIGH, it is known that the regulation of TP53 mRNA transcription is highly complex and the mRNA itself is involved in several signalling pathways. 16 Altogether, our results support a model whereby the prognostic and possibly predictive roles of p53 mRNA and protein levels are different in SFTLOW and SFTHIGH, with relatively high mRNA levels and diffuse protein expression potentially associated with worse outcomes in the latter group.
In the original reports by Martin-Broto et al.7,8 bioinformatics translational analyses were conducted using median PFS as grouping criteria, whereas our groups were defined by the optimal TP53 expression cut-off. This is unavoidably associated with some degree of loss of information and power; however, it is a tool that provides researchers with a useful categorization method.
In SFTHIGH, ISG15 and BCL2 were identified as genes associated with survival in the univariate analysis. 8 Notably, p53 interacts with both BCL2 17 and ISG15, 18 suggesting the existence of a biological network associated with prognosis in SFT patients treated with pazopanib.
The absence of a control group that did not receive pazopanib limits our capability of deducing whether the differences in PFS observed in our M-SFT group are effectively due to a differential antiangiogenic effect of pazopanib depending on TP53 expression levels, or whether these levels are in fact primarily prognostic. Future randomized trials might answer this pressing question. Notably, our analysis benefits from being uniquely derived from prospectively collected samples within a collaborative multicentric international clinical trial and from the relatively large number of samples analysed, considering the rarity of SFT.
In conclusion, here we have shown that diffuse p53 IHC expression and higher TP53 mRNA levels are associated with worse prognosis in the subset of aggressive SFT patients treated with pazopanib.