
Abstract
Background:
Drug-resistant epilepsy (DRE) patients exhibit aberrant large-scale brain networks.
Objective:
The purpose of investigation is to explore the differences in resting-state electroencephalogram (EEG) microstates between patients with DRE and well-controlled (W-C) epilepsy.
Design:
Retrospective study.
Methods:
Clinical data of epilepsy patients treated at the Epilepsy Center of Fujian Medical University Union Hospital from January 2020 to May 2023 were collected for a minimum follow-up period of 2 years. Participants meeting inclusion and exclusion criteria were categorized into two groups based on follow-up records: W-C group and DRE group. To ensure that the recorded EEG data were not influenced by medication, all EEG recordings were collected before patients commenced any antiepileptic drug treatment. Resting-state EEG datasets of all participants underwent microstate analysis. This study comprehensively compared the average duration, frequency per second, coverage, and transition probabilities (TPs) of each microstate between the two groups.
Results:
A total of 289 individuals who met the criteria were included, categorized into the W-C group (n = 112) and the DRE group (n = 177). EEG microstate analysis revealed substantial variances between the two groups. The analysis highlights differences in three of four microstate classifications. Microstate transition analysis demonstrated altered probabilities in DRE patients. Increased probabilities were observed in TPAB, TPBA, TPBC, TPCB, TPBD, and TPDB. Decreased probabilities included TPCA, TPDA, TPAC, TPAD, TPCD, and TPDC.
Conclusion:
This study highlights distinctive EEG microstate parameters and TPs in DRE patients compared to those with W-C epilepsy. The results may potentially advance the clinical application of EEG microstates.
Introduction
Epilepsy, characterized by recurrent spontaneous seizures, stands as a prevalent neurological disorder. 1 Approximately 70% of epileptic patients attain seizure freedom through antiseizure medications (ASM), while 30% progress to drug-resistant epilepsy (DRE), 2 characterized as the lack of sustained freedom from seizures despite the appropriate selection and utilization of two well-tolerated ASM regimens, either as individual treatments or when combined and after a sufficient number of trials. 3 However, the precise mechanisms underlying DRE remain substantially elusive.
In recent years, an increasing body of evidence has pointed toward the potential underpinning of DRE by disruptions in brain networks. 4 Neurophysiological functional brain network impairments have been detectable in patients even before the progression to DRE. 5 Hence, comprehending the physiological mechanisms at the intrinsic level of brain electrophysiology holds paramount significance for individuals with epilepsy. Continuously monitoring the neurophysiological health of the brain in individuals with epilepsy, potentially provides valuable diagnostic insights and strategies for managing the condition. Electroencephalography (EEG) provides an inexpensive and straightforward means of measuring neural activity, characterized by higher clinical feasibility and superior temporal resolution. 6
Various analysis methods are available to extract information from unstructured EEG signals. Microstate analysis is one such method that offers high temporal resolution and can be employed to explore the dynamic characteristics of network neuroscience. 7 EEG microstates are characterized as consistent scalp potential topographical patterns that persist for a duration of time (typically 80–100 ms) before undergoing swift transitions to alternative microstates. 8 Due to the similarity in time scale between microstates and the pace of cognitive shifts, microstates have been regarded as “cognitive atoms” by Lehmann and Koenig. 9 Most studies suggest that four classifications of microstates tagged as A, B, C, and D can account for a substantial portion of global topographical variance.10,11 According to fMRI-EEG studies, distinct microstates are linked to particular resting-state functional networks. To be precise, microstate class A is correlated with auditory processing, class B with visual networks, class C with the salience network (SN), and class D with attention. 12 Previous research indicates that temporal characteristics such as duration (average duration of microstate classes in milliseconds), occurrence rate (average frequency of observing microstate classes per second), and coverage (proportion of time occupied by microstate categories) can serve as indicators of brain network functionality, and there is a possibility that these parameters could be modified due to factors like age, stress, and diseases.8,10,13 In 2018, Christoph M. Michel and colleagues reviewed the use of EEG microstates as a tool for studying the temporal dynamics of whole-brain neuronal networks. They highlighted that EEG microstates can assess the functionality of large-scale brain networks, whose disruptions are associated with various neuropsychiatric disorders. 8 Changes in microstate parameters may correspond to disruptions in the functional connectivity of resting-state networks (RSNs), which are similarly described in disease conditions. Therefore, resting-state EEG microstates may complement fMRI in RSN studies. 14
Changes in EEG microstate patterns could reflect disruptions in brain networks and have been reported in various neuropsychiatric disorders such as schizophrenia, autism, Lewy body dementia, Alzheimer’s disease, bipolar disorder, and idiopathic epilepsy.15–17 These temporal features can serve as biomarkers for neuropsychiatric diseases, but they have been scarcely analyzed in the context of developing DRE in epilepsy patients. Previous studies have identified altered characteristics of EEG microstates in epilepsy patients. These findings have been interpreted as reflecting underlying brain network functional impairments associated with epilepsy, suggesting that EEG microstates might serve as endophenotypes of epilepsy.17,18 In terms of clinical translation, microstates have been found to be indicative of the efficacy of levetiracetam treatment for epilepsy. 19 Furthermore, microstate-based machine learning has been tested and shown to effectively distinguish patients with temporal lobe epilepsy (TLE) with or without comorbid depression. 20
In this study, our objective is to identify potential EEG microstate characteristics in patients with DRE and uncover potential differences in resting-state EEG microstate features between DRE and well-controlled (W-C) epilepsy patients. This endeavor holds the potential to yield neurophysiological markers for the identification of DRE. To validate our hypothesis, we performed a resting-state EEG microstate analysis on two distinct cohorts of epilepsy patients and conducted a comparison of microstate characteristics within the EEG recordings of patients with DRE and those with W-C epilepsy. All EEG recordings were taken before patients started antiepileptic drugs to avoid medication effects.
Materials and methods
Participants
We conducted a retrospective investigation involving 759 epilepsy patients who received treatment at the Neurology Department’s Epilepsy Center, Fujian Medical University Union Hospital, between January 2020 and May 2023. The criteria for inclusion were as follows: (1) Patients who met the criteria established by the ILAE Commission for Epileptic Syndromes, Epilepsy, and/or Seizure Workgroups 3 ; (2) patients who underwent video EEG (VEEG) recordings; (3) patients with EEG recordings taken prior to the administration of any ASM; (4) patients with complete medical history and neurological examination records; (5) patients who underwent regular follow-up for at least 2 years, with a minimum of two visits annually. Exclusion criteria were as follows: (1) follow-up duration of less than 2 years; (2) patients lacking pre-ASM administration scalp EEG data; (3) pregnant or lactating women; (4) patients who underwent epilepsy-related surgery, and received vagus nerve stimulation, or followed a ketogenic diet during pharmacoresistant epilepsy treatment. Ultimately, a total of 289 individuals who satisfied both the inclusion and exclusion criteria were enrolled in the study.
Participants were divided into two cohorts based on their conclusive outpatient or telephone follow-up records. The initial group comprised individuals in W-C group (n = 112 patients), whereas the second group encompassed patients in DRE group (n = 177 patients). Participants who attained satisfactory seizure management in accordance with their epilepsy condition through suitable ASM therapy were placed in the W-C group (patients remained free from any type of seizures for at least 2 years following ASM treatment). 3 Participants who experienced inadequate seizure control despite the appropriate selection and utilization of two well-tolerated ASM regimens, either as individual treatments or when combined and after a sufficient number of trials, were classified into the DRE group.
Clinical features
We evaluated anxiety and/or depression through the administration of the Self-rating Anxiety Scale (SAS) and Self-rating Depression Scale (SDS). Cognitive impairment was assessed using the Montreal Cognitive Assessment and Mini-Mental State Examination (MMSE). Thorough clinical features were documented after conducting extensive medical history collection, physical examinations, prolonged scalp EEG monitoring, and 3.0T MRI scans. A total of 14 clinical attributes were recorded, which included: (1) gender, (2) age, (3) BMI, (4) years of education, (5) disease duration, (6) age of onset, (7) seizure type, (8) etiology, (9) history of status epilepticus, (10) history of generalized tonic–clonic seizures, (11) history of febrile seizures, (12) VEEG findings, (13) MRI findings (abnormalities referred to seizure-related abnormalities), (14) history of absence seizures (AE). Further details are provided in Table 1.
The characteristics of investigated candidates (n = 289).
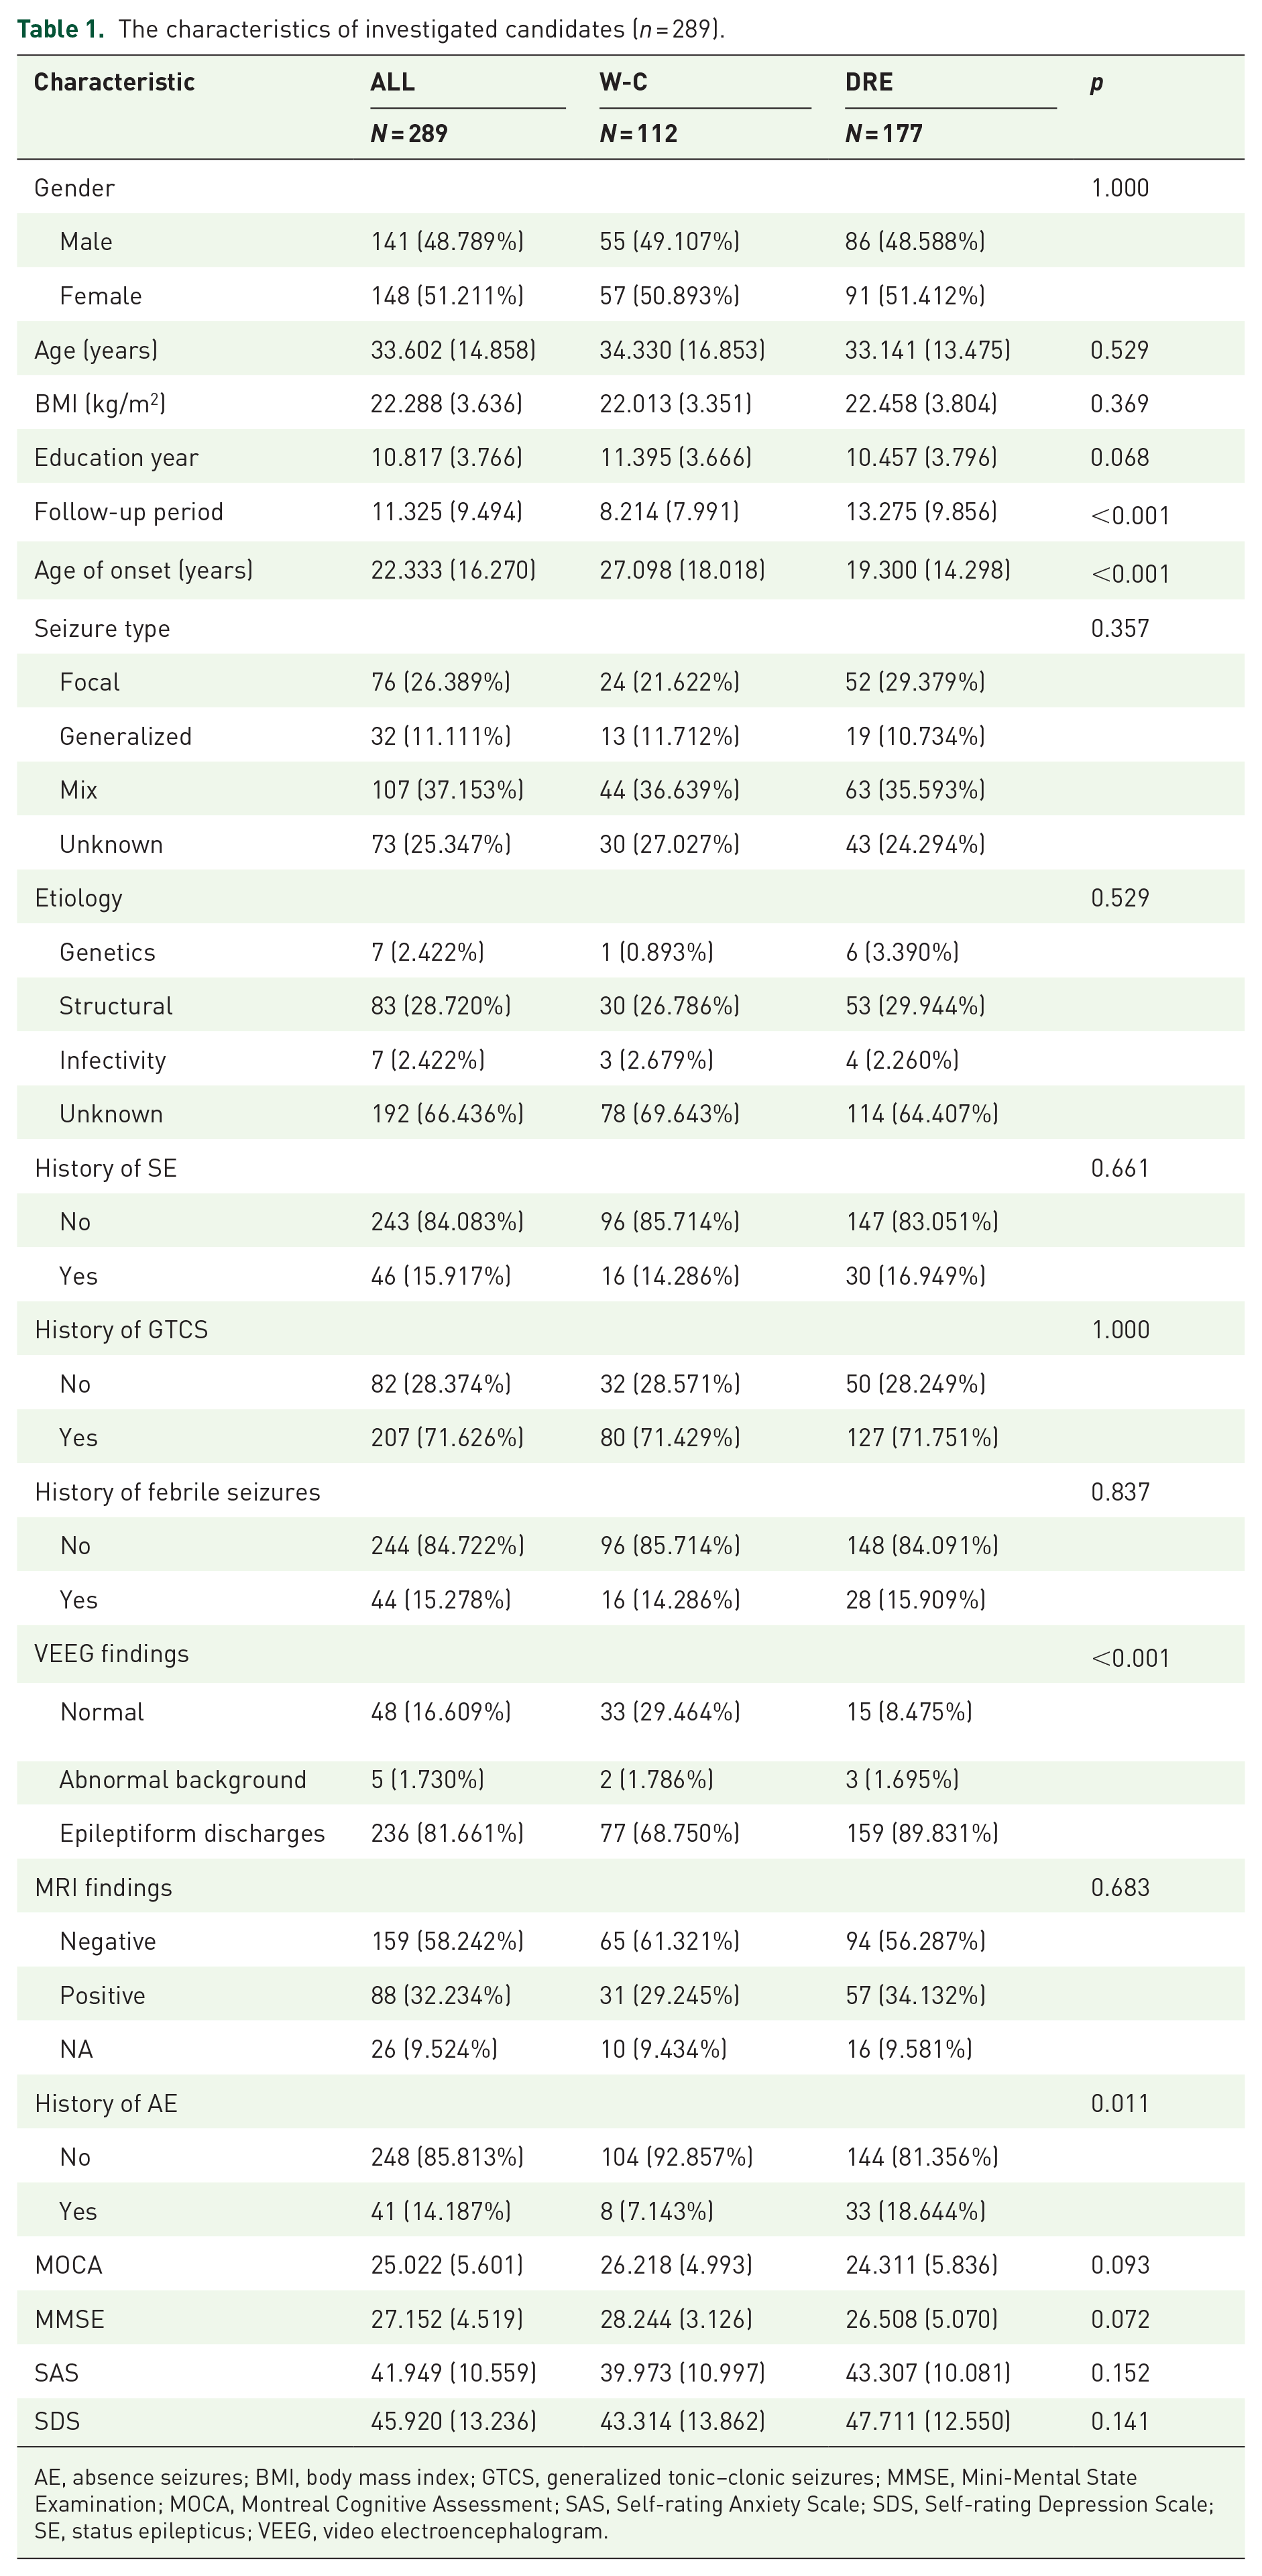
AE, absence seizures; BMI, body mass index; GTCS, generalized tonic–clonic seizures; MMSE, Mini-Mental State Examination; MOCA, Montreal Cognitive Assessment; SAS, Self-rating Anxiety Scale; SDS, Self-rating Depression Scale; SE, status epilepticus; VEEG, video electroencephalogram.
EEG acquisition and preprocessing
We used the EEG-1200C electroencephalograph (Nihon Kohden, Tokyo, Japan) for recording scalp video EEGs. Electrodes were placed according to the international 10–20 system, with a total of 20 scalp electrodes and 2 reference electrodes utilized. Specifically, electrodes Fp1, Fp2, F7, F8, F3, F4, C3, C4, T3, T4, T5, T6, P3, P4, O1, O2, Fz, Cz, Pz, Oz, A1, and A2 were bilaterally positioned on the ears as reference electrodes. The sampling rate was set at 500 Hz, with a low-pass filter at 70 Hz and a high-pass filter at 0.1 Hz. Subjects were in a relaxed seated position within a calm room and instructed to keep their eyes open. The EEG data for each participant were continuously recorded for a duration of 20 min. EEG tracings were examined and annotated by two experienced electroencephalographers, and any discrepancies were resolved through consultations with epilepsy experts. All EEG recordings were obtained from epilepsy patients before the administration of any antiepileptic drugs. This precaution was taken to ensure that the neural activity recorded was not influenced by medication. The entire raw EEG data was exported in the European Data Format. EEG data preprocessing was carried out using EEGLAB 13.0.0b (Swartz Center for Computational Neuroscience, University of California, San Diego, La Jolla, California, USA), an open-source toolbox implemented in MATLAB 2013b. Initially, EEG signals were re-referenced to a global mean reference. The sampling rate was then downsampled to 256 Hz. Subsequently, the raw data from the 20 channels underwent bandpass filtering ranging from 1 to 40 Hz, and a notch filter was applied at 48–52 Hz. The continuous EEG recordings were divided into 2-s segments and segments with prominent muscle artifacts or poor EEG signal quality were visually identified and removed. Independent component analysis was utilized to remove artifacts like those caused by eye movements. Remaining segments containing residual artifacts were further visually examined and discarded. Each participant’s EEG data comprised more than 90 segments.
Microstate analysis
The EEG data underwent bandpass filtering within the range of 2–20 Hz, were re-referenced to the mean measurement, and the orientation of topographic charts was disregarded. Subsequently, the global field power (GFP) was harnessed to quantify the synchronicity of activity across electrodes at each temporal point. The identification of stable topographical maps was achieved through the detection of GFP peaks. When the GFP reached its minimal peak, indicating a shift in the underlying microstate, the present topographical map transitioned to the subsequent microstate. The topographical maps corresponding to GFP peaks were designated as discrete microstates, and the dynamic modifications in EEG signals denoted the transitions between these states.
Initially, an individual clustering analysis was conducted utilizing mappings based on single templates, followed by a subsequent collective-level analysis. To maintain consistency with previous studies, the microstate maps were categorized into four distinct groups (A–D). The spatial correspondence and topographical maps were computed to ascertain the optimal backward projection of each GFP peak map’s topography onto the microstate map. Four parameters were computed for microstates A–D, encompassing duration, frequency, coverage, and the probabilities of transitioning between microstates.
Statistical analysis
Statistical analysis and between-group comparisons were conducted using SPSS. Clinical data and microstate parameters from the W-C and DRE groups were compared. The Shapiro–Wilk test was employed to assess the normality of distributions. Mean ± standard deviation was employed to summarize quantitative data and assess their conformity with a normal distribution. Independent sample t-tests were conducted to compare these data. For non-normally distributed data, the Mann–Whitney U test was utilized, and these results were presented as median ± interquartile range. Qualitative data were evaluated using the Chi-squared test. Statistical significance was defined at a significance level of p < 0.05. The False Discovery Rate correction method was used for all p-values to control the type I error rate across the multiple comparisons.
Results
Demographic and clinical characteristics
This study included a total of 289 epilepsy patients who satisfied all the inclusion and exclusion criteria, comprising 177 patients with DRE and 112 patients with W-C epilepsy. Among the 177 included DRE patients, 86 were male and 91 were female. Among the 112 W-C epilepsy patients, there were 55 males and 57 females. There were no notable disparities in gender distribution between the two groups (p = 1.000). The average age of DRE patients was 33.14 ± 13.48 years, while for W-C epilepsy patients, it was 34.33 ± 16.85 years. There was no statistically significant age difference between the two groups (p = 0.529). In terms of disease duration, patients in the DRE group had an average disease duration of 13.28 ± 9.86 years, while those in the W-C group had a mean disease duration of 8.21 ± 8.00 years. A statistically significant difference in disease duration was observed between the two groups (p < 0.001).
Regarding etiology, 53 (29.94%) DRE patients had structural causes, while 30 (26.79%) W-C epilepsy patients had structural causes (p = 0.603, Chi-square test). The Montreal Cognitive Assessment score for DRE group patients was 24.31 ± 5.84, compared to 26.22 ± 5.00 in the W-C group. DRE group patients had an MMSE score of 26.51 ± 5.07, whereas the W-C group scored 28.24 ± 3.123. The SAS scores were 43.31 ± 10.08 for the DRE group and 39.97 ± 11.00 for the W-C group. Additionally, the SDS scores were 47.71 ± 12.55 for the DRE group and 43.31 ± 13.86 for the W-C group. Table 1 displays the demographic information and pertinent clinical attributes of patients in both cohorts.
Microstate topographies
The EEG microstate classification in this study was based on the k-means clustering algorithm. The specific process is illustrated in Figure 1. Briefly, as shown in Figure 1(a), the preprocessed clean EEG data from individual subjects were used to quantify the synchrony of activity between electrodes at each time point using GFP. Stable topographies were identified by detecting GFP peaks, yielding the original EEG topographies at GFP peaks for each subject. These original EEG topographies were then clustered using the k-means algorithm to obtain individual EEG microstate classes. Subsequently, all subjects’ EEG microstate classes were clustered at the group level using the k-means algorithm, resulting in group-level EEG microstate classes.

The flowchart of EEG microstate classification based on the k-means algorithm.
The principle of identifying EEG microstate classes based on the k-means clustering algorithm is as follows: Briefly, n topographies are randomly selected as template maps from the original EEG topographies at GFP peaks. The original EEG topographies are then assigned to these n template maps by calculating the spatial correlation coefficients. The original EEG topographies divided into n classes are averaged within the same class, and this process is repeated. The number of iterations is set to 2000, and the value of n ranges from 2 to 15 until the global explained variance (GEV) is maximized, thereby obtaining the optimal EEG microstate classes. Figure 1(b) shows a schematic diagram of the k-means algorithm process when n = 2.
Consistent with pioneering work, we categorized the microstates into four classes: A, B, C, and D. Figure 2 illustrates the microstate maps of EEG activity for both the W-C and DRE groups. These categories bear a striking resemblance to those observed in previous studies. The topography of Microstate A extends from the right frontal-central to the left occipital, while Microstate B spans from the left frontal-central to the right parieto-occipital region. Microstate C encompasses the fronto-central to occipital regions, and Microstate D covers the central frontal to occipital regions.

Microstate topographic maps.
Microstate parameters
In the pursuit of elucidating microstate alterations among DRE patients, we conducted group comparisons for each parameter, encompassing duration, occurrence rate, and coverage. Mann–Whitney U tests between the two groups for all three parameters are presented in Table 2. In comparison to the W-C group, DRE patients exhibited a significantly prolonged duration of microstate B (p < 0.001), along with increased frequency and coverage (p < 0.001 and p < 0.001, respectively). Conversely, the durations of microstates C and D were significantly shorter in the DRE group compared to the W-C group (p < 0.01 and p < 0.001, respectively). Furthermore, in contrast to the W-C group, DRE patients displayed significantly reduced frequency and coverage for microstate C (p < 0.01 and p < 0.01, respectively) and a significant decrease in frequency and coverage for microstate D (p < 0.001 and p < 0.001, respectively). Parameters of microstate A, including duration, occurrence rate, and coverage, exhibited no notable distinctions between the two groups (Figure 3). On average, the templates explained 79.63 ± 8. 67, 77.79 ± 5.59 of the GEV (fitting to maps at GFP local maxima) for two groups of patients (DRE and W-C group) (p = 0.670; Table 2).
Microstate characteristics between the two groups.
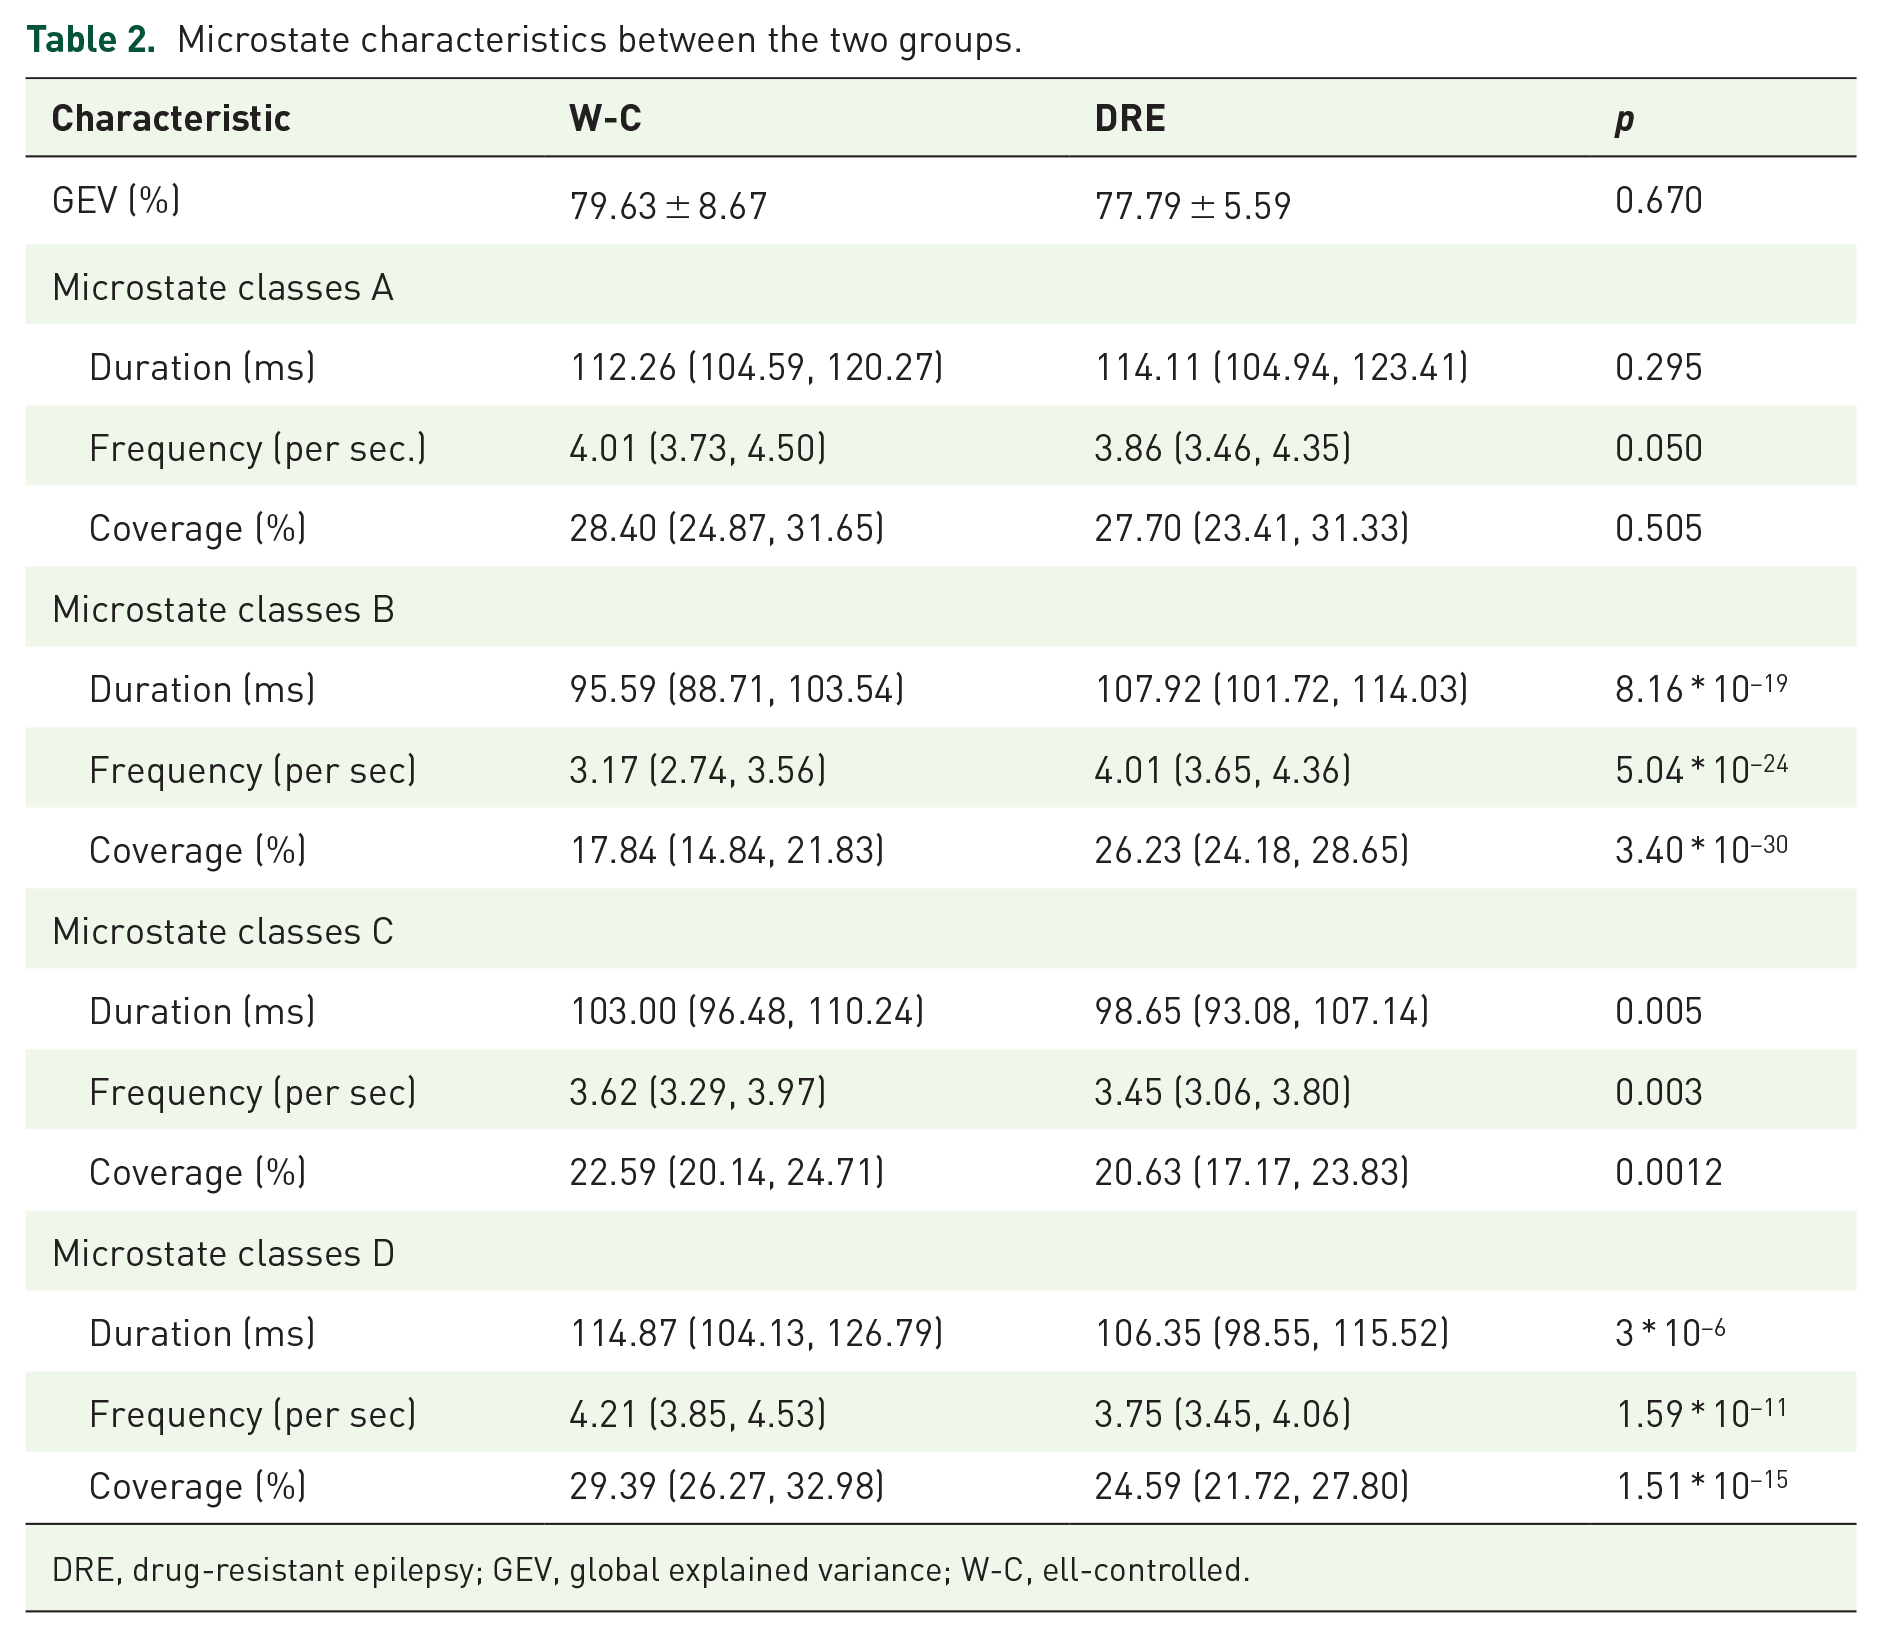
DRE, drug-resistant epilepsy; GEV, global explained variance; W-C, ell-controlled.

Temporal features of microstates between two groups. (a) The duration of microstate A–D. (b) The occurrences per second of microstate A–D. (c) The coverage of microstate A–D. The p-values are outcomes of the Mann–Whitney U test for inter-group comparison.
Transition probabilities
We also examined transitions in microstate topographies between the groups (Figure 4). In comparison to W-C patients, transitions from Microstate A to Microstate B, from Microstate B to Microstate A, from B to C, from C to B, from D to B, and from B to D were more prevalent in DRE patients. Conversely, transitions from C to A, from D to A, from A to C, from A to D, from C to D, and from D to C were less frequent in DRE patients compared to W-C patients (all p-values < 0.001) (Figure 4). Detailed information is presented in Figure 5.

EEG microstate transition probabilities in the two groups. Transition probabilities from microstates A, B, C, D to other microstates in W-C group (a) and DRE group (b).

Comparison of the EEG microstate transition probabilities between two groups. Transition probabilities from microstates A to other microstates (a), B to other microstates (b), C to other microstates (c), and D to other microstates (d). The p-values are outcomes of the Mann–Whitney U test for inter-group comparison.
Discussion
In this study, we employed microstate-based analysis to delve into the distinctions in EEG patterns between DRE and W-C epilepsy patients. Notably, we observed that DRE patients exhibited prolongation in the duration of microstate B, accompanied by an increase in frequency and coverage. In contrast, DRE patients demonstrated notably shorter durations for microstates C and D when compared to the W-C group. Additionally, the frequency and coverage of microstates C and D were decreased in DRE patients when contrasted with the W-C group. Intriguingly, the parameters of microstate A, including its duration, occurrence rate, and coverage, exhibited no notable distinctions between the two groups. Furthermore, transitions between microstates showcased significant alterations in DRE patients. Transitions involving an increase in TPAB, TPBA, TPBC, TPCB, TPBD, and TPDB in DRE patients. Conversely, transitions with decreased probabilities in DRE patients included TPCA, TPDA, TPAC, TPAD, TPCD, and TPDC.
We observed that the ideal quantity of microstate categories for both the W-C and DRE patient cohorts was determined to be four Consensus has yet to be reached on determining the finest number of microstate categories.8,18,21 In numerous prior experimental and clinical studies, the quantity of microstate categories was fixed at 4, 8 consistent with our study. To our knowledge, only five studies have employed comprehensive microstate analysis for epileptic patients’ EEG, and these five studies’ microstate templates bear a resemblance to those we reported.17–20,22
In this study, we observed no notable distinctions in various parameters of microstate A between DRE and W-C patients. Earlier resting-state fMRI studies have indicated a strong association between Microstate A and the auditory network. 23 The regions involved include both the left and right superior and middle temporal gyri, which are associated with the processing of speech. Apart from its brain engagement, the topographical origins of EEG microstate A have garnered extensive attention. 24 Left hemisphere activity in the temporal, insular, medial prefrontal, and occipital regions is believed to contribute predominantly to Microstate A.21,24 Earlier research focusing on absence epilepsy suggested no significant differences in microstate A parameters during interictal periods compared to healthy controls (HCs). 18 Another study examining newly diagnosed TLE patients before and after treatment with the antiepileptic drug lacosamide found no substantial changes in microstate A parameters. 19 However, a study on idiopathic generalized epilepsy (IGE) found significant differences in the coverage of resting-state EEG microstate A between IGE and HCs. 17 More recently, Sun et al. 20 discovered elevated occurrence of microstate A in TLE patients co-occurring with depression than without depression. This divergence in findings indicates ongoing debates regarding whether epilepsy induces alterations in microstate A. Nonetheless, a common limitation among these studies is their relatively small sample sizes (all under 50 cases), rendering it inconclusive whether epilepsy truly leads to changes in microstate A. Our study, incorporating EEG data from 289 epilepsy patients for microstate analysis, identified no notable distinctions in microstate A parameters between DRE and W-C patients. Thus, we have grounds to speculate that variations in microstate A are not a potential neuro-network mechanism underlying DRE.
Microstate B has been associated with networks linked to the visual system. 21 Bilateral occipital regions and underlying subcortical structures exhibit functional connectivity in this network. 23 We found an extended average duration, increased frequency, and broader coverage of microstate B in DRE. Similar alterations in microstate B have been reported in different epilepsy types. Increased microstate B parameters during interictal periods have been noted in AE patients in comparison to HC. 18 However, another study on IGE found no notable distinctions in microstate B parameters between IGE and HC. 17 This discrepancy could be attributed to differing influences of distinct epilepsy types on microstate B. While inconclusive due to inconsistent findings, recent research by Ricci et al. 19 appears promising in explaining these observations. They reported significant changes in EEG microstate B parameters before and after treatment with levetiracetam, an antiepileptic drug, in newly diagnosed TLE patients. Levetiracetam was found to shorten the duration and decrease the occurrence frequency of microstate B. 19 This seems to offer an explanation for the elevated microstate B parameters observed in DRE in our study.
A recent research study showed alterations in microstate C parameters among individuals with TLE, and these characteristics achieved a 76.1% accuracy in distinguishing between individuals with epilepsy and HC. 22 EEG-fMRI recordings have revealed that microstate C is associated with significant networks, responsible for identifying the most relevant stimuli from a multitude of internal and external inputs to guide appropriate actions. 23 The anterior cingulate cortex, posterior cingulate gyrus, left inferior frontal gyrus, left insula, right inferior frontal gyrus, and right amygdala demonstrate functional connectivity within this specified network. 23 In our study, we found decreased duration, occurrence frequency, and coverage of microstate C in DRE in contrast to the W-C group. The reduced microstate C might reflect substantial disruptions in networks among DRE patients, aligning with the hypothesis that disrupted SNs contribute to comorbid psychiatric disorders in DRE. 25 Jiang et al. 17 also found significantly reduced average duration and coverage of microstate C in IGE in comparison to HC. Conversely, Liu et al. 18 reported no significant differences in microstate C parameters during interictal periods in absence epilepsy patients compared to HCs. Additionally, a study on TLE indicated that parameters of microstate C remained unchanged before and after treatment with levetiracetam. 19 The results from these studies suggest that microstate C parameters could potentially serve as diagnostic markers for DRE, though they might not be suitable as prognostic indicators.
When examining parameters related to microstate D, we observed a decrease in average duration, coverage, and occurrence rate. Microstate D is predominantly linked to the dorsal attention network. 23 Multiple research investigations have illustrated specific deficits within the dorsal attention network in individuals with TLE by utilizing resting-state fMRI.26,27 Notably, a study reported abnormal homogeneity within the dorsal attention network in right TLE patients. 27 The noted decrease in microstate D within our group could potentially function as a neurophysiological indicator of abnormal dorsal attention network operation in individuals with DRE. A study also identified microstate D’s involvement in the neurophysiological network mechanism of comorbid depression in TLE. They found shorter duration of microstate D in TLE patients with depression compared to those without depression. 20 In contrast, two additional investigations reported the absence of significant distinctions in microstate D parameters when comparing HC to AE or IGE.23,24 However, an analysis of drug-naïve newly diagnosed TLE patients following treatment with levetiracetam revealed significant changes in microstate D parameters. 19 Collectively, these studies suggest that microstate D may hold promise as a prognostic marker for patients with DRE.
Furthermore, alterations associated with DRE are also reflected in transition probabilities (TPs). Compared to W-C patients, DRE patients exhibit higher occurrence frequencies in TPAB, TPBA, TPBC, TPCB, TPBD, and TPDB, while showing lower occurrence frequencies in TPCA, TPDA, TPAC, TPAD, TPCD, and TPDC. It has been proposed that microstate TPs may represent ordered activations of distinct brain networks.28–30 Several studies have reported abnormal microstate TPs in epilepsy patients17,18; however, results are somewhat inconsistent. The aberrant microstate TPs observed in DRE patients may signify disorganized shifts between brain networks, potentially driving the drug-resistant changes in epilepsy patients. Based on the RSNs associated with the four microstates, the increased TPs related to microstate B in DRE can be inferred as enhanced interactions between critical nodes within the visual network. In brief, the outcomes of this study imply an alteration in the initial dynamic balance among microstates, hinting at a process of compensation and restructuring of network dynamics in individuals with DRE. The temporal dynamics of reconstruction appear to be state-selective.
There are certain constraints associated with our study that should be recognized. First, the study design is retrospective and non-randomized in nature. Nonetheless, our research indicates that EEG microstate metrics derived from low-density scalp EEG data show the potential in uncovering significant insights for the diagnosis and management of DRE. When validated in more extensive prospective study groups, these discoveries could be contemplated for potential clinical utilization down the road, with the goal of improving medical care and furnishing innovative biomarkers for individuals with DRE. Furthermore, our investigation explored four microstate configurations across the 2–20 Hz frequency spectrum. For more precise measurements, analyzing different frequency bands (delta, theta, alpha, and beta) could be pursued to further enhance the accuracy of our findings.
Conclusion
In summary, this study has revealed alterations in EEG microstate parameters and microstate TPs in DRE patients compared to W-C epilepsy patients, reflecting disruptions in the brain networks of DRE. Our findings provide a better understanding of the pathophysiology of DRE. Given that microstates have been identified as indicators of lacosamide efficacy, elucidating the microstate patterns in DRE could contribute to the identification of treatment strategies and intervention targets for DRE.