
Abstract
Background:
Drug-resistant epilepsy (DRE) affects approximately one-third of epilepsy patients who do not achieve adequate seizure control with medication. Vagus nerve stimulation (VNS) is an adjunctive therapy for DRE, but its long-term effects on cortical excitability remain unclear.
Objectives:
This study aims to elucidate the long-term effects of VNS on electroencephalography (EEG) aperiodic components in patients with DRE. Our objective is to identify biomarkers that can serve as indicators of therapeutic efficacy and provide mechanistic insights into the underlying neural processes.
Design:
This longitudinal observational study focused on patients with DRE undergoing VNS therapy at Sanbo Brain Hospital. The reduction in seizure frequency rates was quantified over short-term (⩽1 year), medium-term (1–3 years), and long-term (⩾3 years) intervals to assess the therapeutic efficacy of VNS. Both the periodic and aperiodic components of EEG data were analyzed.
Methods:
Advanced signal processing techniques were utilized to parameterize the periodic and aperiodic components of EEG data, focusing particularly on “offset” and “exponent.” These measures were compared before and after VNS therapy. Correlation analyses were conducted to explore the relationship between these EEG parameters and clinical outcomes.
Results:
In all, 18 patients with DRE participated in this study. During the long-term follow-up period, the responder rate was 55.56%. Significant decreases were observed in aperiodic offset (p = 0.022) and exponent (p = 0.039) among responders. The impact of age on these results was not significant. Correlation analyses revealed a negative association between therapeutic efficacy and a decrease in offset (R = −0.546, p = 0.019) and exponent (R = −0.636, p = 0.019).
Conclusion:
EEG aperiodic parameters, including offset and exponent, have the potential to serve as promising biomarkers for evaluating the efficacy of VNS. An understanding of the regulatory influence of VNS on cortical excitability through these aperiodic parameters could provide a basis for the development of more effective stimulation parameters and therapeutic strategies.
Introduction
Approximately one-third of epilepsy cases are drug-resistant epilepsy (DRE). 1 Patients with DRE fail to achieve adequate response after trying two or more antiseizure medications (ASMs). In recent years, non-pharmacological interventions have been increasingly used, broadly categorized into resective epilepsy surgery, neuromodulation approaches, and other non-surgical methods. 2 Neurosurgical resection is recognized as the most effective way to achieve long-term seizure freedom and improve quality of life in selected individuals with refractory focal epilepsy.3,4 However, this option is not universally available, as some patients are not candidates for resective surgery due to an indeterminate epileptogenic zone after detailed preoperative evaluation, or because their epilepsy is non-focal in nature. For those unsuitable for resective surgery, including individuals with non-focal epilepsy, neuromodulation techniques such as vagus nerve stimulation (VNS) offer viable therapeutic alternatives. 5
Since its approval by the FDA in 1997, VNS has been an effective and relatively safe adjunctive therapy for patients with DRE who are not amenable to resection. 6 In both adults and children, the efficacy of VNS may increase over time, with long-term responder rates of 50% (56%–63%) and seizure freedom rates of 8%–12% observed after multiple years of exposure.7,8 In addition to reducing the frequency of seizures, VNS has been shown to have other benefits, including alleviating depression, 9 improving quality of life, and decreasing economic costs. 10 Despite its widespread use, the mechanisms by which VNS achieves these effects are not fully understood, 11 particularly regarding its long-term effects on cortical neural activity.
Epileptic seizures are indicative of aberrant, synchronous electrical activity within neuronal networks, resulting from an imbalance between excitation and inhibition.12,13 It remains uncertain whether VNS modifies this cortical imbalance. An understanding of the changes in electroencephalography (EEG) activity can provide insight into the cortical mechanisms involved in VNS. Early studies revealed that VNS treatment could cause desynchronization of cortical electrical activity in rats. 14 Alexander and McNamara found that VNS increased the seizure threshold in the kindling model. 15 Furthermore, they discovered that VNS modified neuronal firing rate and the composition of excitatory synapses in the central nervous system. 16 We aim to investigate the cortical mechanisms of VNS by examining whether VNS alters the excitatory–inhibitory balance of brain networks.
In the past, the aperiodic component of EEG has been either ignored or treated as a nuisance variable that requires correction in spectral whitening. 17 This may be attributed to the lack of adequate computational tools and theoretical frameworks. In pioneering work, Donoghue et al. introduce an algorithm to parameterize neural power spectra as a combination of an aperiodic component and periodic oscillatory peaks. 18 Furthermore, they provide the “Fitting Oscillations and One-Over-f” (FOOOF) toolbox. This tool enables the computation of the aperiodic offset, which has been demonstrated to correlate with neuronal population spiking, 19 and the aperiodic exponent, which has been shown to relate to the integration of underlying synaptic currents. 20
There is a deficit of understanding regarding the extent to which VNS modifies the cortical excitation–inhibition balance and the corresponding changes in EEG activity. This is a crucial factor for improving therapeutic outcomes. The hypothesis is that VNS can modify neuronal spiking rates and the excitation–inhibition balance, thereby decreasing seizure frequency. In this study, we will compare the periodic and aperiodic components of EEG before and after VNS treatment to identify potential changes in neural activity induced by VNS. By elucidating these changes, we aim to enhance our understanding of how VNS exerts its therapeutic efficacy, thereby providing insights that could inform the optimization of VNS protocols and the development of novel neuromodulatory treatments for epilepsy.
Materials and methods
Patient selection
In this study, we retrospectively analyzed patients with DRE who underwent VNS at Sanbo Brain Hospital from January 2008 to December 2022. The inclusion criteria were as follows: (1) Patients who met the International League Against Epilepsy (ILAE) diagnostic criteria for DRE, 1 (2) patients who underwent VNS implantation after a standardized preoperative evaluation for epilepsy, (3) patients who were followed up for at least 3 years after VNS implantation, and (4) patients who had eligible non-rapid eye movement (NREM) stage II sleep EEG data available for subsequent analysis without significant artifacts, such as those caused by muscle activity, cardiovascular activity, or external factors related to the EEG equipment. Patients were excluded if they received additional antiepileptic treatments after VNS implantation (such as new antiepileptic drugs, ketogenic diet, or resective surgery), terminated VNS treatment within 3 years of implantation, or had incomplete follow-up information.
Preoperative assessment
All patients underwent a comprehensive preoperative evaluation, which included a detailed review of their medical history, a comprehensive neurological examination, scalp video-EEG monitoring, and neuroimaging, and neuropsychological assessment. The proposed treatment strategies were discussed by the multidisciplinary team to ensure a well-rounded approach. The team comprised neurologists, pediatricians, epilepsy surgeons, electrophysiologists, and neuropsychologists. The objective of the collective evaluation was to ascertain the etiology of each patient’s condition, rule out treatable causes, and identify any age-dependent epileptic syndromes that might be self-limiting in the short term. We performed a comprehensive analysis based on the type of epilepsy and its etiology. Epilepsy types were categorized into focal, multifocal, and generalized. Etiologies were classified into six major categories: structural, genetic, infectious, metabolic, immune, and unknown. 21
VNS procedure, follow-up, and outcome classification
The VNS surgery was conducted following the comprehensive assessment. Two models of stimulators were implanted: Model 103 (Demipulse; LivaNova; London, United Kingdom) and Model G111 (Beijing PINS Medical Co., Ltd.; China, Beijing). Despite the different manufacturers, both stimulators have demonstrated comparable efficacy in clinical practice, supported by previous studies and our own clinical experience. 22 The use of standardized initial parameters for both models of VNS stimulators was based on our center’s programming protocol, which has been developed and refined over the years. 23 The initial settings included an output current of 0.5 mA, a signal on time of 30 s, and a signal off time of 5 min. The signal frequency was kept at 30 Hz, with a pulse width of 250 or 500 ms. In addition, the magnet current was set to be 0.25 mA higher than the output current.
During outpatient follow-up, the current intensity required for effective treatment was gradually increased to a range of 1.25–2.25 mA. Adjustments for the LivaNova model were made in increments of 0.25 mA, while adjustments for the PINS (Patient Is No.1 alwayS) models were made in increments of 0.20 mA. Most patients maintained the same on/off times, but adjustments were made as necessary based on individual patient response and tolerability, ensuring personalized treatment optimization.
All enrolled patients were followed for at least 3 years after VNS therapy. VNS outcomes were evaluated at three distinct intervals: short term (⩽1 year), medium term (1–3 years), and long term (⩾3 years). Seizure frequency was determined by calculating the mean monthly seizure rate. Response to VNS was defined as a reduction in seizure frequency of more than 50%. In addition, outcomes were assessed using the VNS-specific classification criteria proposed by McHugh et al. 24
EEG recording and preprocessing
In this study, EEG monitoring was conducted at four time points: preoperatively, short term, medium term, and long term after VNS implantation. EEGs were recorded using a 64-channel system with international standard 10–20 electrode placements, utilizing a Nicolet recording system. EEG data were acquired at a sampling rate of either 512 or 1024 Hz. Electrode impedance levels were maintained at or below 5 kΩ during data acquisition. The EEG was initially referenced online to the central midline electrode site (Cz). For the analysis, data from a total of 19 scalp electrodes were included: Fp1, F3, C3, P3, O1; F7, T3, T5; Fz, Cz, Pz; Fp2, F4, C4, P4, O2; and F8, T4, T6.
Five-minute segments of artifact-free NREM stage II sleep EEG were selected for analysis. NREM stage II sleep EEG was chosen due to its stability and the prevalence of consistent brain activity patterns, which are less likely to be affected by external factors. 25 The EEG data were pre-processed using the EEGLAB toolbox to ensure data quality and to provide clear, reliable signals for subsequent in-depth analysis. 26 The EEG signals were re-referenced to the average of all electrodes. The data were then filtered with a 0.5 Hz high-pass filter and a 40 Hz low-pass filter, and the sampling rate was downsampled to 256 Hz. Independent component analysis was used to correct for residual artifacts, such as minor muscle activity and other subtle sources of noise that might still be present despite the initial artifact-free selection. Each pre-processed EEG segment was evaluated individually, and manual artifact removal was performed as necessary to ensure the highest data quality.
Analysis of the EEG periodic and aperiodic components
In our study, we calculated the average periodic (center frequency and power) and aperiodic (offset and exponent) components from EEG recordings obtained from 19 electrodes over 5-min segments. For each patient, periodic and aperiodic values were derived from each EEG segment. These values were then compared between pre- and post-VNS therapy to assess the effect of VNS on these EEG markers. This comparison aimed to provide insight into the neurophysiological changes associated with the treatment, thereby evaluating the efficacy and neural mechanisms underlying VNS therapy.
EEG data were analyzed using the Brainstorm toolbox for MATLAB (Natick, MA). 27 Power spectral density (PSD) was calculated in 0.5 Hz steps from 0.5 to 40 Hz using Welch’s method (10 s-time window, 0.5 s-window length, and 50% overlap). The FOOOF toolbox was used to calculate the periodic (center frequency and power) and aperiodic (offset and exponent) components. 18
The power spectrum density, PSD, was modeled by three parameters, as shown in the following equation:

where L is the aperiodic “background” signal, with N total peaks extracted from the power spectrum, and Gaussians (Gn) fitted to each peak. The peaks were iteratively fitted by Gaussians, as shown in the following equation:
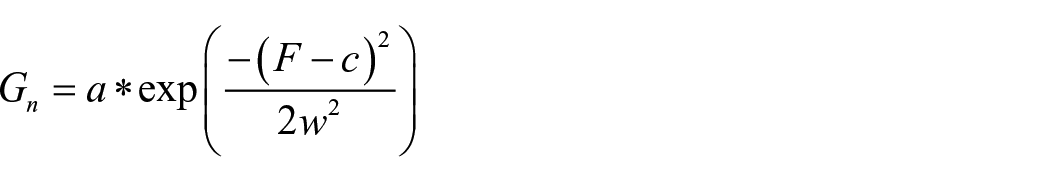
with an amplitude a, center frequency c, bandwidth of the Gaussian w, and the input frequencies F. The aperiodic signal L was modeled by four parameters, as shown in the following equation:

where b is the broadband offset, x is the exponent, and k is the knee parameter.
Calculation of the periodic components
The periodic components were identified as oscillatory peaks within the PSD. The center frequency and power of these oscillatory peaks were determined through a series of steps: first, the PSD was examined to locate peaks indicative of oscillatory activity; then, each identified peak was iteratively fitted with a Gaussian function to accurately model the center frequency and power of the oscillation; finally, the center frequency (c) and power (a2) of each peak were extracted from the Gaussian fits.
Calculation of the aperiodic components
The aperiodic “background” signal (L) was modeled as a broadband offset and exponent. The parameters b (offset) and x (exponent) were used to model the overall shape of the PSD. In this study, F represents the vector of input frequencies, which was set in the range of 0.5–40 Hz. This range was chosen to cover the spectrum of relevant EEG frequencies, thus ensuring a comprehensive analysis of brain activity. The parameter K, known as the “knee” parameter, was set to 0. This setting indicates the absence of a knee, resulting in a linear direct relationship between the slope a and the exponent x, where x = −a. This linear relationship simplifies the interpretation of the data, as changes in the exponent directly reflect changes in the slope.
The broadband offset reflects the uniform shift of power across frequencies and describes the vertical translation of the aperiodic component. In the above model, the offset represents a global frequency-independent adjustment of power levels across the entire spectrum. To better understand the underlying neural mechanisms, Voytek et al. emphasized the importance of separating the broadband offset from periodic activity. 28 The broadband power shifts were shown to reliably predict neuronal spiking and provide valuable information concerning neuronal activity. 19
The slope of PSD in log–log space is equivalent to the negative exponent due to the aperiodic activity exhibiting a 1/f-like distribution, where power decreases exponentially with increasing frequency. 29 This characteristic distribution is fundamental to understanding the neural dynamics captured in EEG recordings. The excitatory–inhibitory ratio can be inferred from the slope of the 1/f power spectrum. Specifically, a steeper slope corresponds to a lower ratio. 30 This relationship indicates that a more negative slope suggests relatively a higher level of inhibition within the underlying neuronal populations. 18 Analysis of the slope provides critical insight into the balance between excitatory and inhibitory activity in the brain, with a more pronounced negative slope reflecting a dominance of inhibitory processes.
Statistical analysis
We used G*Power software to conduct a power analysis to determine the appropriate sample size for this study. 31 Using a significance level of 0.05 and a desired statistical power of 0.80, we determined that a sample size of 19 patients would be sufficient to detect a medium effect size (Cohen’s d = 0.6) in the differences between pre- and post-treatment conditions. This calculation was based on preliminary data and literature suggesting a larger effect size for VNS treatment. During the patient enrollment process, slight adjustments were made based on stringent inclusion criteria, resulting in the final inclusion of 18 patients.
To assess the effect of VNS treatment, pairwise comparison methods were used to assess significant differences between pre-VNS baseline measurements and post-VNS follow-up measurements. Normality tests were first performed to determine the distribution of the data. Paired t-tests were applied for datasets that met normality assumptions and showed homogeneity of variance. In cases where normality assumptions were not met, the nonparametric Wilcoxon matched-pairs signed-rank test was used. Statistical significance was set at p < 0.05, with p values corrected using the original false discovery rate method proposed by Benjamini and Hochberg. 32
Analysis of variance (ANOVA) was performed to examine the effect of age on changes in offset and exponent. This step was crucial to ensure that any observed effects were not confounded by age-related differences, as aging has been associated with EEG aperiodic activity. 28 Linear correlation analysis was performed to clarify the relationship between the reduction in seizure frequency and the decrease in offset and exponent parameters. By conducting these statistical analyses, we aimed to validate that the observed changes in neural activity were directly attributable to the VNS intervention, independent of age, and to better understand the potential mechanisms by which VNS modulates neural dynamics.
Results
Clinical information
A total of 18 patients with DRE undergoing VNS therapy were recruited for this study (Table 1). The cohort consisted of 13 male and 5 female patients. The average age at the time of surgery was 14.87 ± 12.22 years, with a range from 2.60 to 50.40 years. The age at seizure onset was 9.98 ± 11.32 years (range 0.50–46.00 years), and the duration of seizures prior to surgery was 4.88 ± 4.17 years (range 0.60–15.30 years). Follow-up visits were scheduled in the short (⩽1 year), medium (1–3 years), and long (⩾3 years) term after VNS therapy. The short-term follow-up averaged 6.75 months (range 3.67–12.40 months), the medium-term follow-up averaged 25.38 months (range 14.60–32.23 months), and the long-term follow-up averaged 48.25 months (range 34.57–55.97 months).
Patients’ demographic and clinical characteristics in long-term follow-up.

ASM, antiseizure medications; EEG, electroencephalography; VNS, vagus nerve stimulation.
We evaluated the efficacy of VNS treatment in each patient with DRE. In the short term, the efficacy rate was 61.11%, with 11 responders (8 classified as Mc Hugh I) and 7 non-responders. In the medium term, the efficacy rate increased to 72.22%, with 13 responders (12 classified as Mc Hugh I) and 5 non-responders. In the long term, the efficacy rate was 55.56%, with 10 responders (9 classified as Mc Hugh I) and 8 non-responders (Figure 1).

Longitudinal efficacy and classification of VNS therapy across different follow-up periods. (a
Regarding the type of epilepsy, two patients presented with generalized epilepsy, and both exhibited a favorable response to VNS therapy. Of the two patients with focal epilepsy, one exhibited consistently poor outcomes throughout all follow-up periods, whereas the other demonstrated improvement over time. Among the 14 patients with multifocal epilepsy, the responses were heterogeneous, with no significant differences observed (Supplemental Table 3). From an etiological perspective, six patients had an unknown etiology, with mixed responses. Four patients demonstrated favorable outcomes, while two exhibited unfavorable outcomes. All two patients with an infectious etiology had poor outcomes. Among the eight patients with a structural etiology, the majority (six patients) showed favorable outcomes, while two had unfavorable outcomes. The single patient with a genetic etiology exhibited unfavorable responses throughout all follow-up periods (Supplemental Table 4).
Among patients with long-term follow-up, there were no statistical differences between responders and non-responders in terms of demographic data, medical history, seizure characteristics, EEG, MRI, etiology, and use of ASMs. There is a significant difference in the output current of VNS parameters between the two groups. Non-responders exhibited a higher output current compared to responders (1.50 ± 0.20 mA vs 2.03 ± 0.21 mA, p = 0.000), suggesting more challenging treatment conditions for non-responders.
EEG periodic activity over different time periods
We evaluated the effect of VNS on EEG periodic activity in patients with DRE over different follow-up periods. Specifically, we compared the center frequency and power of EEG signals before and after VNS therapy. Our analysis showed no significant changes in center frequency or power across at any follow-up period for both responders and non-responders (Figure 2; Supplemental Tables 1 and 2).

Analysis of periodic activity (center frequency and power) over multiple follow-up periods. (a–c) Center frequency changes: analyzed for both R and NR across three follow-up periods: short term (⩽1 year), medium term (1–3 years), and long term (⩾3 years) after VNS. No significant changes were detected in any period. (d–f) Power fluctuations: evaluated for both responders and non-responders across the same follow-up periods post-VNS treatment. All periods showed no significant differences.
EEG aperiodic activity over different time periods
We analyzed the effect of VNS on EEG aperiodic activity in patients with DRE over different follow-up periods, distinguishing between responders and non-responders. Both offset and exponent values of EEG data were compared before and after VNS therapy.
Offset over different time periods
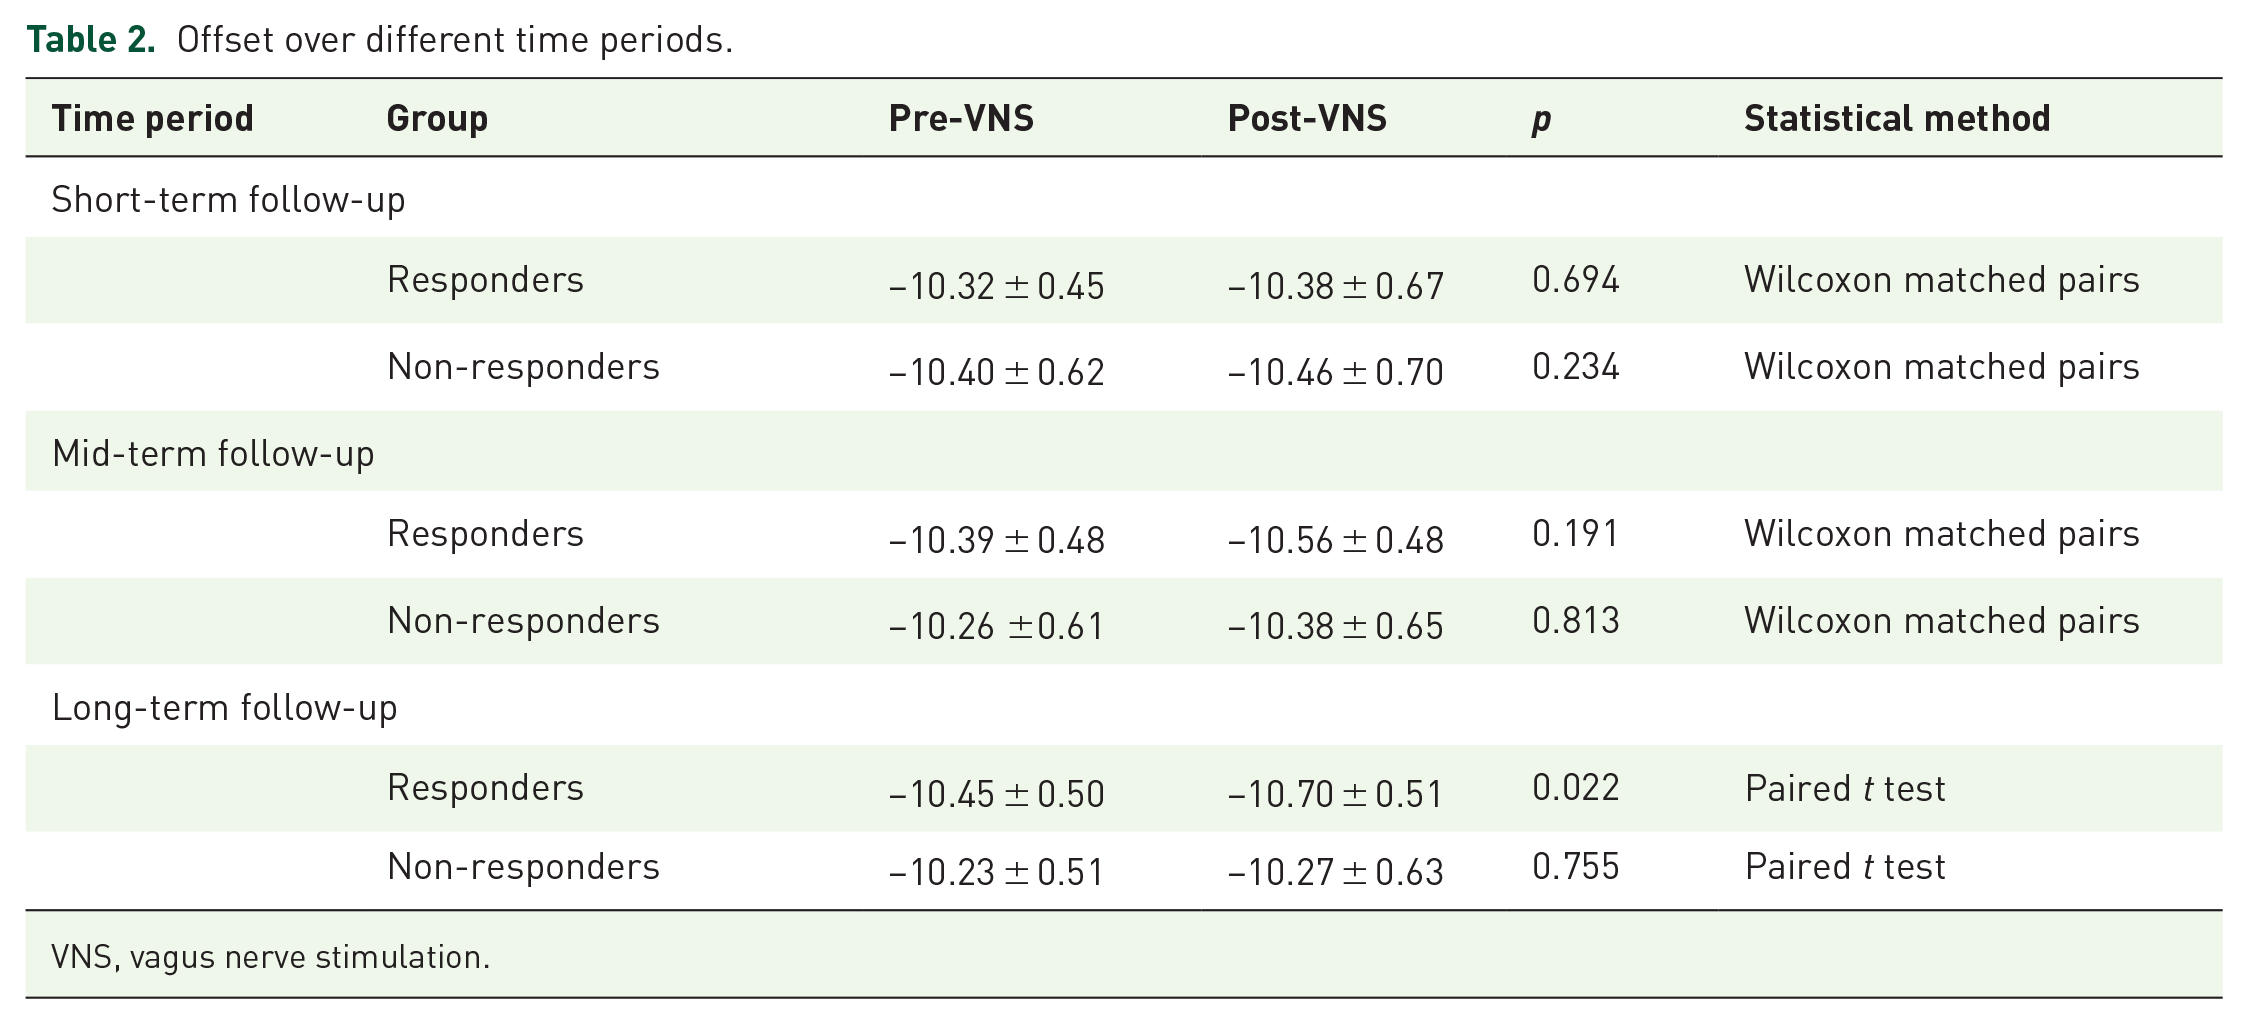
There were no significant changes in offset for both responders and non-responders at short- and medium-term follow-up. However, during long-term follow-up, responders exhibited a significant reduction in offset values compared to pre-VNS implantation (−10.45 ± 0.50 vs −10.70 ± 0.51, p = 0.022, paired t-test). By contrast, non-responders showed no significant changes in offset during the long-term follow-up period (Figure 3 and Table 2).

Temporal analysis of offset reductions before and after VNS across different follow-up intervals. (a) Short-term offset reductions: no significant differences in offset for both R and NR were observed between pre-VNS and post-VNS within 1 year. (b) Mid-term offset reductions: both responders and non-responders showed no significant offset changes from pre-VNS to post-VNS over 1–3 years. (c) Long-term offset reductions: responders exhibited a statistically significant reduction in offset from pre-VNS to post-VNS after 3 years (*p = 0.02).
Offset over different time periods.
VNS, vagus nerve stimulation.
To further investigate the potential influence of age on offset changes, we analyzed the relationship between age and offset changes in both groups. The analysis revealed no correlation in either group (responders: R² = 0.078, p = 0.435; non-responders: R² = 0.052, p = 0.588). These results underscore that while VNS therapy significantly reduces offset in the long term for responders, age has no significant effect on offset change in either group (Figure 5(a)).
Exponent over different time periods
Similarly, no significant changes in exponent were observed in either responders or non-responders at short- or medium-term follow-up. At long-term follow-up, the mean pre-VNS exponent for responders was 1.95 ± 0.23, which decreased significantly to 1.76 ± 0.21 post-VNS (p = 0.039, paired t-test). Compared with pre-VNS, the post-VNS exponent of non-responders showed no significant change (Figure 4 and Table 3).

Differential impact of VNS on exponent reductions across various follow-up periods. (a) Short-term exponent reductions: before and after VNS in responders (R) and non-responders (NR) within 1 year. No significant changes were detected. (b
Exponent over different time periods.

VNS, vagus nerve stimulation.
We examined the effect of age on changes in exponent. The analysis showed no significant correlation between age and exponent changes in either group (responders: R² = 0.091, p = 0.398; non-responders: R² = 0.031, p = 0.718). These results indicate that VNS therapy significantly reduces exponent in responders in the long term, while age has no significant effect on exponent changes in either group (Figure 5(b)).

Assessing the impact of age on offset and exponent reductions. (a) Relationship between age and offset reduction for R and NR. The red line represents a weak correlation (R² = 0.078, p = 0.435), indicating no significant relationship with age for R. The blue line shows an even weaker correlation (R² = 0.052, p = 0.588), confirming no significant age relationship for NR. (b) Relationship between age and exponent reduction for R and NR. The red line shows a correlation (R² = 0.088, p = 0.404), still indicating no significant relationship with age for R. The blue line illustrates a very weak correlation (R² = 0.017, p = 0.762), reinforcing the lack of a significant relationship for NR.
Correlation between offset and exponent with frequency reduction
The correlation analysis showed a significant negative correlation between the percentage reduction in seizure frequency and the post-VNS decrease in both offset (R = −0.546, p = 0.019) and exponent (R = −0.636, p = 0.019). These results indicate that a greater reduction in seizure frequency is associated with more substantial decreases in both offset and exponent. This suggests that the mechanisms underlying the efficacy of VNS in reducing seizure frequency may involve significant modulation of cortical excitability, as reflected by the changes in these aperiodic EEG parameters (Figure 6).

Correlations between reductions in offset and exponent and percentage reduction in seizure frequency. (a) Correlation between offset reduction and the percentage reduction in seizure frequency. Each point represents an individual patient. The red line depicts the linear regression model, with the pink-shaded region indicating the 95% confidence interval. There is a statistically significant negative correlation (R = −0.546, p = 0.019). (b) Correlation between exponent reduction and the percentage reduction in seizure frequency. Each point denotes an individual patient. The blue line illustrates the linear regression model, surrounded by the blue-shaded region representing the 95% confidence interval. A statistically significant negative correlation was found (R = −0.636, p = 0.019).
Discussion
In our study, we found significant decreases in EEG aperiodic activity (offset and exponent) in patients with DRE who responded to VNS therapy at long-term follow-up. These changes were not present at short- and medium-term follow-ups and were absent in non-responders. This indicates that the therapeutic efficacy of VNS on EEG aperiodic components becomes more pronounced over extended periods in those patients who show a positive clinical response. There are significant negative correlations between the percentage reduction in seizure frequency and the decreases in both offset and exponent. Greater reductions in seizure frequency were associated with larger decreases in aperiodic EEG markers. The significant decreases in offset and exponent in responders imply that VNS may improve the balance between excitatory and inhibitory neural activities. These findings suggest that VNS therapy, which significantly reduces seizure frequency, may achieve its therapeutic effects by modulating cortical excitability, as indicated by decreases in these aperiodic EEG parameters.
Scalp EEG captures electrical activity over a larger spatial and temporal scale, resulting in a more averaged and smoothed representation of the underlying local field potential. 20 Synchronization between different neuronal groups can occur not only through oscillatory activity but also within arrhythmic brain activity that lacks apparent periodicity. 33 The aperiodic activity of EEG, which does not arise from any regular, rhythmic process, 34 has been relatively under-explored. This aperiodic component can be characterized by a 1/fx function, where the “offset” reflects a uniform shift in power across all frequencies, and the “exponent” characterizes the distribution pattern of aperiodic power across the broadband frequency spectrum. 18
The broadband offset is important for the interpretation of baseline power levels and to ensure that subsequent analysis of spectral peaks will not be confounded by overall power variations. 35 Research has shown that the broadband power shift of subdural electrocorticographic potentials reflects cortical population activity. 36 In addition, the aperiodic offset is correlated with the blood-oxygen-level-dependent signal from functional MRI, indicating its relevance to neuronal activity. 37 Roberta et al. 38 found that the aperiodic offset decreased in responders after 1 year of VNS, while it increased in non-responders. In the present study, by comparing EEG offsets between pre- and post-treatment responders, we confirmed that VNS led to a significant reduction in offsets in the long-term follow-up. Furthermore, we found that there was a negative correlation between the percentage reduction in seizure frequency and decreases in offset. The reduction in aperiodic offsets suggests the changes in neural population mean firing rate, 29 which may be the mechanism by which VNS decreases seizure frequency. However, this phenomenon was observed only in long-term follow-up, which might imply that neuronal population spiking rate adjustments require extended periods.
The aperiodic exponent in the 1/fx function corresponds to the negative slope in log–log space and serves as a critical parameter in characterizing the aperiodic components of the PSD signal. The slope is a crucial indicator of the balance between excitation and inhibition within neural networks. 30 Empirical evidence suggests that an increased excitation–inhibition ratio may manifest as a flatter PSD slope, indicating a reduction in the synchronization of neuronal firing. 39 In epileptic networks, an imbalance between excitation and inhibition may lead to hyper-synchronization of neuronal electrical activity, thereby contributing to the occurrence of seizures. 40 In our study, we observed a significant reduction in exponent following VNS therapy. This reduction suggests a rebalancing of the excitation–inhibition ratio. Consequently, this shift is likely to contribute to a reduction in pathological hyper-synchronization. These findings are consistent with existing research on the relationship between EEG aperiodic components and neural spiking activity and support the potential of the exponent as a biomarker of therapeutic efficacy in VNS treatment.
VNS is hypothesized to exert its therapeutic effects by modulating neural circuits involved in the regulation of seizure activity. 41 The vagus nerve projects to several brain regions, including the nucleus tractus solitarius, which, in turn, projects to the thalamus, hypothalamus, amygdala, and various cortical regions. Through these projections, VNS can influence the excitability of cortical and subcortical networks, 42 potentially rebalancing the excitation–inhibition ratio within these circuits. Rodent studies have shown that VNS reduces the synchrony of epileptiform EEG activity and modulates cortical excitability. 43 In addition, VNS may exert its effects through other mechanisms, such as the modulation of GABAergic function and neuroinflammation. 5 These combined effects contribute to the overall efficacy of VNS in reducing seizure frequency and severity.
The type of epilepsy may influence the efficacy of VNS therapy. Previous studies have shown that VNS works better in generalized epilepsy compared to focal epilepsy. 44 In our study, both patients with generalized epilepsy exhibited a favorable response to VNS therapy, aligning with the existing research. VNS may be more effective in modulating widespread neural networks involved in generalized epilepsy. 45 The underlying etiology of epilepsy also appears to influence the response to VNS therapy. 46 The majority of patients with a structural etiology (six out of eight) demonstrated favorable outcomes, while two had unfavorable outcomes. Patients with a structural etiology may benefit more from VNS therapy, whereas those with an infectious or genetic etiology might not experience the same level of therapeutic benefit.
Previous studies on VNS have predominantly focused on EEG periodic changes.47,48 Our research, however, places greater emphasis on the importance of aperiodic components, within which oscillations are embedded. By focusing on these aperiodic components, our study provides a more comprehensive understanding of the neural changes induced by VNS. The reduction in the aperiodic exponent and offset observed in our study indicates a decrease in the synchronization of neuronal firing, which is typically associated with pathological hyper-synchronization in epileptic networks. The observed changes in both offset and exponent values among long-term responders indicate a stabilization of neuronal activity, which is crucial for the therapeutic effects of VNS. By utilizing offset and exponent values as biomarkers, our study provides a phenomenological explanation for the observed therapeutic effects of VNS. However, to fully elucidate the underlying mechanisms, further cellular-level experiments are necessary.
This study has several limitations. The relatively small cohort of patients analyzed may limit the generalizability of the results and introduce potential bias. In addition, the limited number of EEG channels may not fully capture the complexity of neural activity. The analysis confined to scalp EEG recordings, which are susceptible to artifacts, may not accurately reflect deeper brain activity. Future research should incorporate larger patient populations, high-density EEG configurations, and intracranial recordings to validate and extend these findings. These improvements would provide a more comprehensive understanding of the effects of VNS on neural activity and enhance its therapeutic application.
Conclusion
This study demonstrates that VNS exerts significant long-term effects on EEG aperiodic activity (offset and exponent) in patients with DRE. Specifically, patients who responded to VNS therapy exhibited significant reductions in both offset and exponent during long-term follow-up. These reductions were correlated with decreases in seizure frequency, indicating that offset and exponent may serve as reliable biomarkers for predicting therapeutic efficacy. By precisely quantifying and analyzing these EEG parameters, our research provides an objective method for evaluating VNS outcomes and explores the underlying mechanisms by which VNS modulates neural activity, particularly in controlling seizures. These findings offer valuable insights for optimizing stimulation parameters and therapeutic strategies, thereby enhancing the precision and effectiveness of clinical treatments.
Supplemental Material
sj-docx-1-tan-10.1177_17562864241279124 – Supplemental material for Long-term effects of vagus nerve stimulation on EEG aperiodic components in patients with drug-resistant epilepsy
Supplemental material, sj-docx-1-tan-10.1177_17562864241279124 for Long-term effects of vagus nerve stimulation on EEG aperiodic components in patients with drug-resistant epilepsy by Yujiao Yang, Jing Wang, Xiongfei Wang, Chongyang Tang, Jiahui Deng, Zhaofen Yan, Qinqin Deng, Dong Chen, Jian Zhou, Yuguang Guan, Mengyang Wang, Tianfu Li and Guoming Luan in Therapeutic Advances in Neurological Disorders
Footnotes
References
Supplementary Material
Please find the following supplemental material available below.
For Open Access articles published under a Creative Commons License, all supplemental material carries the same license as the article it is associated with.
For non-Open Access articles published, all supplemental material carries a non-exclusive license, and permission requests for re-use of supplemental material or any part of supplemental material shall be sent directly to the copyright owner as specified in the copyright notice associated with the article.