
Abstract
Background:
Drug-resistant epilepsy (DRE) patients exhibit aberrant large-scale brain networks. Perampanel may be a therapeutic option for controlling seizures in these patients.
Objective:
We aim to explore the differences of resting-state electroencephalogram (EEG) microstate in perampanel-responsive and non-responsive DRE patients.
Design:
Retrospective study.
Methods:
Clinical data were collected from DRE patients who received perampanel treatment at the Fujian Medical University Union Hospital from June 2020 to September 2021, with a minimum follow-up of 6 months. Patients were classified into three groups based on the extent of reduction in seizure frequency: non-responsive (seizure reduction <50%), responsive (seizure reduction >50% but not seizure-free), and seizure-free. Resting-state EEG data sets of all participants were subjected to EEG microstate analysis. The study comprehensively compared the mean duration, frequency per second, and temporal coverage of each microstate among the three groups.
Results:
A total of 76 perampanel-treated DRE patients were categorized into three groups based on their response to treatment: non-responsive (n = 20), responsive (n = 36), and seizure-free (n = 20), according to the degree of seizure frequency reduction. The results of EEG microstate analysis revealed no statistically significant distinctions in frequency, duration, and coverage of microstate D in these DRE patients. However, the seizure-free group showed significantly increased duration and coverage of microstate A, frequency and coverage of microstate B, and significantly decreased duration, frequency, and coverage of microstate C when compared with the other groups.
Conclusion:
Microstate A, B, and D is associated with the sensorimotor network, visual network, salience network, and attention network, respectively. This study demonstrates statistically significant differences in the sensorimotor, visual, and salience networks, but not in the attention network, between perampanel-responsive and non-responsive DRE patients.
Introduction
Epilepsy constitutes a prevalent and chronic neurological disorder, impacting more than 70 million individuals globally. 1 It is characterized by recurrent seizures, which manifest as paroxysmal, transient, repetitive, and stereotyped clinical events. Despite the availability of more than 30 antiseizure medications (ASMs), up to 30% of epilepsy patients exhibit poor responsiveness to these medications and develop drug-resistant epilepsy (DRE).2,3 According to the definition proposed by the International League Against Epilepsy (ILAE) Task Force in 2009, DRE is characterized by the persistent inability to attain enduring freedom from seizures, even when employing two or more distinct ASMs chosen independently, whether administered individually or in conjunction. Patients diagnosed with DRE are confronted with a significantly heightened jeopardy of premature mortality, debilitating functional impairments, psychosocial dysfunction, and diminished quality of life. 4
ASMs with novel mechanisms of action present a potential therapeutic option for controlling seizures in DRE patients. 5 Activation of α-amino-3-hydroxy-5-methyl-4-isoxazolepropionic acid (AMPA) receptors is deemed to exert a pivotal and decisive influence in the induction of seizure activity.6,7 Preclinical studies have demonstrated that AMPA receptor antagonists effectively suppress epileptiform activity in vitro, while blockade of N-methyl-D-aspartic acid (NMDA) receptors alone is insufficient to abolish epileptiform discharges. 5 Moreover, AMPA receptor activation is involved in seizure synchronization and promotes the transition from epileptiform discharges to seizures. 8 Therefore, blockade of AMPA receptors has the potential to suppress seizure activity. 9 In line with these findings, a drug targeting AMPA receptors, perampanel, has entered clinical trials. It received approval in Germany in 2012 for add-on therapy of seizures in adolescents and adults. 10 Subsequently, in September 2019, it was granted approval in China in 2019. 11 Perampanel primarily acts by binding non-competitively to postsynaptic AMPA receptors, selectively inhibiting synaptic AMPA receptors, thereby reducing glutamatergic neurotransmission. 6 As a result, it inhibits glutamate-induced excessive excitatory neurotransmission and exhibits antiepileptic effects. Several clinical randomized controlled trials, including multiple phase II and III studies, have demonstrated the therapeutic benefits of perampanel as an adjunct therapy for DRE, showing superiority over placebo, and displaying good safety and tolerability profiles at doses of 4, 8, and 12 mg/day.12–14 However, some DRE patients still fail to show improvement in seizure control after the addition of perampanel treatment, and may experience psychiatric adverse reactions. The previous studies indicate that the improvement of epilepsy is related to the restoration of brain connectivity. 15
Electroencephalography (EEG) has gained increasing attention due to its non-invasive and convenient nature, allowing for the capture of rapid dynamic changes in neuronal networks. 16 It serves as a valuable method in neuroscience research and holds significant clinical relevance in diagnosing epilepsy. EEG is employed to directly and dynamically assess electrical signals within cortical networks. 17 Thus, it has the capacity to capture useful information regarding brain activity. In the common scenario, EEG is visually reviewed and evaluated through characterization of time-based wave shape or frequency spectrum recorded by selected nodes during clinical usage, potentially missing out on a significant portion of information. With the advancements in brain imaging techniques and computational algorithms, it has become possible to obtain valuable insights based on multi-channel EEG data.
Among these methods, EEG microstate investigates the multi-channel scalp EEG recordings. 18 Researchers have found that the comprehensive neurological activity maintains moderate stability over continuous brief intervals, indicating ‘quasi-simultaneity of activity between large-scale network nodes’, which has been defined as EEG microstates. 19 These transient stable periods typically last for about 60–120 ms. Using multiple recording electrodes distributed across the scalp, EEG topographic maps can visualize brain activity’s spatial distribution. EEG microstates represent typical voltage topographies depicting the recurrent activation of brain connectivity during resting-state. Therefore, it not only partially addresses the limited spatial resolution of EEG but also examines the aberrant dynamics of the entire brain network. 20 Microstate analysis provides valuable information about the brain network, enabling further exploration of central nervous system activity during the resting state, which allows EEG to observe changes in brain networks. Microstates result from neuronal cluster activity, representing different brain functional states. These microstates are typically categorized as A, B, C, and D. 20 According to previous studies, microstates A, B, C, and D are considered as the sensorimotor, visual, salience, and attention network, respectively.21–23 Each microstate category has a different scalp electric field configuration: microstate A has a direction from left occipital to right frontal, microstate B has a direction from right occipital to left frontal, microstate C has a direction from occipital to frontal, and microstate D has a symmetrical fronto-central to occipital direction. 23 These four categories account for 60–90% of the variability in EEG data, displaying strong reliability. Microstate measures include duration, frequency, coverage, and microstate syntax. 21
Despite the widespread use of microstate analysis in studying brain function, there have been limited investigations utilizing EEG microstate analysis to explore DRE. To date, no reports have described the EEG microstate changes in epilepsy patients receiving perampanel treatment. Therefore, our aim is to identify predictive biomarkers of response to perampanel treatment by comparing the differences in EEG microstates between DRE patients who respond and those who do not respond to perampanel addition. The aim of this study is to offer clinical recommendations for future treatment by examining the potential of EEG microstates as predictive markers of response to perampanel treatment in DRE patients.
Materials and methods
Study participants
The objective of present project was to retrieve medical records of DRE patients who received adjunctive treatment with perampanel at the Fujian Medical University Union Hospital during the period from June 2020 to September 2021. The inclusion criteria were: (1) DRE patients who met the ILAE definition and received perampanel (PER) treatment. (2) Patients with complete seizure frequency data at the baseline stage for at least 6 months before PER treatment initiation. (3) Patients over the age of 14. (4) Patients with complete medical records. (5) Patients who were willing to follow-up. Exclusion criteria were: (1) Patients with irregular antiepileptic drug intake. (2) Individuals with profound liver/kidney impairment. (3) Patients with unclear medical records. (4) Patients who received epilepsy-related surgery, vagus nerve stimulation, or ketogenic diet during PER treatment. (5) Individuals with a follow-up time of shorter than 6 months.
Perampanel treatment protocol
In total, 76 patients diagnosed with DRE were considered eligible for inclusion in this study. The administration of perampanel followed a standardized regimen in accordance with the established practices of our epilepsy center. Patients were prescribed a once-daily dosage of perampanel to be taken before bedtime, commencing at an initial dose of 2 mg/day. Subsequently, systematically escalated by 2 mg/2–4 weeks, considering the patient’s individual response and tolerance to the medication. The maintenance dose was determined by considering guidelines, potential drug interactions, and the patient’s specific drug response. Physicians exercised their clinical judgment to make dose adjustments based on the patient’s clinical progress.
Data collection
The data was sourced from patients’ clinical records and encompassed a baseline evaluation, along with follow-up assessments conducted every 1–2 months subsequent to the administration of perampanel treatment. The baseline evaluation encompassed the collection of the following parameters: demographic characteristics (such as gender, age, body weight, and body mass index), clinical features [including seizure type, seizure frequency, video electroencephalogram (VEEG) findings, and epilepsy duration], classification of epilepsy type based on the origin of the epileptic focus in the brain (as determined by previous EEG, neuroimaging, and VEEG monitoring results), etiology, age of onset, medical history of generalized tonic-clonic seizures (GTCS), febrile seizures, previous neurological conditions, existence of psychiatric comorbidities, presence of cognitive impairment (prior to the commencement of perampanel treatment), number of ASMs, and baseline seizure frequency. Baseline seizure frequency referred to the frequency of seizures experienced during the 6-month period preceding the initiation of perampanel treatment.
Seizure frequency and response rates were assessed during each outpatient visit, typically occurring every 1–2 months, through clinical evaluations. Seizure frequency was evaluated based on reports provided by patients and their caregivers, as well as recorded data in the seizure diary maintained and updated during each clinical visit. Response to treatment was determined at the final visit by comparing the seizure frequency with the baseline measurement, whereby individuals exhibiting a 50% or more decrease in seizure frequency were classified as responders and those achieving freedom from seizure as seizure-free, while those with a reduction of less than 50% or no improvement were categorized as non-responders.
Comorbidities assessment
For assessing the cognitive status of the participants, the Montreal Cognitive Assessment (MoCA) and Mini-Mental State Examination (MMSE) were employed. Participants achieving MoCA scores ⩾26 and MMSE scores ⩾24 were categorized as cognitively normal, whereas those scoring ⩽25 on the MoCA or <24 on the MMSE were identified as having cognitive impairment. Additionally, anxiety and depression levels were evaluated utilizing the Self-rating Anxiety Scale (SAS) and Self-rating Depression Scale (SDS). In order to investigate the impact of anxiety and depression on the study outcomes, patients were stratified into two subgroups: those without symptoms of anxiety or depression (SAS <50 and SDS <53) and those exhibiting symptoms of anxiety or depression (SAS ⩾50 or SDS ⩾53).
VEEG analysis
The VEEG data underwent meticulous analysis, whereby the recordings or reports were utilized to classify the VEEG as one of the following categories: ‘normal EEG’, ‘abnormal background without epileptiform discharges’, or ‘epileptiform discharges’. All patients underwent interictal VEEG recordings prior to the initiation of perampanel treatment.
Brain MRI analysis
Magnetic resonance imaging (MRI) examinations were conducted for all patients to rule out the existence of structural irregularities. The MRI reports were thoroughly examined and categorized as either ‘Negative’ or ‘Positive’. The term ‘Positive’ denoted the identification of structural abnormalities in the MRI findings, such as cerebral arteriovenous malformation, aneurysms, brain malformation, encephalomalacia and gliosis, partial cerebral parenchyma, hyperintense hippocampi, and focal cortical dysplasia. Conversely, the term ‘Negative’ indicated MRI results that did not reveal any structural abnormalities.
Recording and preprocessing of resting-state EEG
Data were captured using a 32-channel dense EEG system with a bandpass filter of 0.1–70 Hz and a frequency of 500 samples per second was used for sampling. Subjects were in a relaxed seated position within a calm room and instructed to keep their eyes open. The EEG data for each participant were continuously recorded for a duration of 10 min. In order to mitigate potential interference from facial or neck muscles, the electrode count was decreased from 32 channels to 20 channels for subsequent analysis.
The complete raw EEG data was exported using the European Data Format. EEG data preprocessing was performed using EEGLAB 13.0.0b, an open-source toolbox implemented in MATLAB 2013b (The primary developers are based at the Swartz Center for Computational Neuroscience, University of California, San Diego (UCSD), USA. The main contributors to EEGLAB 13.0.0b include researchers like Arnaud Delorme and Scott Makeig). Firstly, the EEG were re-referenced using whole-brain average reference. The sampling rate was then downsampled to 250 Hz. Subsequently, the raw data from the 20 channels underwent bandpass filtering from 1 to 40 Hz and notch filtering at 48–52 Hz. The continuous EEG recordings were then divided into 2-s segments and visually inspected to remove segments with prominent muscle artifacts or poor EEG signal quality. Independent component analysis was employed to eliminate artifacts, such as those caused by eye movements. Remaining segments with residual artifacts were further visually examined and discarded. The artifact-free data, after additional bandpass filtering (Finite Impulse Response (FIR); 2–20 Hz), were used for subsequent microstate analysis.
Microstate analysis
Microstate analysis was performed adhering to the prescribed process as described previously. The EEG data were bandpass filtered (2–20 Hz), re-referenced to the mean measurement, and the orientation of topographic charts was disregarded. Subsequently, the global field power (GFP) was used to quantify the synchrony of activity across the electrodes at each time point. The GFP peak was used to identify stable topographical maps. Once the GFP reached its minimum peak, indicating a change in the underlying microstate, the topographical map switched to the next microstate. The topographical maps at GFP peaks were considered as discrete microstates, and the dynamic changes of EEG signals represented the transitions between these states. Initially, clustering analysis was conducted individually using mappings based on single templates, followed by a subsequent analysis at the collective level. At the same time, the global explained variance (GEV) was calculated using Cartool software (The Cartool software is primarily associated with the Swiss Center for Affective Sciences at the University of Geneva, Switzerland. Pierre Jolicoeur is one of the key contributors to the Cartool software). In order to enable comparability with prior research, the microstate maps were sorted into four distinct categories (A–D). The spatial correspondence and the topographical maps were computed to determine the best-fit backward projection of the topography of each GFP peak map to the microstate map. Four parameters were calculated for microstate A–D, encompassing duration, frequency, coverage, and probabilities of microstate transition.
Statistical analysis
IBM SPSS Statistics version 26 (The primary developers are based at the Swartz Center for Computational Neuroscience, University of California, San Diego (UCSD), USA. The main contributors to EEGLAB 13.0.0b include researchers like Arnaud Delorme and Scott Makeig) was utilized for performing the statistical analysis. For the comparison among the clinical characteristics of three groups, we use one-way analysis of variance or Kruskal–Wallis rank sum test (continuous variables) and Chi-square test or Fisher’s exact test (categorical variables). The Kruskal–Wallis rank-sum test was employed to assess the differences in GEV, microstate duration, frequency, coverage, and probabilities of microstate transition. Multiple comparisons were performed, and the significance levels were corrected using the Bonferroni adjustment to account for multiple tests. Statistical significance was considered when p values < 0.05.
Results
Demographics and clinical variables
In total, 76 individuals with DRE and treated with perampanel at our epilepsy center during the period from June 2020 to September 2021 were included in this study. Among the included patients, 36 patients (47.36%) were classified as responders, as they observed a decrease in the occurrence of seizures by 50% or greater. On the other hand, 20 patients (26.32%) were categorized as non-responders, as they encountered a decrease in the frequency of seizures of under 50% or no improvement. At the final follow-up, 20 patients (26.32%) achieved seizure-freedom. Table 1 provides an overview of the demographic traits and pertinent clinical information for the three groups. Other clinical factors had no statistic difference among three groups, except for older age of onset, etiology, and history of GTCS (p = 0.011, 0.023, 0.005, respectively) (Table 1).
The characteristics of investigated candidates (n = 76).

ASM, antiseizure medication; BMI, body mass index; GTCS, generalized tonic-clonic seizures; MRI, magnetic resonance imaging; TBI, traumatic brain injury; VEEG, video electroencephalogram.
Microstate analysis
In order to enable effective juxtaposition with earlier research, the microstate maps were classified into four distinct categories. Consequently, we designated these four microstate maps as A, B, C, and D, mirroring prior investigations, according to their respective topographical patterns. Figure 1 visually presents the microstate topographic classes observed within the non-responsive group, responsive group, and seizure-free group. On average, the templates explained 69.55 ± 10.167, 71.68 ± 5.583, 72.33 ± 8.360 of the GEV (fitting to maps at GFP local maxima) for three groups of patients (non-responsive, responsive, and seizure-free group), respectively (p = 0.972) (Table 2).
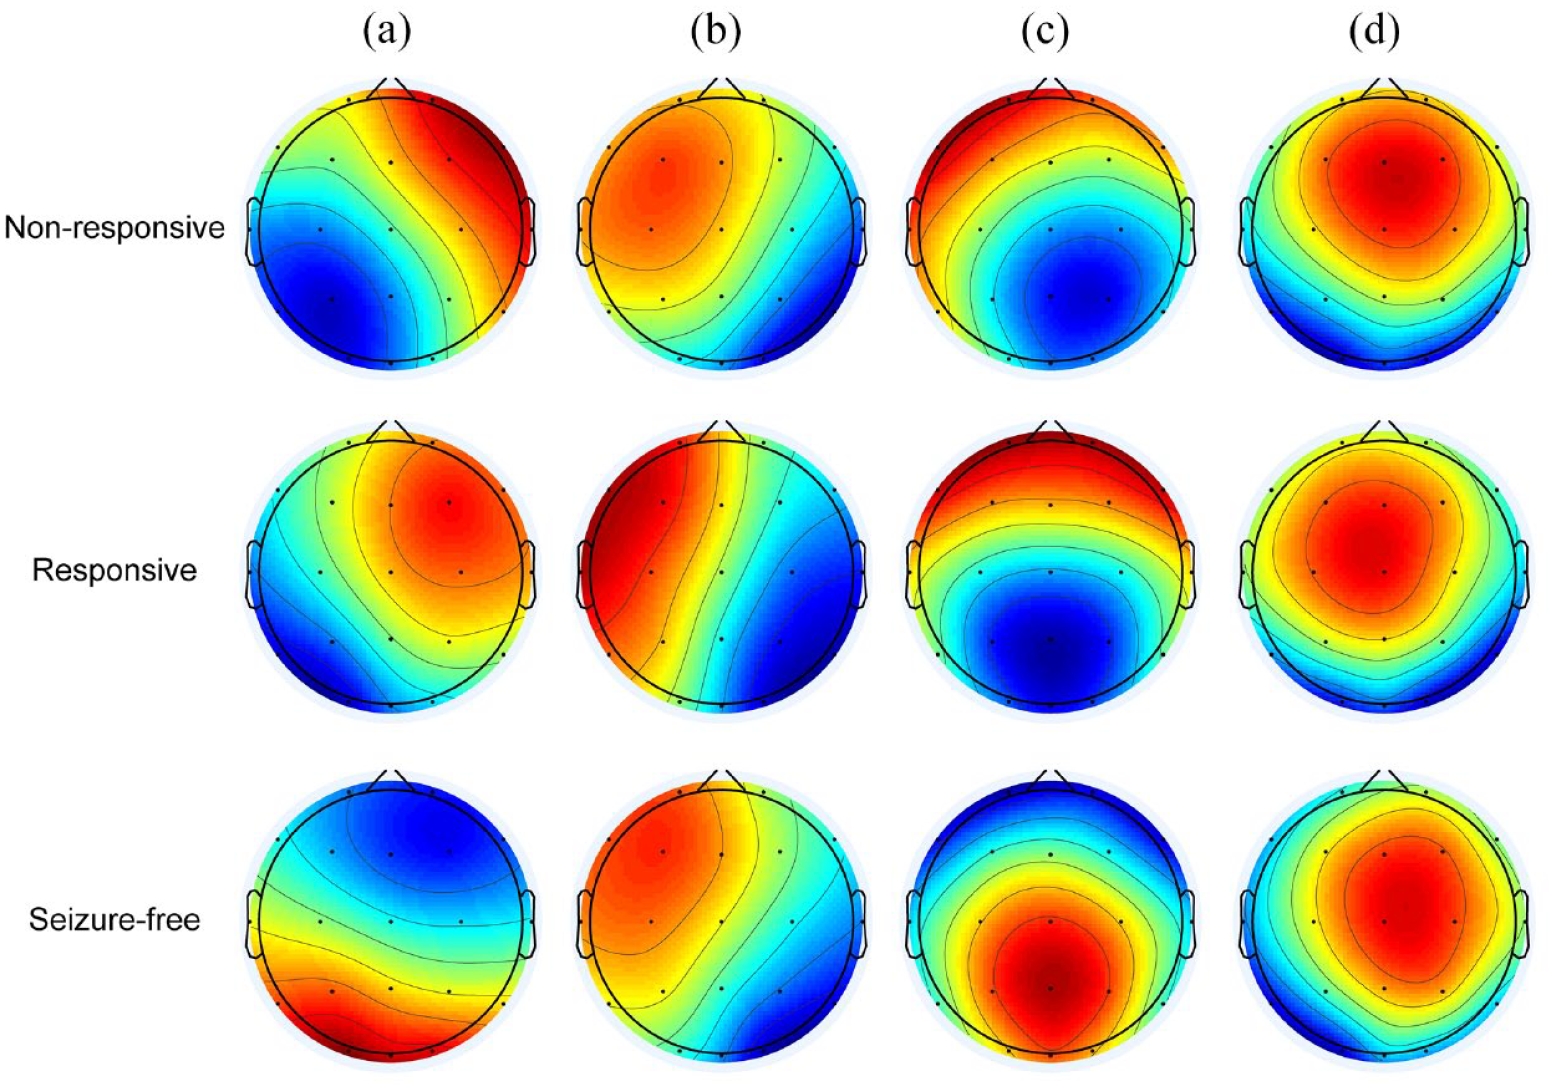
Microstate topographic maps.
EEG microstate features among the three sets.

EEG, electroencephalogram; GEV, global explained variance.
Duration of microstates
In the seizure-free group, the duration of microstate A exhibited a noteworthy extension in comparison to the nonresponsive group (p = 0.007). Conversely, the duration of microstate C in the seizure-free group displayed a marked reduction in contrast to the responsive group (p = 0.001) [Figure 2(a)].

Temporal features of microstates across the three groups. (a) The duration of microstate A–D. (b) The occurrences per second of microstate A–D. (c) The coverage of microstate A–D. The p values are outcomes of the Kruskal–Wallis H rank-sum test for inter-group comparison.
Occurrence of microstates
The frequency of microstate B per second within the seizure-free group demonstrated a statistically significant increase when compared to the responsive group (p = 0.001). Furthermore, in contrast to patients belonging to the nonresponsive and responsive groups, individuals within the seizure-free group exhibited a lower mean occurrence rate per second of microstate C (p = 0.001, p < 0.001, respectively) [Figure 2(b)].
Coverage of microstates
Regarding coverage, microstate A within the seizure-free group exhibited a statistically significant increase compared to the responsive group (p = 0.006). However, there was no notable distinction between the nonresponsive and seizure-free groups. For microstate B, the coverage within the seizure-free group was significantly greater than both the nonresponsive and responsive groups (p = 0.005, p < 0.001, respectively). Conversely, the coverage of microstate C within the seizure-free group demonstrated a substantial decrease in comparison to both the nonresponsive and responsive groups (p = 0.003, p < 0.001, respectively) [Figure 2(c)]. Comprehensive outcomes are presented in Table 2 and Figure 2. Tables 3 and 4 illustrate the directional changes of the microstate parameters from nonresponsive to responsive or seizure-free patients for all comparisons.
The statistics results of the microstate parameters between non-responsive and responsive or seizure-free group.

‘↑’ and ‘↓’ represent increase and decrease, respectively. ‘–’ represent no change when compared to non-responsive group.
Dur, duration; Fre, frequency; Cov, coverage.
The statistics results of the transition probabilities of microstates between non-responsive and responsive or seizure-free group.

‘↑’ and ‘↓’ represent increase and decrease, respectively. ‘–’ represent no change when compared to non-responsive group.
Microstate transition probabilities
The seizure-free cohort exhibited elevated relative transition probabilities from microstate A to microstate B in contrast to the non-responsive and responsive cohorts (p < 0.001, p < 0.001, respectively). Conversely, the transition from microstate A to microstate C demonstrated a heightened propensity within the non-responsive and responsive cohorts as opposed to the seizure-free group (p = 0.002, p = 0.001, respectively). Moreover, the instances of transitions from microstate A to microstate D were more prevalent in the non-responsive group when compared to the seizure-free group (p = 0.04) [Figure 3(a)].

Comparison of the EEG microstate transition probabilities among the three groups. Transition probabilities from microstates A to other microstates (a), B to other microstates (b), C to other microstates (c), and D to other microstates (d). The p values are outcomes of the Kruskal–Wallis H rank-sum test for inter-group comparison.
The seizure-free cohort exhibited increased relative transition probabilities from microstate B to microstate A in contrast to both the non-responsive and responsive cohorts (p < 0.001, p < 0.001, respectively). In a parallel manner, the transition probabilities from microstate B to microstate C were more pronounced within the seizure-free group compared to the non-responsive and responsive groups during their resting-state EEG recordings (p < 0.001, p = 0.032, respectively). Furthermore, the transition probability from microstate B to microstate D displayed a higher occurrence rate in the seizure-free group when compared to the responsive group (p = 0.001) [Figure 3(b)].
Furthermore, the likelihood of transition from microstate C to microstate B demonstrated an elevation within the seizure-free group when contrasted with the nonresponsive group (p = 0.009). Conversely, the transition probability from microstate C to microstate D exhibited a reduction in the seizure-free group as compared to both the non-responsive and responsive groups (p < 0.001, p < 0.001, respectively) [Figure 3(c)].
Additionally, the occurrence of the transition from microstate D to microstate A displayed a heightened propensity within the non-responsive and responsive groups when compared to the seizure-free group (p = 0.013, p = 0.003, respectively). Similarly, the probability of transition from microstate D to microstate B exhibited an elevation in the seizure-free group in contrast to the responsive group (p < 0.001). Conversely, the transfer probability from microstate D to microstate C demonstrated a decrease within the seizure-free group when juxtaposed with the non-responsive and responsive groups (p < 0.001, p < 0.001, respectively) [Figure 3(d)]. Detailed results are provided in Figure 4.

EEG microstate transition probabilities in the three groups. Transition probabilities from microstates A, B, C, D to other microstates in non-responsive group (a), responsive group (b), and seizure-free group (c).
Discussion
The present study investigated the dynamic changes of brain functional states in patients with DRE who received adjunctive perampanel treatment, including non-responders, responders, and those achieving seizure-freedom. We employed microstate analysis of EEG data to elucidate time-related properties of subsecond brain activity. Based on the existing literature, we identified four microstate classes. The main results of our research can be succinctly outlined in the following manner. Firstly, the average duration of microstates B and D, as well as the frequency and coverage of microstates A and D, exhibited resemblance across the three sets. Secondly, patients without seizures in the past 6 months exhibited longer average duration and greater coverage of microstate A than those with seizures; the frequency and coverage of microstate B were also higher in seizure-free group; and the average duration, frequency, and coverage of microstate C were smaller. Lastly, differences did not reach statistical significance in the average duration, frequency, and coverage of microstate D among the three groups. These results provide insight into the aberrant intrinsic brain activity of patients in the three groups.
In recent years, there have been numerous studies applying the analysis of brain EEG microstates in the diagnosis and treatment of epilepsy. Researchers have discovered distinct alterations in EEG microstates among different types of epilepsy patients.24,25 For instance, Jiang et al. 25 found that, compared to patients with non-seizure-related idiopathic generalized epilepsy, those who experienced seizures within the past 6 months exhibited significant changes in the parameters of EEG microstates, particularly in classes A and C, while parameters in classes B and D remained statistically unchanged. Our study similarly observed this phenomenon. In DRE patients receiving adjunctive perampanel therapy, those who remained seizure-free in the 6 months following treatment displayed a significant increase in the parameters of class A microstates and a significant decrease in class C, while parameters in class D remained unchanged. This suggests that the parameters of classes A and C may hold promise as prognostic indicators for epilepsy patients. However, in absence epilepsy patients, Liu et al. 24 found that the differences in EEG microstate parameters (A, B, C, and D) during seizure-free intervals did not reach statistical significance when compared to a healthy control group’s resting-state EEG. Subsequently, researchers employed EEG microstate analysis parameters in conjunction with machine learning algorithms to build various models for distinguishing between epilepsy and non-epilepsy cases,26,27 as well as identifying temporal lobe epilepsy (TLE) patients. 28 They also compared the differences in EEG microstates between TLE patients with and without comorbid depression. 29
Intriguingly, in 2022, Ricci et al. 30 employed EEG microstate analysis to determine the effectiveness of levetiracetam (LEV) treatment in a group of newly diagnosed TLE patients. They found that LEV led to a reduction in the average duration and occurrence rate of microstates B and D. Furthermore, LEV treatment increased the directional dominance of microstates A to C and B to D, suggesting that microstate analysis holds promise as a neurophysiological indicator for identifying the therapeutic activity of LEV. In conclusion, EEG microstate analysis offers a novel perspective for the diagnosis, treatment, and prognosis of epilepsy patients. Therefore, utilizing EEG microstate analysis parameters to identify treatment-responsive patients among those with refractory epilepsy who may benefit from adjunctive perampanel therapy appears to be a suitable approach.
The study on somatosensory evoked potentials high-frequency oscillations has reported the impact of the non-competitive AMPA receptor antagonist perampanel on thalamocortical excitability. 31 Quantitative EEG (qEEG) is a promising tool for assessing neurophysiological changes induced by antiepileptic drugs, as it can comprehensively describe the characteristics of brain electrical signals. 32 In recent years, several studies have reported the effects of perampanel on qEEG. Lanzone et al. 32 characterized qEEG alterations associated with the addition of perampanel to therapy. They observed an increase in theta power in patients with epilepsy following the introduction of perampanel, with no significant changes in EEG connectivity. A study from South Korea revealed a positive correlation between perampanel plasma concentration and qEEG changes in 17 epilepsy patients. 33 It indicated an increase in theta power in various brain regions and a decrease in alpha power after the administration of perampanel treatment. Moreover, a qEEG study demonstrated that perampanel increased fast activity in the cortical EEG of both pediatric and adult epilepsy patients. 34 However, to date, there have been no reports on the impact of perampanel on the EEG microstates of epilepsy patients. Our study compared the differences in EEG microstates between DRE patients who responded to the addition of perampanel and those who did not. This undoubtedly constitutes a valuable contribution to this research field. EEG microstate analysis holds promise as a tool for providing a comprehensive description of EEG signal characteristics for evaluating neurophysiological changes induced by antiepileptic medications.
Findings from prior investigations have shown that microstate class A is related to negative activation of temporal and temporo-central cortices and is considered to be related to the auditory or somatosensory–motor network.21,23 Class B microstate is associated with negative activation in the striatum, extrastriate cortex, and bilateral occipital cortices, and is considered to be related to the visual network.21,23 Microstate class C is primarily related to positive activation of the ventromedial prefrontal cortex, dorsomedial prefrontal cortex, and right insular cortex, and is considered to be related to the salience network. 21 Microstate class D has been found to exhibit negative activation of the right dorsoparietal and ventral regions of the frontoparietal network. 21 A previous study found reduced connectivity between somatosensory–motor regions in epilepsy patients, 35 while another research revealed increased synchrony within the somatosensory–motor network compared to controls. 36 In the present study, patients without seizures in the past 6 months exhibited longer average duration and greater coverage of microstate A than those with seizures, which provides new evidence supporting previous rs-fMRI (Resting-State Functional Magnetic Resonance Imaging) findings. Further direct evidence is needed to verify whether the somatosensory motor network of patients with epilepsy has changed. Meanwhile, this study demonstrated higher frequency and coverage of microstate class B in seizure-free patients. Aberrated brain activity of visual fields has been reported in epilepsy patients. At present, there is a growing acknowledgment of the central role played by unusual visual and auditory networks in epilepsy. 29 In addition, our study found that patients without seizures in the past 6 months had shorter average duration, lower frequency, smaller coverage of microstate C compared to those with seizures. Previous studies have explored the dorsal attention network (DAN) in patients with mesial TLE (MTLE). Compared to HC (Healthy Controls), patients with MTLE show lower brain activity in the DAN. 37 In this current research, there were no notable variations observed within the three patient groups, suggesting that alterations in the attentional network might not occur in these individuals.
Recognizing specific constraints of this study is crucial. Initially, the sample size was relatively limited, potentially introducing sampling bias and constraining the applicability of the results. Then, this investigation failed to take into consideration the potential influence of other antiepileptic drugs on the brain’s microstate activity. Future studies should aim to include larger and more diverse cohorts, while considering various potential confounding factors that may impact the microstate analysis.
Conclusion
In summary, our research analyzed the variances of EEG microstate dynamics between DRE patients who remained seizure-free within 6 months after adjunctive perampanel treatment and patients who continued to experience seizures. The findings from present research demonstrate statistical differences in sensorimotor network, visual network, and salience network among these three groups. These observations propose that perampanel treatment could bring about important variations in the functional connectivity within these networks.