
Abstract
Objective
Entropy-based approaches to understanding the temporal dynamics of complexity have revealed novel insights into various brain activities. Herein, electroencephalogram complexity before migraine attacks was examined using an inherent fuzzy entropy approach, allowing the development of an electroencephalogram-based classification model to recognize the difference between interictal and preictal phases.
Methods
Forty patients with migraine without aura and 40 age-matched normal control subjects were recruited, and the resting-state electroencephalogram signals of their prefrontal and occipital areas were prospectively collected. The migraine phases were defined based on the headache diary, and the preictal phase was defined as within 72 hours before a migraine attack.
Results
The electroencephalogram complexity of patients in the preictal phase, which resembled that of normal control subjects, was significantly higher than that of patients in the interictal phase in the prefrontal area (FDR-adjusted p < 0.05) but not in the occipital area. The measurement of test-retest reliability (n = 8) using the intra-class correlation coefficient was good with r1 = 0.73 (p = 0.01). Furthermore, the classification model, support vector machine, showed the highest accuracy (76 ± 4%) for classifying interictal and preictal phases using the prefrontal electroencephalogram complexity.
Conclusion
Entropy-based analytical methods identified enhancement or “normalization” of frontal electroencephalogram complexity during the preictal phase compared with the interictal phase. This classification model, using this complexity feature, may have the potential to provide a preictal alert to migraine without aura patients.
Introduction
Migraine is a common neurological disorder with a complex pathophysiology characterized by recurrent headaches. It is generally believed that the mechanisms of the primary brain dysfunctions leading to the onset of a migraine attack may depend on the activation and sensitization of the trigeminovascular pain pathway (1,2). This cyclic disorder can be split into four phases (interictal, preictal, ictal, and postictal) with different clinical symptoms resulting from the temporal dysfunction of neural dynamics. Approximately 13–31% of migraine patients experience transient neurological symptoms prior to the ictal phase (3,4); visual aura is the most frequently reported symptom. In other words, the majority of migraine patients face imminent headache attacks without aura (i.e. migraine without aura (MO)). As MO patients suffer from headaches without any notice, the beginning of the preictal phase is the preferred time to alert patients to an imminent attack (5). Therefore, the effective evaluation of changes in neurophysiologic signals is crucial for identifying a pre-alert sign before migraine attacks.
Neurophysiological patterns of migraine phases have been discovered with various neuroimaging tools, including fMRI, PET, MEG, and EEG (6–8). In contrast with high spatial resolution, the EEG-recorded electrical activity of the cerebral cortex, using extracranial electrodes, provides a high temporal resolution that enables the examination of brain dynamics on the millisecond scale. Previous EEG studies of migraine patients revealed prefrontal dysfunction with ineffective inhibitory capabilities (9), reduced P3a amplitude during the migraine-free period (10), and an occipital “normalization” pattern (similar to controls) occurring a few hours before migraine attacks (5,11–13). Nevertheless, most studies have been based on a cross-sectional design, and intra-individual differences have not been described. For instance, cyclic patterns of EEG power and coherence were found in a cross-sectional study (5) but have not yet been replicated on an individual basis. Longitudinal studies of migraine patients are advised to elucidate the changes in neurophysiological patterns in different migraine phases.
In terms of characterizing complex temporal dynamics, entropy approaches have revealed novel insights into a wide range of physiological systems (14). Generally, entropy is an objective measure of the complexity of physiological signals, and represents the robustness of the system involved. Different entropy analysis approaches, such as approximate entropy (15), sample entropy (16), and fuzzy entropy (17), have been developed. Diseased systems usually show reduced entropy values compared to those of healthy systems, such as decreased entropy of heart rate variability in patients with heart failure (18), and decreased EEG entropy in patients with dementia (19). However, the control of a specific physiological system may involve multiple factors at different time scales. Thus, for some disease entities (e.g. atrial fibrillation), it may present a higher entropy value in the original time scale, followed by a decreased entropy value after adjusting the time scale by averaging (18). This approach, named multi-scale entropy, has gained wide use nowadays to study the full spectrum of the timely-variated complexity of a physiological system (20).
Recently, we (21) introduced a multi-scale inherent fuzzy entropy algorithm that has the robustness to noise and signals with non-linearity and non-stationarity and is capable of operating EEG signals across a range of temporal scales. However, to the best of our knowledge, few studies have investigated brain complexity in migraine patients. Therefore, a comprehensive entropy analysis of cyclic migraine patterns may provide a scientifically worthwhile understanding of the complex temporal dynamics of migraine.
Previous studies have indicated frontal and occipital lobe dysfunction in migraine patients, showing abnormal frontal executive network (22) and pain inhibition control abnormality in the prefrontal region (23) compared with healthy controls. A recent PET study (24) also noted that frontal activation strengthened during the premonitory phase in migraine patients. In terms of the occipital area, hyper- or hypoexcitability was observed with EEG for migraine patients during visual stimulus tasks, showing a lack of habituation during the interictal phase (25) and normalization in the preictal phase (12). Taken together, these abnormalities in the frontal and occipital regions suggest that changes in brain complexity could be observed as migraine phases are developing.
To capture this phase transition and address the above-mentioned issues, this study aimed to compare the resting-state EEG complexity of the frontal and occipital regions between the interictal and preictal phases decomposed by multi-scale inherent fuzzy entropy analysis. A longitudinal experiment with multiple EEG examinations was conducted in MO patients and healthy controls (HC). Furthermore, the performance of classification models using resting-state EEG complexity to differentiate the preictal phase from the interictal phase was evaluated.
Materials and methods
Participants
Outpatients with MO were recruited from the Headache Clinic of Taipei Veterans General Hospital and were asked to keep a headache diary to determine migraine phases on a daily basis. All the enrolled patients fulfilled the diagnostic criteria of the International Classification of Headache Disorders second edition (ICHD-II) (26) and had a migraine frequency ranging from one to six days per month. Age- and sex-matched healthy controls (HCs) were recruited from among hospital colleagues and their relatives or friends. The individuals who served as HCs did not have a past medical history or a family history of migraine. However, low-frequency tension-type headache (<1 per month) was allowed. Each patient was required to complete a structured questionnaire on demographics, headache profile, medical history, and medication use at the first examination. The headache profile included the duration of migraine history (years), onset age of migraine, headache frequency (days per month), and Migraine Disability Assessment (MIDAS). In addition, the Beck Depression Inventory (BDI), and Hospital Anxiety Depression Scale – Anxiety (HADS-A) and Depression (HADS-D) were administered to screen for psychological disturbances.
The days on which the EEG examinations were performed were classified into one of four migraine phases (interictal, preictal, ictal, or postictal) based on the headache diary. As shown in Figure 1(a), the ictal phase was coded when the patient was suffering from a migraine attack on the day of EEG study. As per the criteria (27,28), the preictal and postictal phases were coded on the day of EEG study when the patient was within 72 hours before or after an ictal phase, respectively. The interictal phase was coded if the patient had not had a migraine attack within 72 hours before or after the EEG examination. Only EEG data collected during the interictal and preictal phases were selected for analysis in this study.
Experimental procedure. (a) Definition of migraine phases. (b) Five resting-state EEG tests were conducted over 3–7 months. Each test was classified as a migraine phase according to the patient's migraine diary. The interval between consecutive tests was 2–8 weeks. (c) Each resting-state EEG test consisted of three blocks with eyes closed and two blocks with eyes open. The eyes-closed and eyes-open blocks were performed alternately, and each block of the recording lasted one minute.
All the participants had normal vision and no systemic diseases, connective tissue disorders, neurological or psychiatric disorders, or other painful conditions according to their self-reports. None of them received preventive treatment, and they were asked not to take any analgesics within two days before the EEG recording. The Institutional Review Board of the Taipei Veterans General Hospital approved this study. Informed consent was obtained from all participants before they entered in this study.
Experimental paradigm
This experiment was performed in a static and lightless room at Taipei Veterans General Hospital. The fluorescent lamps were turned off throughout the EEG recording to avoid light source interference. As shown in Figure 1(b), each patient and healthy control participated in identical resting-state EEG examinations five times (exam 1–5) over 3–7 months, and each examination was separated by an interval of 2–8 weeks. This protocol aimed to examine the EEG data for patients who were experiencing different migraine phases, particularly the interictal and preictal phases. EEGs performed during ictal and postictal phases are not reported in this article. Each examination consisted of five epochs, namely, three 1-min epochs with the patient's eyes closed and two 1-min epochs with the patient's eyes open (Figure 1(c)).
EEG recording and pre-processing
As shown in Figure 2(a), EEG signals were recorded using Mindo-4S (Hsinchu, Taiwan) (29), a wireless and wearable EEG device featuring four dry electrodes and a miniature amplifier attached to a lightweight bandage. These dry electrodes are more convenient than conventional wet electrodes for measuring EEG signals, and are preferred because they avoid the use of conductive gel and skin preparation while achieving a signal quality comparable to that of wet electrodes. The EEG signals were recorded at Fpz, O1, Oz, and O2 sites at a sampling rate of 500 Hz. The electrodes were placed according to the extended International 10-20 system, and two extra channels, A1 and A2, were used as the reference channels.
Data preprocessing, processing, and analysis. (a) Wearable and wireless EEG device (Mindo-4S) (29). The EEG signals of the prefrontal (Fpz) and occipital regions (O1, Oz, and O2) were recorded using foam-based and spring-loaded sensors, respectively. (b) EEG data pre-processing including artifact removal, down-sampling, and filtering; (c) EEG complexity estimation using EMD, tread filtering, data reconstruction, coarse-graining, and inherent fuzzy entropy; (d) Binary classification.
An experienced EEG specialist monitored the experiment to ensure that the location of the wearable EEG device did not shift throughout the recording. Artifacts such as eye movements, blinks, muscle activities, or other artifacts were visually identified and excluded. All EEG data were analyzed using EEGLAB (30), an open-source Matlab toolbox supporting electrophysiological signal processing, artifact signal rejection, time/frequency analysis, and visualization. The analytical procedure for EEG signal pre-processing is demonstrated in Figure 2(b). The eye-closed epochs of resting state EEG were used for data analysis. The raw EEG signals were down-sampled to 250 Hz and then filtered through 1 Hz high-pass and 30 Hz low-pass finite impulse response filters. Finally, the filtered EEG signals were inspected again using Automatic Continuous Rejection (EEGLAB's plugin function) to remove noisy signals. On average, 11.6 ± 4.8 sec data between consecutive blocks was removed in this study. For a 1-min (15,000 points) block, 97.1 ± 2.6% ((14,563 ± 392) points/15,000 points) of data were kept after artefact rejection.
EEG complexity estimation using entropy analysis
To capture EEG complexity under the circumstances of non-stationarity and non-linearity (31), this study applied multi-scale inherent fuzzy entropy analysis (21), which employs empirical mode decomposition (EMD) and fuzzy membership function to improve the estimation (Figure 2(c)). Given a time series EEG signal, the coarse-graining process was applied to non-overlapping segmented EEG data of length τ following EMD (32) to obtain intrinsic mode function (IMF) components at scale τ. The signals were reconstructed using the IMF components of interest, which were selected automatically by a trend-filtering algorithm (33). Then, the fuzzy entropy of each coarse-grained time series was calculated for different temporal scales from 1 to 20. Of note, the result of each scale τ was obtained by averaging entropy estimates of three 1-min closed-eyes blocks. The entropy estimates for each patient were averaged over the same migraine phase, and the entropy estimates of each HC were averaged over the examinations.
Classification model
A binary classification model was built to discriminate between phases (Figure 2(d)). This study employed five commonly-used algorithms: linear discriminant analysis (LDA), k-nearest neighbors classifier (kNN), multilayer perceptron (MLP), Bayesian classifier, and support vector machine (SVM) with linear or radial basis function (RBF) kernel (34). These classification algorithms were all implemented using PRTools (35) or LIBSVM (36).
The performance of the five algorithms was validated and compared via a k-fold cross-validation procedure. The k-fold cross-validation is a commonly-used technique to evaluate the performance of a predictive model. All the data are randomly partitioned into k approximately equal-sized clusters. Of the k clusters, a single cluster is retained as the validation data to test the model, and the remaining k-1 clusters are put together and used as the training data. The cross-validation process is repeated k times. The resulting outputs of the validation data are compared with the original class label to produce the performance metrics. In this study, the k was set to three. The original sample (40 patients) was randomly partitioned into three equal sized subsamples. Of the three subsamples, a single subsample (∼13 patients) was retained as the validation data for testing the model, and the remaining two subsamples (∼27 patients) were used as training data.
The performance metrics covered classification accuracy, recall, precision, and F-measure (37). Specifically, accuracy is the most intuitive performance measure, and it is simply a ratio of correctly-predicted observations to the total observations. Recall (sensitivity) is the ratio of correctly-predicted positive observations to all the observations in the actual class. Precision is the ratio of correctly-predicted positive observations to the total predicted positive observations. F-measure is the weighted average of precision and recall, which takes both false positives and false negatives into account.
Statistical analysis
The demographic and clinical characteristics of the two groups (patients vs. HCs), that is, categorical variable (gender) and continuous variables (age, BDI, HADS-A, and HADS-D), were compared by using the chi-square test and independent t-test, respectively. The paired and unpaired t-test was performed for each entropy scale to compare the EEG complexity between two phases and between two groups, respectively. The false discovery rate (FDR) correction was used to control for multiple comparisons. The intra-class correlation was estimated to quantify a test-retest reliability. To compare the performance of the classification algorithms, one-way ANOVA was used, followed by Tukey's post hoc test to test all pairwise comparisons. All the statistical tests were two-tailed. The significance level was set at p < 0.05.
Results
Demographic and clinical characteristics analysis
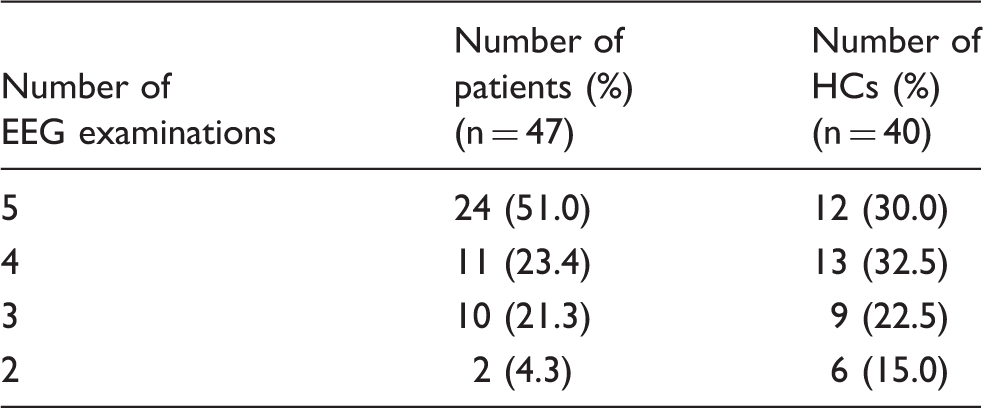
A total of 47 patients with MO were recruited for the study. Based on the headache diary, seven patients were excluded from the analyses due to the lack of an EEG examination within 72 hours before a migraine attack. The remaining 40 patients consisted of 10 males and 30 females aged 38.1 ± 8.2 years; eight patients had at least two examinations during the preictal phase. In terms of the HC group, 40 volunteers were recruited, consisting of eight males and 32 females aged 36.1 ± 9.8 years.
All patients were instructed to keep their headache diary throughout the study period, and 26 out of 40 (65%) of them followed this instruction. The others (14 out of 40 (35%)) did not complete the diary on a daily basis, but kept the diary around the measurements at least one week before and after each scheduled EEG examination, providing sufficient information to determine the migraine phases on the examination day.
Numbers of EEG examinations of the participants.
Participant demographics, headache profile and psychological characteristics.

0–270 range.
Abbreviations: HCs: healthy controls; F:M: ratio of females to males; MIDAS: Migraine Disability Assessment Scale; BDI: Beck Depression Inventory; HADS-A: Hospital Anxiety Depression Scale, Anxiety; HADS-D: Hospital Anxiety Depression Scale: Depression; n/a: not applicable.
Note: Group differences in clinical profiles were analyzed using independent t-test for continuous variables and the chi-square test for categorical variables. Bold formatting is to emphasize significant p values.
Comparison of EEG entropy between the interictal and preictal phases
The entropy at the Fpz site measured with multi-scale inherent fuzzy entropy over different time scales from 1 to 20 in patients in the interictal and preictal phases is shown in Figure 3 and Table 3. Both phases showed a monotonic increase in entropy with an increasing scale. The difference in entropy between the two phases also increased with an increasing scale. The paired t-tests revealed a significant increase in EEG entropy in the preictal phase compared with the interictal phase (FDR-adjusted p < 0.05; Figure 3(a) and Table 3). The results of the entropy analysis at the O1, Oz, and O2 sites did not show a significant difference between the two migraine phases.
EEG entropy of the Fpz channel for interictal and preictal phases. (a) Comparison of EEG entropy between interictal and preictal phases over the time scales (τ) from 1 to 20. The blue and yellow traces represent the mean ± standard deviation (SD) of the EEG entropy of the interictal and preictal phases, respectively. The black trace represents the mean ± SD of the difference of EEG entropy between two phases. The black asterisk denotes a significantly increased EEG entropy observed in the preictal phase compared with the interictal phase (FDR-adjusted p-value < 0.01). (b) Individual changes in the EEG entropy at τ = 20 from interictal to preictal phases. The green and red lines represent the increased and decreased entropy, respectively, when changing from the interictal phase to the preictal phase. (c) Test-retest reliability analysis. The scatter plot reveals the relationship between the first and second preictal phases, where each square represents the entropy of the first preictal phase (x axis) and the second preictal phase (y axis) relative to the entropy of the interictal phase. EEG entropy (mean (standard deviation)) of the Fpz channel for interictal phase vs. preictal phase vs. healthy controls. Interictal: the patients in interictal phase. Preictal: the patients in preictal phase. HC: the group of healthy controls. The FDR-adjusted p value between interictal and preictal phases. The FDR-adjusted p value between interictal phase and HC. The FDR-adjusted p value between preictal phase and HC.

As shown in Figure 3(b), the transition of EEG entropy in individuals was depicted from the interictal to preictal phase. Given the scale at
As shown in Figure 3(c), eight patients with two preictal examinations were selected for the test-retest reliability. According to the quoted guidelines for interpretation of inter-rater agreement measures (38), our result showed a good reliability with an intra-class correlation coefficient r1 = 0.73 (p = 0.01).
Comparison of EEG entropy between HCs and patients
Compared with the HCs, the entropy of the interictal phase was significantly lower in all time scales (FDR-adjusted p < 0.05; Figure 4(a) and Table 3). Nevertheless, the entropy of the preictal phase was similar to that of the HCs in each time scale (Figure 4(b) and Table 3). At the occipital channels, there were no significant differences in entropy between HCs and patients who were experiencing interictal or preictal phases.
EEG entropy of the Fpz channel of interictal and pre-ictal phases vs. HCs. (a) Comparison of EEG entropy between the interictal phase and HCs over the time scales () from 1 to 20. The blue and green traces represent the mean ± standard deviation (SD) of the EEG entropy of the interictal phase and the HCs, respectively. The black trace represents the mean ± SD of the difference of EEG entropy between two groups. The black asterisk denotes significantly decreased EEG entropy observed in the interictal phase compared with the HCs (FDR-adjusted p-value < 0.01). (b) Comparison of EEG entropy between the preictal phase and the HCs over the time scales (τ) from 1 to 20. The yellow and green traces represent the mean ± SD of the EEG entropy of the preictal phase and the HCs, respectively. There was no significant difference in EEG entropy between two groups.
Additionally, we used the intra-class correlation to assess test-retest reliability of EEG entropy in the group of interictal patients as well as healthy controls. The first two EEG examinations were used to measure test-retest reliability in the interictal period as well as the healthy controls. The results showed good test-retest reliabilities with intra-class correlation coefficient r1 = 0.78 (p = 0.01) in 12 patients with multiple (i.e ≥ 2) interictal phases and r1 = 0.87 (p = 0.001) in 40 healthy controls, indicating averaging EEG entropy of different examinations is feasible.
Performance of classifiers
Performance of various learning models for classifying migraine phases.

Parameters: LDA: default settings; KNN: k = 3; MLP: structure with one hidden layer and number of units = 5; Bayesian: default settings; SVM with linear kernel: c = 0; SVM with RBF kernel: c = 10, g = 10.
p value: After utilizing one-way ANOVA, Tukey's post-hoc test was performed for pair comparison (RBF-SVM classifier vs. other classifiers).
significant level: p < 0.05. Bold formatting is to emphasize significant p values.
Discussion
Despite the progress in migraine research in recent years, the challenge of extracting a reliable clinical feature that can be used to differentiate migraine phases persists, and clinical detections that can warn patients of an imminent headache attack remain difficult. To the best of our knowledge, our study presents a pioneering discovery that resulted from investigating the brain complexity in migraine patients by applying a multi-scale inherent fuzzy entropy algorithm to the resting-state EEGs during the interictal and preictal phases. The main finding of this study revealed significantly increased EEG entropy of the Fpz site in migraine patients when entering the preictal phase from the interictal phase. This augmented EEG entropy observed during the preictal phase reached a level comparable with the entropy observed in HCs. Additionally, using the EEG entropy of the Fpz site to build a binary classifier achieved promising accuracy for classifying migraine phases.
Prefrontal EEG complexity in migraine patients
This study revealed that the resting-state EEG complexity over the prefrontal region, measured using entropy, was altered in patients with MO even during their interictal phase. This cyclic alteration in EEG complexity was identified in the Fpz electrode. Since decreased complexity may represent reduced robustness of the system, our finding may thus reflect a structural or functional abnormality of the underlying cortex, as previous studies on patient with MO have demonstrated both structural (39), and functional (22) abnormality in the frontal/prefrontal regions. Nevertheless, given that our study also demonstrated a dynamic change of EEG complexity during headache phase transition, such alteration in complexity could likely be generated by functional abnormality. A recent study demonstrating normalization of EEG complexity after treatment in schizophrenic patients also supports this point (14).
Cortical function can be evaluated by different methodologies, such as the activation pattern in a task-specific fMRI paradigm, and the analysis of the functional connectivity network (FCN) in a resting fMRI setting. As shown in previous studies, prefrontal dysfunction in patients with MO could be observed as less activation in response to painful stimuli (23), or even an opposite response pattern in the prefrontal cortex during repeated painful stimulation over the trigeminal nerve area (40). Both studies suggest the pain inhibition control, which is an important function of the prefrontal cortex, is impaired in patients with migraine. Additionally, FCN analysis also demonstrated an impaired frontal functional network in patients with MO during their interictal phase (22). All these findings, together with the present results, suggest that the prefrontal cortex may serve as a pivot to regulate pain coping, and may be involved in the phase transition in migraine patients.
Nevertheless, we did not observe the difference in complexity between HC and interictal migraine patients over the occipital region. The strong alpha activity during eyes-closed periods may have interfered with the complexity measurement, leading to such results. Prior studies have shown that a visual stimulus task (25,28) might be preferable for deciphering how the occipital region handles visual functions in migraine patients during different phases.
EEG complexity normalization in the preictal phase
The other interesting finding of our study is that although patients with MO presented with a decreased prefrontal complexity during their interictal phase, the complexity increased during their preictal phase, and up to a level comparable to that of HCs. EEG complexity capturing migraine phase transition provided an opportunity for us to develop a classifier to recognize the phase in which the patient was situated. Although not completely understood, the mechanism behind this “preictal normalization” of various electrophysiological properties, for example resting-state EEG power and coherence, visual and auditory evoked response (5,11–13), may be related to increased serotonin synthesis (41), or the reorganization of inhibitory/excitatory control of brain homeostasis (42) during the preictal phase. There have only been a few studies addressing the issue of preictal functional change in patients with migraine, mainly owing to the difficulty in recruiting patients during this period. A recent PET study observing the activation pattern during the premonitory phase by nitroglycerin induction may provide some clues (24). In that study, increased frontal activity was found in the premonitory phase, compared to that in the interictal phase. The result supports our finding, as an increased complexity may represent an enhanced system function. Taken together, brain activity normalization may be a signature that can be used to predict, at least in some MO patients, forthcoming migraine attacks.
EEG-based migraine phase classification
With the rapid development of bio-sensing technology (43–45), a wireless and wearable EEG device featuring dry electrodes and miniature circuits can immeasurably benefit the recording of neurophysiological signals. The present study used an EEG recording systems with dry electrodes, Mindo-4S (Hsinchu, Taiwan) (29), to capture brainwave activity in a way that was convenient and comfortable for the participants. Additionally, we used an effective complexity measurement, multi-scale inherent fuzzy entropy (21) to evaluate the cyclic patterns of the migraine phases. As the study population comprised migraine patients who did not experience auras symptoms during the preictal phase, the characteristics of the easily-assessed brain region, the wearable EEG solution, and the low computational complexity algorithm make prefrontal EEG complexity a feasible signature of an imminent migraine attack for clinical use.
Limitations
This study has limitations. First, the number of data used to perform the test-retest reliability analysis was small. Although 47 migraine patients were recruited, only eight had at least two preictal EEG recordings. If possible, the result needs to be confirmed with a larger number of patients. Second, the placement of the EEG electrodes (Fpz, O1, Oz, and O2 sites) was limited by the design of the headband. Although previous studies have demonstrated functional abnormality in the frontal/prefrontal region in patients with migraine, these locations may not be as exact as our target, that is, Fpz. However, owing to the limitation of the equipment, we were only able to apply a single extra-occipital channel. Fpz was chosen due to its midline property, which might contain information from both cerebral hemispheres, and thus was less biased to either side. Nevertheless, mining whole-brain activity, especially for the coupling between distinct brain areas in migraine patients, would be preferable to fill in the knowledge gap. Further studies using equipment with multiple channels will be of help on this issue. Third, the current study focused on deciphering the EEG patterns that could be used to warn the patients of an imminent migraine attack. The migraine phases of interest were only the interictal and preictal states. A larger and longer longitudinal study covering multiple interictal, preictal, ictal, and postictal phases is recommended to obtain a comprehensive, full-spectrum understanding of the phase transition. Last, but not least, migraine is a complex disorder, and multiple intrinsic and extrinsic factors may contribute to the development of the disease, and the transition between migraine phases. Our approach might address more on the intrinsic property of the patients but not the extrinsic factors (e.g. weather change, pressure from work/family, and so on), which might induce a headache attack in a shorter period of time. In addition, individual variation in the presentations of EEG should be considered. Also, only resting-state EEG signals from one single channel were used for classification, which might not provide sufficient power to yield a prediction rate > 80%. Incorporation of information on extrinsic factors, as well as acquiring multi-channel EEG data in future studies, may help to overcome these obstacles and yield a higher prediction rate.
Conclusions
This study, which spanned 3–7 months, longitudinally collected resting-state EEG data from MO patients to investigate the complexity of their brain activity. Our results highlighted the feasibility of the entropy measurement used in EEG analysis to compare brain complexity between migraine phases with a good test-retest reliability. The result showed that the prefrontal EEG complexity of the migraine patients increased to a level comparable with that of healthy participants within hours before a forthcoming headache attack. The binary classification built using prefrontal EEG complexity patterns achieved sound accuracy for classifying interictal and preictal phases. The findings conclude that the brain signature of migraine patients discovered using entropy measurement provides insights into the brain complexity of these patients.
Footnotes
Article highlights
Entropy-based analytical methods identified enhancement or “normalization” of frontal EEG complexity with a good test-retest reliability during the preictal phase compared with the interictal phase.
The classification model using this complexity feature may have the potential to provide a preictal alert to MO patients.
Acknowledgments
This work was supported in part by the Computational Intelligence and Brain Computer Interface (CI-BCI) Lab, Center for Artificial Intelligence, University of Technology Sydney, Australia; the VGHUST Joint Research Program, Tsou's Foundation, Taiwan, under Contract VGHUST106-G7-4-3; and the Army Research Laboratory, and was accomplished under Cooperative Agreement Number W911NF-10-2-0022.