
Abstract
The differentiation of human monocytes into macrophages is influenced by environmental signals. Here we asked in how far nicotinamide (NAM), a vitamin B3 derivative known to play a major role in nicotinamide adenine dinucleotide (NAD)-mediated signaling events, is able to modulate monocyte differentiation into macrophages developed in the presence of granulocyte macrophage colony-stimulating factor (GM-MØ) or macrophage colony-stimulating factor (M-MØ). We found that GM-MØ undergo biochemical, morphological and functional modifications in response to NAM, whereas M-MØ were hardly affected. GM-MØ exposed to NAM acquired an M-MØ-like structure while the LPS-induced production of pro-inflammatory cytokines and COX-derived eicosanoids were down-regulated. In contrast, NAM had no effect on the production of IL-10 or the cytochrome P450-derived eicosanoids. Administration of NAM enhanced intracellular NAD concentrations; however, it did not prevent the LPS-mediated drain on NAD pools. In search of intracellular molecular targets of NAM known to be involved in LPS-induced cytokine and eicosanoid synthesis, we found NF-κB activity to be diminished. In conclusion, our data show that vitamin B3, when present during the differentiation of monocytes into GM-MØ, interferes with biochemical pathways resulting in strongly reduced pro-inflammatory features.
Introduction
Nicotinamide (NAM), also known as niacinamide or nicotinic acid amide, is the water soluble active form of vitamin B3. For most cells in mammals it represents the main source of nicotinamide adenine dinucleotide (NAD), 1 a key component vital for energy metabolism and signaling pathways. Unlike NAD-dependent redox reactions, in which NAD shuttles between the oxidized (NAD) and reduced (NADH) form, NAD-dependent signaling reactions involve degradation of NAD and thus contribute to the consumption of this pyridine nucleotide. Enzymatic cleavage of NAD results in the transfer of the ADP-ribose moiety onto an acceptor and the release of free NAM, which controls the activity of these enzymes by a feedback inhibition.2,3 A salvage pathway recycles NAM back to NAD to relieve NAM inhibition, maintain NAD levels and sustain enzyme activity. 1
The enzymes catalyzing NAD degradation include poly-ADP-ribose-polymerases (PARPs) and sirtuins. Sirtuins are class III histone/protein deacetylases that deacetylate a broad variety of protein substrates, 4 among which transcription factors are the most extensively studied. Both enzymes have emerged as important regulators of DNA damage repair, chromosomal stability and regulation of gene transcription.5,6
As the NAD-dependent enzymes are involved in a variety of cellular processes, the relative levels of NAD and NAM can be expected to have a significant impact on cell behavior at multiple levels. Previous studies have shown inflammation to be among those processes affected by NAM. It suppresses the secretion of key inflammatory mediators in varying models,7,8 and has been prescribed for the topical treatment of a number of inflammatory skin conditions. 9
In contrast to its well-defined function as an anti-inflammatory agent, little is known about the role of NAM as a modulator of cell differentiation. However, NAM has recently been described to promote myeloid differentiation of CD34+ cells and to induce neutrophilic granulocyte differentiation in healthy individuals. 10 Based on this finding we were interested to determine whether or not NAM has the potential to affect the differentiation of monocytes into macrophages.
Macrophages comprise a heterogeneous population of cells with various immune and homeostatic functions. For the sake of simplicity, macrophages are commonly classified on the basis of function into two types: M1 and M2 (for review see Martinez and Gordon 11 ). However, rather than being ontogenetically distinct, these classes represent the extremes of a continuum of functional phenotypes. Exposure to LPS or IFN-γ polarizes macrophages into the M1 phenotype characterized by a microbicidal, pro-inflammatory and tumoricidal activity, whereas macrophages stimulated with IL-4 and IL-13 assume an M2 phenotype, which is found to dampen inflammation, promote tissue remodeling and to support tumor cells. Macrophages developed in the presence of granulocyte macrophage colony-stimulating factor (GM-CSF) or macrophage colony-stimulating factor (M-CSF) also exhibit a predisposition for polarization toward M1 and M2 phenotypes.12,13 For the most part, the growth factors appear to induce a state in which macrophages are primed for M1 and M2 end points. 14 Following stimulation the cells express M1 and M2 markers which do not exactly map those of classically and alternatively activated MØ.15–17 Therefore, we will refer to macrophages developed in the presence of GM-CSF or M-CSF as GM-MØ or M-MØ, respectively.
Considering the impact of environmental factors on the phenotype and functions of macrophages, we tested whether the natural occurring vitamin B3 may play a role in macrophage polarization. Using the GM-CSF/M-CSF differentiation method we found that GM-MØ generated in the presence of NAM are restricted in their inflammatory response, whereas specific features of M-MØ are hardly affected.
Materials and methods
Reagents
Unless otherwise indicated, materials used in this study were from the following manufacturers: RPMI 1640 (with
Cell separation and cell culture
Human peripheral blood mononuclear cells from healthy donors were obtained by Ficoll-Paque Plus (GE Healthcare) density centrifugation. After repeated washing with PBS containing 0.3 mM EDTA, the monocytes were isolated by counter-flow elutriation using the JE-6B elutriation system (Beckman Instruments, Palo Alto, CA, USA), as described previously. 18 The purity of the cell preparation was >90%, as assessed by morphological screening and immunofluorescence staining with a mAb against CD14 (BL-M/G14; DiaMak, Leipzig, Germany). Monocytes were suspended in RPMI 1640 medium supplemented with 10% (v/v) FCS, 100 U/ml penicillin and 100 mg/ml streptomycin, to a final amount of 5 × 10⁵ cells/ml. Cells were supplemented with 500 IU/ml GM-CSF (Leukine, sargramostim) for GM-MØ differentiation or 50 ng/ml M-CSF (R&D Systems, Minneapolis, MO, USA) for M-MØ differentiation and incubated for 7 d at 37℃, 5% CO2 in Teflon bags in the presence or absence of 800 µM NAM added at d 0 and d 4. After harvesting, the macrophages (1 × 10⁶/ml) were incubated for 4 h in cell culture plates before adding LPS (100 ng/ml).
Cell viability
Apoptosis and necrosis of macrophages and monocytes were assessed using a FITC Annexin V/PI kit (Biolegend, San Diego, CA, USA) according to the manufacturer’s instruction. Analyses were performed using a FACS Canto II flow cytometer (Becton Dickinson, San Jose, CA, USA).
Cell morphology
Macrophages were incubated on coverslips at 37℃ and 5% CO2. After 24 h cells were stained according to Pappenheim and visualized with a Nikon Eclipse TE 2000-E microscope. The image files were acquired with the NIS-Elements F 3.2 software (Nikon, Tokyo, Japan).
Detection of cytokines in culture supernatants
Macrophages were suspended in culture medium (1 × 10⁶/ml) and stimulated with 100 ng/ml LPS. Culture supernatants were collected after different times and tested for TNF-α by ELISA as previously described, 19 and for IL-1β, IL-6, IL-8, IL-10 and IL-12p40 by Cytometric Bead Arrays (Becton Dickinson) according to the manufacturer’s protocol.
Detection of eicosanoids in culture supernatants
Macrophages were suspended in culture medium (1 × 10⁶/ml) and stimulated for 16 h with 100 ng/ml LPS. Culture supernatants were collected and the eicosanoid concentrations were determined by liquid chromatography-quadrupole linear ion trap-mass spectrometry (LC-MS/MS), as previously described. 20
Cell lysate preparation and protein determination
Macrophages (1 × 10⁶/ml) were washed with PBS, suspended in RIPA buffer (50 mM Tris, 150 mM NaCl, 1% Nonidet P 40, 0.5% deoxycholate, 0.1% SDS; pH 7.5) supplemented with a complete protease inhibitor cocktail (Roche Applied Science, Penzberg, Germany) and sonicated. When studying protein phosphorylation phosphatase inhibitors (1 mM Na3VO4 and 50 mM NaF) were added. Samples were centrifuged for 5 min at 15,000 g and 4℃. The protein concentrations in the supernatants were determined using a DC Protein Assay (Bio-Rad, Hercules, CA, USA) according to the manufacturer’s protocol.
Determination of NAD/NADH concentration
The cellular NAD/NADH concentrations in macrophages (5 × 10⁵ cells) were measured using a colorimetric NAD/NADH assay kit (EnzyChrom, BioAssay Systems, Hayward, CA, USA) according to the manufacturer’s protocol. Cellular NAD and NADH levels were quantified according to standard curves generated with NAD and normalized to the total protein content of cell lysates.
Western blot analysis
Western blot analyses were carried out as previously described, 21 with some modifications. Protein samples (50 µg in Laemmli) were run on 10% or 12% SDS-polyacrylamide gels (Protean II; Bio-Rad) and subsequently transferred to polyvinylidenfluoride membranes (Amersham Biosciences, Munich, Germany). Membranes were probed with the following Abs: PBEF (NAMPT) goat Ab (C20) (1:200; Santa Cruz, Dallas, TX, USA); SIRT1 (C14H4) rabbit mAb (1:1000); SIRT6 (D8D12) rabbit mAb (1:1000) (all from Cell Signaling Technology, Danvers, MA, USA) or β-actin mouse Ab (AC 74) (1:2000; Sigma-Aldrich). The respective secondary Abs POD-conjugated goat anti-rabbit IgG Ab (1:20,000; Dianova, Hamburg, Germany), goat anti-mouse IgG Ab (1:8000; Sigma-Aldrich) or donkey anti-goat IgG Ab (1:8000; Santa Cruz) were used for detection. For NF-κB p65, phospho-NF-κB p65, IκB and phospho-IκB analysis, membranes were probed with primary and secondary Abs from the NF-κB pathway sampler kit (Cell Signaling Technology) according to the manufacturer’s protocol.
Chemiluminescent detection was achieved by the ECL-A/ECL-B substrate method.
NF-κB p65 binding assay
The NF-κB p65/p50 Transcription Factor Assay Kit (Abcam, Cambridge, UK) was used to detect the specific transcription factor DNA binding activity in cell lysates. Lysates (5 µg) were incubated in 96-well plates, coated with a specific double-stranded DNA sequence containing the NF-κB response element. The binding was detected by the use of a specific primary and a HRP-conjugated secondary Ab according to the manufacturer’s protocol.
RNA isolation and reverse transcription
Total RNA was isolated from macrophages using the RNeasy Mini Kit (Qiagen, Hilden, Germany) according to the manufacturer’s instruction. DNase I treatment and reverse transcription were performed as previously described. 22
Real-time PCR (qPCR)
Primer sequences.
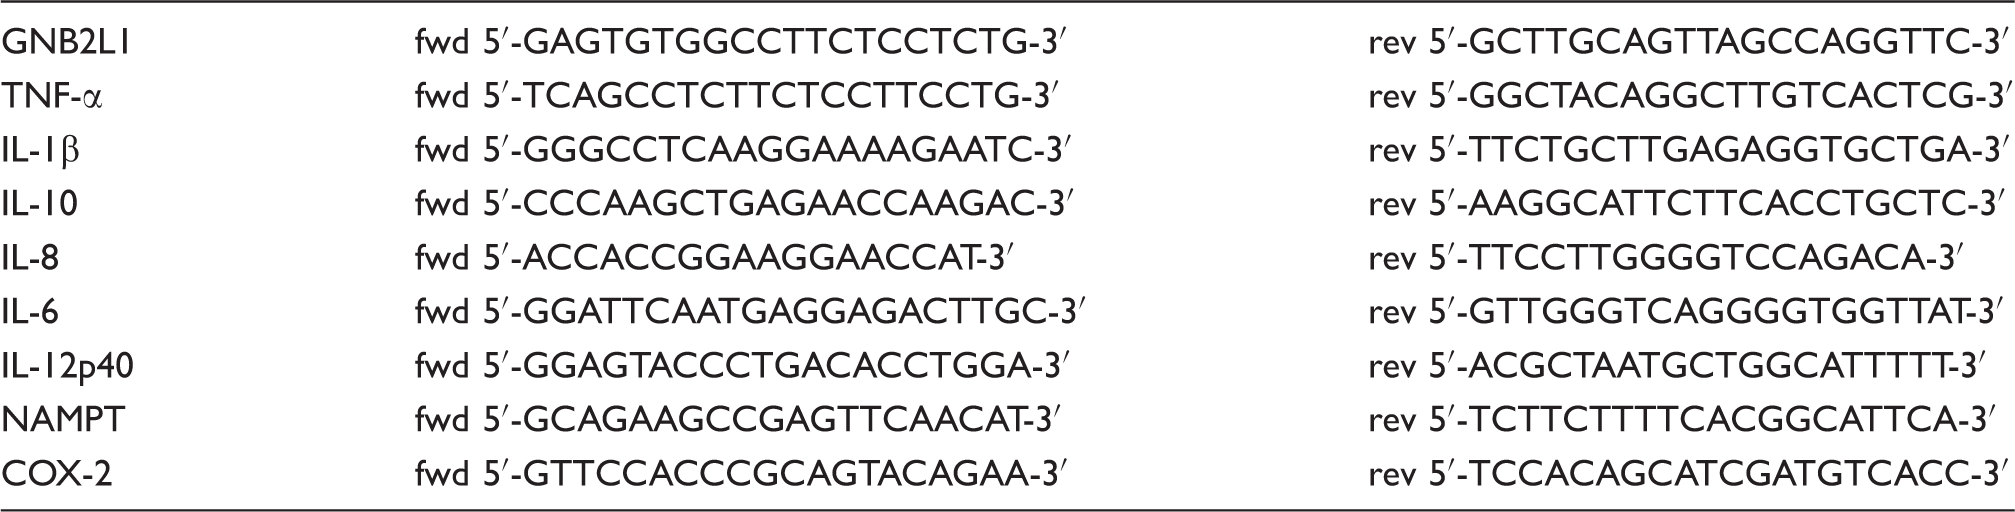
The reactions were performed using the Lightcycler 480 system (Roche Applied Science) or the CFX connect real-time PCR detection system (Bio-Rad) under the following conditions: initial denaturation at 95℃ for 10 min, followed by 40 cycles at 95℃ for 15 s (denaturation), at 65℃ (IL-12p40) or 60℃ (all other primer pairs) for 30 s (primer annealing), and at 72℃ for 30 s (extension/synthesis). Product quantification was optimal at 72℃. Negative controls were performed with water as the template. Calculations (ΔΔCt method) were carried out as previously described using GNB2L1 as the reference gene. 23
mRNA stability
Macrophages (1 × 10⁶/ml) were stimulated with 100 ng/ml LPS. After 2 h cells were treated with 5 µg/ml actinomycin D (Sigma-Aldrich) or DMSO (Sigma-Aldrich) as control. After 20 min, 40 min and 60 min total RNA was isolated using the RNeasy Mini Kit (Qiagen) according to the manufacturer’s protocol. DNase I treatment and reverse transcription, as well as real-time PCR, were performed as described above.
Sirtuin inhibition
Macrophages (1 × 10⁶/ml) were treated with sirtinol, Ex-527 (6-chloro-2,3,4,9-tetrahydro-1 H-carbazole-1-carboxamide) and resveratrol or DMSO (control) (all reagents from Sigma-Aldrich). After 15 min the cells were stimulated for 6 h with LPS (100 ng/ml). Culture supernatants were collected and the TNF-α concentration was determined as described above.
Statistical analyses
All statistical analyses were done using GraphPad Prism (GraphPad Inc., La Jolla, CA, USA) or the SigmaStat (Systat Software, San Jose, CA, USA) software.
Statistical significance was calculated with the tests indicated and classified as follows:
*p ≤ 0.05; **p ≤ 0.01; ***p ≤ 0.001.
Results
Effect of NAM on cell viability and cell morphology
GM-MØ and M-MØ were generated from monocytes in the absence and presence of various concentrations of NAM added at the beginning and at d 4 of the 7 d culture period. Cell viability was measured directly after harvesting using a FITC Annexin V/PI staining kit. As seen in Figure 1a concentrations up to 800 µM did not affect the overall cell viability assessed on d 7, whereas 8000 µM NAM displayed cytotoxic effects on both cell types. Similar results were obtained when viability was determined by Trypan blue exclusion and by using the MTT test (data not shown). As depicted in Figure 1b, and as described earlier,
24
the majority of GM-MØ consistently displayed a ‘fried egg’ morphology whereas M-MØ primarily exhibited stretched, spindle-like features. Prior exposure to NAM resulted in a significant increase of elongated cells within the GM-MØ population, whereas the morphology of M-MØ hardly changed (Figure 1b, c).
Effect of NAM on cell viability and morphology. Monocytes were differentiated into GM-MØ and M-MØ in the presence and absence of NAM. After 7 d: (a) viability was evaluated by a FITC Annexin V/PI kit and flow cytometry. Bars represent means ± SEM (n = 3); (b) macrophages were stained according to Pappenheim (original magnification ×400); (c) the length and width of ≥1000 cells was measured and the ratio was calculated. Bars represent means ± SEM (n = 3). Statistics were analyzed with the paired Student’s t-test calculated to untreated cells.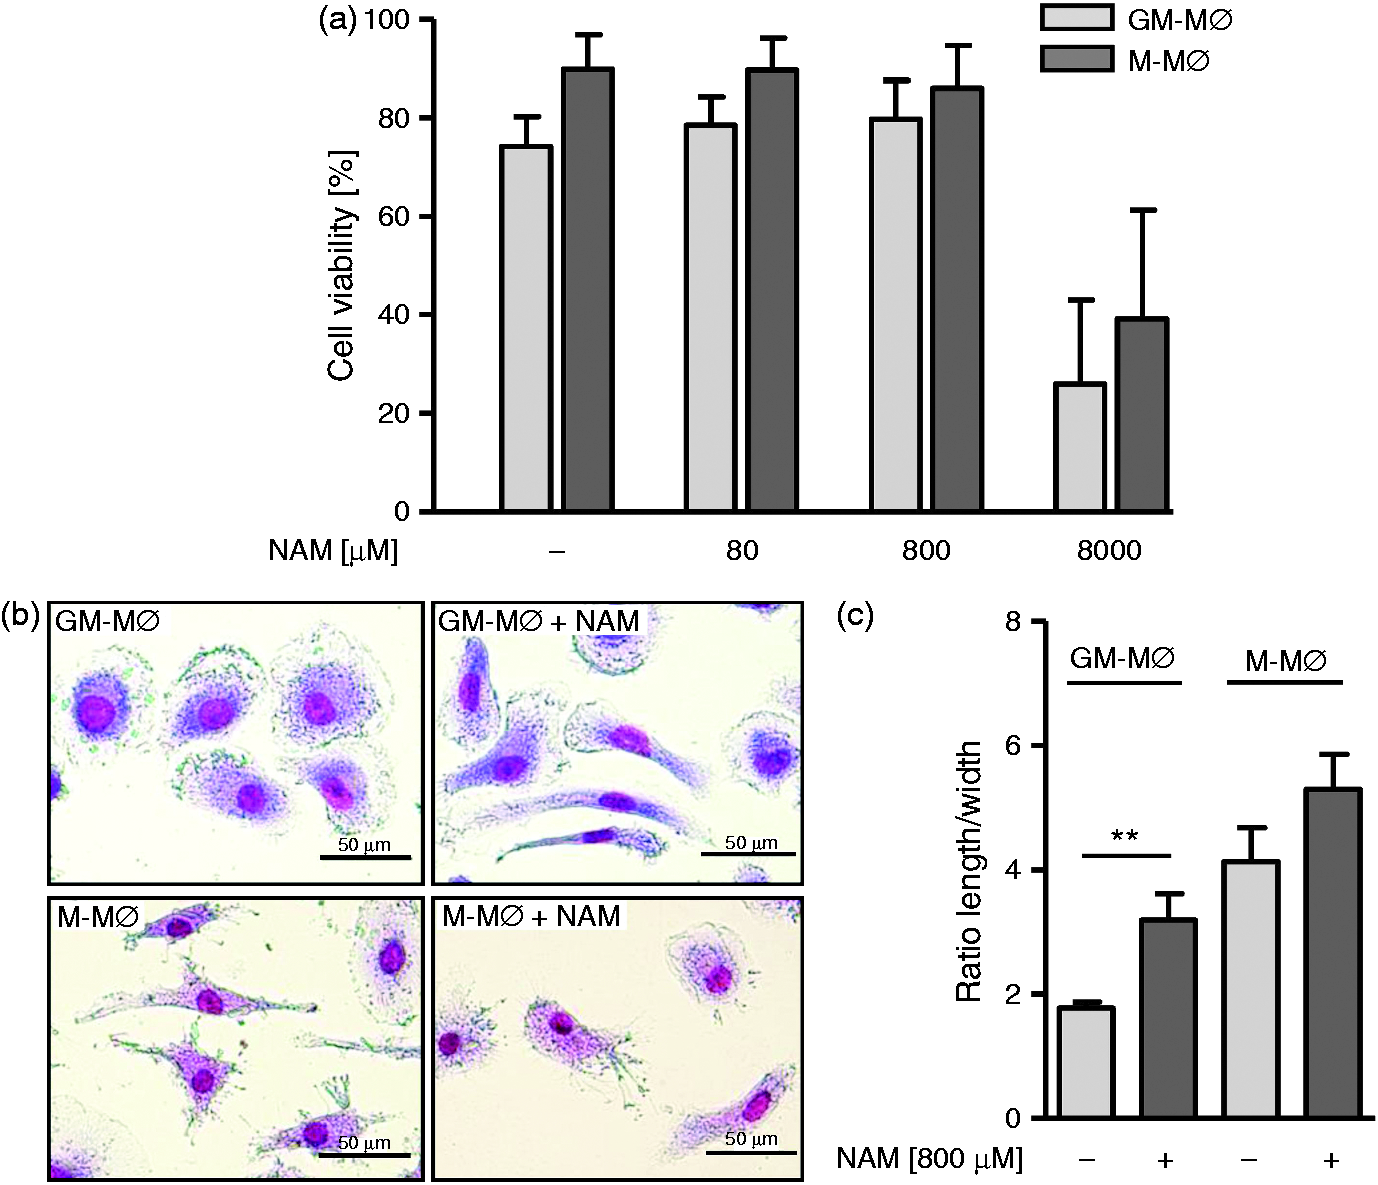
Effect of NAM on cytokine production
Cytokine production by GM-MØ and M-MØ. Macrophages were incubated in the presence and absence of LPS (100 ng/ml). After 16 h cytokine concentrations were determined in the culture supernatants by ELISA (TNF-α) or cytometric bead array.
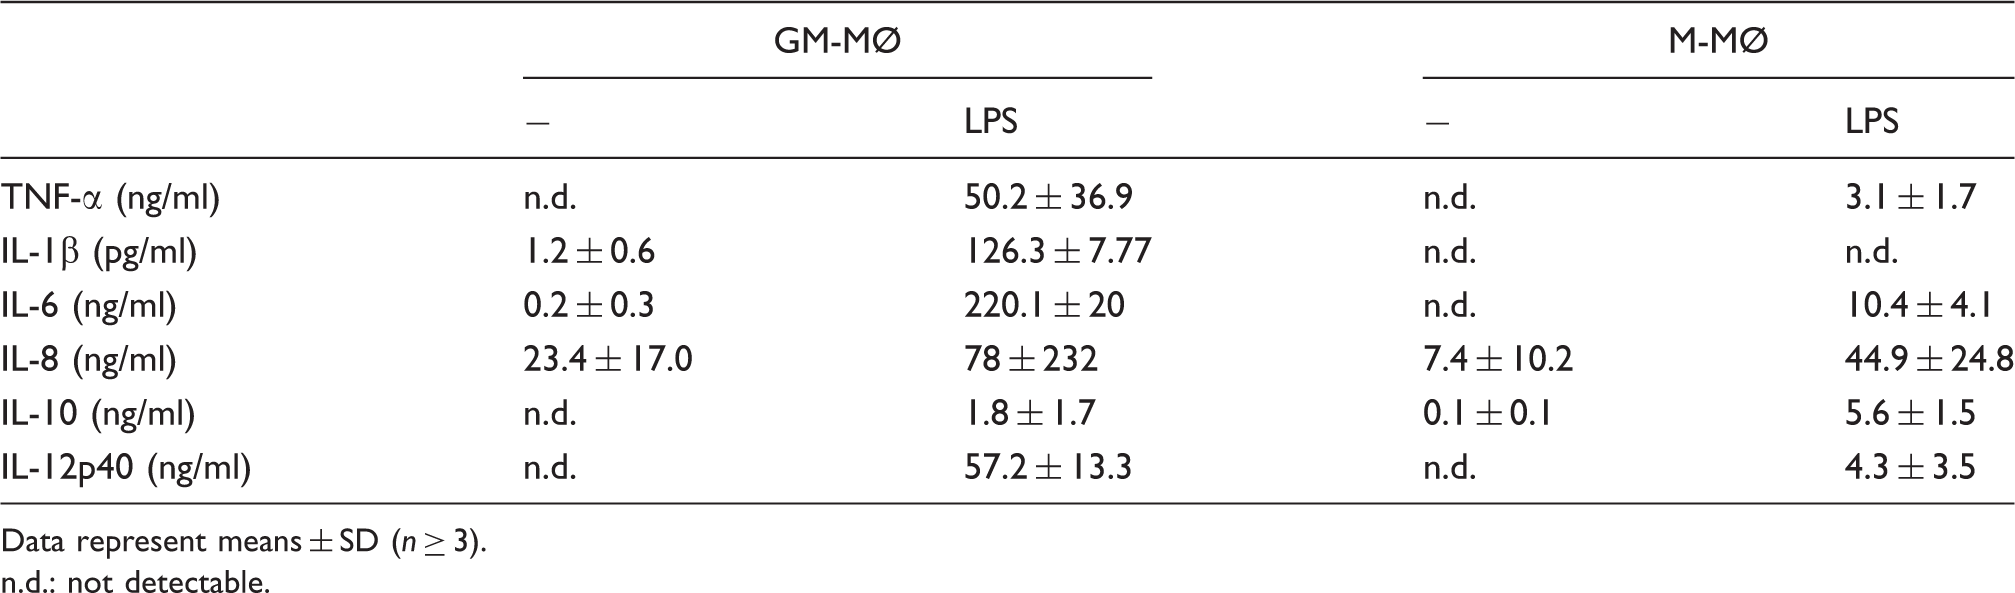
Data represent means ± SD (n ≥ 3).
n.d.: not detectable.
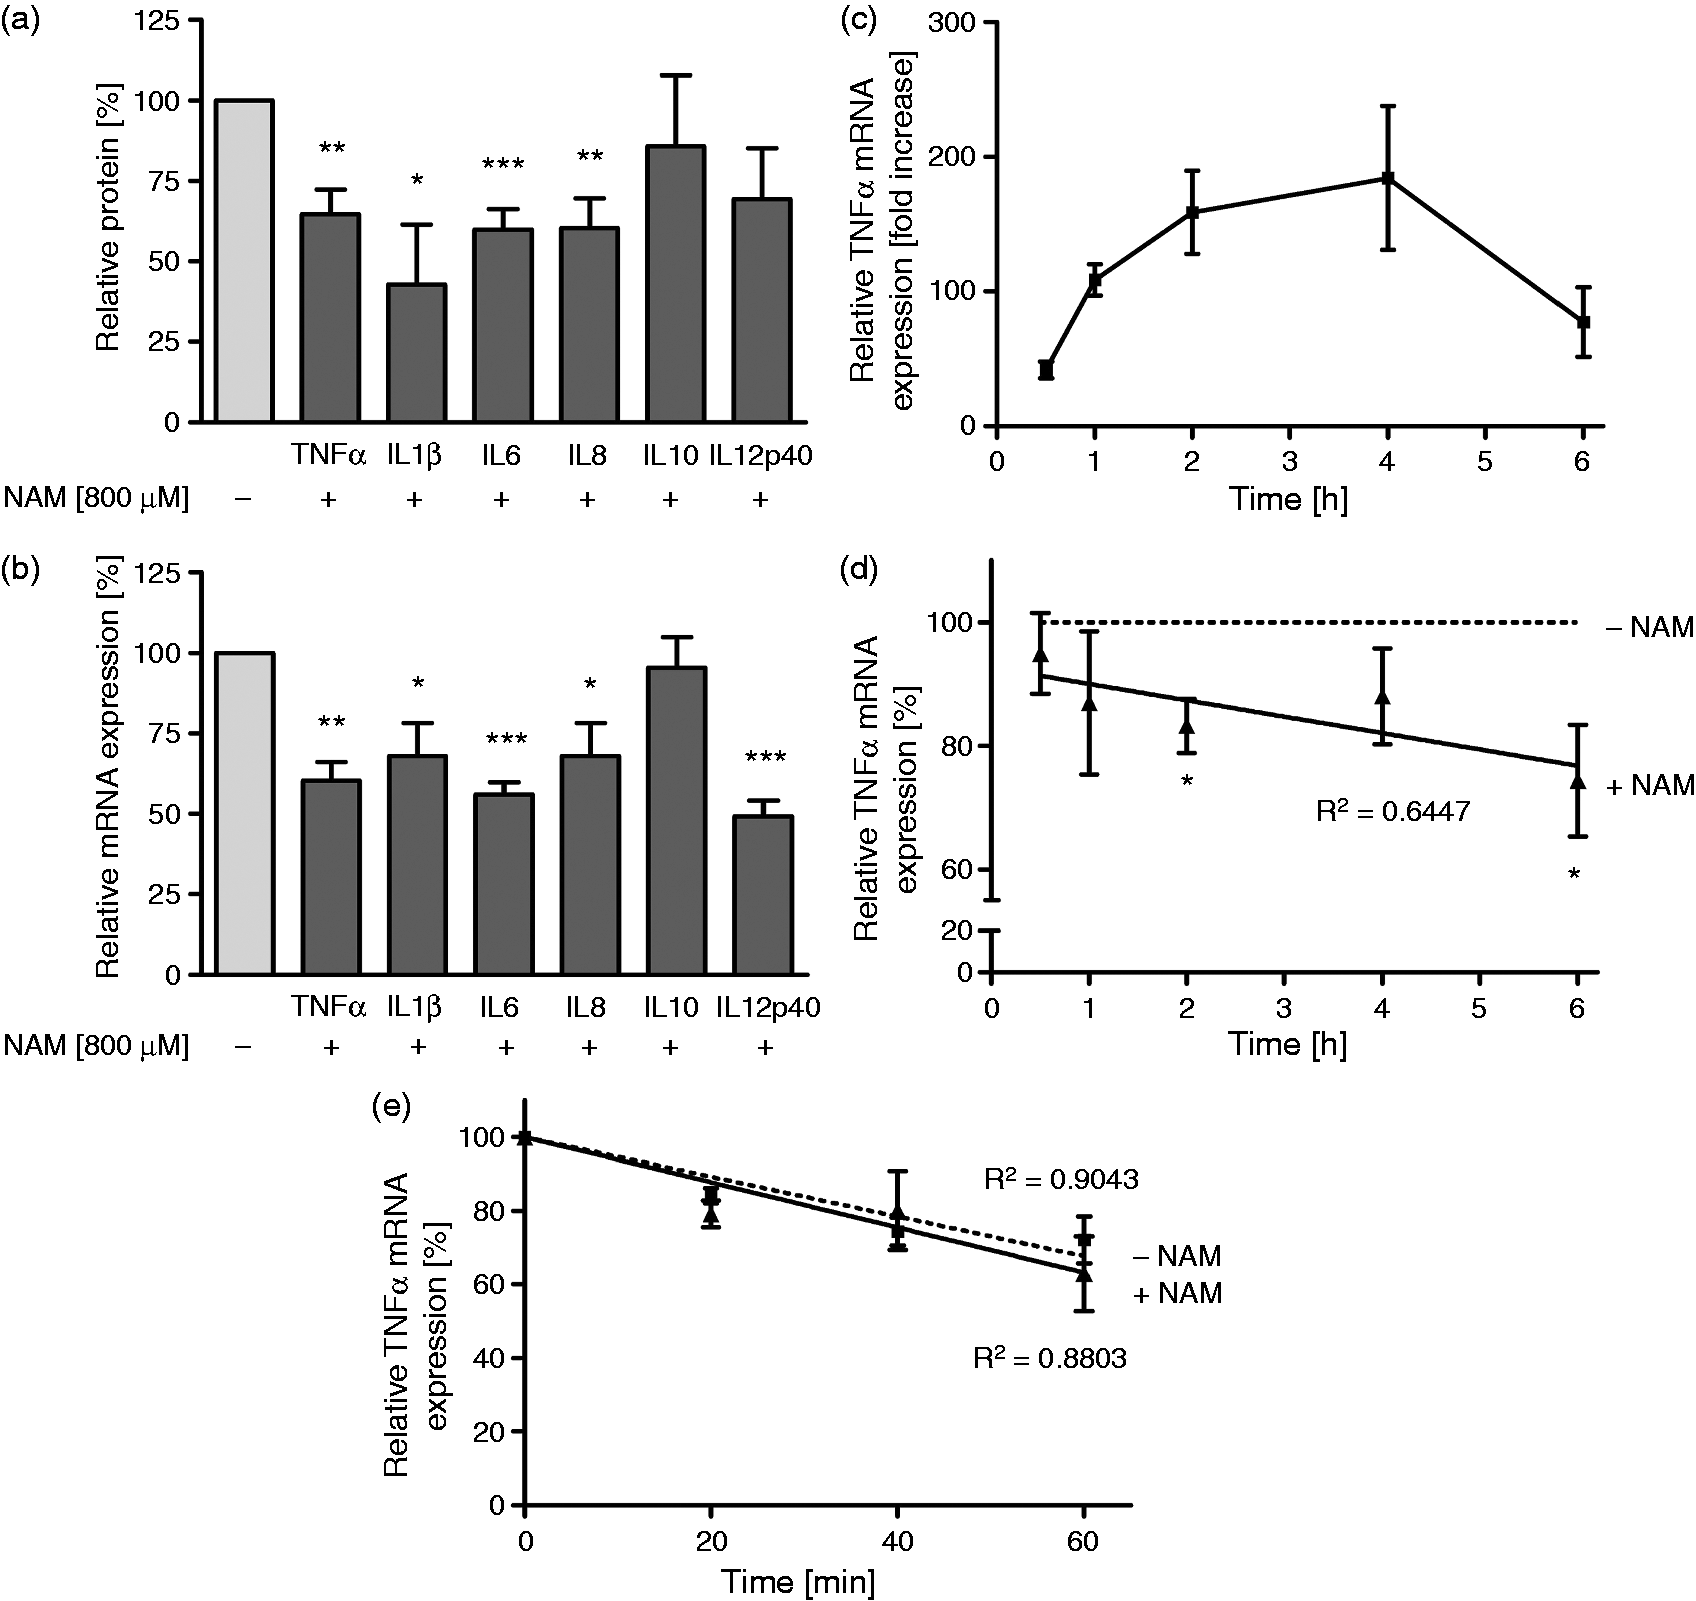
Effect of NAM on cytokine expression and TNF-α mRNA stability of GM-MØ. GM-MØ differentiated in the presence and absence of NAM (800 µM) were stimulated with LPS (100 ng/ml). (a) After 16 h cytokine concentrations were determined in the culture supernatants by ELISA (TNF-α) or cytometric bead array. (b) After 6 h mRNA expression of cytokines was analyzed by qPCR. (c) After different time points TNF-α mRNA expression of untreated and (d) NAM-treated and NAM-untreated cells were analyzed by qPCR. (e) Two h after stimulation gene transcription was inhibited by incubation of cells with 5 µg/ml actinomycin D for the indicated times. TNF-α mRNA levels were quantified by qPCR analysis. Data represent means ± SEM (n ≥ 3). Statistics were analyzed with the paired Student’s t-test calculated to controls: (a) and (b) 100% (gray bar) = absence of NAM; (c) unstimulated MØ = 1; (d) 100% (dotted line) = absence of NAM; (e) 100% = maximum of TNF-α mRNA.
To determine whether down-regulation of TNF-α mRNA was due to post-transcriptional events, we measured the mRNA stability by exposing cells to the transcription inhibitor actinomycin D (Figure 2e). We compared the half-life of LPS-induced TNF-α mRNA in the absence and presence of NAM. Treatment with NAM did not change the mRNA degradation rate, suggesting that regulation in response to NAM occurs at the level of transcription.
Effect of NAM on eicosanoid production
Whereas the cytokine profile of GM-MØ and M-MØ has been well characterized, little is known about the eicosanoid profile of the two MØ subsets.
Eicosanoids are derived from polyunsaturated fatty acids with 20 carbons such as arachidonic acid (AA). Following its release from membrane phospholipids AA can be further metabolized by the cyclooxygenase (COX), lipoxygenase (LOX) or cytochrome P450 (CYP) pathways.
COXs are the enzymes that convert AA to prostaglandin (PG)H2, which is the common substrate for a series of PG synthases that produce PGD2, PGE2, PGF2α and PGJ2.
These prostaglandins can then be metabolized further to a variety of distinct lipid species.
Effect of NAM on eicosanoid production by GM-MØ and M-MØ. GM-MØ and M-MØ differentiated in the presence and absence of NAM (800 µM) were incubated with or without LPS (100 ng/ml). After 16 h eicosanoid concentrations (pg/ml) were determined in the culture supernatants by LC-MS/MS analysis.
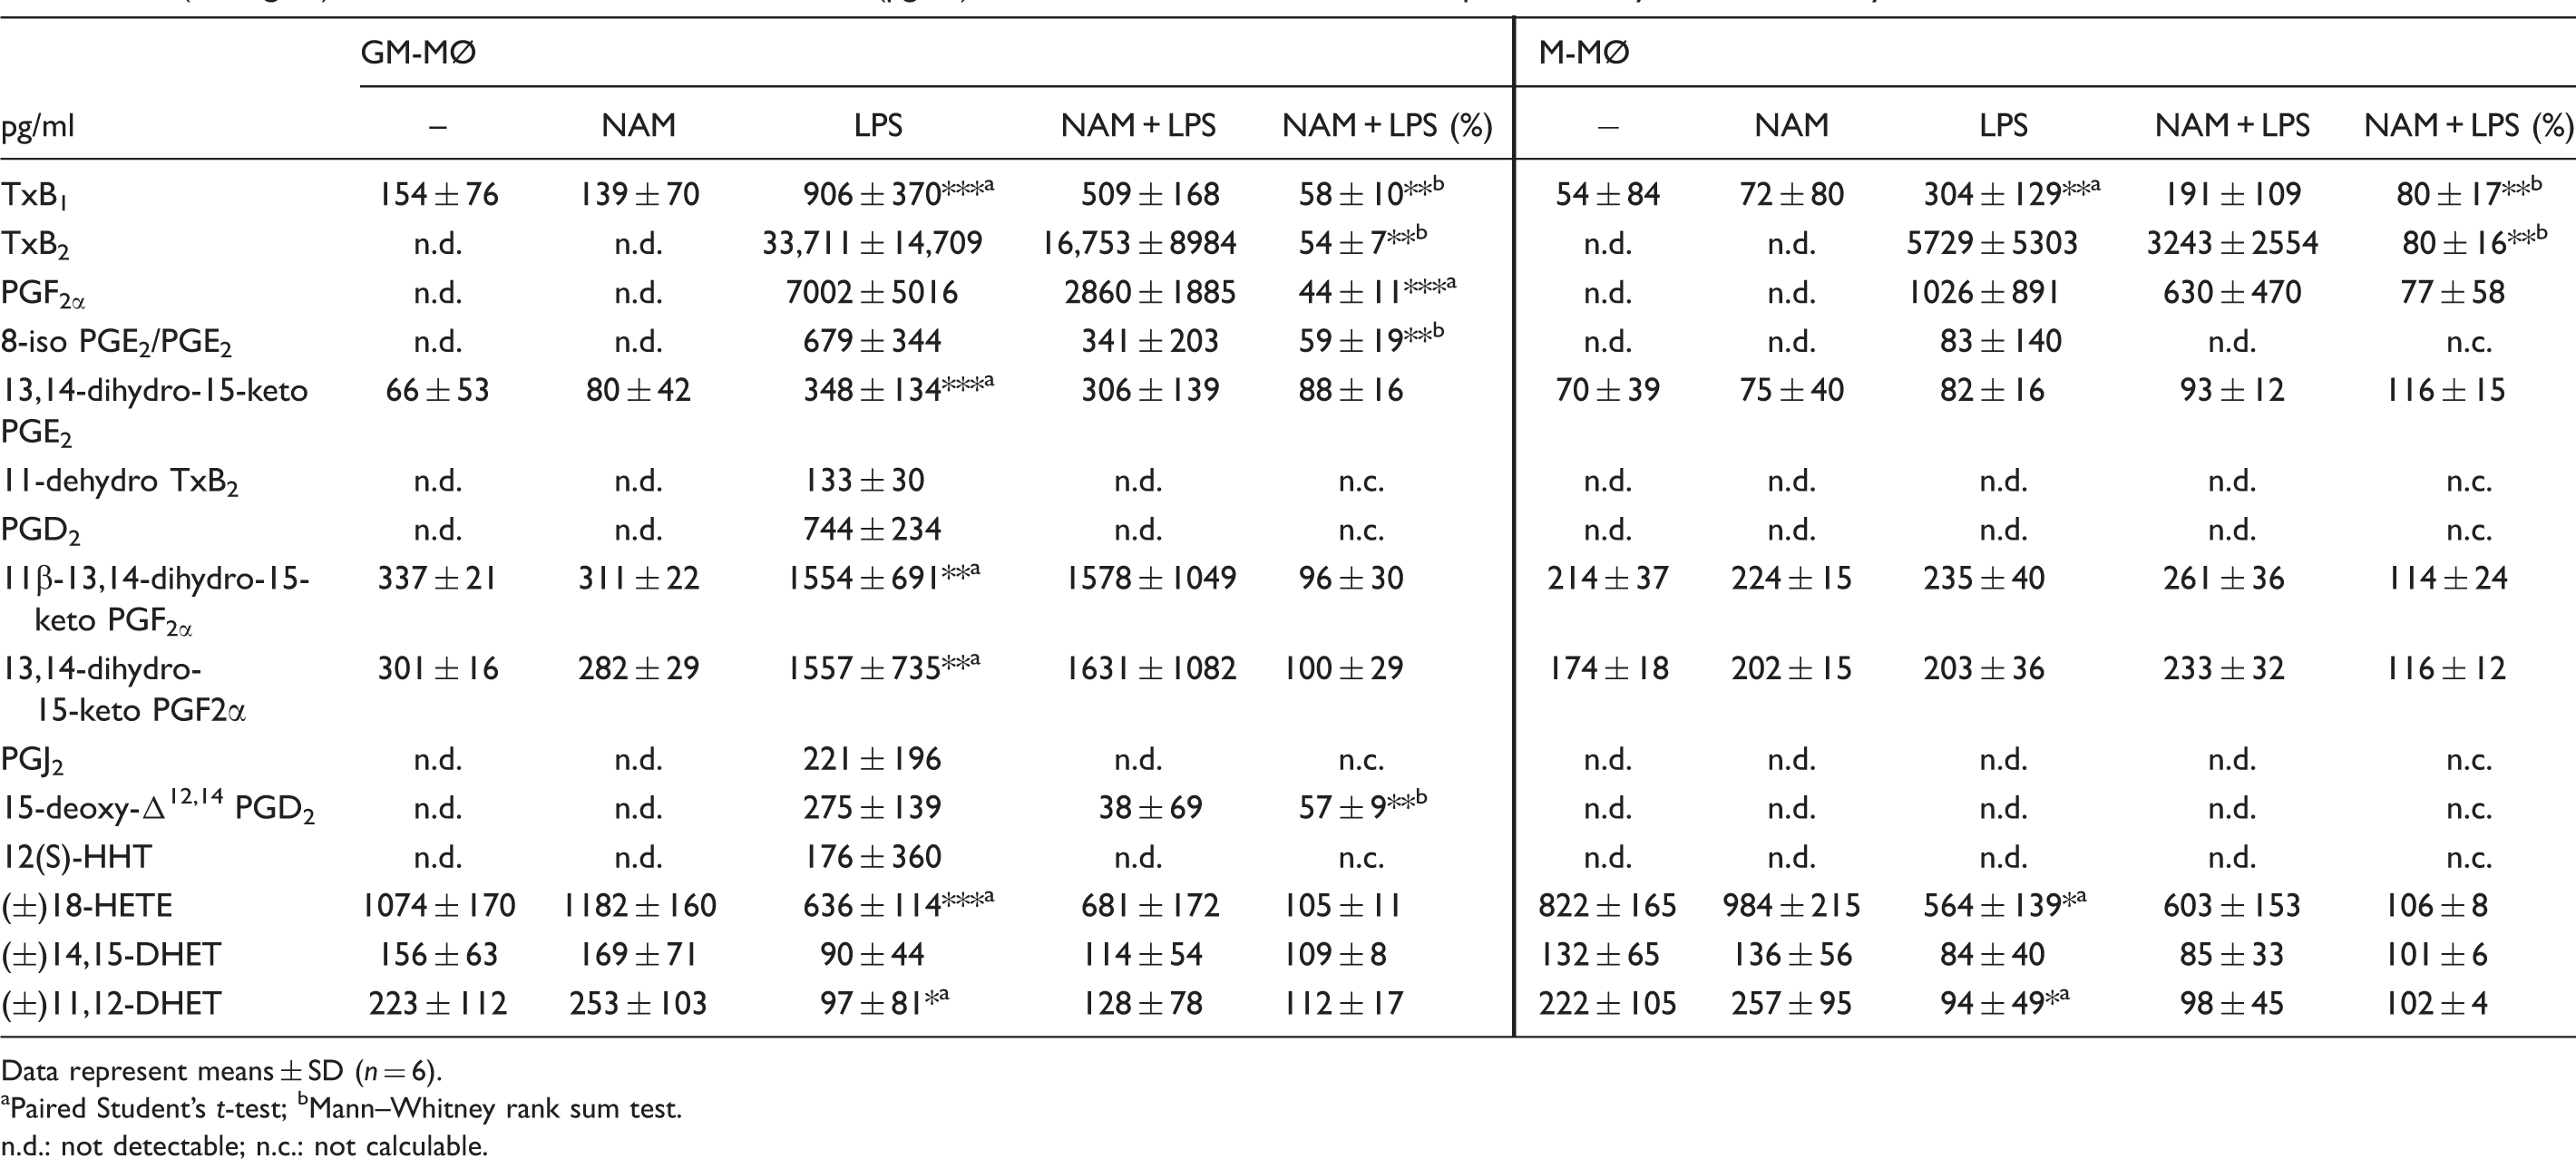
Data represent means ± SD (n = 6).
aPaired Student’s t-test; bMann–Whitney rank sum test.
n.d.: not detectable; n.c.: not calculable.
As these metabolites are products of the COX pathway we reasoned that NAM might interfere with COX activity. We measured COX-2 mRNA expression in GM-MØ and M-MØ (Figure 3a), and verified the LPS-induced COX-2 expression,
26
as well as higher expression level in GM-MØ than M-MØ after 6 h, consistent with the higher levels of COX-2-dependent eicosanoids. As shown in Figure 3b we found COX-2 mRNA expression in GM-MØ to be down-regulated in response to NAM.
Effect of NAM on COX-2 expression of GM-MØ and M-MØ. GM-MØ and M-MØ were incubated in the presence and absence of LPS (100 ng/ml). (a) After 1, 6 and 16 h COX-2 mRNA expression was analyzed by qPCR. Unstimulated MØ = 1. (b) GM-MØ and M-MØ differentiated in the presence and absence of NAM (800 µM) were stimulated with LPS (100 ng/ml) and after 1, 6 and 16 h COX-2 mRNA expression was analyzed by qPCR. Stimulated MØ (1, 6, 16 h) without NAM = 100%. Data represent means ± SEM (n = 3); paired Student’s t-test calculated to controls (without NAM).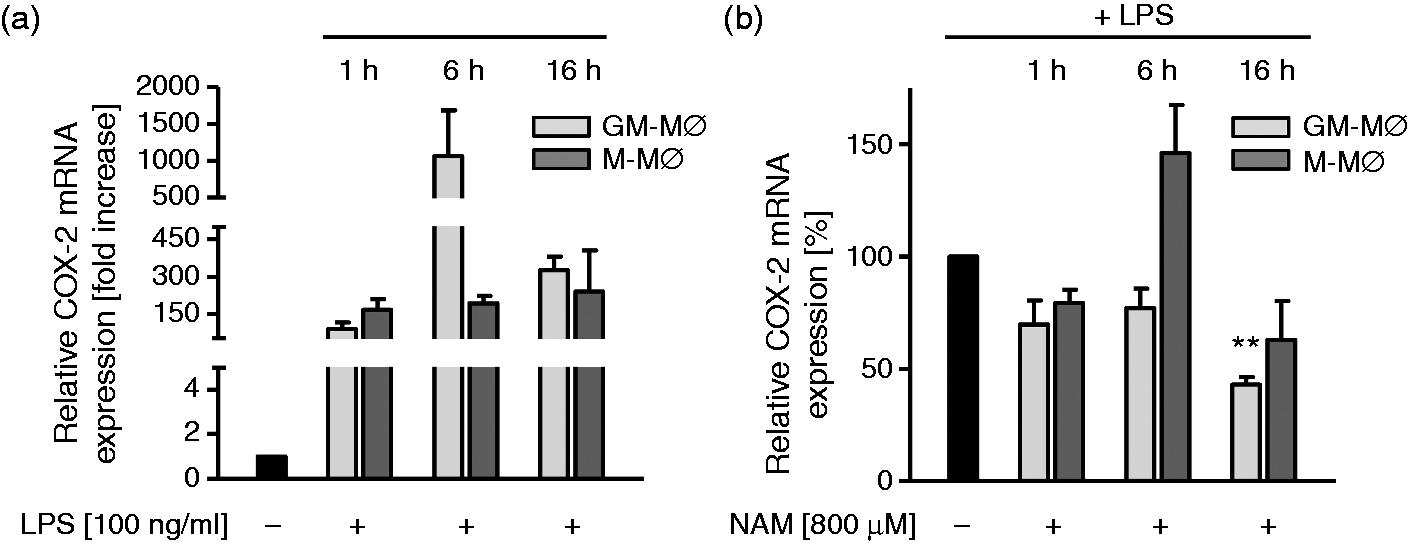
GM-MØ and M-MØ constitutively expressed similar levels of the CYP-derived products 18-HETE, 14,15-DHET and 11,12-DHET (Table 3). All three metabolites are down-regulated in response to LPS and not affected by NAM, which points to a general function of the metabolites displayed by both macrophage types.
Pre-treatment with NAM does not prevent the LPS-induced decrease in intracellular NAD concentrations
Based on recent reports that show a positive functional link between intracellular NAD concentrations and inflammatory responses such as TNF-α production,
27
we next tested whether application of NAM results in changes in intracellular NAD and NADH levels. The pyridine nucleotides were measured after various periods of incubation in the presence or absence of LPS. As depicted in Figure 4a, NAM treatment in the absence of LPS results in a transient increase in NAD, with a return to baseline levels by 16 h. LPS treatment leads to a decline in both the baseline and NAM-induced levels of NAD over the 16 h period. NADH levels were also reduced by LPS treatment, but there was no detectable effect of NAM exposure (Figure 4b). Accordingly, the NAD/NADH ratios follow closely the pattern of the NAD concentration (Figure 4c). The re-synthesis of NAD from NAM via the rate-limiting enzyme nicotinamide phosphoribosyltransferase (NAMPT) is of great importance to cellular NAD homeostasis. As LPS induced a decrease in NAD levels, we next tested the expression profile of NAMPT at the mRNA and protein level in response to LPS and prior treatment with NAM. Increased mRNA levels were detected 1 h (twofold), 6 h (43-fold) and 16 h (125-fold) after the addition of LPS (Figure 4d). This strong induction was slightly inhibited by NAM treatment at 6 h (Figure 4e).
Effect of NAM on NAD/NADH levels and NAMPT expression in GM-MØ. GM-MØ differentiated in the presence and absence of NAM (800 µM) were incubated for 1, 6 and 16 h with or without LPS (100 ng/ml). (a, b) Intracellular NAD and NADH levels were measured by a commercially available colorimetric NAD/NADH assay kit and normalized to the total protein content of cell lysates. (c) NAD/NADH ratios of unstimulated and stimulated GM-MØ. (d) NAMPT mRNA of GM-MØ differentiated in the absence of NAM was analyzed by qPCR. Unstimulated MØ = 1. (e) NAMPT mRNA of GM-MØ differentiated in the presence and absence of NAM was analyzed by qPCR. Stimulated MØ (1, 6, 16 h) without NAM = 100%. (f) Apoptosis/necrosis of GM-MØ treated with or without NAM and of monocytes was assessed by FITC Annexin V/PI staining 16 h after incubation in the presence and absence of LPS (100 ng/ml). (a–f) Data represent means ± SEM (n = 3); paired Student’s t-test calculated to controls. (g) Cells were lysed and proteins separated by SDS-PAGE and subjected to immunoblot analysis. One representative experiment out of three is shown.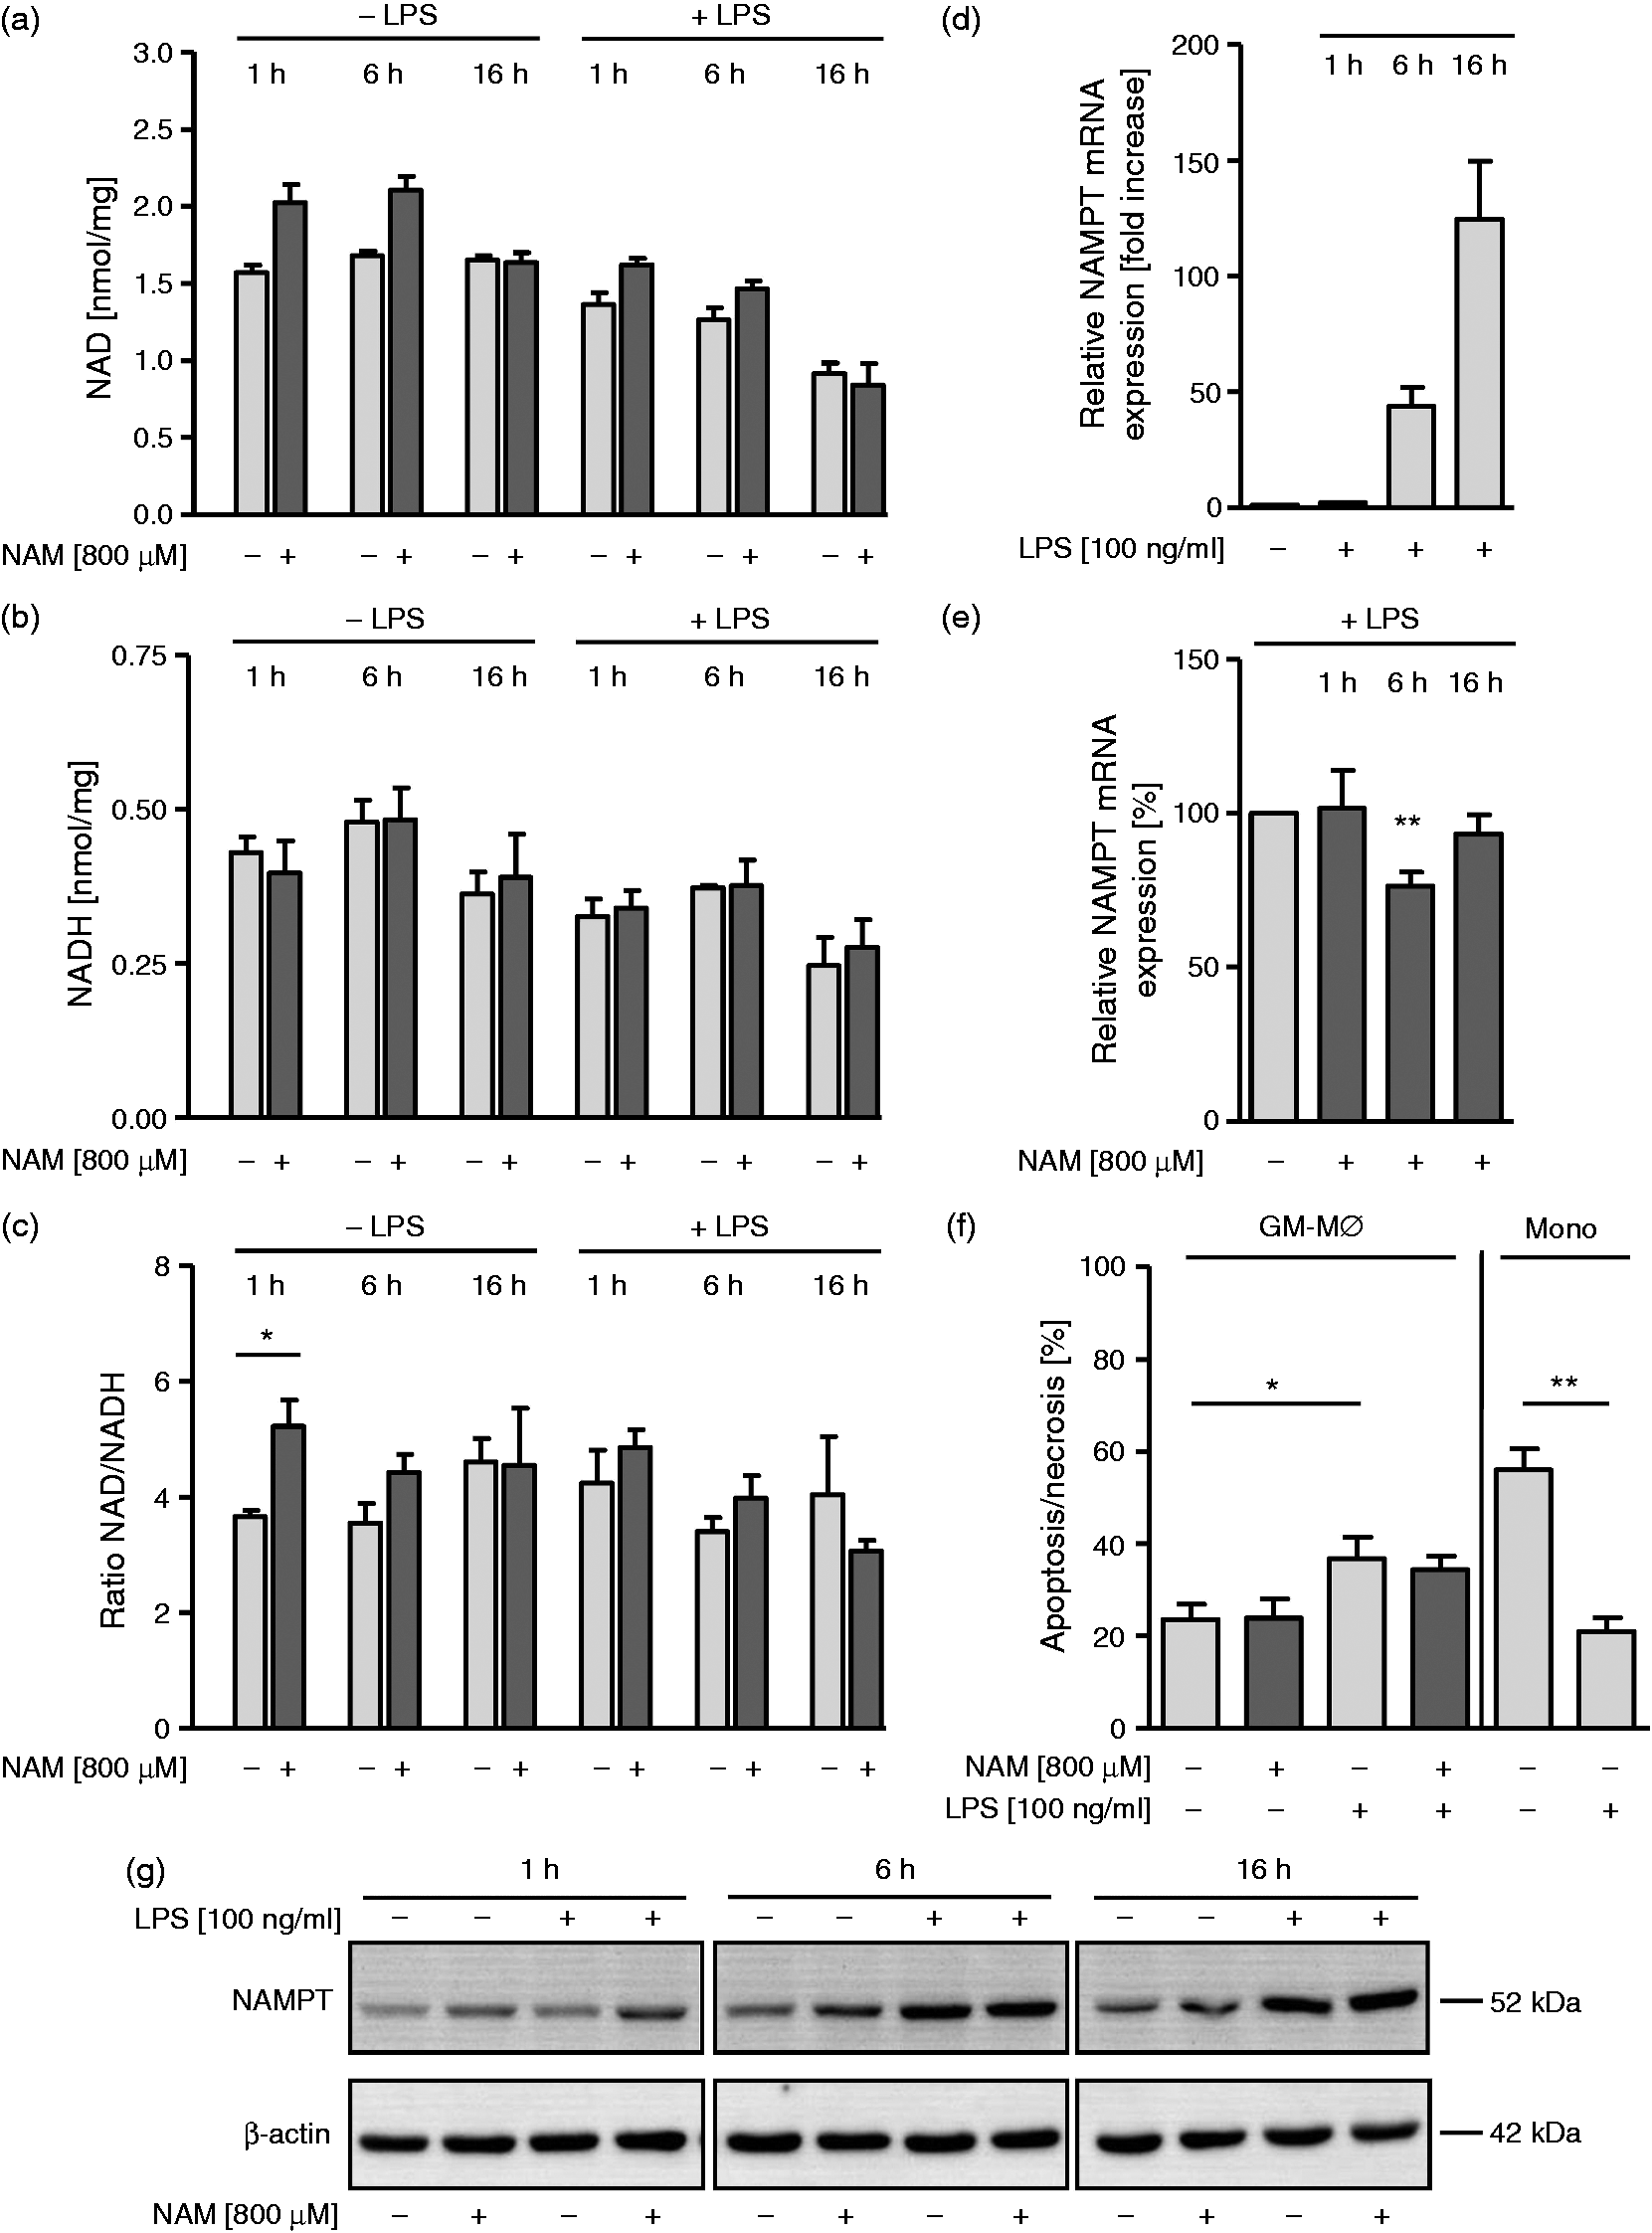
The elevated mRNA expression was followed by induction of NAMPT protein. Six h after LPS stimulation NAMPT expression was significantly increased and remained elevated at 16 h, independent of NAM treatment. A minor NAM-dependent up-regulation of NAMPT was observed at 1 h (Figure 4g).
These data clearly indicate that pre-treatment with NAM leads to an increase in NAD levels and that despite a strong LPS-induced up-regulation of NAMPT expression, NAD homeostasis cannot be maintained in LPS-activated macrophages.
To test whether the LPS-induced NAD shortage was accompanied by changes in macrophage viability, apoptosis was measured 16 h after incubation. As seen in Figure 4f incubating macrophages in the presence of LPS resulted in an increase in apoptotic cells from 23% to 39%. Pre-treatment with NAM had no effect on the apoptosis/necrosis rate of unstimulated or stimulated cells. It is noteworthy that while LPS displays apoptotic effects on human macrophages the opposite is true for monocytes (Figure 4f).
NAM pre-treatment does not affect SIRT1 and SIRT6 expression
We reasoned that the NAD sensors SIRT1 and SIRT6 may have a role in NAM-induced inhibition of TNF-α synthesis. Both enzymes, which have been reported to participate in the regulation of pro-inflammatory cytokines,
28
bind and inactivate the RelA/p65 subunit of NF-κB,29,30 a transcription factor-regulating cytokine expression. First, we examined SIRT1 and SIRT6 protein levels at 1, 6 and 16 h after incubation in the presence and absence of LPS (Figure 5). We found that SIRT1 and SIRT6 were constitutively expressed and that neither stimulation with LPS nor prior treatment with NAM had any effect on protein expression, indicating that the inhibition of TNF-α synthesis is not simply a result of altered sirtuin expression. Next, we tested the involvement of sirtuins in TNF-α production by inhibiting enzyme activity. We used two structurally unrelated sirtuin inhibitors, namely sirtinol and Ex-527, at concentrations that had no impact on cell viability as documented by staining with a FITC Annexin V/PI kit (data not shown). As shown in Table 4 the sirtuin inhibitors did not affect TNF-α production by NAM/LPS-treated cells.
Effect of NAM on SIRT1 and SIRT6 expression in GM-MØ. GM-MØ differentiated in the presence and absence of NAM (800 µM) were incubated for 1, 6 and 16 h with or without LPS (100 ng/ml). Cells were lysed and the proteins were separated by SDS-PAGE and subjected to immunoblot analysis. One representative experiment out of three is shown. Effect of sirtinol, Ex-527, resveratrol and NAM on LPS-induced TNF-α production by GM-MØ. GM-MØ differentiated in the presence and absence of NAM (800 µM) were incubated with different concentrations of sirtinol (10, 25, 50 µM), Ex-527 (1, 5 µM), resveratrol (10, 25, 50 µM) or DMSO (control) prior to the stimulation with LPS (100 ng/ml). After 6 h TNF-α concentrations were determined in the culture supernatants by ELISA. Data represent means ± SD (n = 3) calculated to the corresponding DMSO controls (100%).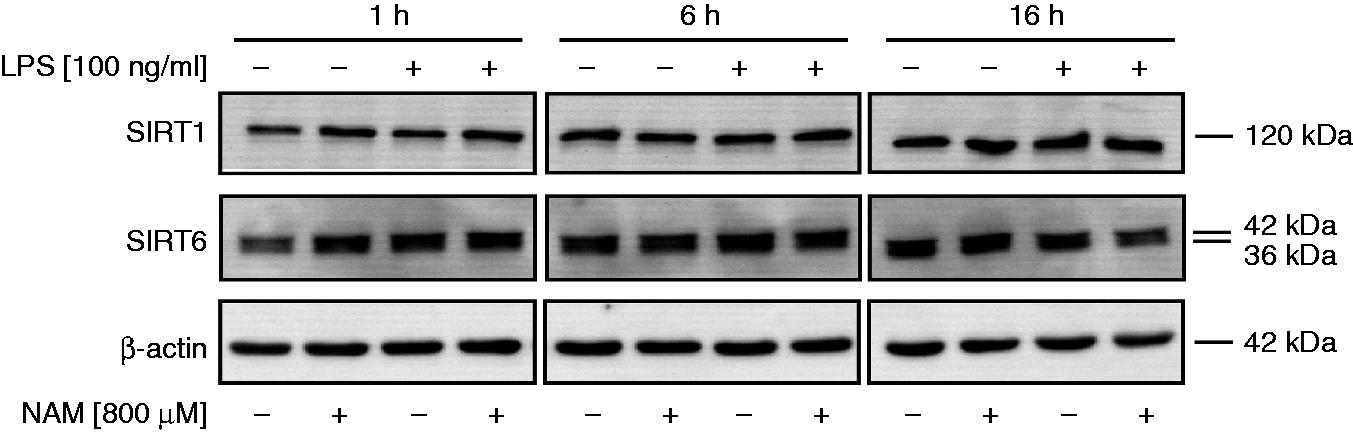
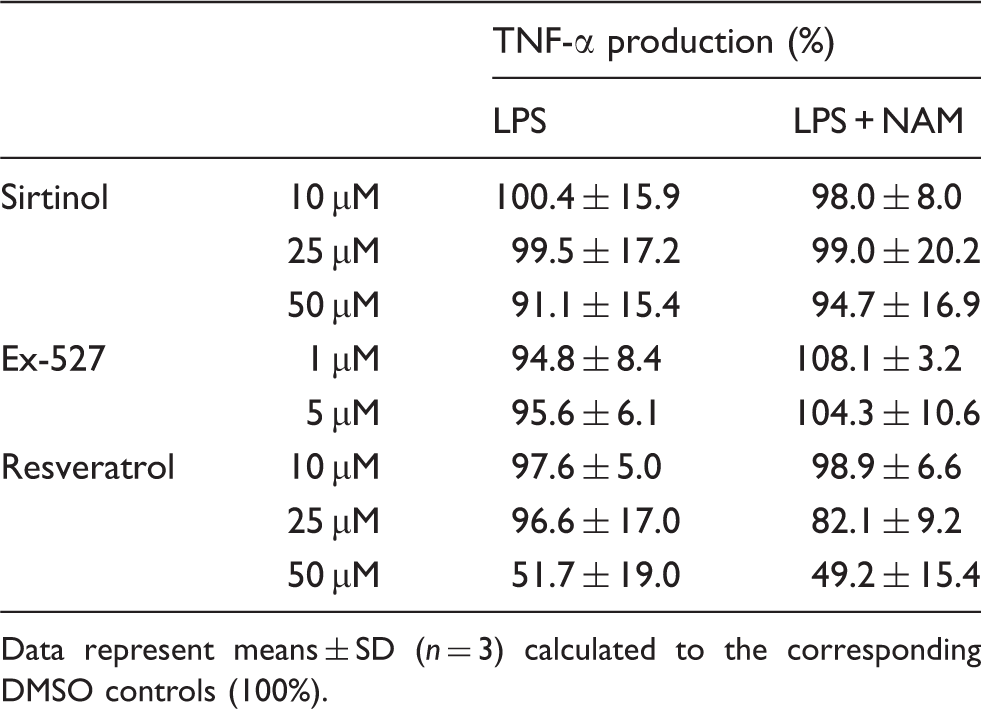
In contrast, resveratrol, a potent activator of sirtuin activity, 31 at 50 µM (a concentration that proved to be nontoxic; data not shown) led to a reduction of the cytokine level. Assuming that sirtuins negatively regulate NF-κB-dependent transcription one would expect LPS-induced TNF-α levels to rise in response to sirtuin inhibitors and to decrease in response to resveratrol. We did indeed observe an inhibitory effect of resveratrol which, however, did not vary between LPS and NAM/LPS-treated cells.
Taken together, as neither sirtuin expression nor resveratrol-mediated reduction of TNF-α levels changed in response to NAM, a role of sirtuins in NAM-induced TNF-α inhibition is difficult to envisage.
Effect of NAM on LPS-induced NF-κB activity
We next reasoned that NAM might exert its effects on LPS-induced functional responses by inactivating the NF-κB transcription factor, which controls up-regulation of the corresponding gene products. The most prevalent form of NF-κB exists as a heterodimer composed of p50 and RelA/p65 polypeptides. In an inactive state NF-κB resides in the cytosol complexed with inhibitory IκB proteins. Upon activation IκB proteins become phosphorylated, resulting in the ubiquitin-mediated degradation of IκB proteins and the nuclear translocation of active NF-κB where it induces gene transcription.
32
Measuring the expression of the native and phosphorylated form of RelA/p65 and IκB at different time points after stimulation we observed an increased phosphorylation of both proteins after 5 min (Figure 6a). Concomitant with the appearance of pIκB, IκB decreased, but both forms started to increase again 30 min later. IκB and RelA/p65 remained phosphorylated for as long as 40 min after incubation. Exposure to NAM led to a slightly reduced phosphorylation of RelA/p65 protein, which varied in the time of its occurrence.
Effect of NAM on NF-κB activity in GM-MØ. GM-MØ differentiated in the presence and absence of NAM (800 µM) were incubated with or without LPS (100 ng/ml) for various times. (a) Cells were lysed and proteins were separated by SDS-PAGE and subjected to immunoblot analysis. The phosphorylated and non-phosphorylated form of NF-κB and IκB were detected by specific Abs. One representative experiment out of three is shown. (b) NF-κB p65 binding activity was measured after 30 min in cell lysates using the NF-κB p65 transcription factor binding ELISA. Bars represent relative activation levels. NF-κB binding activity of stimulated macrophages differentiated in the absence of NAM = 100%. Data represent means ± SEM (n = 3), paired Student’s t-test calculated to controls.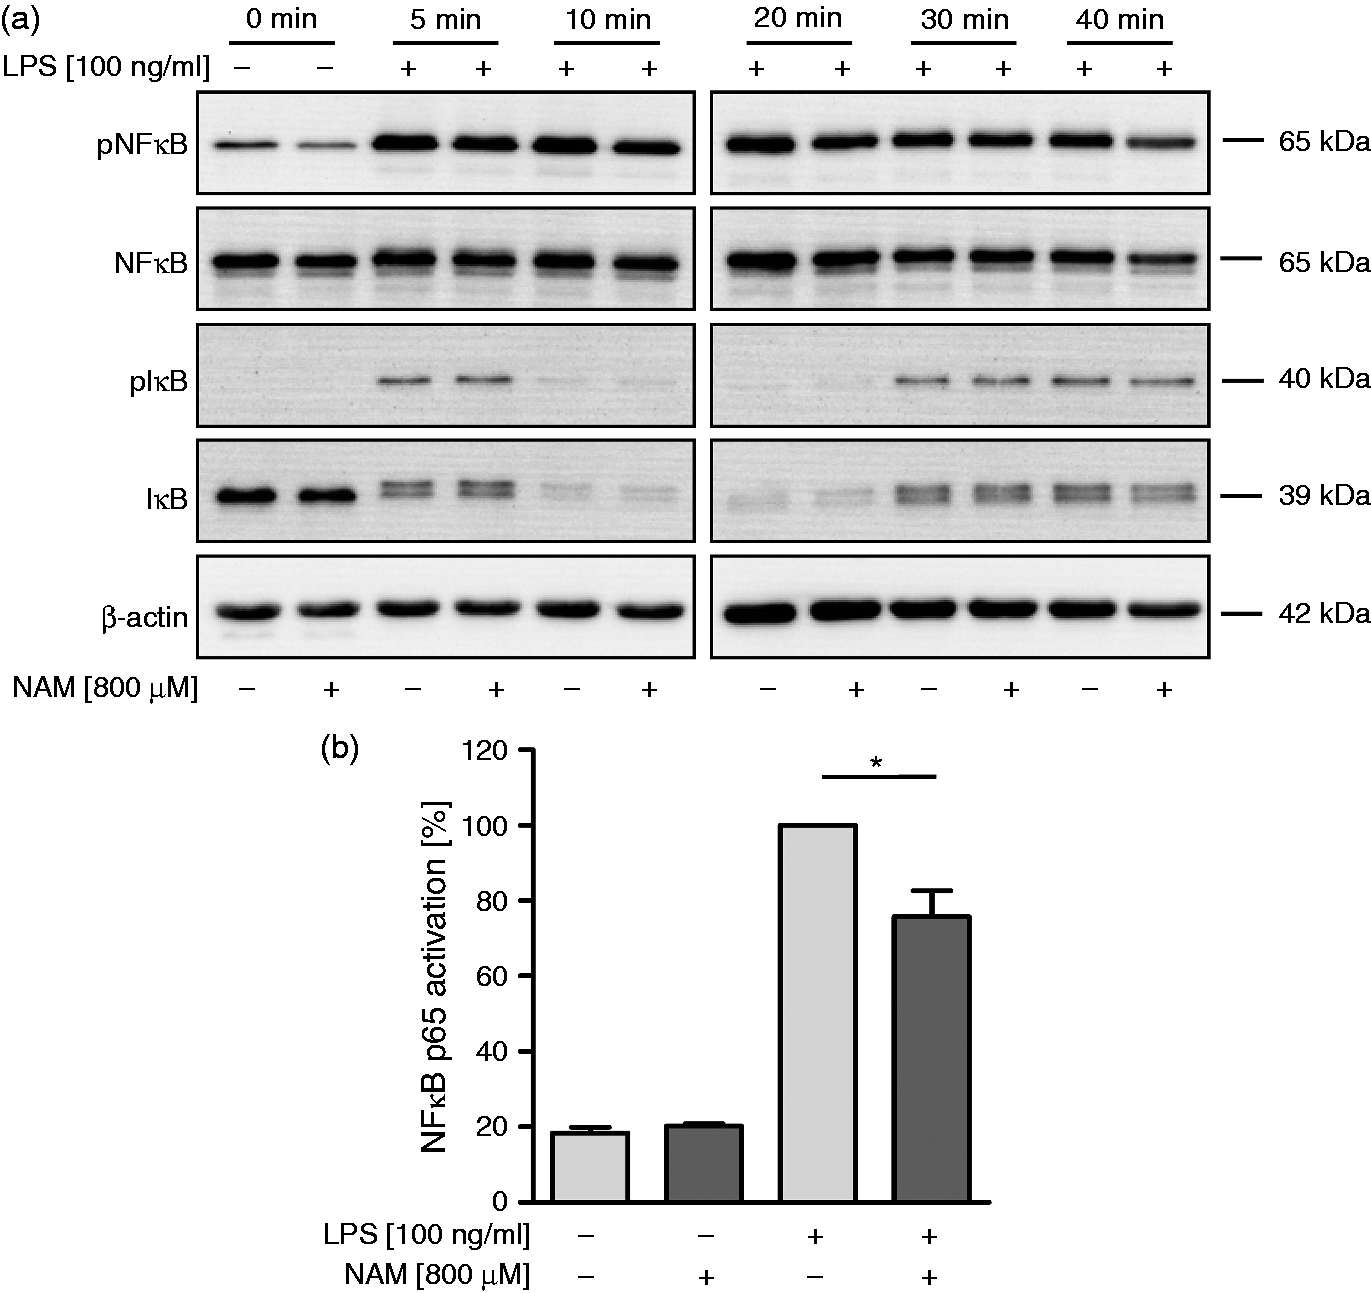
Because of this inconsistency we applied a different method to determine NF-κB activity. We used a commercial ELISA kit based on the binding of the NF-κB subunit to its DNA consensus sequence (Figure 6b). Using this method we found NF-κB activity to be significantly reduced by 24.2 ± 6.9% (mean ± SD; n = 3; 100% = untreated controls), indicating that NAM might modulate nuclear processes involved in the promotor binding of NF-κB.
Discussion
The anti-inflammatory properties of NAM, the amide derivative of vitamin B3, have been well described.33,34 Less clear is the role of NAM in processes associated with cell differentiation. Only recently have Skokowa et al. reported that NAM induced myeloid differentiation of CD34+hematopoietic progenitor cells and that when administered as an oral drug to human subjects, it increases neutrophil numbers in peripheral blood. 10
Here we asked whether or not NAM affects differentiation of monocytes into macrophages. We found that the vitamin influences the GM-CSF-driven (GM-MØ) but not the M-CSF-driven (M-MØ) macrophage differentiation as assessed at the level of morphology. Cells differentiated under GM-CSF conditions in the presence of NAM resemble M-MØ, although they lack the pseudopodial extensions typical of M-MØ.
Treatment with NAM not only results in morphological changes but also in an altered cytokine response. It dampens the production of pro-inflammatory cytokines, thus directing macrophage differentiation into macrophages with a more anti-inflammatory signature. However, as M-MØ-specific characteristics are missing (i.e. up-regulation of IL-10 production) NAM does not induce a switch from GM-MØ to M-MØ.
In keeping with a role for intracellular NAD concentrations in the control of TNF-α production, we measured NAD/NADH levels and the expression of NAMPT in response to LPS and NAM. NAMPT is the rate-limiting enzyme in the NAD salvage pathway, catalyzing the first step in the production of NAD from NAM. 35 This pathway represents the main source of cellular NAD in most mammalian cells. 3 It is generally assumed that increasing the activity of NAMPT concomitantly enhances the intracellular NAD levels and conversely decreasing the activity reduces NAD levels. 36
Although we observed an LPS-induced up-regulation of NAMPT we found NAD levels to decline steadily, indicating that NAD-consuming enzymes and a high glycolytic rate dominate the LPS response. When active, some of these enzymes (i.e. PARP-1) can rapidly reduce NAD levels or even deplete the cell of NAD. 37
The drain on NAD pools that continued during the whole incubation period would be expected to compromise energy production and might explain the appearance of apoptotic cells following LPS stimulation. Eventually, depletion of NAD would also result in a reduced capacity of the cell to generate ATP. Even after treatment with NAM, which led to a slightly enhanced NAD concentration, the apoptosis rate and the general drain on NAD pools did not change. The NAD/NADH pattern described here agrees well with the metabolic pattern of classical activated MØ that, according to Rodriguez-Prados et al., 38 displays a shift toward the anaerobic glycolytic pathway in response to TLR ligands.
In contrast to GM-MØ, monocytes respond to LPS with an increased viability and elevated NAD levels, 39 illustrating a marked difference in the metabolic state of these closely related cell types.
As NAM induced an increase in intracellular NAD concentrations we considered the NAD sensors SIRT1 and SIRT6 as possible candidates regulating TNF-α production.
Both sirtuins, which belong to the class III histone deacetylases, 4 have been identified as negative regulators of NF-κB, a transcription factor involved in LPS-induced TNF-α production. Whereas SIRT1 inhibits NF-κB transcription by directly deacetylating the RelA/p65 subunit of NF-κB at lysine 310, 30 SIRT6 deacetylates the H3 lysine 9 of the NF-κB target gene promoter, thereby repressing gene expression. 29 Less clear than their interaction with NF-κB is their role in immune responses. They have been described as positive, as well as negative, regulators of inflammatory mediators. Thus, van Gool et al., 27 using THP1 cells, postulate that SIRT6 acts by promoting translation of TNF-α, whereas Liu et al. showed that SIRT6 represses TNF-α transcription in THP1 cells, as does SIRT1. 40
In most instances in which SIRT1 was shown to be engaged in modulating NF-κB activity, expression levels of SIRT1 were altered and/or SIRT1 activating and inhibiting compounds had an effect on target gene expression.40,41
Measuring SIRT1 and SIRT6 protein levels we did not observe any significant changes neither in response to LPS nor to pre-treatment with NAM. As sirtuin inhibitors also failed to modulate TNF-α concentrations in LPS or LPS/NAM-treated cells, SIRT1 and SIRT6 are unlikely to play a pivotal role in the here described NAM-induced down-regulation of TNF-α.
Considering that TNF-α gene transcription is under the control of NF-κB and that NAM reduced TNF-α mRNA levels we reasoned that NAM may interfere with NF-κB activity. Consistent with this notion we found NF-κB activity to be decreased, while there was no effect of NAM on TNF-α mRNA stability. Down-regulation of NF-κB activation has also been described by Le Page et al., 42 who exposed LPS-stimulated RAW 264.7 cells for a short time (1.5 h) to high concentrations of NAM (10 mM).
However, the molecular mechanism underlying the NAM-induced down-regulation of NF-κB is not clear. In addition to SIRT1, much attention has been paid to PARP-1 as a modulator of the NF-κB system. 43 The enzyme functions as a transcriptional coactivator of NF-κB, 43 which could explain its role as an enhancer of inflammatory responses. 44
Should PARP-1 be involved in the NAM-induced decrease in TNF-α production, then NAM is most likely to act via inhibiting the enzyme activity.
Whereas functional phenotypes of GM-MØ and M-MØ have mainly been attributed to their cytokine profile little attention has been paid to their less well characterized lipid profile. Thus, before testing the effect of NAM on the lipid metabolism we carried out a detailed analysis of eicosanoids secreted by LPS stimulated and unstimulated GM-MØ and M-MØ. We showed the eicosanoid pattern of activated GM-MØ and M-MØ to be dominated by COX-derived metabolites with GM-MØ secreting significantly higher amounts than M-MØ.
In line with these data different macrophage types such as primary peritoneal and bone marrow-derived macrophages, as well as RAW 264.7 cells, were shown to produce almost exclusively COX metabolites upon activation. 45
Although COX derivatives were initially categorized as pro-inflammatory mediators, the rapid advance in the field of eicosanoids over recent years revealed that some of these derivates such as PGE2 and 15d-PGJ2 can also exert anti-inflammatory effects. 46
Considering that, despite important exceptions, COX-derived metabolites appear to promote acute inflammation the finding that GM-MØ display a strong and M-MØ no or only a weak secretory activity is consistent with the pro- and anti-inflammatory nature of GM-MØ and M-MØ, respectively. Treatment with NAM resulted in a reduced production of most COX-derived eicosanoids in both macrophage subtypes, while eicosanoids produced by the CYP pathway remained unaltered. This means that NAM targets specific pathways in eicosanoid metabolism.
As LPS-induced COX-2 expression has been reported to be under the control of NF-κB the here described NAM-induced diminished NF-κB activity in GM-MØ might be related to the reduced COX-2 mRNA levels. 47 However, although LPS engages NF-κB the contribution of NF-κB to COX-2 transactivation in this cell type has been questioned. Instead, the factors required for the induction of COX-2 appear at least in mouse macrophages to be CREB and C/EBPβ. 48 Whether CREB and C/EBPβ have a role in the induction of COX-2 in human macrophages and to what extent NAM exerts regulatory functions on these factors awaits further study.
Taken together, our results demonstrate that exposure of monocytes to NAM during the differentiation to GM-MØ and M-MØ has a great impact on the morphological and functional parameters of these cells. The concentration of NAM used here (0.8 mM) given twice over a time span of 7 d causes a 20–30% inhibition of secreted key inflammatory cytokines and COX-derived metabolites. As shown in humans these concentrations can be safely reached in vivo. They correspond to plasma levels of patients that were treated with NAM as a modifier of radiotherapy. 49 The vitamin mainly affects differentiation of monocytes to GM-MØ by inducing biochemical alterations that interfere with a subsequent LPS challenge and result in a dampened inflammatory response.
To what extent the vitamin contributes to the altered inflammatory response by modulating the expression of LPS receptor molecules remains to be determined.
Footnotes
Acknowledgements
We thank Dr. Michael Cross (Division of Hematology and Oncology, University of Leipzig, Leipzig, Germany) for critically reading the manuscript.
Funding
This work was partially supported by the Translational Center for Regenerative Medicine (TRM), Leipzig (BMBF 1315883).
Conflict of interest
The authors do not have any potential conflicts of interest to declare.