
Abstract
Innate pro-inflammatory processes, such as chemokine signaling and leukocyte infiltration, predominate during the first 48 h after an acute skeletal muscle injury. However, the time course of chemokine expression and its relationship to leukocyte infiltration after acute muscle injury within this early post-injury time period has not been investigated. In this study, 46 anesthetized female C57BL/6NHsd mice underwent a closed crush injury of the gastrocnemius muscle and were euthanized 4, 8, 24 and 48 h post-injury. Microarray analysis found 14 chemokine genes to be up-regulated during this period, 12 of which are involved in macrophage or neutrophil chemotaxis, with up-regulation peaking at either 8 or 48 h. RT-PCR analysis on select chemokines confirmed the microarray activation pattern. Neutrophil infiltration patterns mirrored the time course of neutrophil-related chemokines with Gr-1-, 1A8- and 7/4-positive neutrophils infiltrating the muscle 4 h after injury, decreasing at 48 h. Conversely, gene expression and relative quantification levels of macrophage-related chemokines Ccl2 and Ccl7 peaked at 8 h, preceding the infiltration of CD68- and F4/80-positive macrophages, and protein expression of Ccl2 in the muscle. The up-regulation of other macrophage-related chemokines and their receptors peaked at 48 h post-injury.
Introduction
Pro-inflammatory processes predominate during the first 48 h after an acute skeletal muscle injury. 1 Acute inflammation is characterized by the migration of leukocytes to the site of injury, beginning with the infiltration of neutrophils and macrophages. 1 Neutrophils from the damaged microvasculature are the first to invade the injured site, where they induce cell membrane damage and initiate the removal of cellular debris. 1 The influx of phagocytic M1 macrophages follows that of neutrophils. 1 M1 macrophages are classically activated macrophages that correspond to and promote the pro-inflammatory response, and have a primary role in the removal of necrotic cells and cellular debris. 2 As part of the phagocytosis and cellular breakdown processes, both neutrophils and M1 macrophages have the ability to secrete free radicals, such as nitric oxide, which cause secondary tissue damage.2,3 The phagocytosis of muscle debris by M1 macrophages may also lead to a reduction of pro-inflammatory, and an increase in anti-inflammatory, cytokines.4,5 These changes facilitate the suppression of M1 phenotype activity approximately 48 h after injury, and induce monocyte differentiation into alternatively activated M2 macrophages, which attenuate the pro-inflammatory response, halt secondary damage and promote muscle repair.1,4 Therefore, the recruitment of neutrophils and M1 macrophages during the first 48 h is critical to muscle recovery.
Neutrophils and M1 macrophages migrate to the injured muscle via chemokine signaling. 6 Chemokines are small cytokines with chemoattractant properties, and belong to one of four families: C, CC, CXC and CX3C. 7 These families are differentiated by the number and order of the amino-terminal cysteine residues and vary in their specific actions by binding to specific seven transmembrane-domain G protein-coupled receptors of the same family.6,8 The C and CX3C families are chemotactic for lymphocytes, 9 while CC chemokines and their receptors are primarily involved in the migration and activation of monocytes, macrophages and lymphocytes. 6 Finally, the CXC family can further be divided into two subgroups based on whether a three-residue motif (ELR) is found adjacent to the CXC motif. Those CXC chemokines that contain ELR have neutrophil specificity. 9
With regard to acute muscle injury, the focus thus far has been on the relationship between chemokines and muscle regeneration. Warren et al. 10 found that at 14 d post-injury, Ccr5- and Ccl2-deficient mice had incomplete muscle recovery, exhibiting increased interstitial fat and collagen. Ccr2−/−mice also displayed signs of impaired regeneration 2 wk post-injury, with large areas of interstitial space, the continued presence of inflammatory cells and a 60% smaller area of regenerating myofibers than wild type (WT) mice. 11 Similarly, Lu et al.12,13 found that regenerated fibers of Ccl2−/−and Ccr2−/−mice, after cytotoxic injury, were smaller than those of WT controls.
These deficits in regeneration may be caused, in part, by incomplete pro-inflammatory processes. Lu et al.12,13 also showed that chemokine deficits (e.g. Ccl2 and Ccr2) reduced M1 macrophage recruitment and delayed phagocytosis. These authors posited that this contributed to the delayed myotube formation in the Ccr2−/− and Ccl2−/− mice. Similarly, in cardiotoxin-induced injured muscle, Martinez et al. 14 found attenuated macrophage infiltration 3 d post-injury, the continued presence of necrotic fibers at 7 d, and smaller regenerating myofibers at 28 d in Ccr2−/− and Ccl2−/− mice. These results indicate that the chemokine activation and leukocyte response during the pro-inflammatory phase may be critical to the success of muscle recovery. Therefore, the purpose of this study was to investigate the time course of gene, mRNA and protein expression of multiple C and CXC chemokines in relation to the leukocyte response in injured skeletal muscle during the early post-injury period.
Materials and methods
Animals
Forty-six female C57BL/6NHsd mice (Mus musculus, 6–9 wk old) were purchased from Harlan Laboratories (Indianapolis, IN, USA) and allowed to acclimate for at least 5 d after arrival. Mice were housed individually, under a 12:12 h light:dark cycle, with food and water available ad libitum. Animal care and use procedures were conducted in accordance with the criteria outlined in the Guide for the Care and Use of Laboratory Animals; 15 these procedures were reviewed and approved by the University of Nevada, Las Vegas and the United States Air Force Institutional Animal Care and Use Committees.
Experimental procedure
Mice were administered buprenorphine (0.05–0.10 mg/kg; Buprenex, Reckitt Benckiser Pharmaceuticals, Richmond, VA, USA). Then, after at least 20 min, mice were anesthetized with inhalant isoflurane (3–4% to effect) and 100% oxygen. Next, a closed crush injury was induced in the right gastrocnemius muscle using the procedure described previously. 16 The left gastrocnemius muscle served as the uninjured control. Mice were administered additional doses of buprenorphine approximately every 12 h after the first dose, for a maximum of three doses.
At 4, 8, 24 or 48 h post-injury, the plantarflexor muscles (gastrocnemius, soleus and plantaris) were collected from the anesthetized mice. After tissue collection, the anesthetized mice were euthanized by cervical dislocation. For the microarray and RT-PCR analysis, the uninjured (left; n = 21) and injured (right; n = 21) gastrocnemius muscles were separated from the soleus and plantaris, flash frozen in liquid nitrogen and stored at −150℃. For immunolabeling, the uninjured (left; n = 25) and injured (right; n = 25) plantarflexor muscles, as a group, were mounted on cork, immersed in melting isopentane cooled by liquid nitrogen and stored at −70℃.
Gene expression-based microarray analysis
Frozen gastrocnemius muscle samples were weighed and RNA was extracted using the Qiagen RNeasy Fibrous Tissue Midi Kit (Qiagen, Valencia, CA, USA) according to the manufacturer’s instructions. The concentration and purity of the RNA was measured by a NanoDrop ND-1000 Spectrophotometer (Thermo Scientific, Wilmington, DE, USA) and recorded. This RNA was used for both microarray and RT-PCR analysis. RNA samples were stored at −70℃ until assayed.
Isolated RNA quality was evaluated for microarray using an Agilent 2100 Bioanalyzer (Agilent Technologies, Santa Clara, CA, USA). Only samples passing this stringent quality control were included for analysis. RNA samples were processed according to the manufacturer’s established protocol for the Affymetrix GeneChip Whole Transcript Sense Target labeling using Affymetrix Mouse Gene 1.0ST arrays (Affymetrix, Santa Clara, CA, USA). Methods included first- and second-strand cDNA synthesis, purification, cRNA synthesis via in vitro transcription, biotin labeling and fragmentation of cRNA, hybridization, washing and staining with fluorescent biotinylated anti-streptavidin Ab, and scanning on an Affymetrix GeneChip 3000 scanner. The Affymetrix GeneChip Command Console software was used for image generation and feature extraction.
After several quality control steps, raw microarray data were pre-processed and analyzed with Bioconductor software. 17 The data were normalized with the Bioconductor RMA package, 18 and the limma package in Bioconductor 19 was then used to identify genes with significant evidence for differential expression. Using a modified t-test in conjunction with an empirical Bayes method to moderate the standard errors of the estimated log-fold changes, P-values were calculated and adjusted for multiplicity with the Bioconductor q-value package. Genes with at least a differential log-fold change of one-fold or greater and P < 0.05 at any of the four time points were considered significant.
RT-PCR analysis
RT-PCR was used to confirm the time course of expression of the chemokines, Cxcl1, Cxcl2, Cxcl5 and Ccl2, and the chemokine receptors Ccr2 and Cxcr2. These were chosen as they are the most frequently studied macrophage- and neutrophil-related chemokines in relation to muscle injury. All primers and the 18S rRNA reference gene were obtained from Applied Biosystems (Grand Island, NY, USA). cDNA was generated from the RNA samples using the Applied Biosystems High Capacity Reverse Transcription Kit (Invitrogen, Foster City, CA, USA) and then stored at −20℃.
RT-PCR plates contained the Applied Biosystems TaqMan Universal PCR Master mix with appropriate primer and 2 µl of cDNA, for a total volume of 25 µl per well. An Applied Biosystems 7300 real-time PCR system was used for amplification, with a thermocycling profile of 50℃ for 2 min, 95℃ for 10 min, 95℃ for 15 s × 40 and then 60℃ for 1 min. The relative chemokine gene expression levels were compared with an 18S reference gene in the gastrocnemius cDNA, and the data were normalized to a pool of uninjured gastrocnemius cDNA from five mice. Differences in gene expression levels were quantified using the ΔΔCt relative quantification (RQ) method performed using the Applied Biosystems 7300 SDS software. Data are expressed as RQ values.
Histology and immunolabeling
Ten-micron-thick serial cross-sections were cut at the location of the hematoma and applied to poly-
To detect the presence of leukocytes, immunolabeling was performed using five primary monoclonal Abs: (i) rat anti-mouse Ly-6C/G, epitope Gr-1 (1:20; Invitrogen, Carlsbad, CA, USA); (ii) rat anti-mouse Ly-6G, epitope 1A8 (1:20; BD Biosciences Pharmingen, San Diego, CA, USA); (iii) rat anti-mouse 7/4 (1:20; AbD Serotec, Raleigh, NC, USA); (iv) rat anti-mouse CD68 (1:100; AbD Serotec); and (v) rat anti-mouse F4/80 (1:20; Invitrogen). Gr-1 (Ly6C/G) and 1A8 (Ly6G) recognize neutrophils, 20 the 7/4 Ab detects neutrophils, monocytes and activated macrophages, 21 and the CD68 and F4/80 Abs detect macrophages.22,23
Additional Abs were used to detect chemokine protein expression in the muscle. A goat anti-rat monocyte chemotactic protein-1 Ab (MCP-1; 1:20; R-17; Santa Cruz Biotechnology, Dallas, TX, USA) with a biotinylated donkey anti-goat IgG-B pre-absorbed secondary Ab (1:200; Santa Cruz Biotechnology) was used to detect Ccl2 protein expression.10,24 To detect the expression of Cxcl2, immunolabeling was performed using a rabbit anti-mouse macrophage inflammatory protein-2 Ab (MIP-2; AAM48; 1:5 dilution; AbD Serotec) and a biotinylated goat anti-rabbit IgG affinity purified (1:200; Vector Laboratories, Burlingame, CA, USA) secondary Ab.
Immunolabeling was conducted as described previously, 25 except for the substrate reaction step. In this study, Vector VIP substrate solution (Vector VIP Substrate Kit; Vector Laboratories) was applied to all sections for 1 (7/4 Ab), 3 (CD68, F4/80, Gr-1, 1A8 and Cxcl2 Abs) or 5 min (Ccl2 Ab).
Image analysis
Quantification of leukocyte Ag immunolabeling was performed using the same computer-assisted approach as described previously.16,26 For the anti-CD68 Ab, an area of interest (AOI) of 1.00 mm2 with the most immunolabeling was captured from the immunolabeled sections of injured and uninjured lateral gastrocnemius muscle. Analysis of the uninjured muscle was performed, and the size of the AOI area was chosen, to account for the resident CD68-positive macrophages present in uninjured muscle. Extraneous muscle features, such as blood vessels, were erased from the AOI; after erasing, the range of the adjusted AOI areas was 0.96–1.00 mm2. A threshold that assigned pixels to immunolabeling within each AOI was then determined. For the F4/80, Gr-1, 1A8 and 7/4 Abs, owing to the absence of neutrophils in uninjured muscle, only immunolabeled sections of injured muscle were analyzed, and the AOI was reduced to 0.07 mm2 to target the injured area.
For each Ab, pixels assigned to immunolabeling within each AOI were converted to area (µm2); this area was divided by the adjusted AOI area and the quotient was multiplied by 100 to calculate the Ab area percentage. After these values were calculated for each adjusted AOI, means ± SE were determined for each group.
Statistical analysis
Data were analyzed using SAS version 9.2. A one-tailed Wilcoxon signed-rank test was used to detect differences in CD68 area percentage between injured and uninjured muscle. Wilcoxon rank sum was used to investigate the difference between the 24 and 48 h post-injury time points for CD68 and F4/80 area percentage. Owing to the multiple time point groups, Kruskal–Wallis tests were performed to investigate differences in Gr-1, 7/4 and 1A8 area percentage and chemokine RT-PCR RQ levels among the four time points (4, 8, 24 and 48 h). Follow-up individual comparisons with Bonferroni adjustments were performed if a significant difference among the four time points was found for any of the dependent variables. The significance level was fixed at the 5% level.
Results
Chemokine expression
Up-regulated chemokines at 4, 8, 24 and 48 h post-injury.
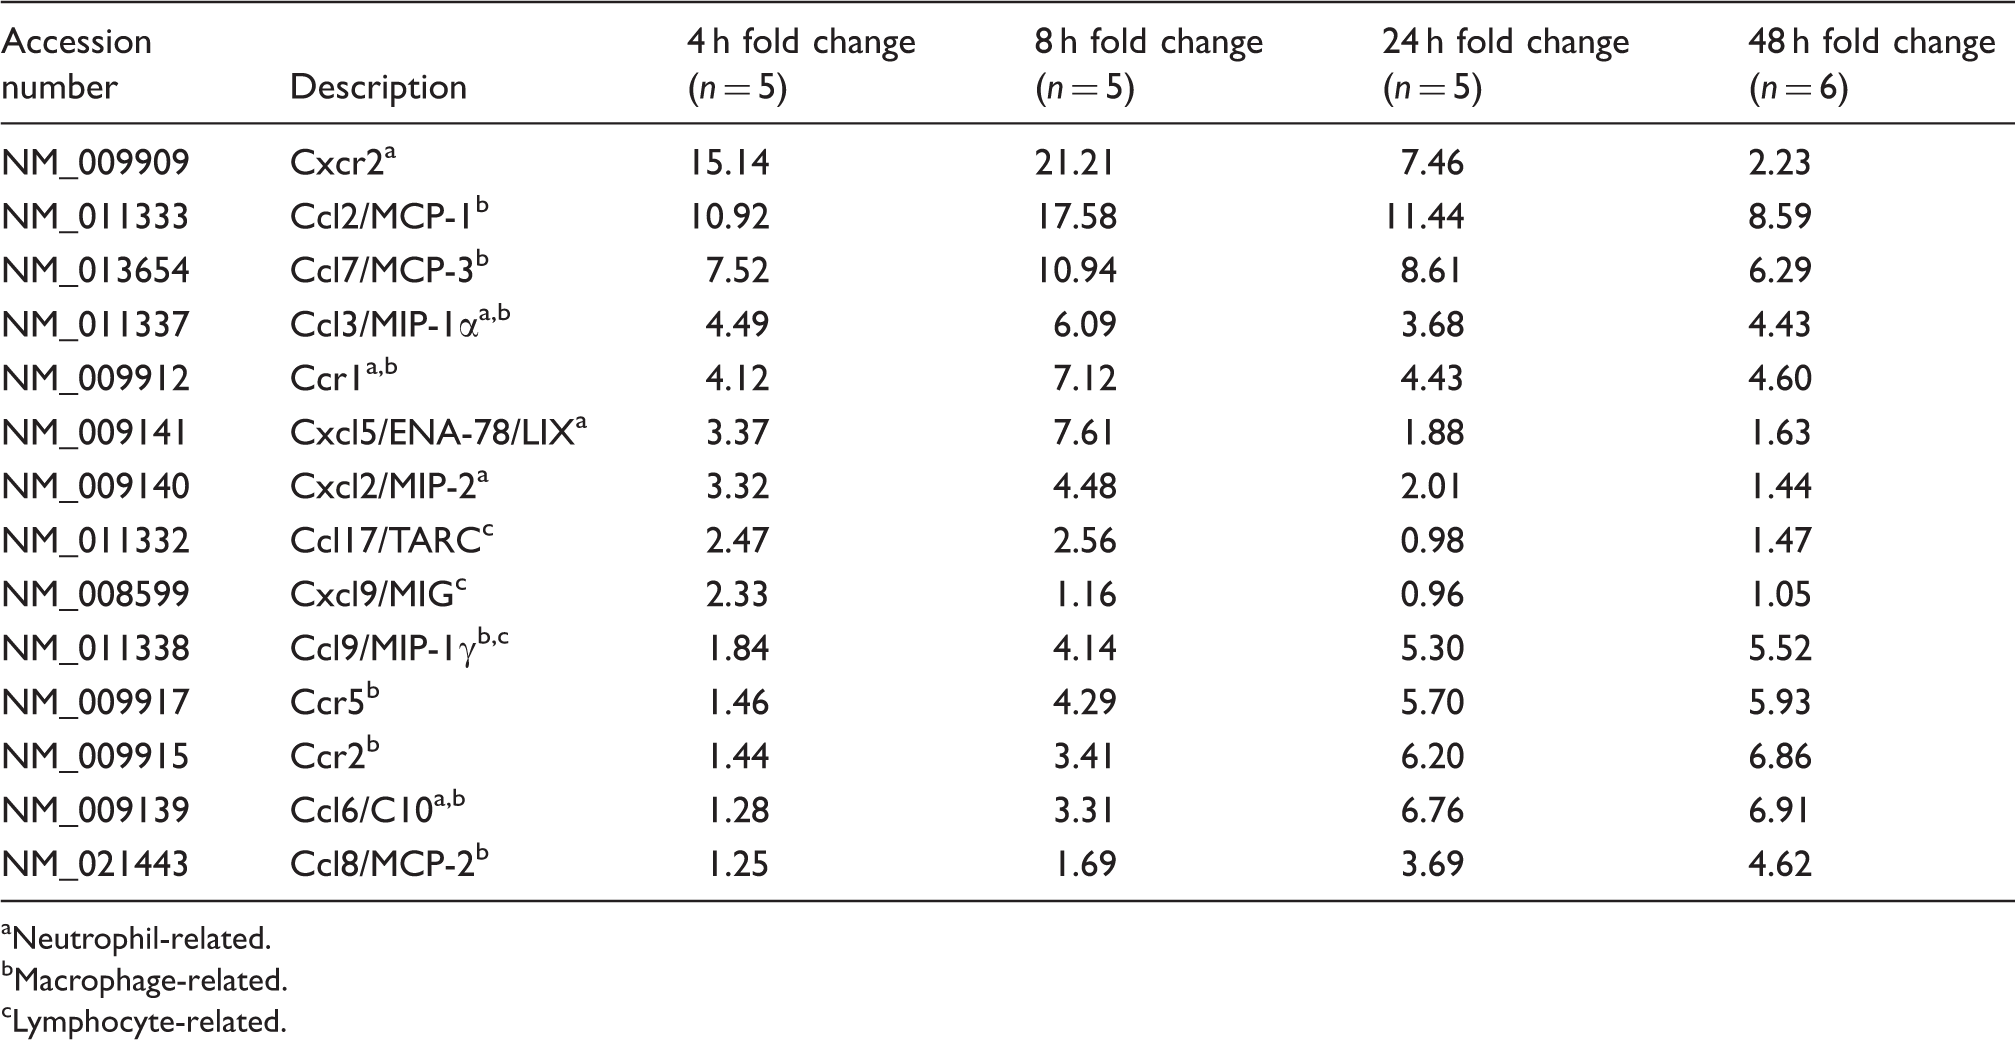
Neutrophil-related.
Macrophage-related.
Lymphocyte-related.
The magnitude and pattern of expression observed in the microarray analysis was confirmed by RT-PCR for Cxcl1, Cxcl2, Cxcl5, Cxcr2, Ccl2 and Ccr2. Except for Ccl2, RQ levels for each chemokine differed significantly over the post-injury time period (Figure 1). While Cxcr2 RQ levels were found to significantly differ over time, there were no statistically significant differences in expression level when comparing 4 h to the 8, 24 and 48 h time points. Cxcl1, Cxcl2 and Cxcl5 RQ levels at 4 and 8 h were significantly higher in comparison with levels at 48 h. Cxcl2 and Cxcl5 had the highest RQ values of the six chemokines and shared the same pattern of activation, peaking at 8 h post-injury and decreasing approximately eight- and sixfold, respectively, through 48 h. Cxcl2 myofiber immunolabeling was observed in injured, but not uninjured, muscle 24 and 48 h post-injury. Cxcl1 RQ levels were also significantly different at 4 and 8 h compared with 48 h, but peaked at 4 h post-injury before decreasing over the post-injury period.
Chemokine RQ levels at 4 (n = 5), 8 (n = 5), 24 (n = 5) and 48 h (n = 6) post-injury. (A) Cxcl1 mRNA levels decreased from 4 and 8 h to return to normal levels at 48 h. (B) Cxcl2 levels were elevated at 4 and 8 h, then decreased at 24 and 48 h. (C) Cxcl5 levels followed the same pattern as Cxcl2 levels. (D) Cxcr2 mRNA levels were highest at 4 h and decreased incrementally over 48 h. (E) Ccl2 mRNA levels were elevated throughout the 48-h period. (F) Ccr2 mRNA levels increased over time to reach peak levels at 48 h post-injury. *4 and 8 h versus 48 h. P < 0.05. Data are means ± SE.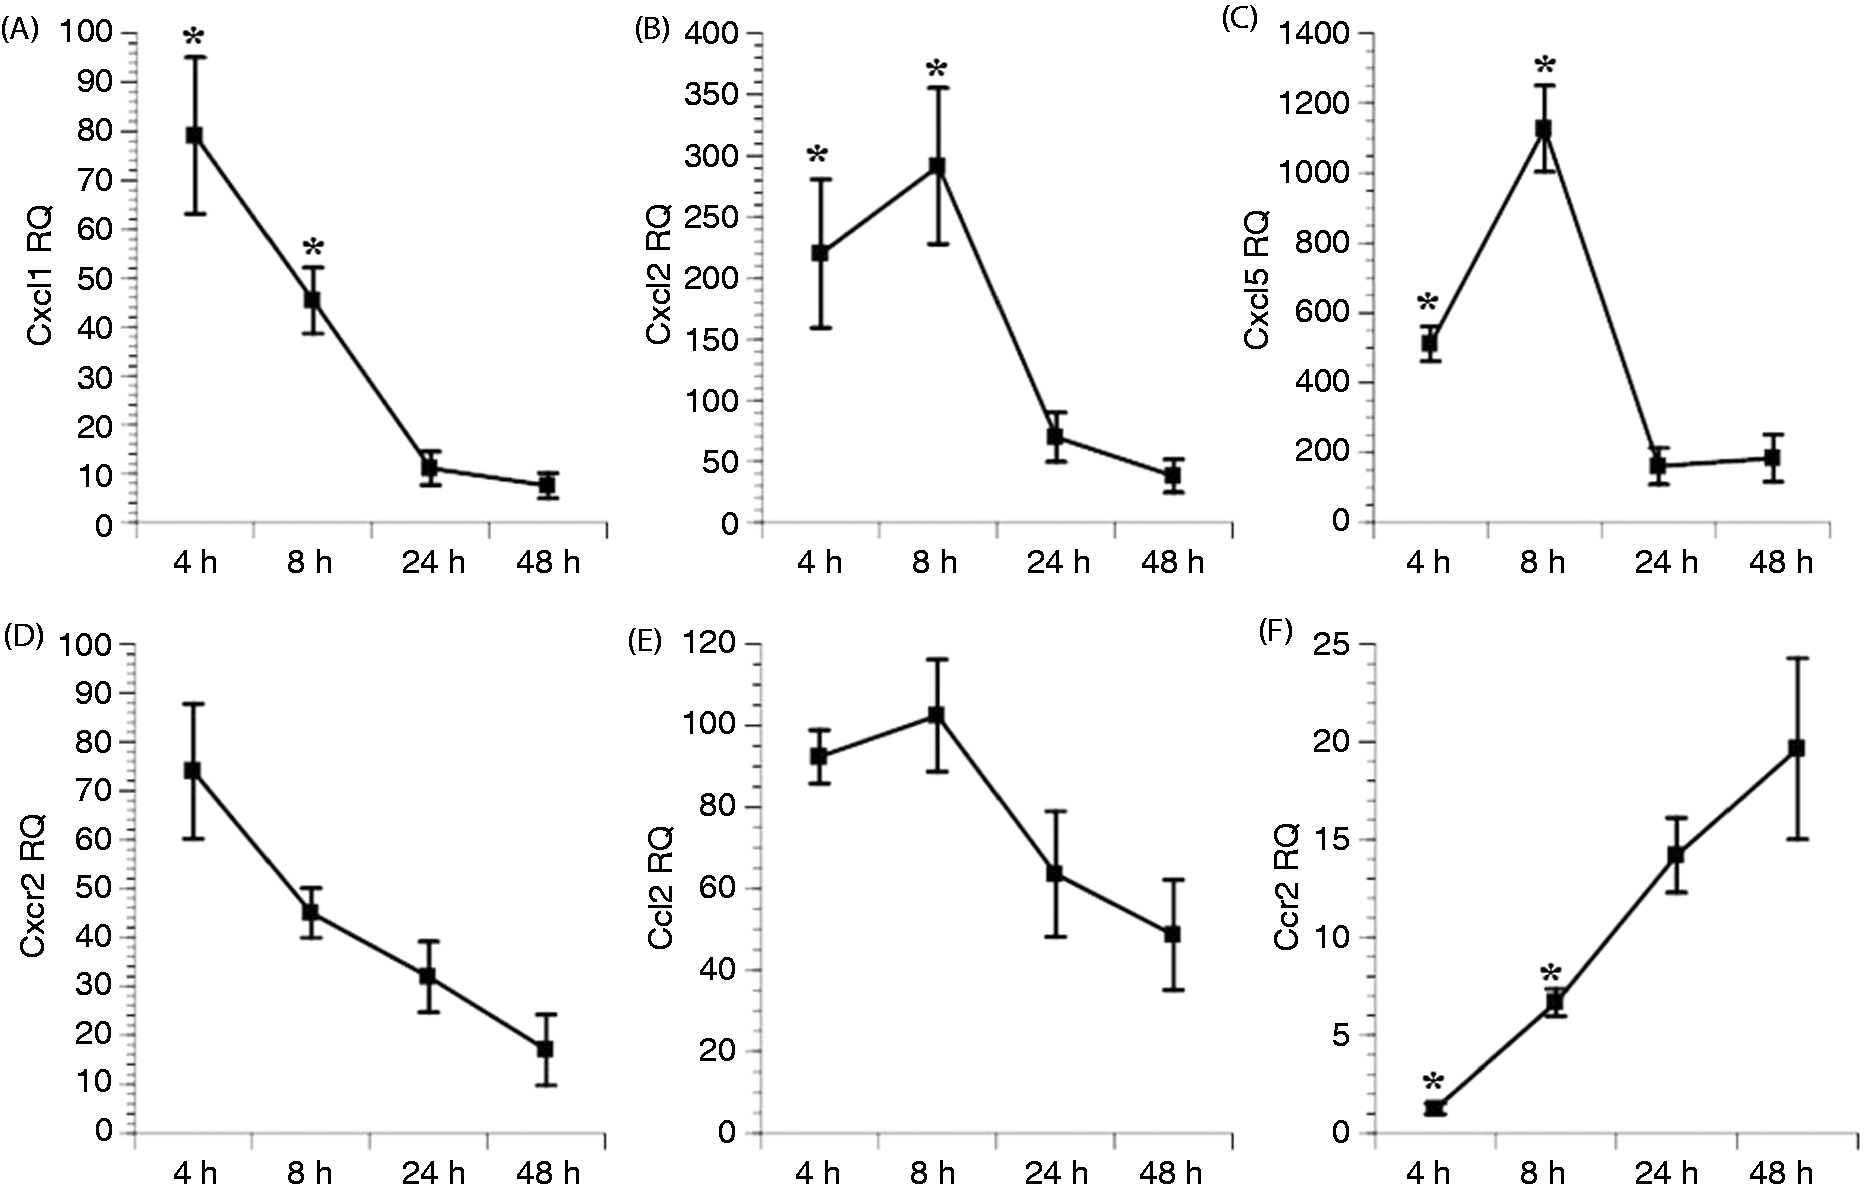
In contrast to the CXC chemokines, Ccr2 RQ levels at 4 and 8 h were significantly lower than at 48 h. The RQ levels of the Ccr2 ligand, Ccl2, peaked at 8 h and remained elevated throughout the 48 h post-injury period. Small, faintly intense Ccl2-positive cells were observed in uninjured muscle, and minimal Ccl2 immunolabeling was observed in 8 h- and 24 h-injured muscle (data not shown). However, at 48 h, increased numbers of larger, strongly intense Ccl2-positive cells were observed in the area of injury (Figure 2C–F).
F4/80 and Ccl2 immunolabeling. (A) F4/80 area percentage increased from 24 (n = 5) to 48 h (n = 5) post-injury. (B) F4/80-positive cells were present in injured muscle at the site of injury. (C) In uninjured muscle, Ccl2-positive cells were small and of light-to-medium intensity. (D) Hematoxylin and eosin staining showed pale fibers and some spacing caused by edema. (E) PBS control of injured muscle was negative. (F) Ccl2 immunolabeling of injured muscle. *Same fiber in each image, bar = 100 µm. †Approached significance. Note: all images are from uninjured or injured muscle at 48 h post-injury.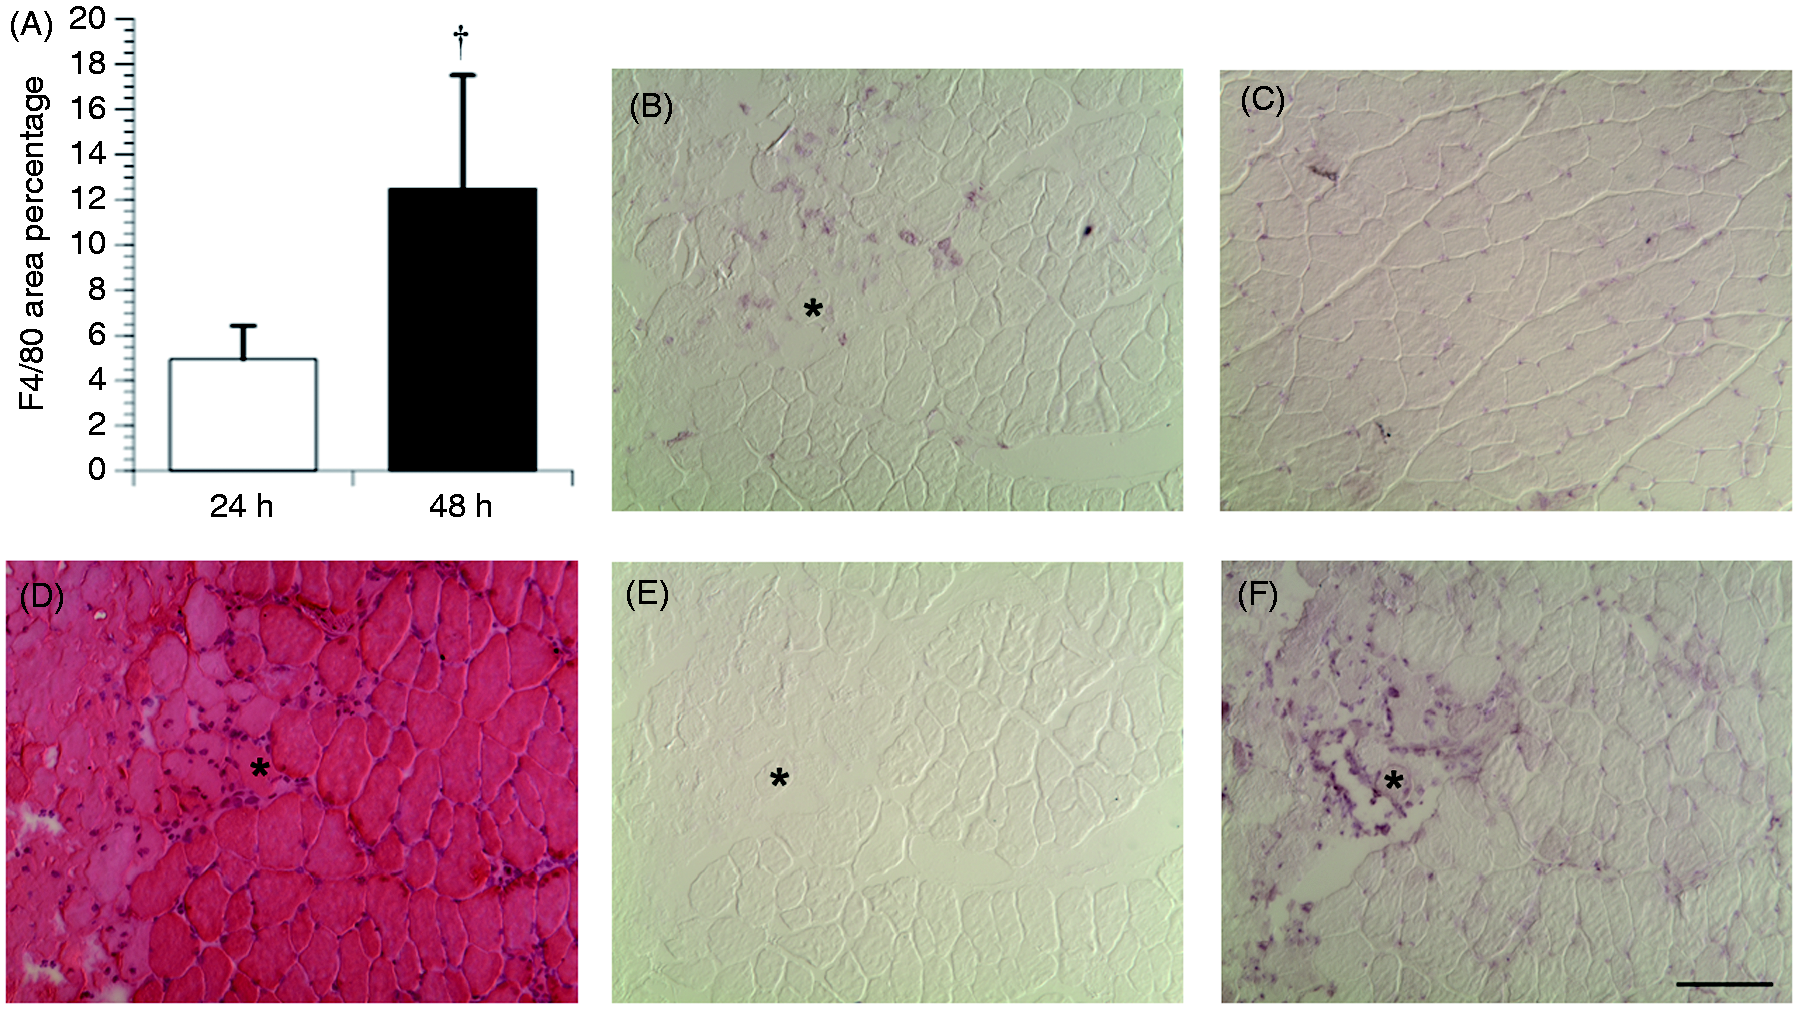
Leukocyte infiltration
Neutrophils
Gr-1-, 1A8- and 7/4-positive cells were not consistently observed in uninjured muscle. The area percentage for these Abs was elevated as early as 4 h post-injury (Figure 3A). Gr-1 and 1A8 area percentage significantly decreased from 4 to 48 h. However, 7/4 area percentage remained elevated during the post-injury period.
Neutrophil infiltration and Cxcl2 expression. (A) Area percentage of Abs anti-Gr-1, anti-1A8 and 7/4 at 4 (striped bars; n = 5), 8 (cross-hatched bars; n = 10), 24 (white bars; n = 5) and 48 h (black bars; n = 5) post-injury. Medium intense clustered and discrete anti-Gr-1 immunolabeling was present in injured muscle at (B) 4 h, (C) 8 h and (D) 24 h post-injury. (E) Lighter, discretely distributed anti-Gr-1 immunolabeling was observed 48 h post-injury. Medium intense Cxcl2 myofiber immunolabeling was observed at (F) 24 h and (G) 48 h. *P < 0.05. Bar = 100 µm.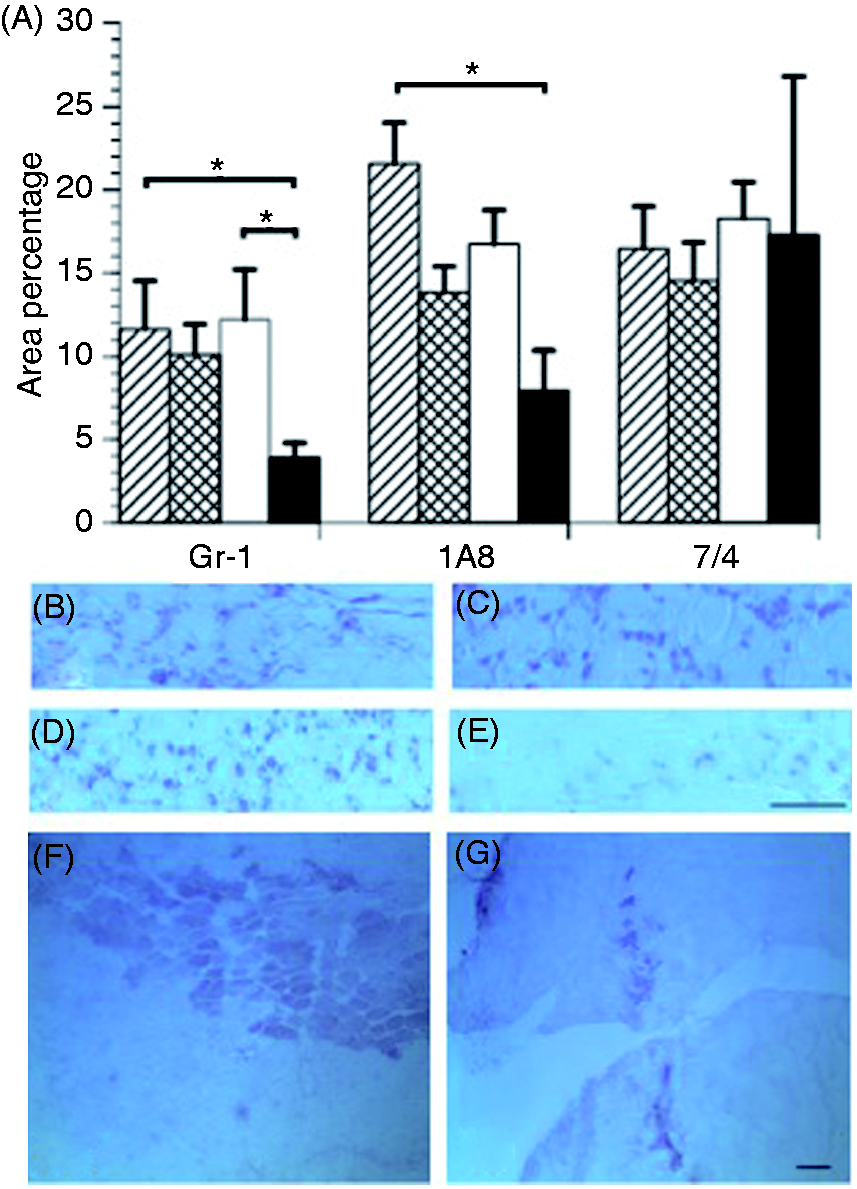
The general appearance and location of Ab-positive cells was similar between Gr-1, 1A8 and 7/4. At 4, 8 and 24 h post-injury, these cells exhibited medium intensity, appeared as discrete cells or in clusters, and were located within connective tissue and myofibers. At 48 h post-injury, positive cells were of lighter intensity, discrete and localized to connective tissue (Figure 3B–E).
Macrophages
At 24 and 48 h post-injury, there were significant differences in CD68 area percentage between injured and uninjured muscle (P < 0.05; Figure 4). In contrast to Gr-1, 1A8 and 7/4 area percentage, there was no increase in CD68 area percentage at 4 or 8 h post-injury. However, there was a significant increase in CD68 area percentage from 24 to 48 h (P = 0.03). The pattern and location of CD68-positive cells also varied from 24 to 48 h. At 24 h post-injury, CD68-positive cells were of strong intensity and discretely distributed in connective tissue, while at 48 h CD68-positive cells were clustered in connective tissue and myofibers.
CD68 area percentage. (A) CD68 area percentage was greater in injured (white bars) than in uninjured (black bars) muscle at 24 (n = 5) and 48 h (n = 5) post-injury. (B) Few CD68-positive macrophages were observed in uninjured muscle at 48 h post-injury. (C) CD68-positive macrophages were present in injured muscle at 24 h, before the peak in the area percentage of CD68-positive macrophages at (D) 48 h post-injury. *P < 0.05. Bar = 100 µm.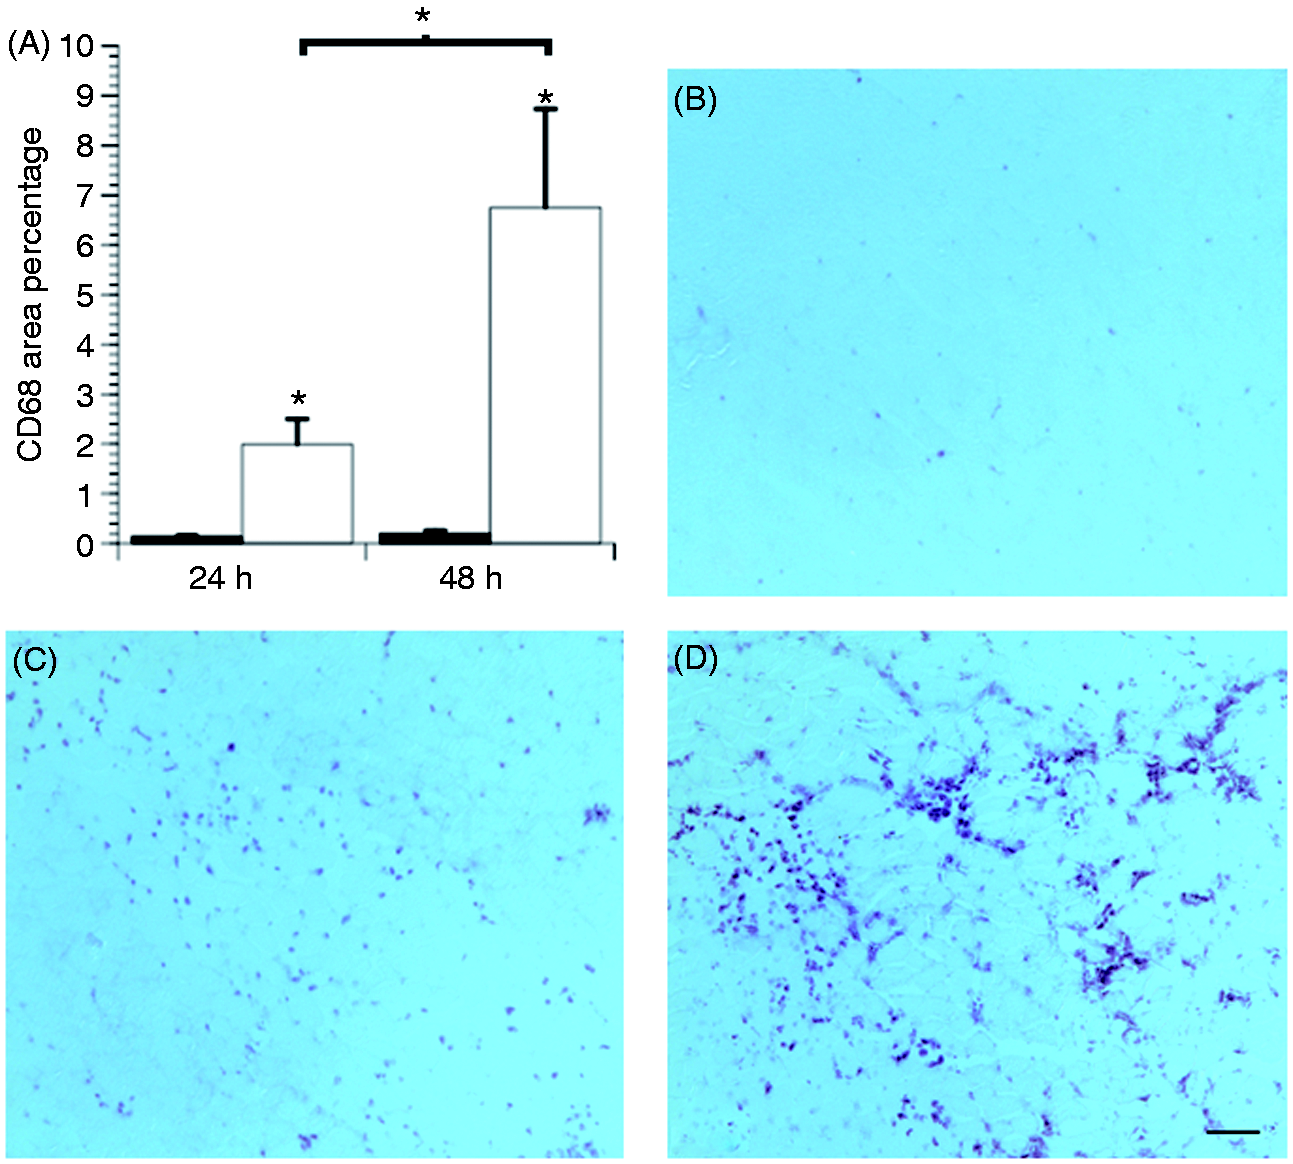
F4/80-positive cells were not consistently observed in uninjured muscle or at 4 and 8 h post-injury. At 24 and 48 h post-injury, an increase in area percentage of F4/80-positive cells was present in the injury area. The increase in F4/80 area percentage from 24 to 48 h approached significance (P = 0.06). Unlike CD68-positive cells, F4/80-positive cells were moderately intense and detected as clusters and within myofibers at 24 and 48 h post-injury (Figure 2A,B).
Discussion
Although certain CC and CXC chemokines are known to be up-regulated during muscle inflammation and/or muscle regeneration,27–29 this study is the first to explore a repertoire of chemokine gene expression, and neutrophil and macrophage Ags at multiple time points during an early post-injury period. The major discovery is that neutrophil-related and certain macrophage-related CC chemokines have elevated expression 4 and 8 h post-injury. This elevation coincides with peak Gr-1, 1A8 and 7/4 neutrophil infiltration, but precedes CD68 and F4/80 macrophage infiltration. Additionally, other macrophage-related CC chemokines peaked at 48 h post-injury.
These data indicate a collective bimodal peak up-regulation of macrophage-related chemokines after acute crush muscle injury. Although Paoni et al. 28 showed certain macrophage-related chemokines up-regulated as early as 4 h post-injury, most investigations have focused on the time points coinciding with macrophage infiltration, 24 and 48 h post-injury.10,27 Our data extend these findings by examining mRNA via microarray and RT-PCR levels at two points, before and at macrophage infiltration. Specifically, we found that Ccl2 and Ccl7 are up-regulated during the first 24 h, while the remaining macrophage-related ligands and receptors, Ccr2 and Ccr5, are more highly expressed towards the end of the early post-injury period. The up-regulation of these chemokines at 48 h is consistent with the findings of Hirata et al. 27 who reported the up-regulation of CC chemokines, including Ccl6, Ccr2 and Ccr5, 48 h after muscle injury.
A collective bimodal peak up-regulation could have functional significance for the appearance of M1/M2 macrophage phenotypes. The up-regulation of macrophage-related chemokines, such as Ccl2 and Ccl7, in the first 24 h may be linked to the recruitment and activation of the phagocytic M1 phenotype. Tsou et al. 30 established a role for Ccl2 and Ccl7 in mobilizing Ccr2-positive monocytes from the bone marrow to injured tissue. Monocytes with positive Ccr2 receptor expression characterize a subset of blood monocytes known as ‘inflammatory monocytes,’ which migrate to sites of inflammation, and are therefore likely to have a pro-inflammatory role. 31 Furthermore, Lu et al. 13 showed the Ccr2 receptor to be integral in the recruitment of phagocytic macrophages into muscle following injury.
The presence of M1 macrophages begins to decline significantly at 48 h, coinciding with an increase in the muscle repair and regeneration associated M2 phenotype. 32 Therefore, recruitment and activation of M2 macrophages may be performed by the CC chemokines peaking in up-regulation at 48 h post-injury. However, while separated temporally, the activation of the two macrophage phenotypes is closely linked. Arnold et al. 4 suggested that the phenotype switch from M1 to M2 is reliant upon the phagocytosis of debris by M1 macrophages and occurs 48 h after injury. That is, after phagocytosis of necrotic muscle cell debris, M1 macrophages secrete anti-inflammatory IL-10, which induces monocyte differentiation into the M2 phenotype. 4
Alternatively, the up-regulation of certain chemokines hours before the infiltration of CD68- and F4/80-positive macrophages may signify a lag in the timing of these signaling pathways in C57BL/6 mice. These mice have low levels of circulating monocytes; 33 therefore, early up-regulation of certain CC chemokines may be needed for the infiltration of macrophages at 24 and 48 h post-injury. Our findings and those of others10,29 suggest that the recruitment of macrophages via these signaling pathways takes time. In this study, Ccl2 RQ levels were elevated as early as 4 h; however, increased Ccl2 immunolabeling and peak macrophage infiltration was not observed until 48 h post-injury.
With few circulating monocytes to enter the muscle immediately after injury, one possible source of these chemokines, which initiate the infiltration of bone marrow-derived macrophages during the first 24 h, is the resident macrophage. Arnold et al. 4 reported that resident F4/80-positive macrophages from notexin-induced injured tibialis anterior muscle produced a larger amount of Ccl2 than exudate, infiltrating F4/80-positive macrophages. 34 Henderson et al. 35 also reported resident macrophage populations as a source of Ccl2 for the recruitment of blood monocytes to the peritoneum within 2 h of inflammation.
The current macrophage-related chemokine gene, Ccl2 protein and macrophage infiltration findings also contribute to understanding the relationship between chemokine activation and macrophage infiltration time courses. Ccl2 protein expression follows a similar pattern to both CD68- and F4/80-positive cellular infiltration, as all are significantly increased at 48 h. Therefore, macrophage infiltration and macrophage-related chemokine protein expression may be closely linked, which may represent tight chemokine regulation of macrophages.
Additionally, the results of this study expand our understanding of the time course of chemokine genes by indicating that Ccl6, Ccl8, Ccl9, Ccr2 and Ccr5 begin to be up-regulated as early as 8 h post-injury. Ccr2 and Ccr5 have previously been shown to be significantly up-regulated at 24 h,10,28 but not 4 h, post-injury. 28
Unlike the up-regulation of macrophage-related chemokines, the RQ levels of neutrophil-related chemokines had one peak in elevation before declining. Previously, Paoni et al. 28 and Brigitte et al. 34 reported up-regulation and increased protein levels of Cxcl1 at 4, 12, 24 and 72 h post-injury; Paoni et al. 28 found this same sustained elevation of Cxcl2 and Cxcl5. In contrast to these findings, Cxcl1, Cxcl2 and Cxcl5 expression levels in this study had almost returned to normal at 24 h. Therefore, while the initial timing of expression of these three chemokines is similar to previous research,28,34 the duration of the elevated levels is different.
One possible explanation for this difference could be the type of muscle injury model used in the previous studies. Paoni et al. 28 used hind-limb ischemia, which involves surgical isolation of the artery and long-term ligation, and Brigitte et al. 34 injected the chemical toxin notexin, which affects myofibers and surrounding cells. In contrast, our model is a short-term, targeted mechanical insult. Therefore, the pro-inflammatory response in our model may resolve more quickly.
In this study, despite the decline in the expression of neutrophil-related chemokines, Cxcl1, Cxcl2 and Cxcl5 at 24 h, Cxcl2-positive myofibers, and Gr-1- and 1A8-positive cells were present at 48 h post-injury. This delay between the up-regulation of Cxcl2 gene expression and the appearance of the chemokine in the muscle has been reported previously. Hua et al. 36 found that Cxcl2 mRNA was up-regulated in injured muscle at 4 and not 24 h, but immunohistochemistry did not show protein in the muscle until 24 h.
While the area percentage of 7/4-positive cells did not significantly decrease at 48 h, this result is most likely due to a sample outlier. We do not believe that the presence of 7/4-positive cells in our study is indicative of monocyte infiltration for two reasons. First, at 4 h post-injury when 7/4-positive cells were first detected, no F4/80-positive cells were observed. Both Henderson et al. 35 and Rosas et al. 21 found that 7/4-positive monocytes and/or macrophages highly express the F4/80 Ag. Second, the 7/4-positive cells present at 4 and 8 h post-injury exhibited the same distribution as the Gr-1- and 1A8-positive cells, suggesting that in this study Gr-1, 1A8 and 7/4 are expressed on the same cells—neutrophils.
In conclusion, while the first 8 h after injury are critical for expression of neutrophil-related chemokines, there is a collective bimodal activation pattern of macrophage-related chemokines at 8 and 48 h. Further research is needed to assess when these neutrophil-related and 48 h macrophage-related chemokines appear in the muscle. In vivo studies that assess the chemokine response together with the resulting leukocyte infiltration would confirm and extend these observational findings. Future research should also investigate the functional significance of this bimodal peak and its possible role in activating different macrophage phenotypes. Finally, an investigation into the effect of these findings on muscle repair and regeneration would be of interest as this study provides insight into the administration timing of potential therapies promoting macrophage-related mechanisms of muscle repair processes.
Footnotes
Funding
This work was supported by the Air Force Surgeon General’s Office under agreement number FA7014-10-2-0001 (awarded to BS). The views and conclusions contained herein are those of the authors and should not be interpreted as necessarily representing the official policies or endorsement, either expressed or implied, of the Air Force Surgeon General’s Office or the U.S. Government.
Acknowledgments
We would like to thank Federico M. Farin, Theo Bammler, James Macdonald and Jesse Tsai for their assistance with the microarray analysis, and Ayelet Goldshmid for her technical assistance. We also thank Kirsten Speck for her editorial assistance.