
Abstract
Background
Frailty is a multi-dimensional syndrome of reduced reserve, resulting from overlapping physiological decrements across multiple systems. The contributing factors, temporality and magnitude of frailty’s effect on mortality after ICU admission are unclear. This study assessed frailty’s impact on mortality and life sustaining therapy (LST) use, following ICU admission.
Methods
This single-centre retrospective observational cohort study analysed data collected prospectively in Glasgow Royal Infirmary ICU. Of 684 eligible patients, 171 were frail and 513 were non-frail. Frailty was quantified using the Rockwood Clinical Frailty Scale (CFS). All patients were followed up 1-year after ICU admission. The primary outcome was all-cause mortality at 30-days post-ICU admission. Key secondary outcomes included mortality at 1-year and LST use.
Results
Frail patients were significantly less likely to survive 30-days post-ICU admission (61.4% vs 81.1%, p < 0.001). This continued to 1-year (48.5% vs 68.2%, p < 0.001). Frailty significantly increased mortality hazards in covariate-adjusted analyses at 30-days (HR 1.56; 95%CI 1.14–2.15; p = 0.006), and 1-year (HR 1.35; 95%CI 1.03–1.76; p = 0.028). Single-point CFS increases were associated with a 30-day mortality hazard of 1.23 (95%CI 1.13–1.34; p < 0.001) in unadjusted analyses, and 1.11 (95%CI 1.01–1.22; p = 0.026) after covariate adjustment. Frail patients received significantly more days of LST (median[IQR]: 5[3,11] vs 4[2,9], p = 0.008).
Conclusion
Frailty was significantly associated with greater mortality at all time points studied, but most notably in the first 30-days post-ICU admission. This was despite greater LST use. The accrual effect of frailty increased adverse outcomes. Point-by-point use of frailty scoring could allow for more informed decision making in ICU.
Introduction
Definition of frailty
Frailty is a syndrome which stems from biochemical and physiological decrements across multiple systems.1,2 Underlying pathophysiological processes relate to sarcopenia, neuromuscular weakness, reduced oxygen utilisation, inflammation and immunosenescence.1,2 Core phenotypic features of frailty include exhaustion, unintentional weight loss, reduced physical activity and weakness.1,3,4 These deficits aggregate, leading to reduced reserve and ability to maintain homeostasis in the face of external stressors.1,2,4,5 This can increase vulnerability to disability, dependence, falls, hospitalisation and mortality.1,2,4,6
Allocation of ICU resources
The prevalence of frailty increases with age, yet it is not an inescapable component of growing old.1,7,8 Frailty can occur at any age and may develop earlier in the critically ill. 5 Nevertheless, since an increasing number of elderly patients are admitted to the intensive care unit (ICU),9,10 the prevalence of frail ICU admissions, currently approximately 30%,2,11 will likely rise too. ICUs must have well defined policies to balance under and over-utilisation of finite resources.
Older age has been associated with lower ICU treatment intensity. 12 With frailty prevalent in this demographic, could its correlation with mortality2,6,13 in critical illness relate to a propensity to limit or withhold life sustaining therapy (LST) e.g. renal replacement therapy (RRT), vasopressors and ventilation? Previous studies5,11,12,14–19 report mixed findings and therefore highlight a necessity for addressing this concern.
Utility in decision making
In ICU, potential recovery must be balanced against the risk of excessive therapeutic escalation and potential opportunity cost for other patients. 20 Despite advancing treatments, ICU holds no guarantee for recovery. Critical illness survivors commonly develop post-ICU syndrome – a constellation of cognitive dysfunction, depression, anxiety and post-traumatic stress disorder combined with profound physical weakness. 21 The clinician’s duty to patient care must not be confused with a requirement to initiate or continue medically futile treatments which may inflict more harm than good.20,22
Currently, prognostication of critical illness utilises measures of acute physiology derangements to align severity of illness with probability of survival. 1 Commonly used tools include APACHE-II, 23 SOFA 24 and SAPS-II. 25 These scores have a lower discriminatory power in elderly patients, resulting in significant prognostication error.26–28 Frailty, shown to predict risk of death better than age29–31 or comorbidity in isolation, 32 provides a desirable estimate of an individual’s physiological age. 1 Its integration of biochemical, physical and cognitive function represents a robust predictor of vulnerability and ‘recoverability’ 29 – paramount in consideration of both survival, and consequent quality of life. Incorporating measures of frailty into future scoring systems, to account for key factors of overall health, could increase predictive accuracy of outcomes and guide decision making for appropriate ICU admissions and interventions.5,33–35
Previous study, hypothesis and objectives
Owing to its relationship with decreased resilience to physiological stressors,1,3,15,31 we hypothesised that frailty would be independently associated with greater mortality at all-time points. Our previous study, 6 qualitatively identified the largest mortality disparity for frail patients was between ICU admission and 30-days, however this time-point was not specifically studied. Therefore, the a priori primary objective of this study was to investigate the relationship of frailty and mortality 30-days after ICU admission. Secondary objectives included investigating the effect of frailty on mortality at 1-year, with greater power and precision than our previous study, and determining frailty’s relationship with ICU use – in terms of length of stay (LOS) and LST requirements.
Methods
Study design, location and participants
This single-centre retrospective observational cohort study analysed data collected prospectively between 25/2/2016 to 8/5/2018. All adult (≥18 years) patients admitted to Glasgow Royal Infirmary ICU who had their frailty score completed at ICU admission were screened for inclusion. If a patient had multiple ICU stays within the study period, the initial stay was included. ICU readmissions and those with ICU LOS <24 hours were excluded. The extension of our previous inclusion period allowed the patients included in our prior study 6 to be investigated in conjunction with a new cohort of patients.
Defining and assessing frailty
At ICU admission, frailty was assessed using the Rockwood Clinical Frailty Scale (CFS).32,36 Scores range from 1 to 9; ascending the scale represents declining independence, decreasing activity and diminishing resilience to adverse events. 32 Assigned scores represented the clinician’s best clinical judgement of baseline health and its trajectory before hospital admission/acute illness. This information was acquired from history taking from the patient/proxies, examination and medical records. The CFS was dichotomised, classifying frail as CFS ≥5 and non-frail as CFS <5. This represents a clinically significant threshold of functioning and reserve, and is common in the literature, aiding comparison to other publications.
Data management and outcome measures
During ICU admission, CFS, age, sex, physiological observations and routine blood results were recorded on electronic charts. Measurements recorded within the first 24 hours of ICU admission were used to calculate the acute component of the APACHE-II score and its related predicted hospital mortality, whilst the chronic component was derived from medical records. LST use was recorded throughout the ICU stay.
The primary outcome was all-cause mortality at 30-days. Secondary outcomes included mortality at 1-year, LST use in the index admission, and ICU use over the entire study period. These outcome measures were prospectively recorded on clinical databases during the study period. Data for follow-up outcome measures were collected from clinical database searches ≥1 year after the end of the inclusion period.
Ethics
The NHS Greater Glasgow and Clyde Research and Development department and West of Scotland Research Ethics Committee 4 authorised this research project. As this was a retrospective analysis of routine clinical data, explicit consent from patients was not required.
Statistical analyses
The prevalence of frailty in ICU for ages ≥18 was estimated at 30%.2,6 30-day mortality was estimated at 20%.2,6,37 The unadjusted hazard ratio (HR) for 30-day mortality associated with frailty was estimated to be 2.0 (2, 6). The Pearson correlation coefficient was estimated at 0.5 (6). For statistically significant results (5% significance level) at ≥80% power, the pre-hoc estimated required sample size was 778.
Differences in baseline characteristics and outcome measures were analysed between the frail (CFS ≥5) and non-frail (CFS <5) groups. Welch’s t-test and the Wilcoxon signed-rank test analysed normally distributed and non-normally distributed continuous data respectively. Fisher’s exact test analysed categorical data. Survival analyses started 24 hours after ICU admission. Log-rank tests investigated between-group survival differences. The hazards of 30-day and 1-year mortality associated with factors known 24 hours after ICU admission were investigated in univariate analyses. Subsequently, factors independently associated with survival (p < 0.1), were entered into a multi-variate Cox proportional hazard model. The Brier score was used to calculate the average inaccuracy of APACHE-II predicted in-hospital mortality. Sub-group analyses (CFS:1-2; 3-4; 5-9), alongside unadjusted-adjusted Cox proportional hazard modelling on each CFS point, investigated a dose-response relationship between frailty and mortality. Statistically significant p-values were defined as <0.05. All analysis was completed using R version 3.4.1 software.
Results
Screening and prevalence of frailty
684 patients were eligible for inclusion. This included the previously studied cohort. 6 Of 1316 patients screened, 48.0% were ineligible; 342 (26.0%) had incomplete CFS scores, 192 (14.6%) had ICU LOS <24 hours, 82 (6.2%) had already been admitted to ICU within the inclusion period and 16 (1.2%) were <18-years-old. A large proportion of patients had incomplete CFS scores, as this was not consistently implemented on all patients when scoring was initiated in this unit. Data on ineligible patients were excluded. No patients were lost to follow-up. Of the 684 patients analysed, 171 (25.0%) were frail and 513 (75.0%) were non-frail (Figure 1). There was a positively skewed distribution of frailty scores, with very few ICU patients fulfilling the criteria for very severely frail or terminally ill (Figure 2).
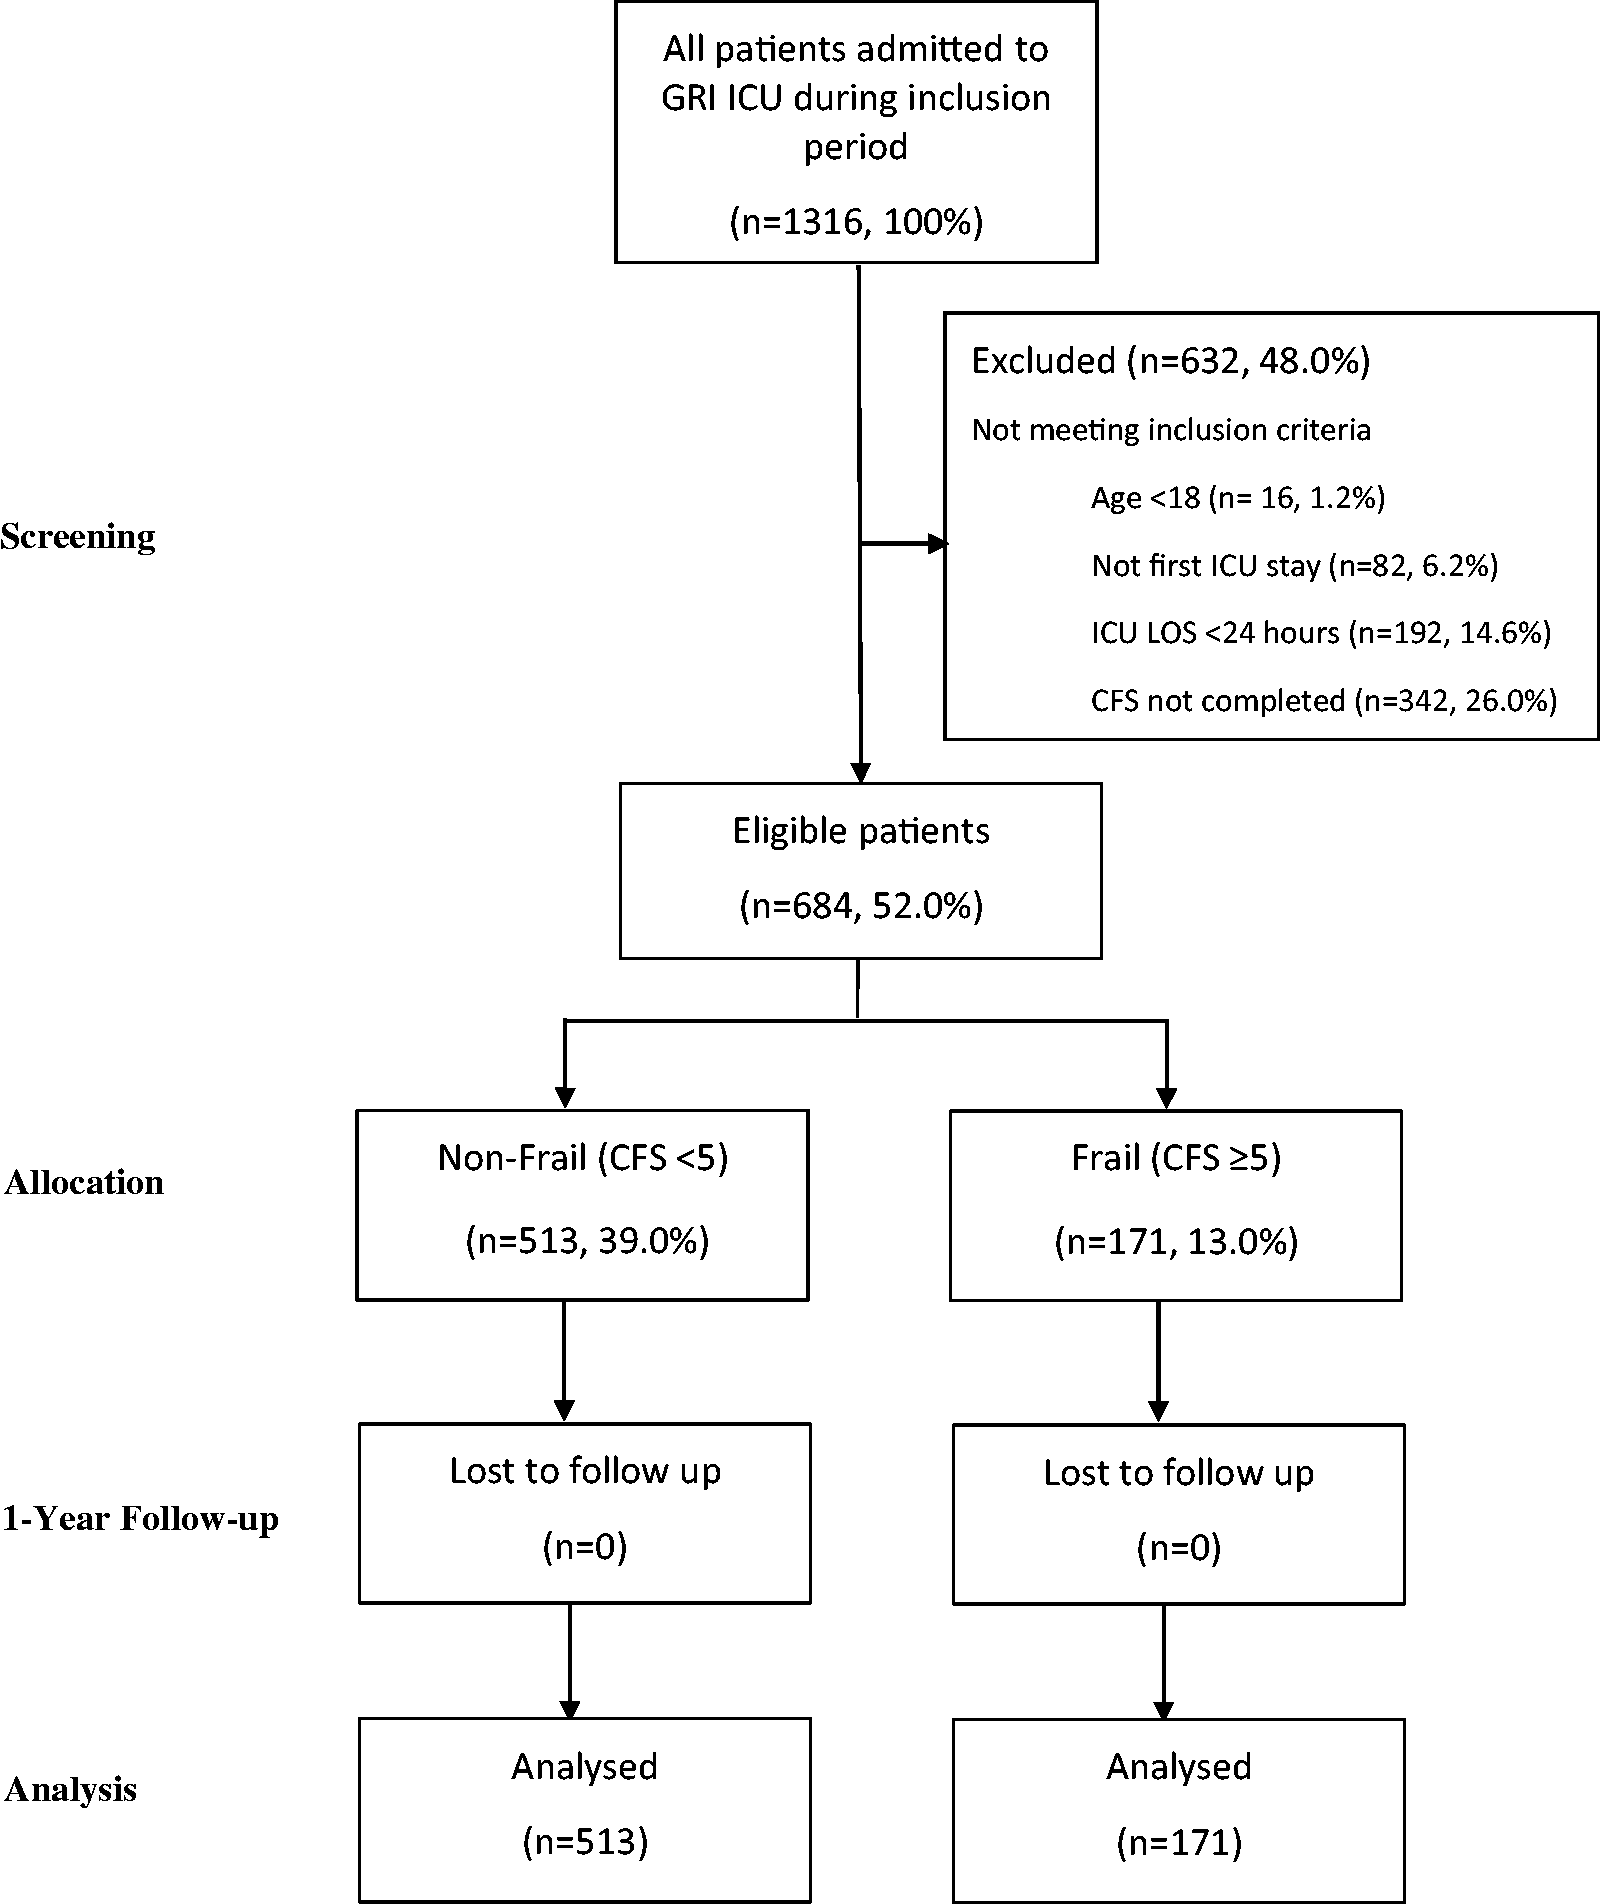
Study consort diagram. Flow diagram from screening to analysis, showing reasons for exclusion, with numbers and percentages of patients in each group.
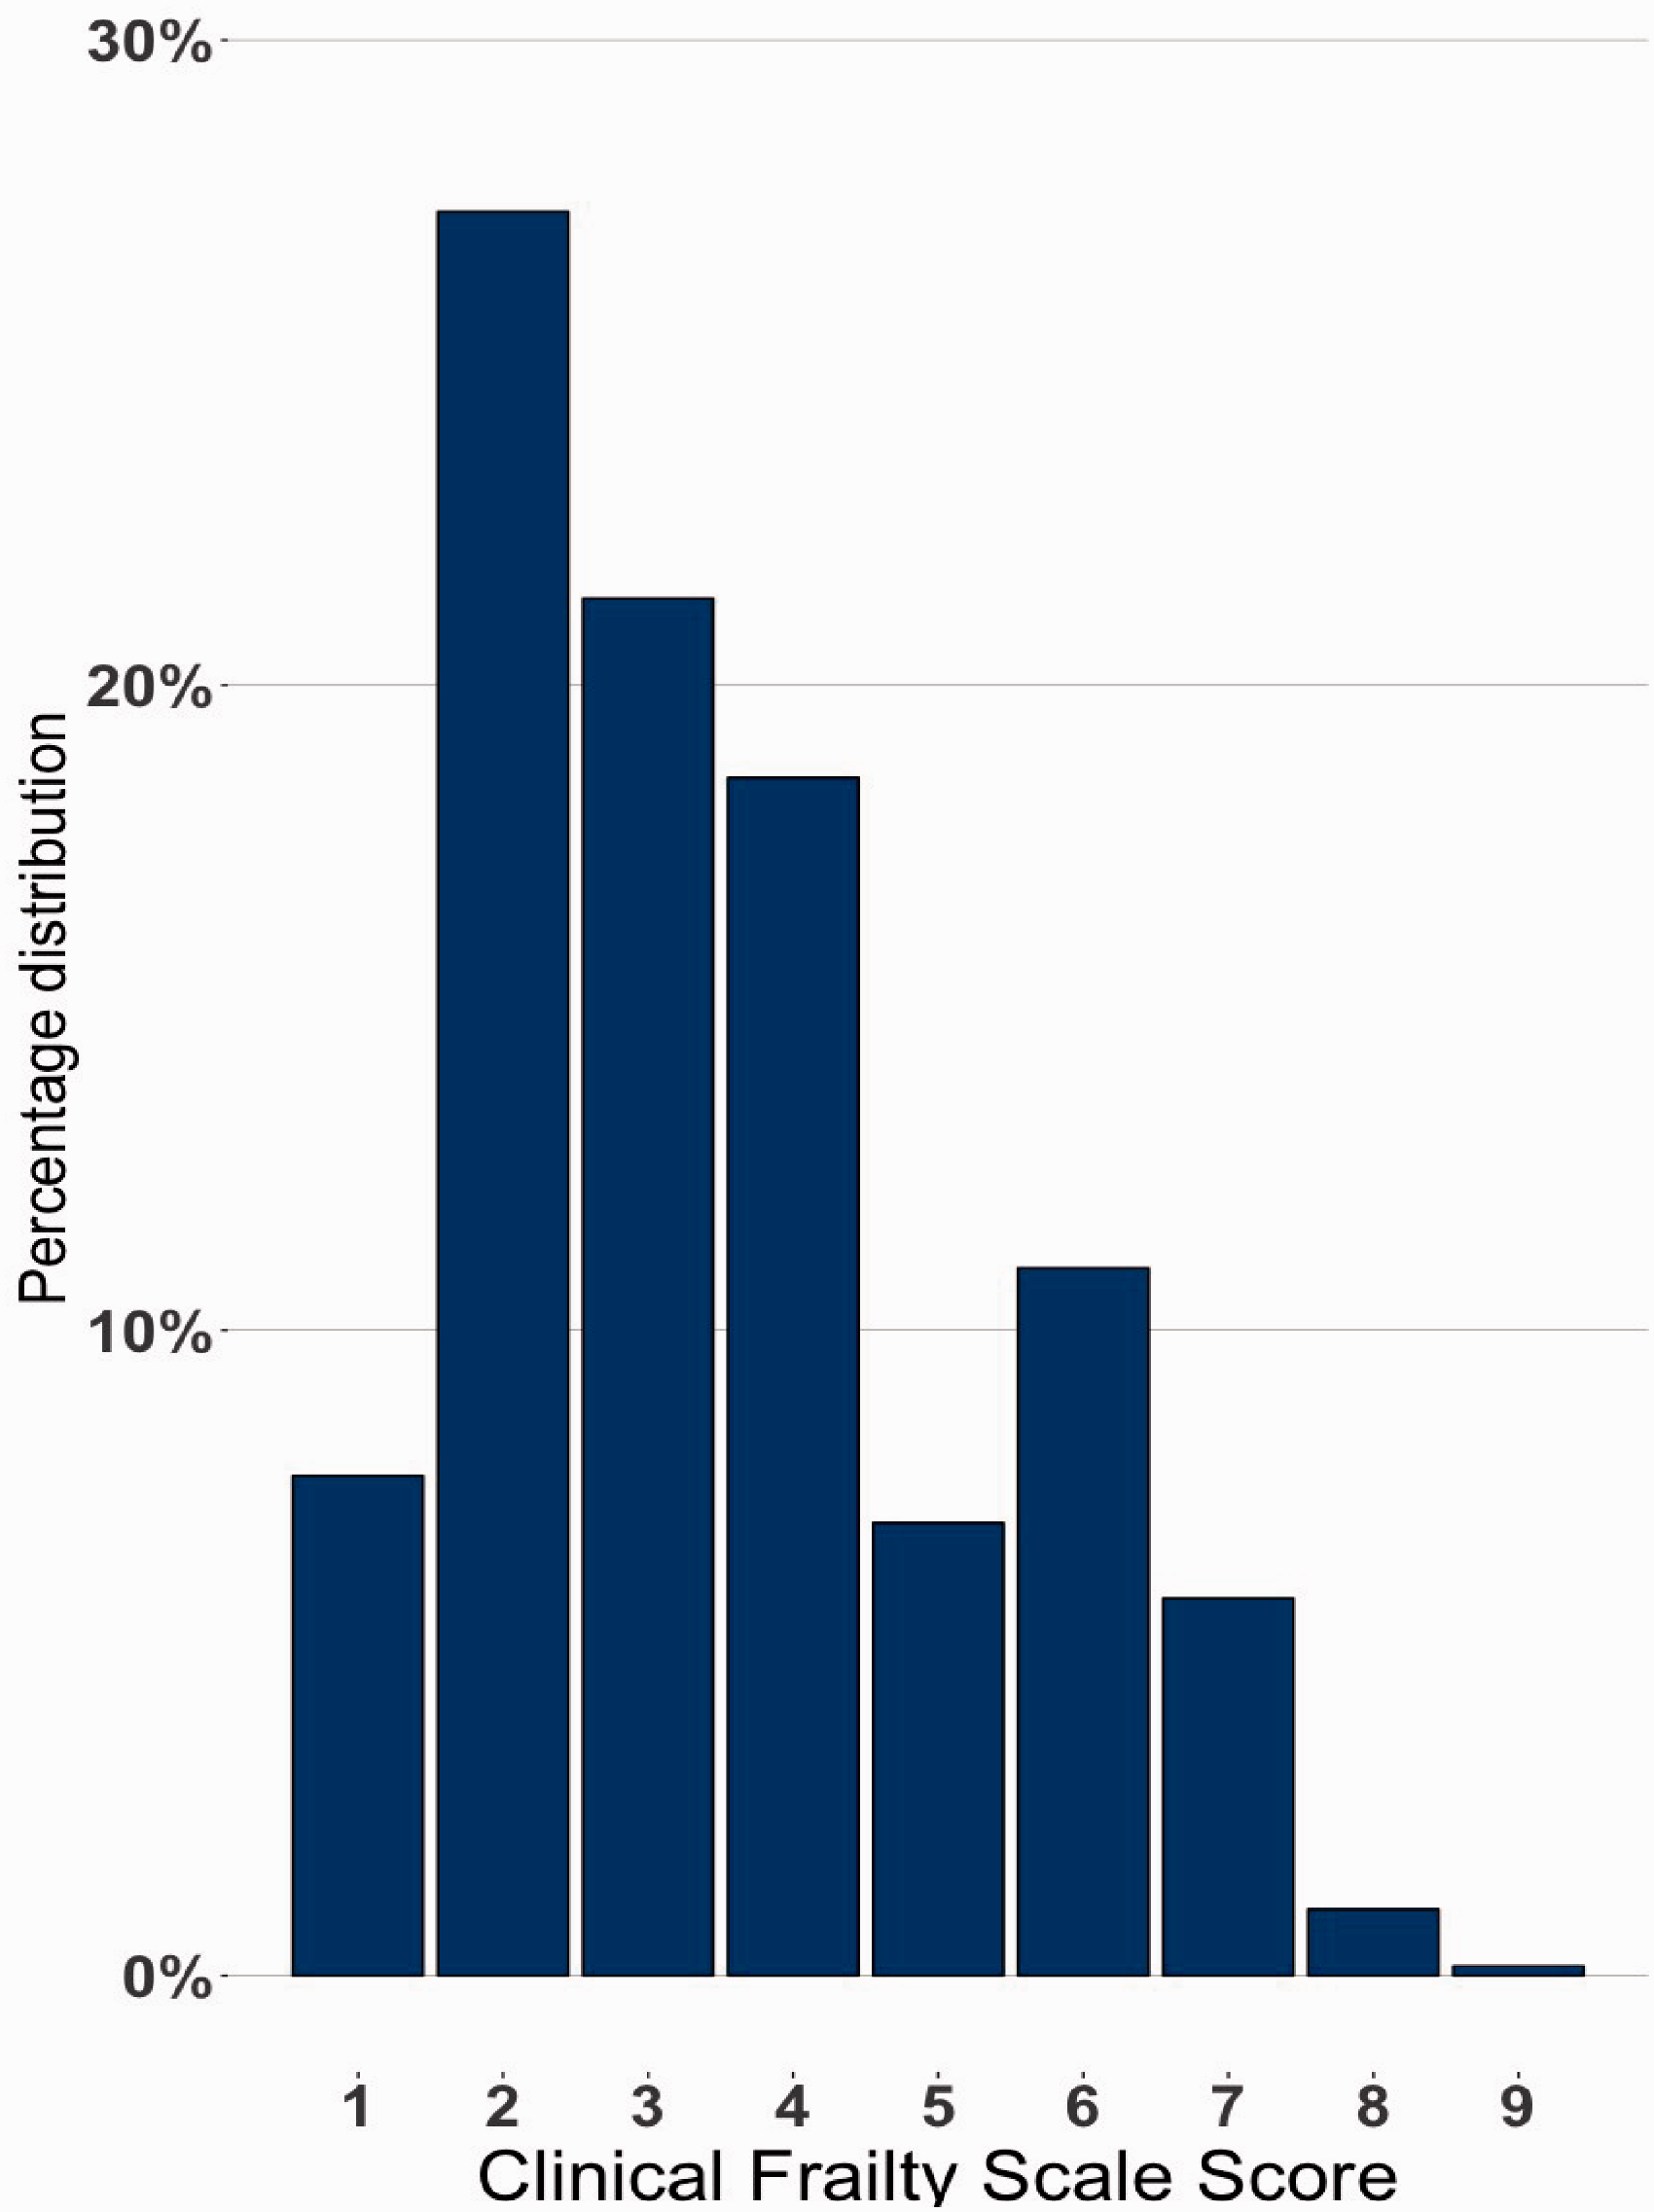
Clinical Frailty Scale score distributions. Bar graph of the percentage distributions of each clinical frailty score (CFS).
Relationships between frailty and covariates at inclusion
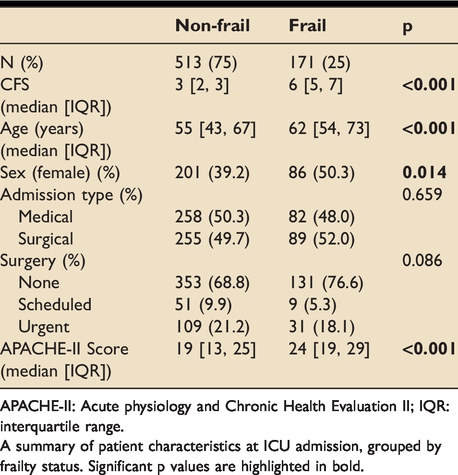
Frail patients were older (median age (years) [IQR]: 62[54,73] vs 55[43,67], p < 0.001) and had higher APACHE-II scores (median[IQR]: 24[19,29] vs 19.0[13,25]; p < 0.001). Females had a higher likelihood of frailty (50.3% vs 39.2% frail, p = 0.014). There were no statistically significant between-group differences in admission type (medical vs surgical) or surgical status (scheduled vs emergency) (Table 1).
Patient characteristics at inclusion.
APACHE-II: Acute physiology and Chronic Health Evaluation II; IQR: interquartile range.
A summary of patient characteristics at ICU admission, grouped by frailty status. Significant p values are highlighted in bold.
Frailty status and unadjusted survival
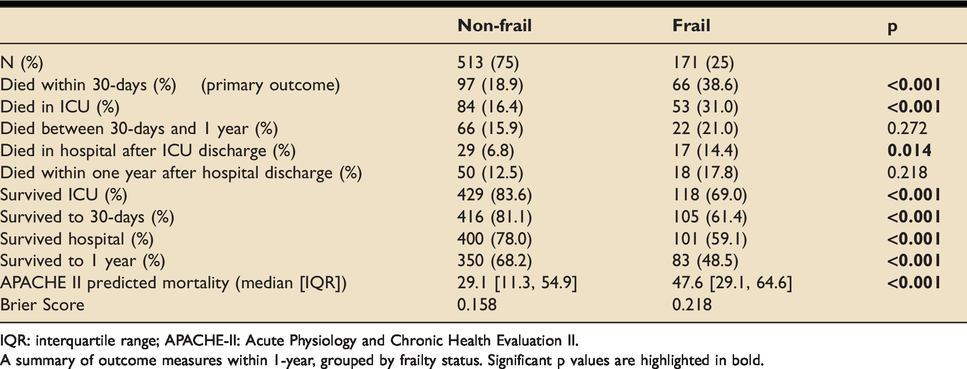
At 30-days, frail patients were two times less likely to be alive than their non-frail counterparts (61.4% vs 81.1%, p < 0.001). Frail patients were significantly less likely to survive at all points up to 1-year (48.5% vs 68.2%, p < 0.001). Interestingly, between 30-days and 1-year post-ICU admission, there were no statistically significantly between-group differences in mortality (Table 2, Figure 3).
Survival outcomes up to 1-year.
IQR: interquartile range; APACHE-II: Acute Physiology and Chronic Health Evaluation II.
A summary of outcome measures within 1-year, grouped by frailty status. Significant p values are highlighted in bold.
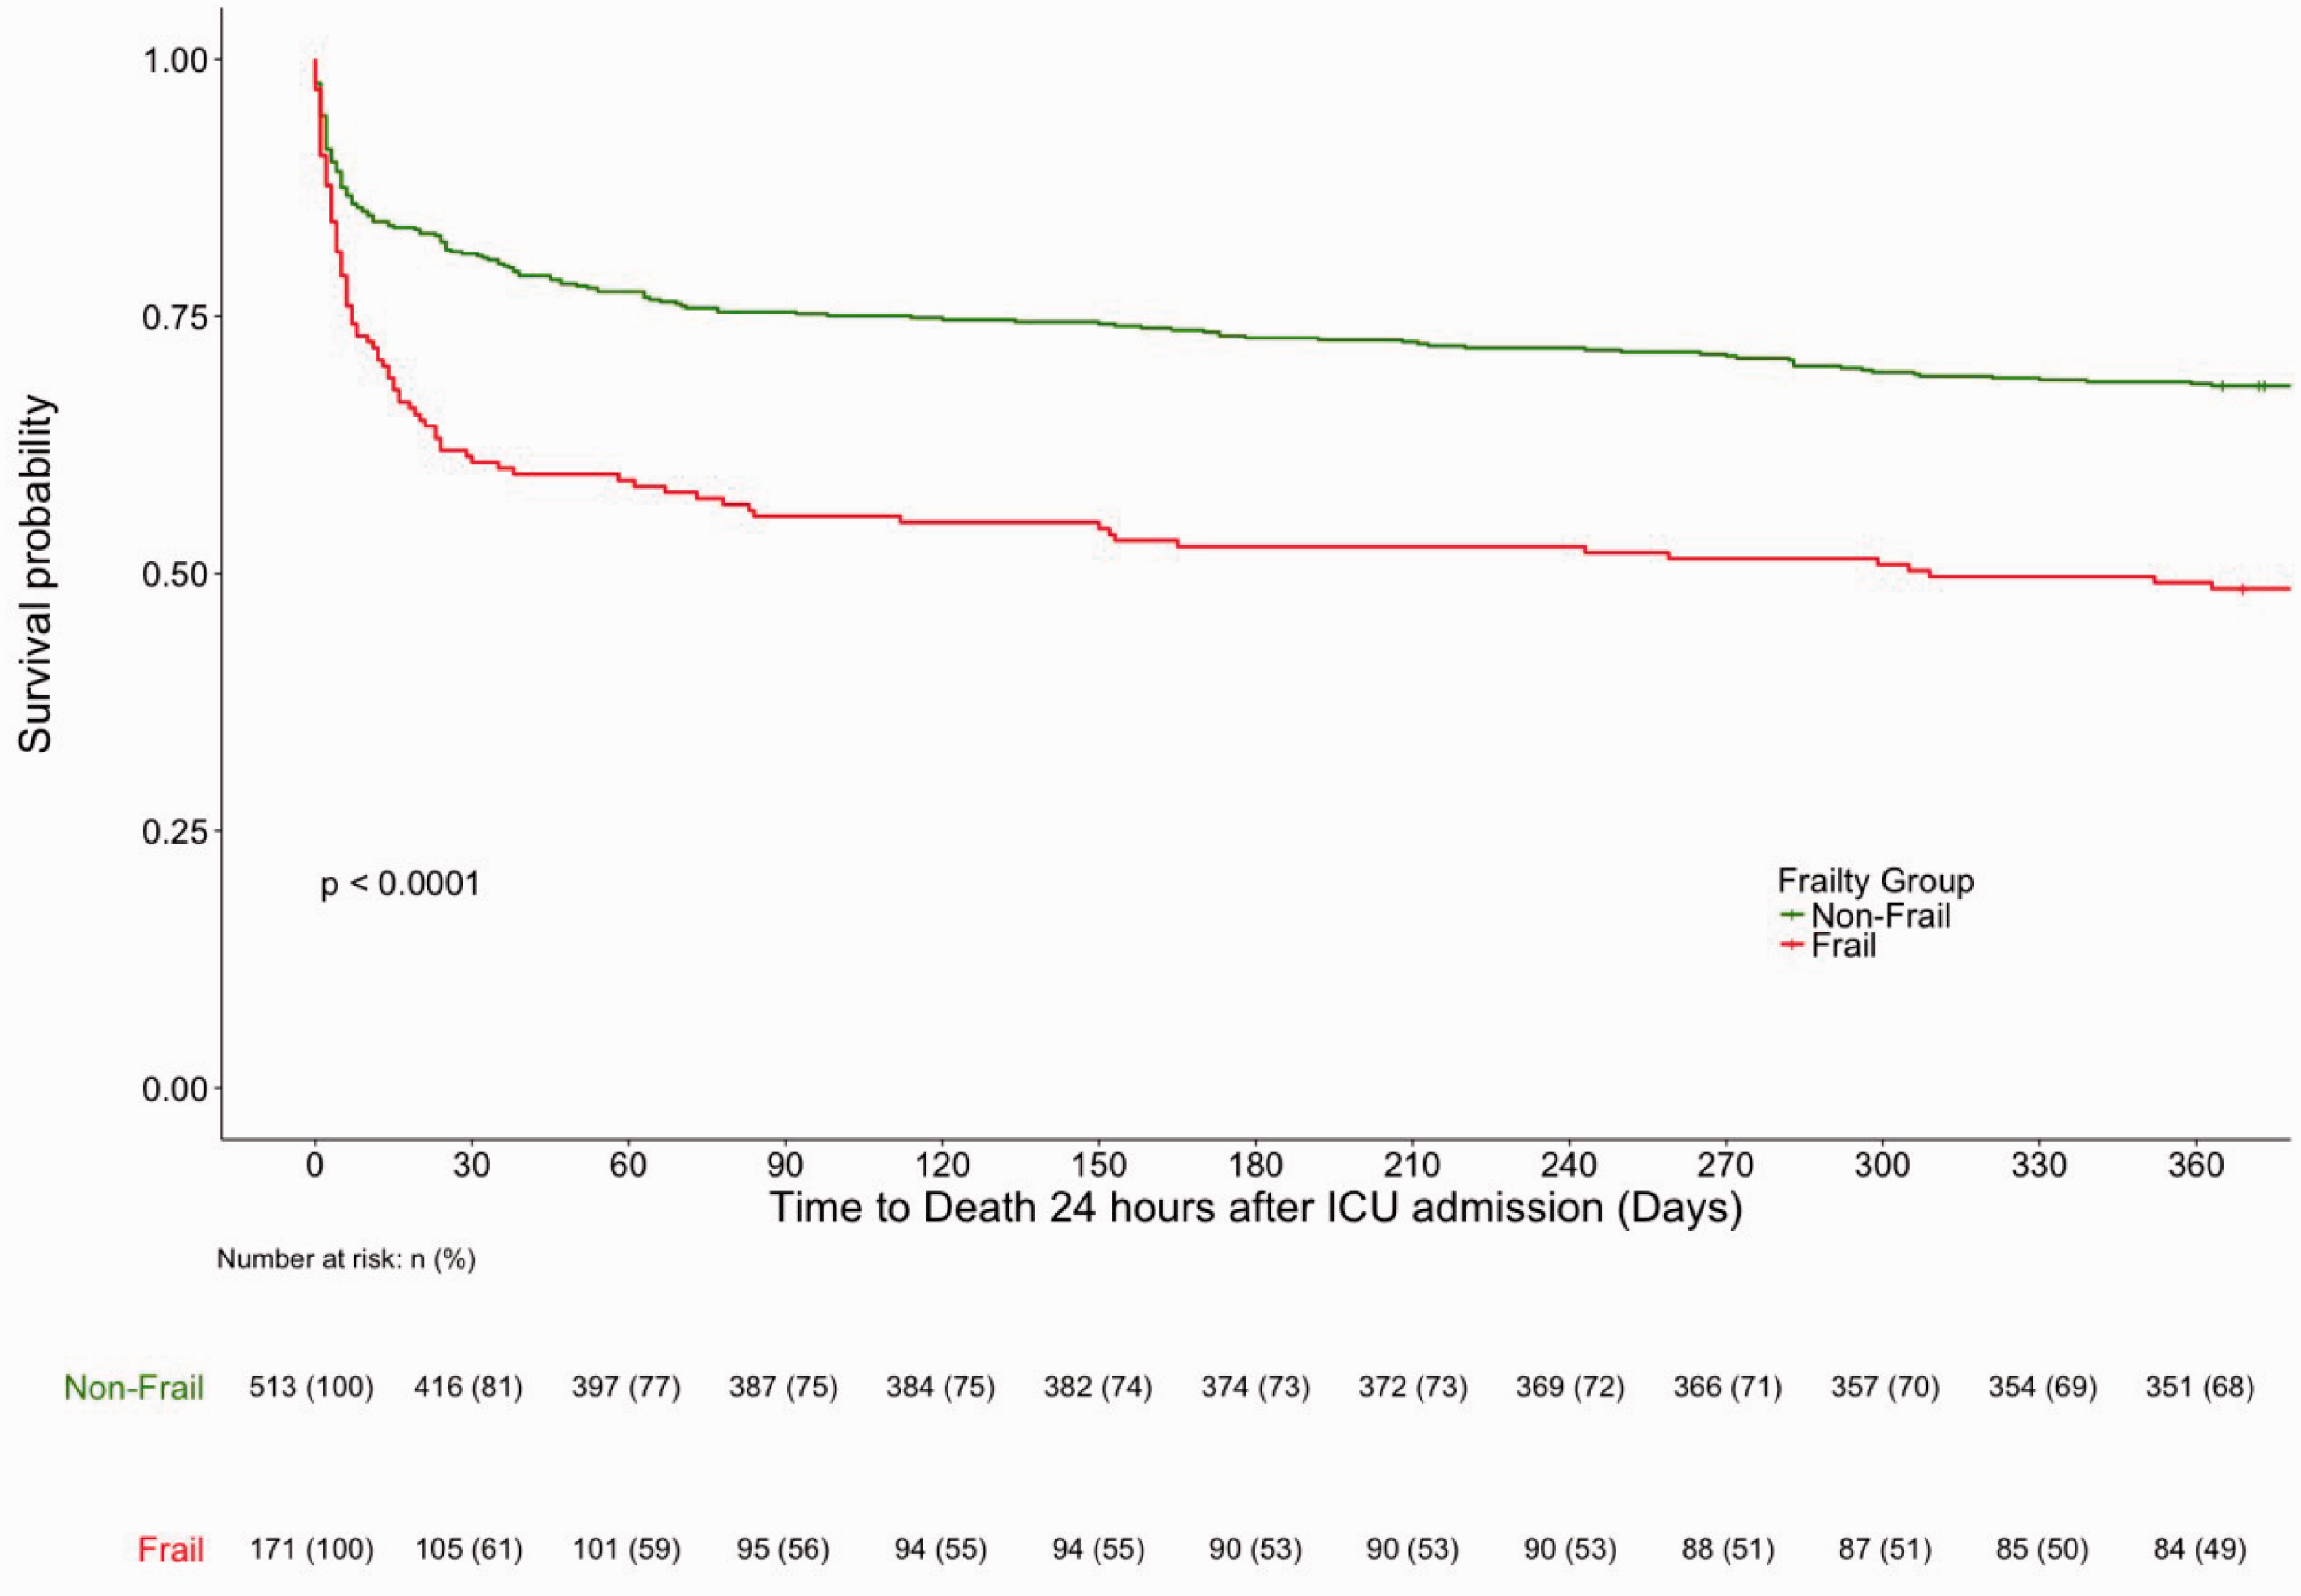
Unadjusted survival curves to 1-year, Stratified by Frailty Status. Kaplan Meier survival curves representing survival to 365 days, grouped by frailty status. The number and percentage of patients alive, and still at risk of death at each 30-day time point in each group are displayed in the table below the graph.
APACHE-II predicted hospital mortality was higher in the frail group (median (%) [IQR]: 47.6[29.1,64.6] vs 29.1[11.3,54.9], p < 0.001). The Brier score is a measure of predictive accuracy calculated from differences in predicted mortality and observed mortality that ranges from 0 to 1. The Brier score was higher in frail patients compared to non-frail patients (0.218 vs 0.158), reflecting a lower APACHE-II predictive accuracy for in-hospital mortality.
Dose-Response relationship of frailty and mortality risk
There were significant between-group differences (p < 0.0001) in mortality rates between frailty subgroups (CFS 1-2, CFS 3-4, CFS 5-9) in unadjusted analyses. Figure 4 illustrates a clearly separated dose-response relationship, where the accumulation of frailty was associated with increasing risks of mortality up to 1-year. Most of the between-group differences stemmed from the first 30-days from ICU admission.
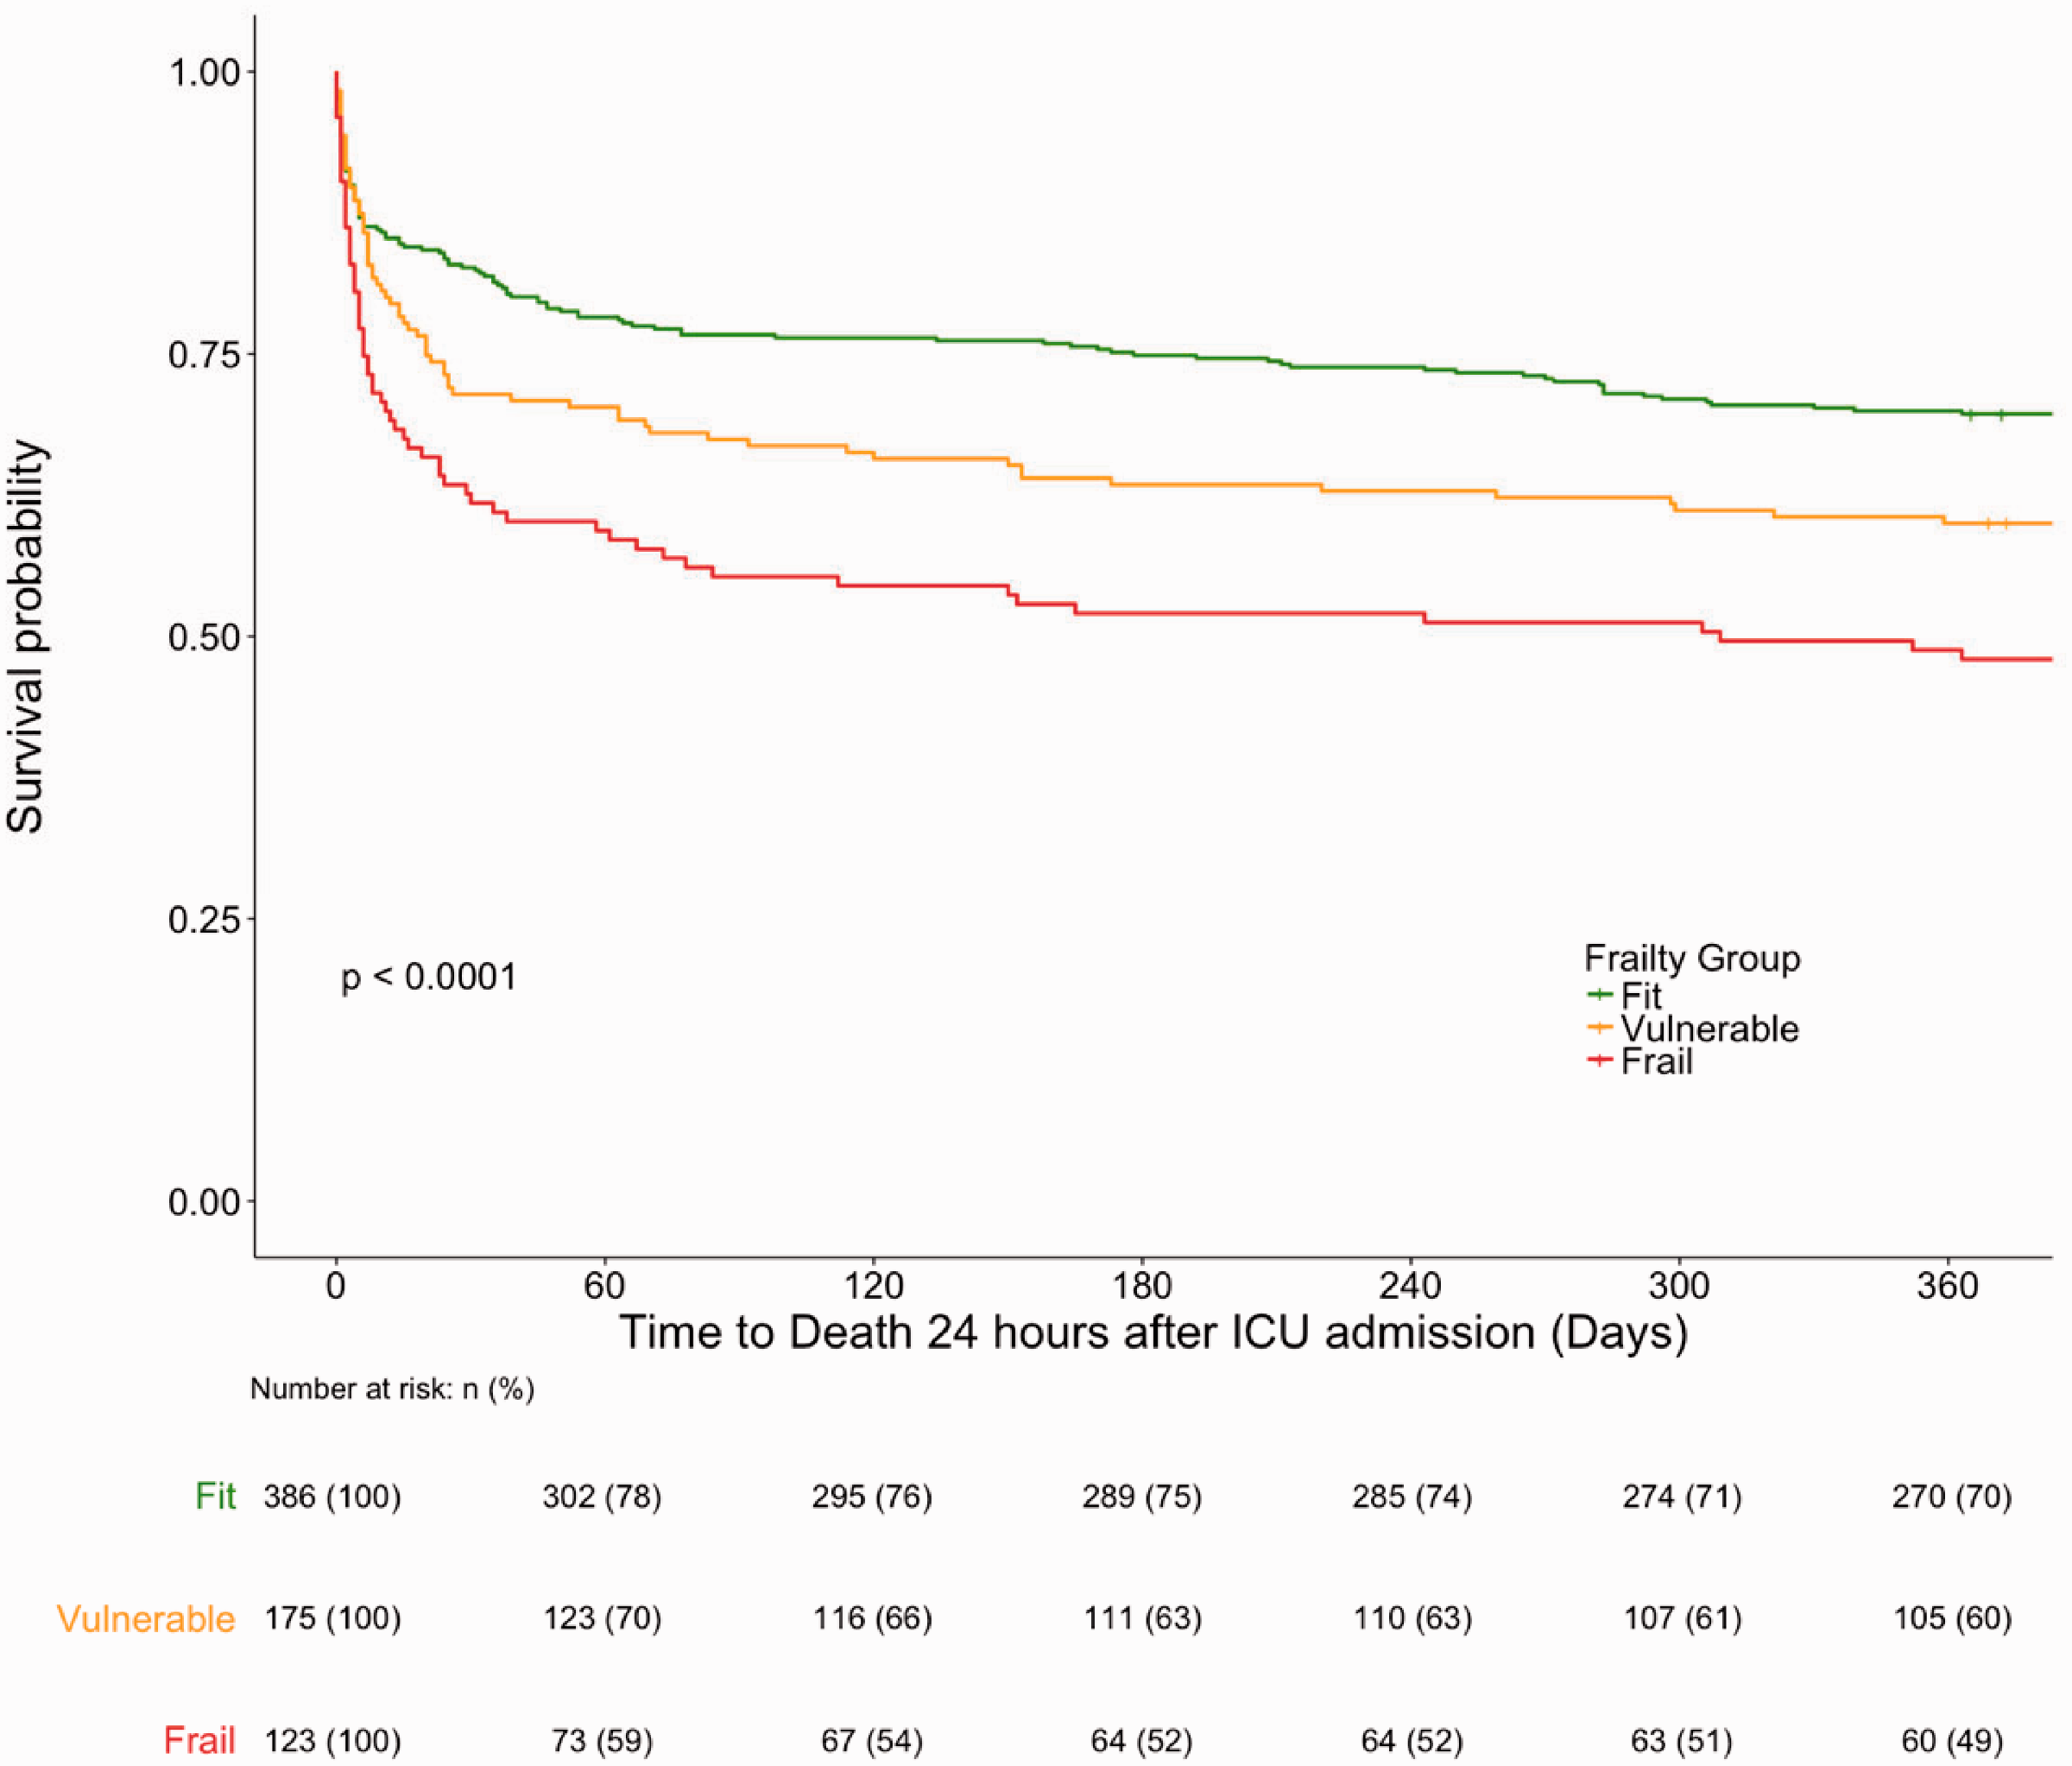
Unadjusted survival curves to 1-year, Stratified by frailty subgroups. Kaplan Meier survival curves representing survival to 365 days, grouped by frailty subgroups. Fit patients had clinical frailty scale (CFS) scores of 1 and 2, vulnerable patients were characterised by CFS 3 and 4, and frail patients were defined as CFS 5 and above. The number and percentage of patients alive, and still at risk of death at each 30-day time point in each group are displayed in the table below the graph.
Individual CFS score increases were also investigated. In unadjusted analyses, the HR for 30-day mortality for single-point increases in CFS was 1.23 (95%CI 1.13-1.34, p < 0.001). Even after adjustment for confounders, this corresponded to significant independent increases in mortality hazards at 30-days (HR 1.11; 95%CI 1.01-1.22; p = 0.026). Point-by-point CFS increases were not significantly associated with independently increased mortality HR at 1-year (Table 3 and Table 5).
Unadjusted-adjusted 30-day mortality cox proportional hazards with individual CFS scores.
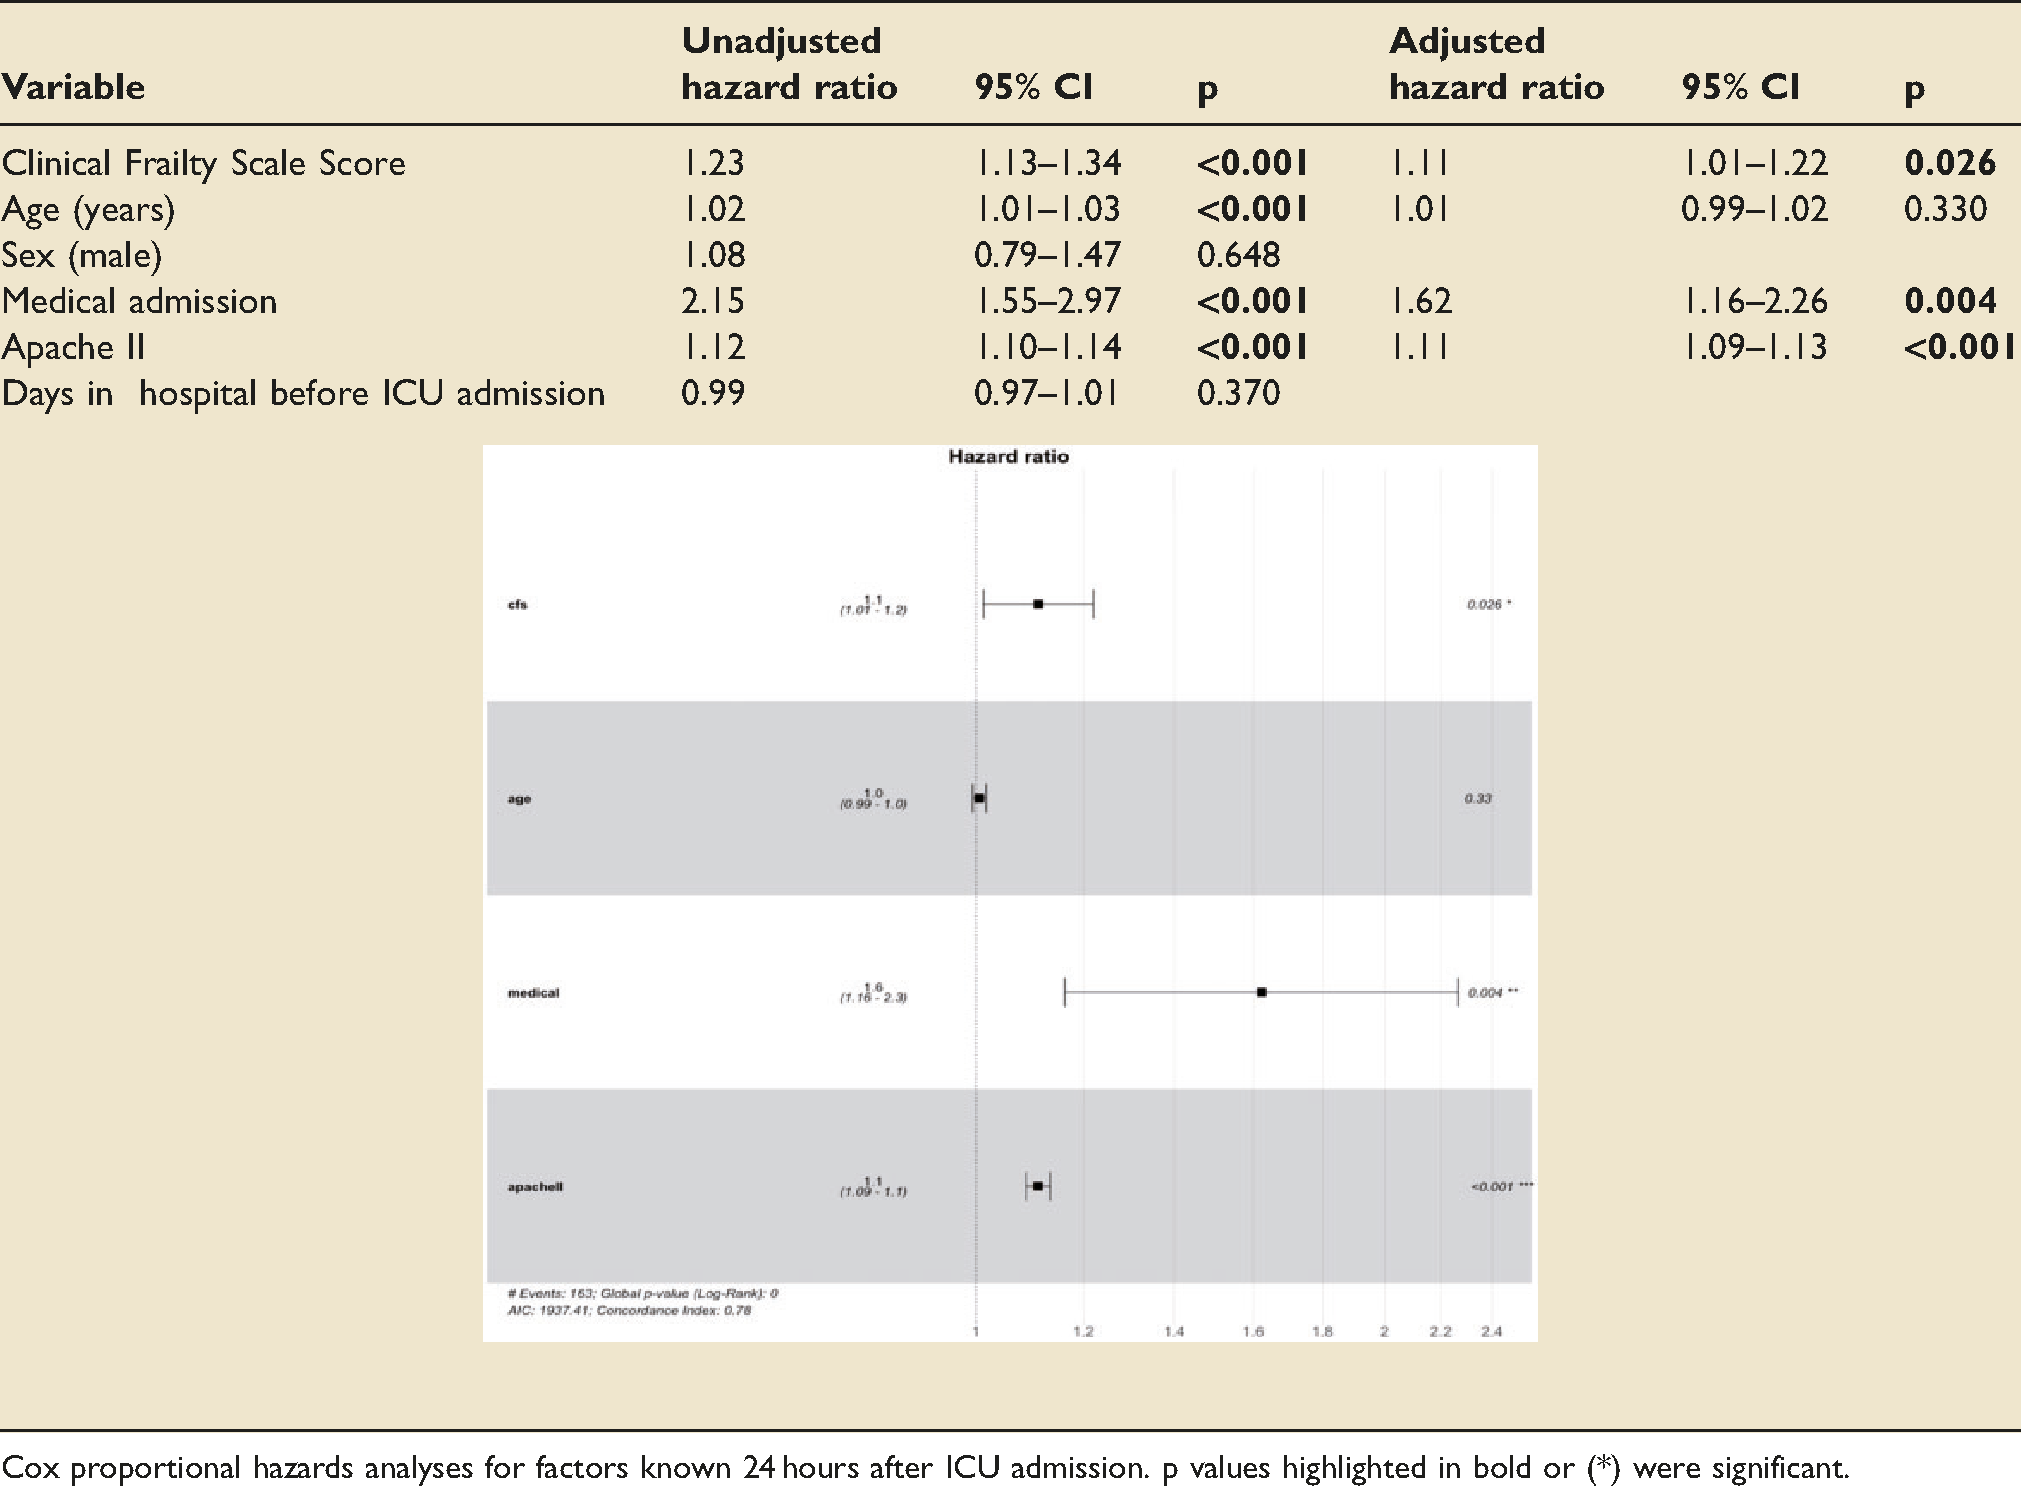
Cox proportional hazards analyses for factors known 24 hours after ICU admission. p values highlighted in bold or (*) were significant.
Covariate-Adjusted mortality hazards analyses
Factors independently associated with hazards of mortality at 30-days were frailty status (HR 1.56; 95%CI 1.14–2.15; p = 0.006), medical admitting specialty (HR 1.62; 95%CI 1.16-2.26; p = 0.005) and APACHE-II score (HR 1.11; 95%CI 1.09-1.13; p < 0.001). Age was not independently associated with 30-day mortality. For 1-year mortality, frailty status (HR 1.35; 95%CI 1.03-1.76; p = 0.028), age (HR 1.01; 95%CI 1.01-1.02; p = 0.002), medical admitting specialty (HR 1.37; 95%CI 1.06-1.77; p = 0.017) and APACHE-II score (HR 1.07; 95%CI 1.05-1.09; p < 0.001) were independently associated with increased mortality hazards (Tables 4 and 5).
Unadjusted-adjusted 30-day mortality cox proportional hazards with CFS dichotomised.
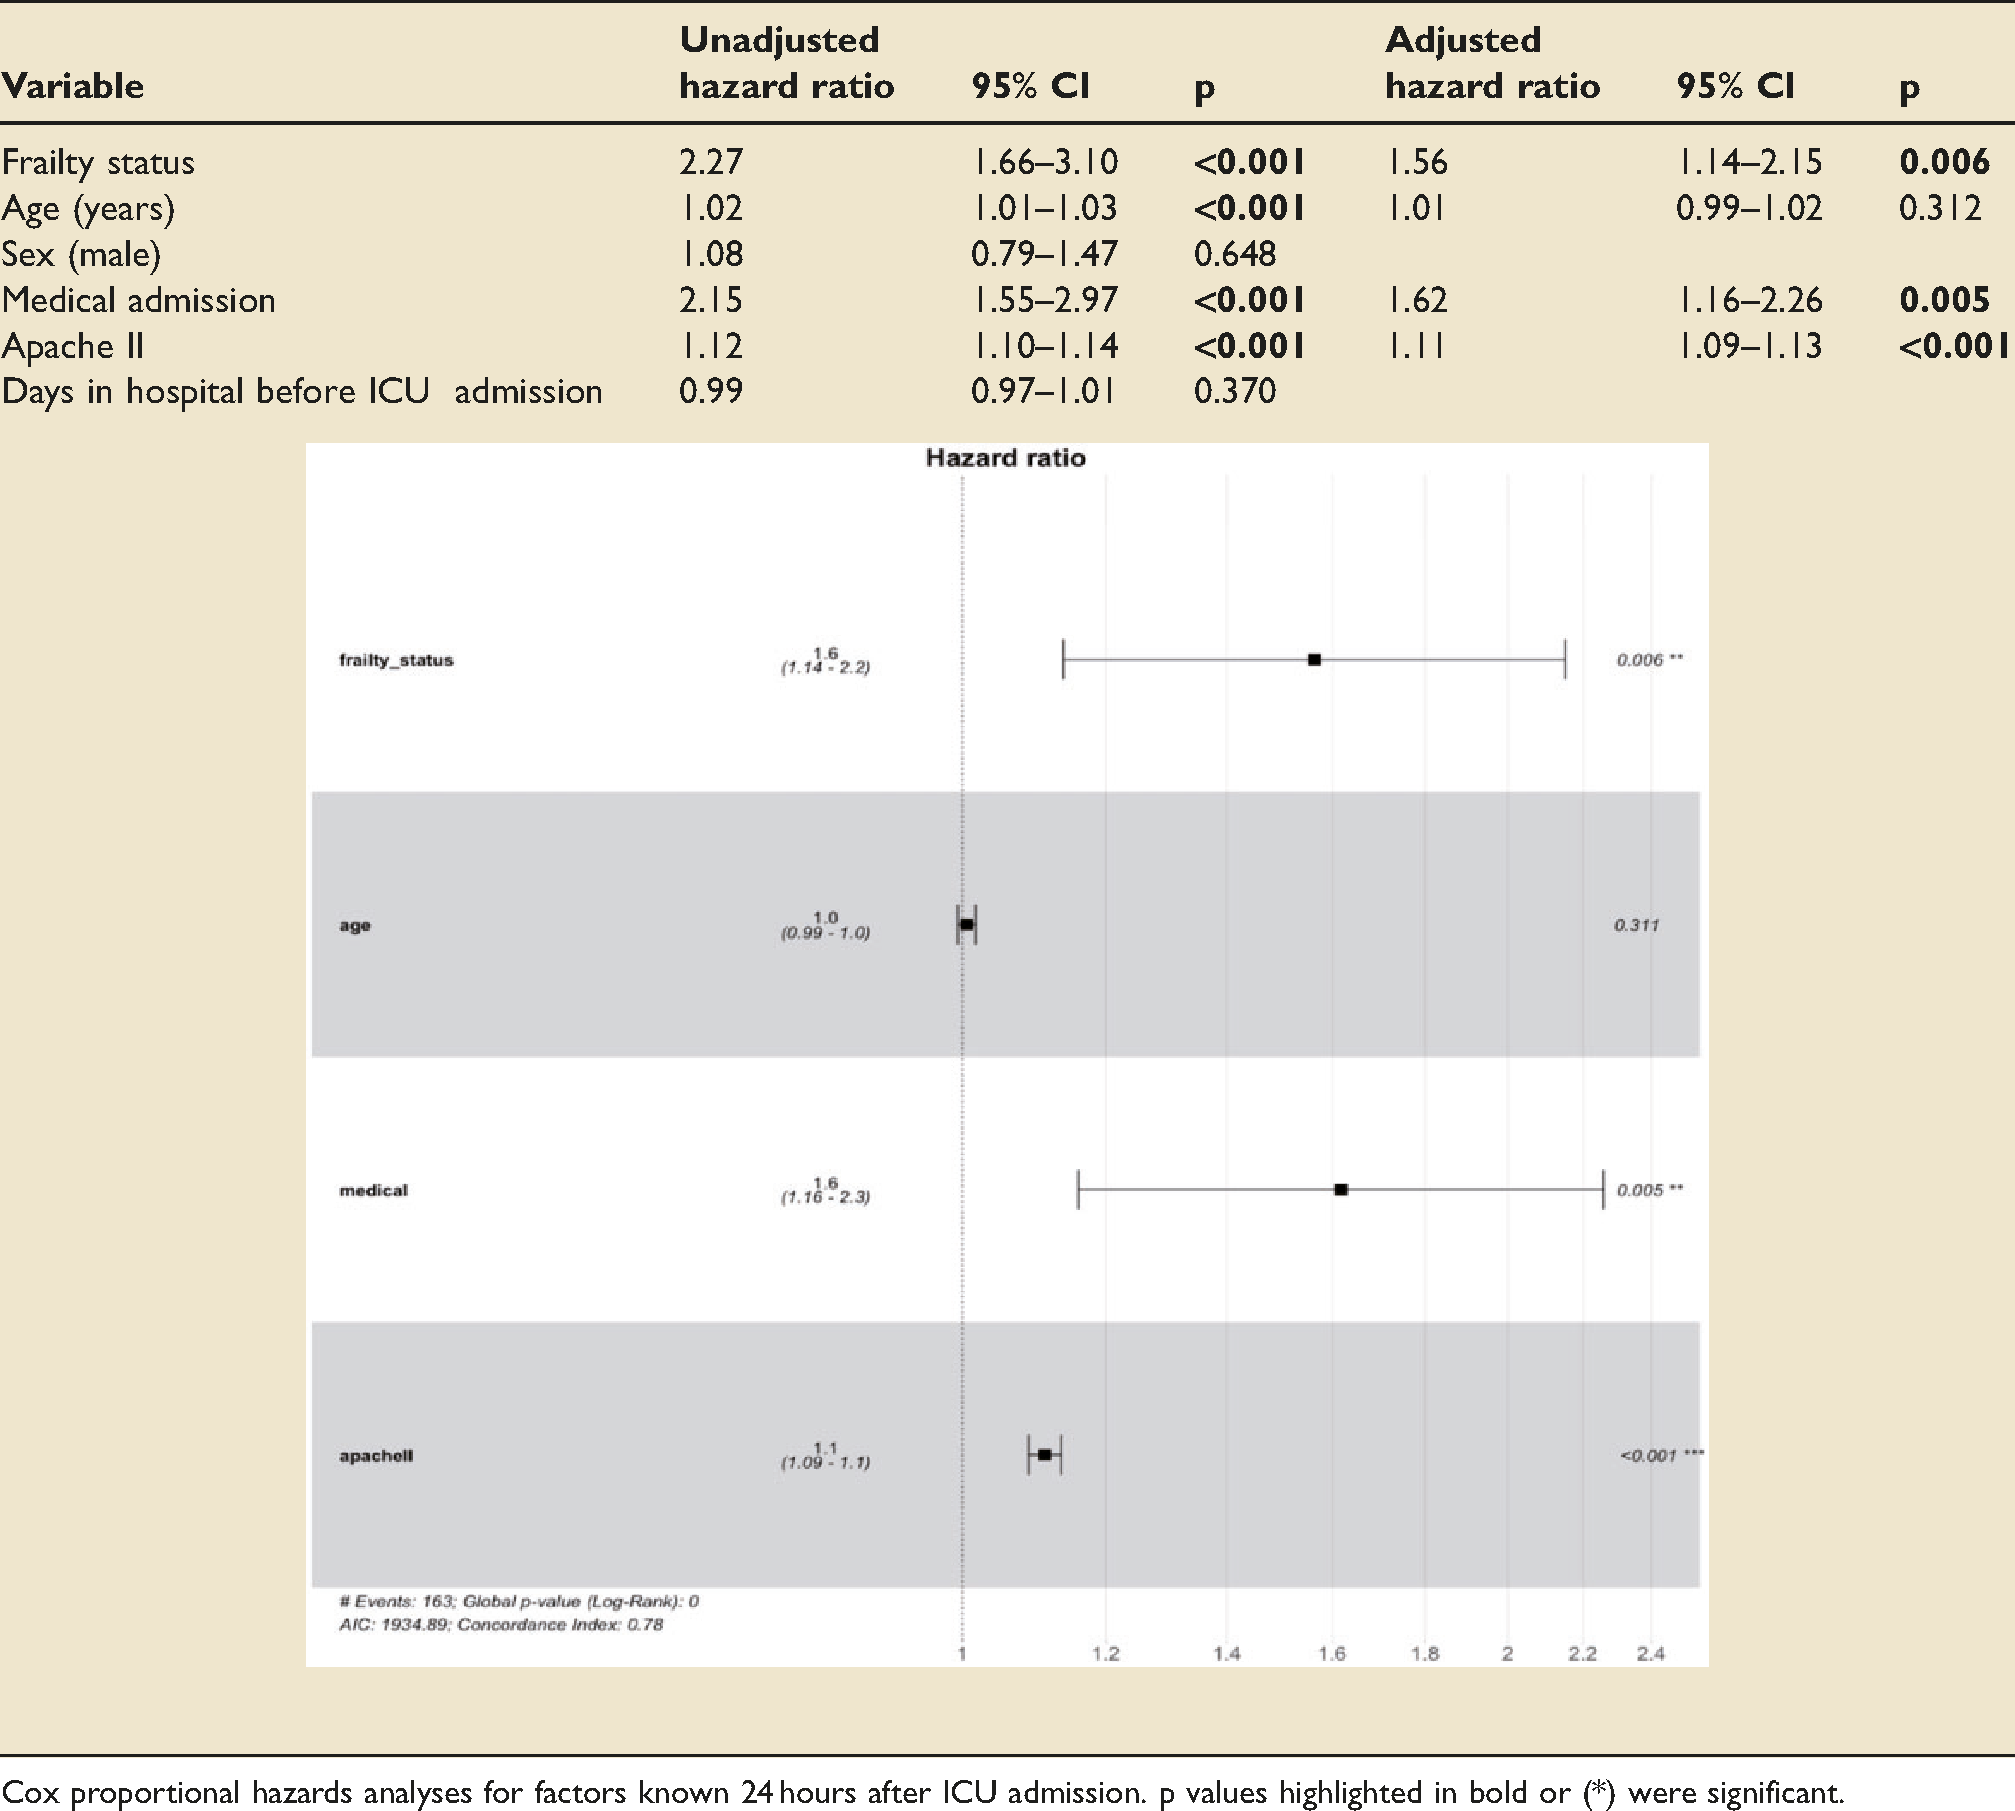
Cox proportional hazards analyses for factors known 24 hours after ICU admission. p values highlighted in bold or (*) were significant.
Unadjusted-adjusted 1-year mortality Cox proportional hazards.
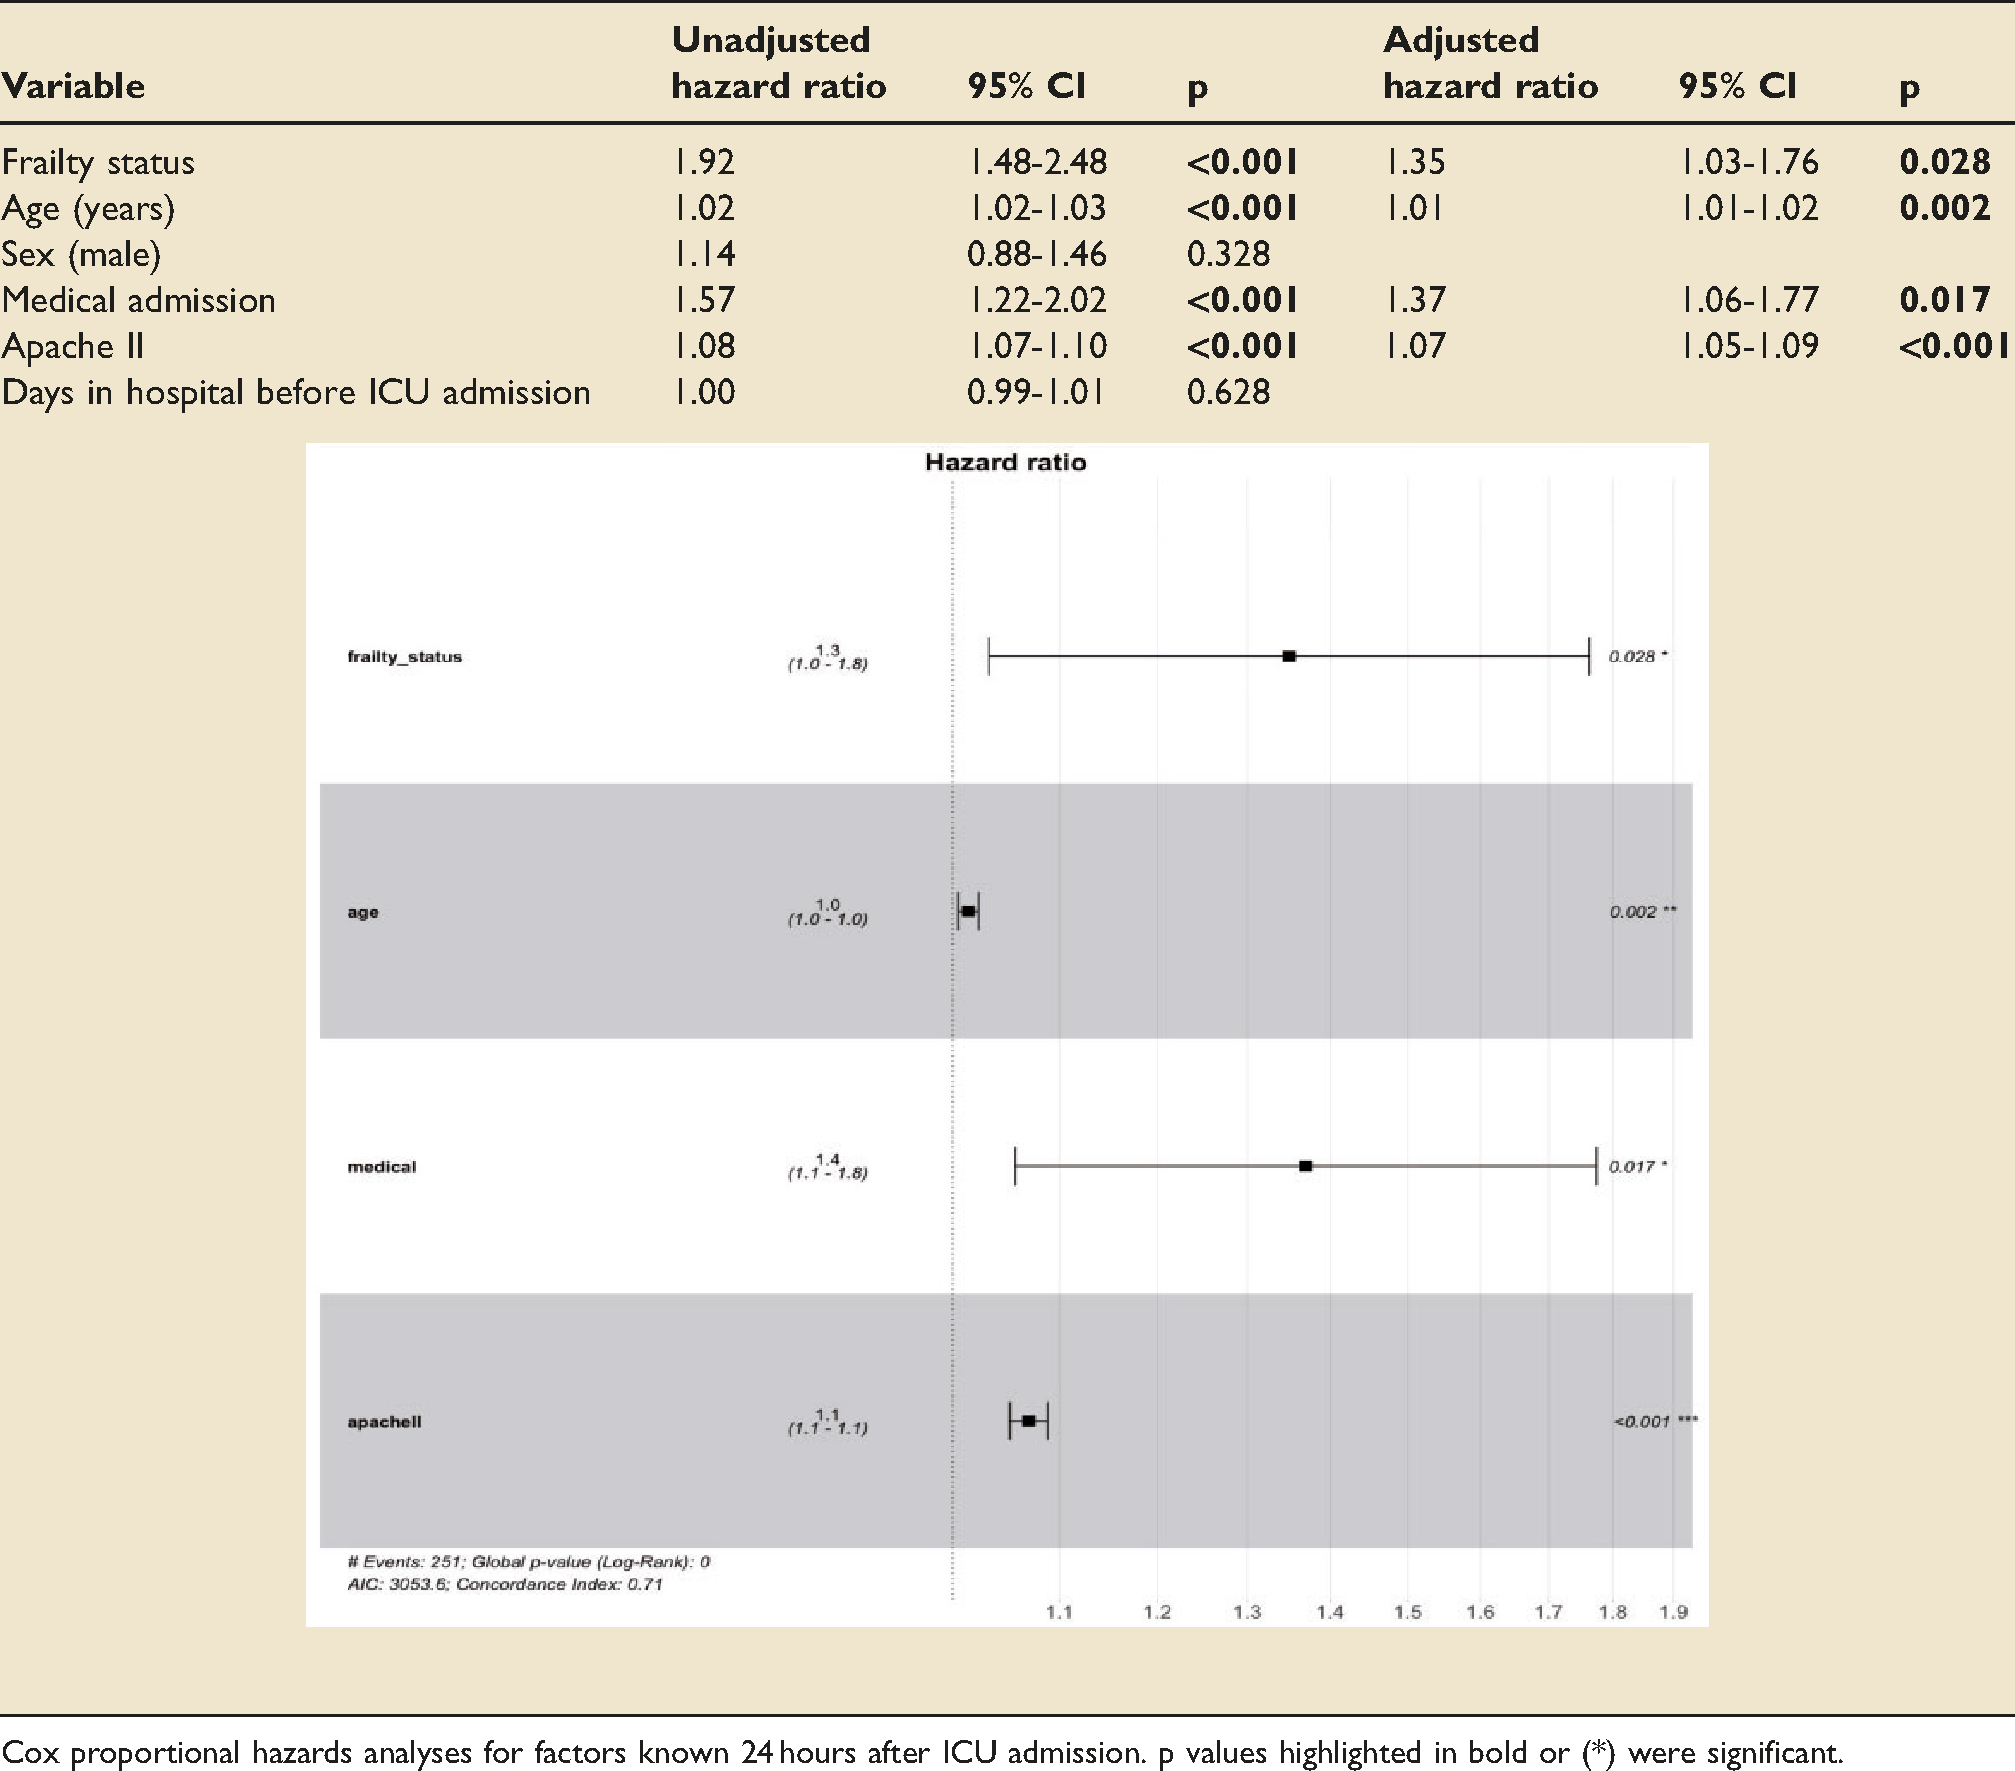
Cox proportional hazards analyses for factors known 24 hours after ICU admission. p values highlighted in bold or (*) were significant.
Life sustaining therapy
Frail patients were more likely to be initiated on vasopressors (77.8% vs 68.6%, p = 0.029) but less likely to be initiated on ventilation (70.2% vs 79.9%, p = 0.011). There were no significant differences in RRT initiation, or the proportion of patients initiated on any LST modality overall.
Frail patients received significantly more days of RRT (median[IQR]: 0[0,0] vs 0[0,0], p = 0.046; mean: 0.93 vs 0.72), vasopressors (median[IQR]: 2[1,4] vs 2[0,4], p = 0.002; mean: 3.17 vs 2.66) and overall LST (total RRT, vasopressor and ventilator days) (median[IQR]: 5[3,11] vs 4[2,9], p = 0.008; mean: 9.28 vs 7.77). There were no significant between-group differences in the number of days on ventilators (Table 6).
Days of life sustaining therapy.
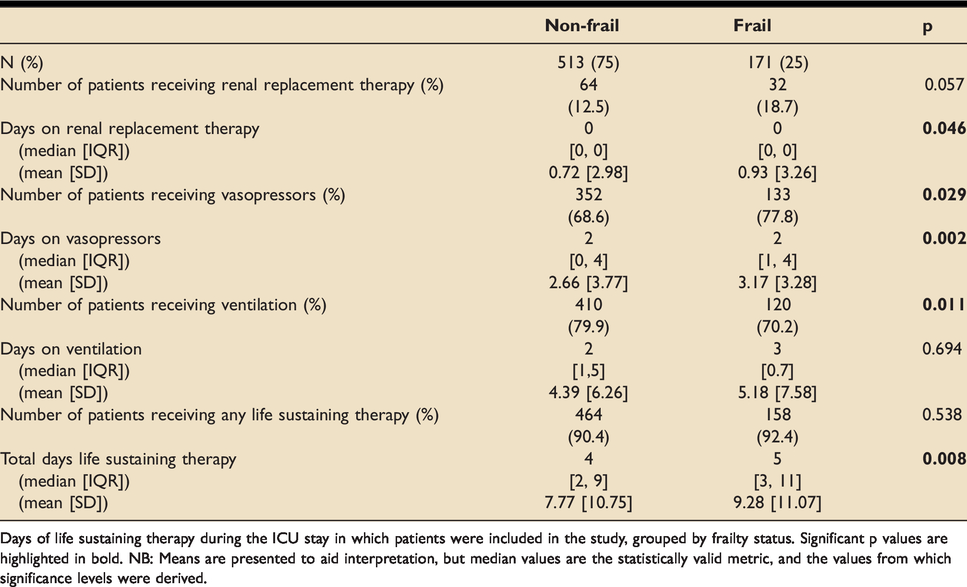
Days of life sustaining therapy during the ICU stay in which patients were included in the study, grouped by frailty status. Significant p values are highlighted in bold. NB: Means are presented to aid interpretation, but median values are the statistically valid metric, and the values from which significance levels were derived.
Healthcare use
Frail patients had longer hospital LOS before ICU admission (median (days) [IQR]: 1[0,5] vs 1[0,3], p = 0.009; mean: 4.9 vs 3.8) and longer index ICU LOS (median (days) [IQR]: 5.0[2.9,10.3] vs 4.2[2.2,8.9], p = 0.036; mean 8.5 vs 7.4). Frail patients who survived ICU had longer hospital stays after ICU discharge (median (days) [IQR]: 15.5[8.0,35.5] vs 11.0[5.0,27.0], p = 0.013; mean 26.1 vs 20.7). No statistically significant differences were observed in ICU readmissions within 1-year or in the proportion of discharges back to normal residence or dependent living facilities (Table 7).
Healthcare usage.
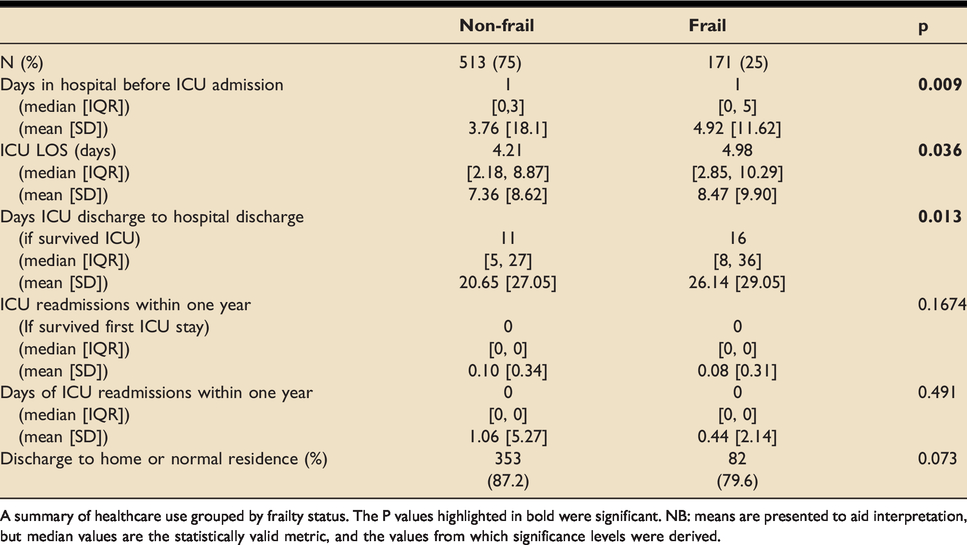
A summary of healthcare use grouped by frailty status. The P values highlighted in bold were significant. NB: means are presented to aid interpretation, but median values are the statistically valid metric, and the values from which significance levels were derived.
Discussion
Mortality
Frailty increased the risk of mortality at all time points up to 1-year. The magnitude and significance of the effect of frailty on 30-day mortality was higher than any other time point investigated. Although unequivocally significant, the adjusted 30-day mortality HR of 1.56 in frail patients is lower than previously reported. 13 Attributing to the case mix, this reflects the degree of frailty attenuation in the younger patient. 5
Adverse events, including decompensation from acute illness, inflammatory insults and hospital-acquired complications, likely have higher incidence and severity in this vulnerable group.1,2 When combined with reduced physiological reserve and impaired capacity for recovery2,5,15,31 a strong rationale emerges for this large mortality excess in frail patients. Understanding frailty in critical care, particularly its relation to short-term outcomes, rather than concentrating solely on acute reasons for admission, may signal that some patients are coming to a natural end of life. Equally, it may provide ICU opportunity to the chronologically elderly but physiologically robust, with potentially reversible components of frailty, previously excluded due to age biases.
We analysed the dose-response relationship between frailty and mortality. After adjustment for confounders, we identified that for each point increase in CFS, there was a statistically significant 11% higher hazard of death at 30-days. This substantiates previous findings.4,13,31 Acknowledging the accrual effects of the frailty through point-by-point risk stratification heightens predictive sensitivity when compared to dichotomisation, increasing the clinical utility of the CFS for decision making.
Age
In the longer-term, older age has been associated with poorer ICU outcomes.16,38 We found age to be an independent risk factor for mortality at 1-year. These findings, reported in studies5,6,16,17,39 focusing on longer-term outcomes, are skewed by deaths occurring due to reasons other than critical illness. Deaths after hospital discharge may arise from indirect complications of critical illness such as nosocomial disease related to increased healthcare use, insufficient recovery from the acute physiological insult, or from further generalised physical decline.
In the shorter-term, this study, showed that after adjusting for frailty and severity of illness, age was
Life sustaining therapy
Lower initiation rates and higher propensity for withdrawing LST could explain greater mortality in frail patients. Prior literature reports conflicting results on this matter.5,11,14–19 We observed the total receipt of LST was significantly higher in frail patients, reflecting care delivery proportional to their critical illness and reduced ability to compensate for organ dysfunction. This was despite a survival bias, where increased ICU mortality in frail patients led to less time receiving organ support than they would have received had they survived longer. The observed mortality difference therefore seems not a precipitant of ‘under-treatment’ in frail patients, but a consequence of their limited reserve to respond to critical illness or LST. Now concerns regarding systematic differences in ceilings or durations of treatment in ICU have been addressed, future research should investigate potentially reversible mechanisms by which frailty leads to poorer outcomes.
Healthcare usage
Frail patients had more healthcare usage in terms of ICU LOS, hospital LOS and LST. The economic implications of providing prolonged and potentially futile treatment to ICU patients is significant. Furthermore, ICU beds occupied by those receiving potentially non-beneficial treatment effectuate an opportunity cost to critically ill patients more likely to benefit from admission. Generally, frail patients have worse survival, lengthier ICU stays, and longer hospital stays. The decision to escalate care in these patients should therefore be made with these factors in mind.
No significant differences were identified in the proportion of either group being discharge to their own home or normal residence. This limited data does not specifically identify a new requirement for increased package of care or nursing home requirement. Future studies should consider this as an outcome measure.
Implications and recommendations for future research
Frailty was found, in unadjusted and covariate-adjusted analyses, to have significant mortality hazards at both 30-days and 1-year post-ICU admission. The APACHE-II score, a well validated risk stratification tool, 26 was also associated with significantly increased mortality, however it is limited by a lower discriminatory power in elderly patients 28 and lower predictive accuracy in frail patients, evidenced by a higher brier score. Therefore, incorporation of frailty scoring alongside measures of acute physiological derangement may improve prognostication for these demographics where APACHE-II predictions are less accurate.
Another interesting endeavour would to be identify the trajectory of frailty post-ICU admission through serial CFS quantification. Does frailty improve as one recovers from post-ICU syndrome or is the acute insult which requires ICU admission the precipitant to ongoing physiological deterioration? Identifying potentially modifiable factors such as sarcopenia and metabolic disturbances 3 could guide application and development of frailty-attuned interventions aimed at mitigating frailty-related morbidity and mortality excess.
Limitations
The included patient pool did not reach the sample size calculated to provide sufficient power in pre-study calculations. However, since the frailty effect size on mortality was greater than estimated, sufficient power to make statistically significant conclusions was reached.
Although validated, 32 the CFS has potential inter-rater variability. This was minimised by bedside CFS infographics and training given to staff who were assigning CFS scores. Despite input from patients, proxies and medical records, assessing frailty in ICU risks attributing features of acute illness to frailty. 40 Routine frailty quantification within primary or scheduled care would facilitate more accurate portrayals of baseline health. This would provide invaluable information for future ceiling of treatment decisions.
Conclusions
Frailty has been shown, with more power and precision than before, to increase mortality risk in both the short and longer-term, with greatest significance at 30-days post-ICU admission. This was despite significantly greater LST use in frail patients. The addition of frailty scoring to currently operational risk stratification tools, particularly on a point-by-point basis, offers large potential for more informed decision making in ICU.
Footnotes
Acknowledgements
Participating Investigators: I am very grateful to Dr Shaw, who provided his expert advice on statistical analysis strategy and interpretation. Collected Data: Many thanks to Lyndsey Jarvie who assisted with the initial patient search to find patients admitted to the ICU within the study period.
Authors’ contributions
DH: data acquisition, data analysis, data interpretation, reporting, reviewing. MR: literature review, data interpretation, reporting. MGB: conception of research, reviewing.
Declaration of conflicting interests
The author(s) declared no potential conflicts of interest with respect to the research, authorship, and/or publication of this article.
Funding
The author(s) disclosed receipt of the following financial support for the research, authorship, and/or publication of this article: This work was sponsored by NHS Greater Glasgow and Clyde who had no role in the study design, undertaking or reporting.