
Abstract
Introduction
Frailty is a syndrome of decreased reserve and heightened vulnerability. Frailty scoring has potential to facilitate more informed decisions in the intensive care unit. To validate this, its relationship with outcomes must be tested extensively. This study aimed to investigate frailty’s impact on adverse outcomes after intensive care unit admission, primarily one-year mortality.
Methods
This single-centre retrospective observational cohort study examined prospectively collected data from 400 intensive care unit patients. Frailty was assessed using the Clinical Frailty Scale and defined as Clinical Frailty Scale ≥ 5. Unadjusted and adjusted analyses tested the relationships of frailty, covariates and outcomes.
Results
Of 400 eligible patients, 111 (27.8%) were frail and 289 (72.3%) were non-frail. Compared to non-frail patients, frail patients were older (62 vs. 56, p < 0.001) and had higher Acute Physiology and Chronic Health Evaluation II scores (22 vs. 19, p < 0.001). Females were more likely to be frail than males (34.1% vs. 22.9% frail, p = 0.018). Frail patients were less likely to survive the intensive care unit (p = 0.03), hospital (p = 0.003) or to one year (p < 0.001). Frailty significantly increased one-year mortality hazards in unadjusted analyses (hazard ratio 1.96; 95% confidence interval 1.41–2.72; p < 0.001) and covariate adjusted analyses (hazard ratio 1.41; 95% confidence interval 1.00–1.98; p = 0.0497). Frail patients had more hospital admissions (p = 0.014) and longer hospital stays within both one year before (p = 0.002) and one year after intensive care unit admission (p = 0.012).
Conclusions
Frailty was common and associated with greater age, female gender, higher sickness severity and more healthcare use. Frailty was significantly associated with greater risks of mortality in both unadjusted and adjusted analyses. Frailty scoring is a promising tool which could improve decision making in intensive care.
Introduction
Frailty is a syndrome central to overall health, characterised by an accumulation of physiological and psychological deficits. These lead to decreased reserve,1,2 diminished independence3,4 and heightened vulnerability to illness.1,2,5 Consequently, frail patients have higher risks of adverse events, including mortality and health service use.1,2,6–9 This has been shown in community dwelling geriatric populations.1,2,5,6,10,11 Despite 30% of intensive care unit (ICU) patients being frail at presentation, 8 the independent effects of frailty after adjusting for confounders such as age and severity of sickness are unclear and often unaccounted for.3,8
Scoring systems to stratify risk are a key part of decision making in modern medicine. Frailty scoring quantifies functional reserve, dependence and vulnerability.2,12 Contrastingly, the commonly used Acute Physiology and Chronic Health Evaluation II score (APACHE-II) 13 predicts hospital mortality based on acute physiological measurements, age and a select few severe comorbidities. Frailty has been shown to predict risk of death better than measures of comorbidity 2 and age6–8,14 alone. Furthermore, acute physiology scores can have significant error, 13 especially in the longer term. 15 By incorporating measures of frailty into future scoring systems, previously omitted2,12,13,16 key factors of overall health affecting mortality would be accounted for. This could increase predictive accuracy and facilitate more informed decision making in ICU, or prior to critical illness, for issues such as ceilings of care, 7 appropriate referral and early interventions to reverse the trajectory of frailty to improve outcomes.1,4 However, before frailty scoring can be used to influence decision making in the ICU, its relationship with outcomes in the critically ill must be tested extensively. 3
Based on its relationship with increased vulnerability to adverse events,1–3,6–9 frailty is hypothesised to be associated with increased mortality, decreased independence and greater healthcare use. The primary objective of this study was to investigate the relationship of frailty and mortality one year after ICU admission. Secondary objectives included investigating the effect of frailty on other adverse outcomes, including ICU mortality, hospital mortality following ICU discharge, health service use and the proportions of patients discharged to dependent care living facilities.
Methods
Ethics
This research was approved by the West of Scotland Research Ethics Committee 4 and NHS Greater Glasgow and Clyde Research and Development Department prior to data collection. Explicit consent from patients was not required as this was a retrospective analysis of routine clinical data.
Study design, location and participants
This single-centre retrospective observational cohort study examined prospectively collected clinical data. All adult (≥18 years) patients admitted to Glasgow Royal Infirmary (GRI) ICU between 25 February 2016 and 8 May 2017 who had their frailty score completed at ICU admission were screened for inclusion. Patients were excluded if their ICU length of stay (LOS) was < 24 h. ICU readmissions within the inclusion period were excluded. Eligible admissions within this time period were defined as the primary admission.
Defining and assessing frailty
Frailty was assessed at ICU admission using the Clinical Frailty Scale (CFS).2,17 The CFS quantifies frailty by assessing baseline health and its trajectory prior to acute illness. CFS scores range from 1 to 9 with increasing scores representing declining independence, decreasing activity and diminishing resilience to adverse events. Factors considered in CFS assignment were those which increase vulnerability, such as general physiological decline, comorbidity, disability and psychological insufficiencies. 2 This information was obtained through clinical examination, assessment of medical records and history taking from the patient or their proxy. Scores were assigned by clinicians, using best clinical judgement, based on the overall presence and significance of deficits. For the purposes of analysis, frailty status was defined through a dichotomy of the CFS, classifying frail as CFS ≥ 5 and non-frail as CFS < 5.
Data management and outcome measures
CFS, age, sex and routine physiological measurements were recorded on electronic charts during ICU admission. The APACHE-II score and its related predicted hospital mortality were calculated from physiological measurements recorded within the first 24 h of ICU admission and medical records. Mortality and discharge to dependent care living facilities were recorded after ICU admission. Number of admissions and total LOS in ICU and hospital were recorded both one year prior to the primary admission, where the patient was included in the study, and one year after. All outcome measures were prospectively recorded on clinical databases during the study period. Relevant recorded data were searched and collated one year after the end of the inclusion period.
Statistical analyses
The prevalence of each CFS score was analysed. The frail (CFS ≥ 5) and non-frail (CFS < 5) groups were analysed for differences in baseline characteristics and outcome measures. 18 Continuous data were analysed using Welch’s t-test for normally distributed data and the Wilcoxon signed-rank test for non-normally distributed data. Categorical data were analysed using the Fisher’s exact test. Survival analyses started 24 h after ICU admission, so APACHE-II scores could be completed. Kaplan–Meier survival graphs were created and between-group survival differences were investigated using log rank tests. 19 Univariate analyses investigated the hazards of one-year mortality associated with factors known 24 h after ICU admission. 19 Variables with p-values < 0.1 were entered into an adjusted multivariable Cox proportional hazard model, which determined factors independently associated with survival. Chi squared tests for association and plots of hazard coefficients against time were used to assess proportional hazards assumptions. The average accuracy of APACHE-II predicted mortality for each group was calculated using the Brier score. 20 Sub-group survival analyses for bands of CFS scores (1–2, 3–4, 5–9) and unadjusted Cox proportional hazard modelling on each CFS score from 1 to 9 was used to investigate the presence of a dose–response relationship between accumulating frailty and increasing risks of adverse outcomes. For all analyses, p-values of < 0.05 were considered to be statistically significant.
The prevalence of frailty in ICU for ages ≥ 18 was anticipated to be 30%. 8 One-year mortality was estimated at 35%8,21 and the associated hazard ratio (HR) if frail was approximated at 1.53. 8 The confounding effect of covariates of frailty with one-year mortality is uncertain in the literature, but based on clinical knowledge, the Pearson correlation coefficient was estimated at 0.4. The required sample size to detect statistically significant between-group differences with at least 80% power at the 5% significance level with these estimated values was 985. 22 All analyses were completed using R version 3.4.1 software. 23
Results
Screening and prevalence of frailty
During the study period, 400 eligible patients were identified (Figure 1). Of the 725 patients screened, 44.8% were ineligible; 9 (1.2%) were under 18 years old, 103 (14.2%) had an ICU LOS < 24 h, 30 (4.1%) had already been admitted to ICU within the inclusion period and 183 (25.2%) had incomplete CFS scores. Data on ineligible patients were excluded from analyses. All eligible patients were followed up at least one year from inclusion and included in the analysis. Of the 400 patients analysed, 111 (27.8%) were frail and 289 (72.3%) were non-frail. A very small proportion of patients (1.25%) were classified as very severely frail (CFS 8) or terminally ill (CFS 9).
Study consort diagram. Flow diagram from screening to analysis, showing reasons for exclusion, with numbers and percentages of patients in each group.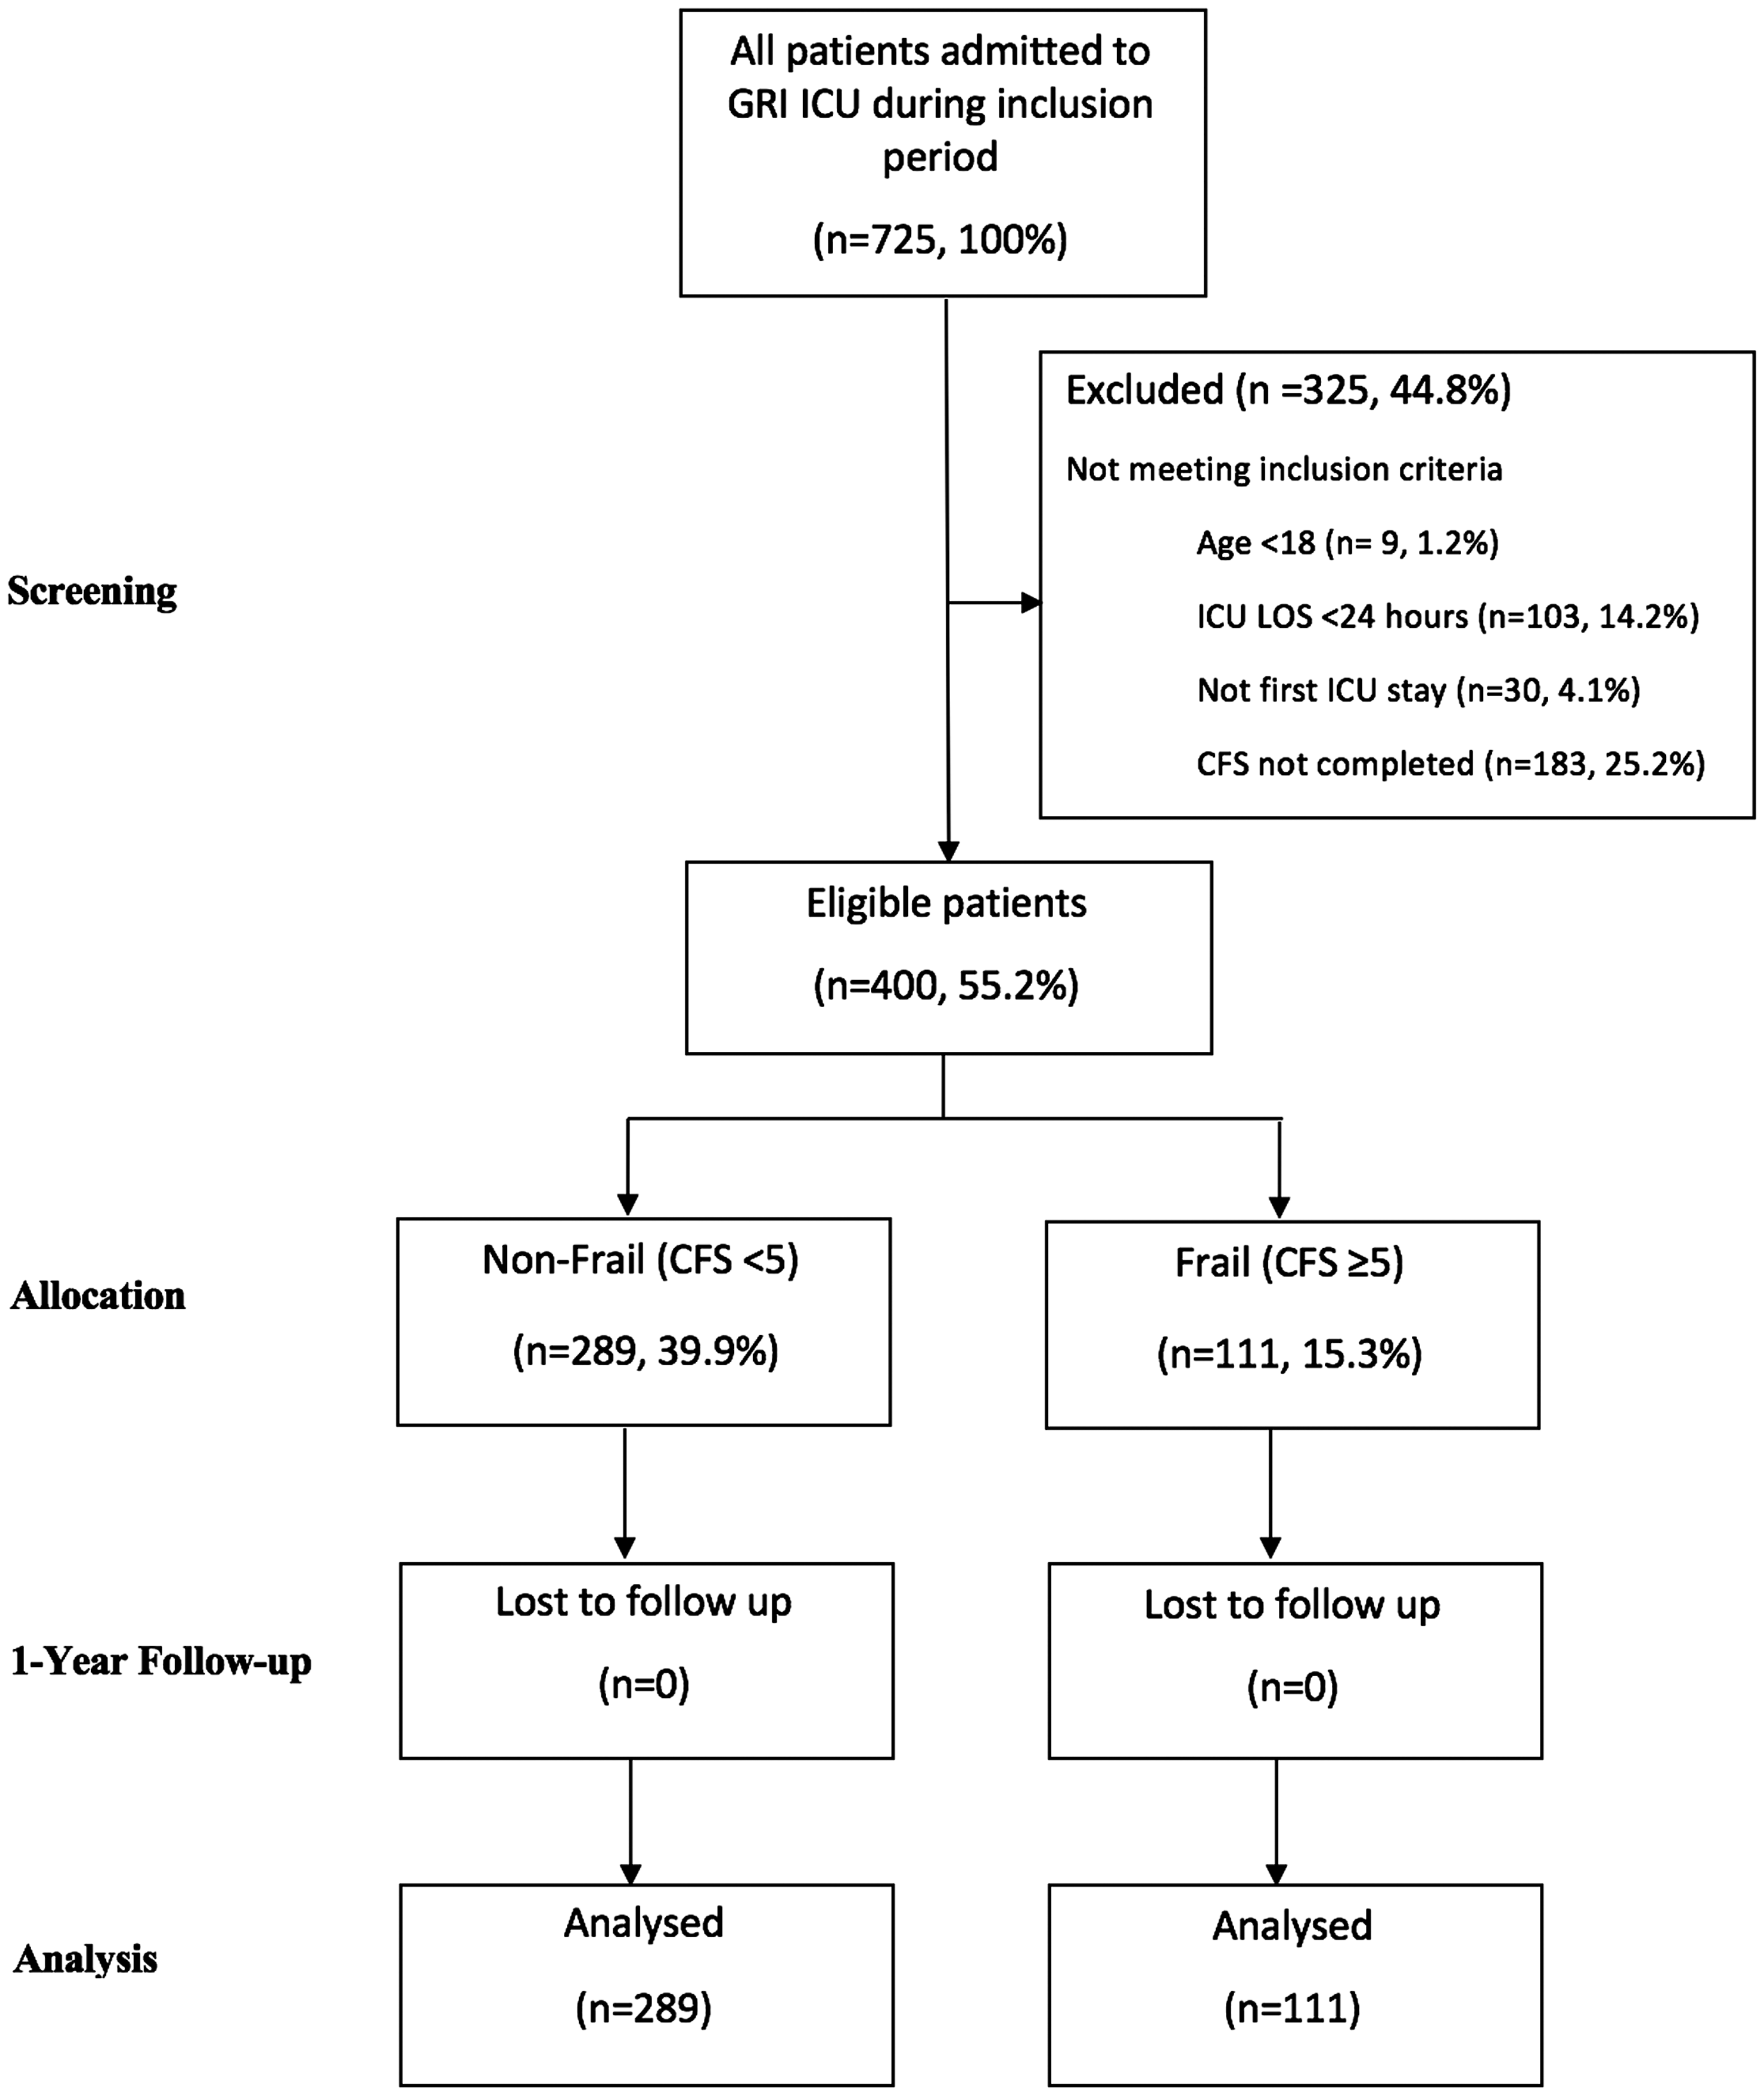
Relationships between frailty and covariates at inclusion
Patient characteristics at ICU admission, grouped by frailty status.
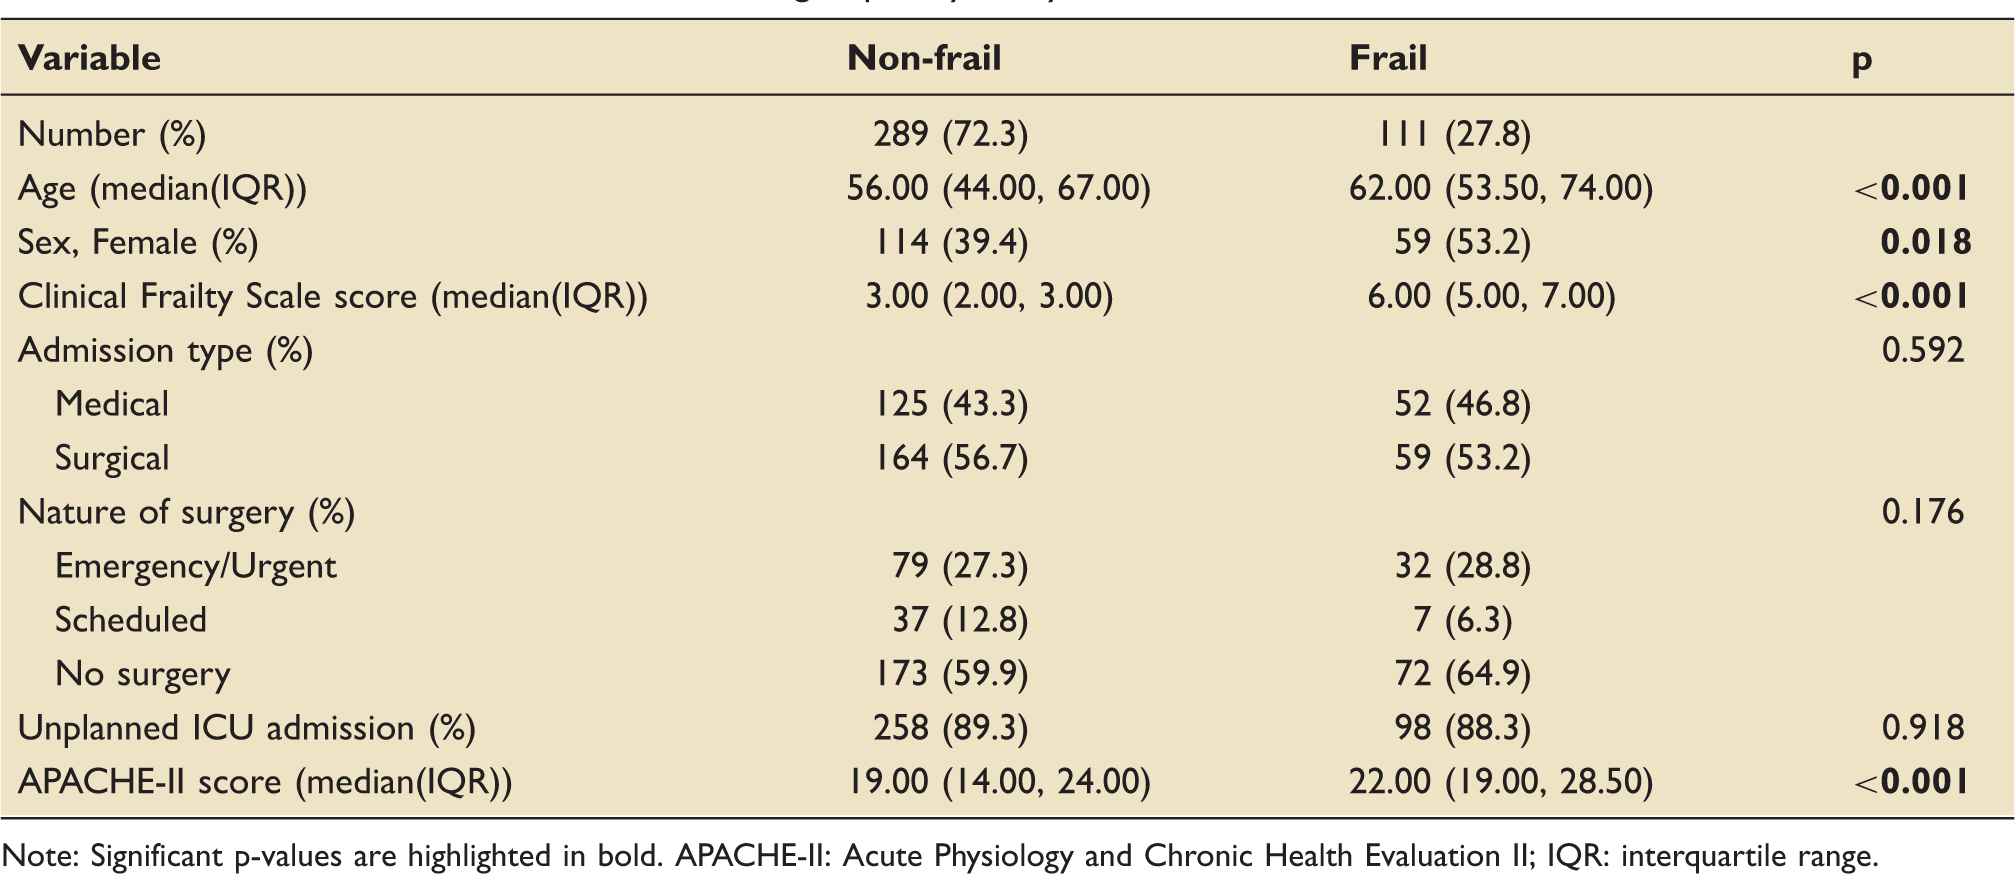
Note: Significant p-values are highlighted in bold. APACHE-II: Acute Physiology and Chronic Health Evaluation II; IQR: interquartile range.
Non-fatal outcomes
Hospital and ICU admissions over the study period, grouped by frailty status.
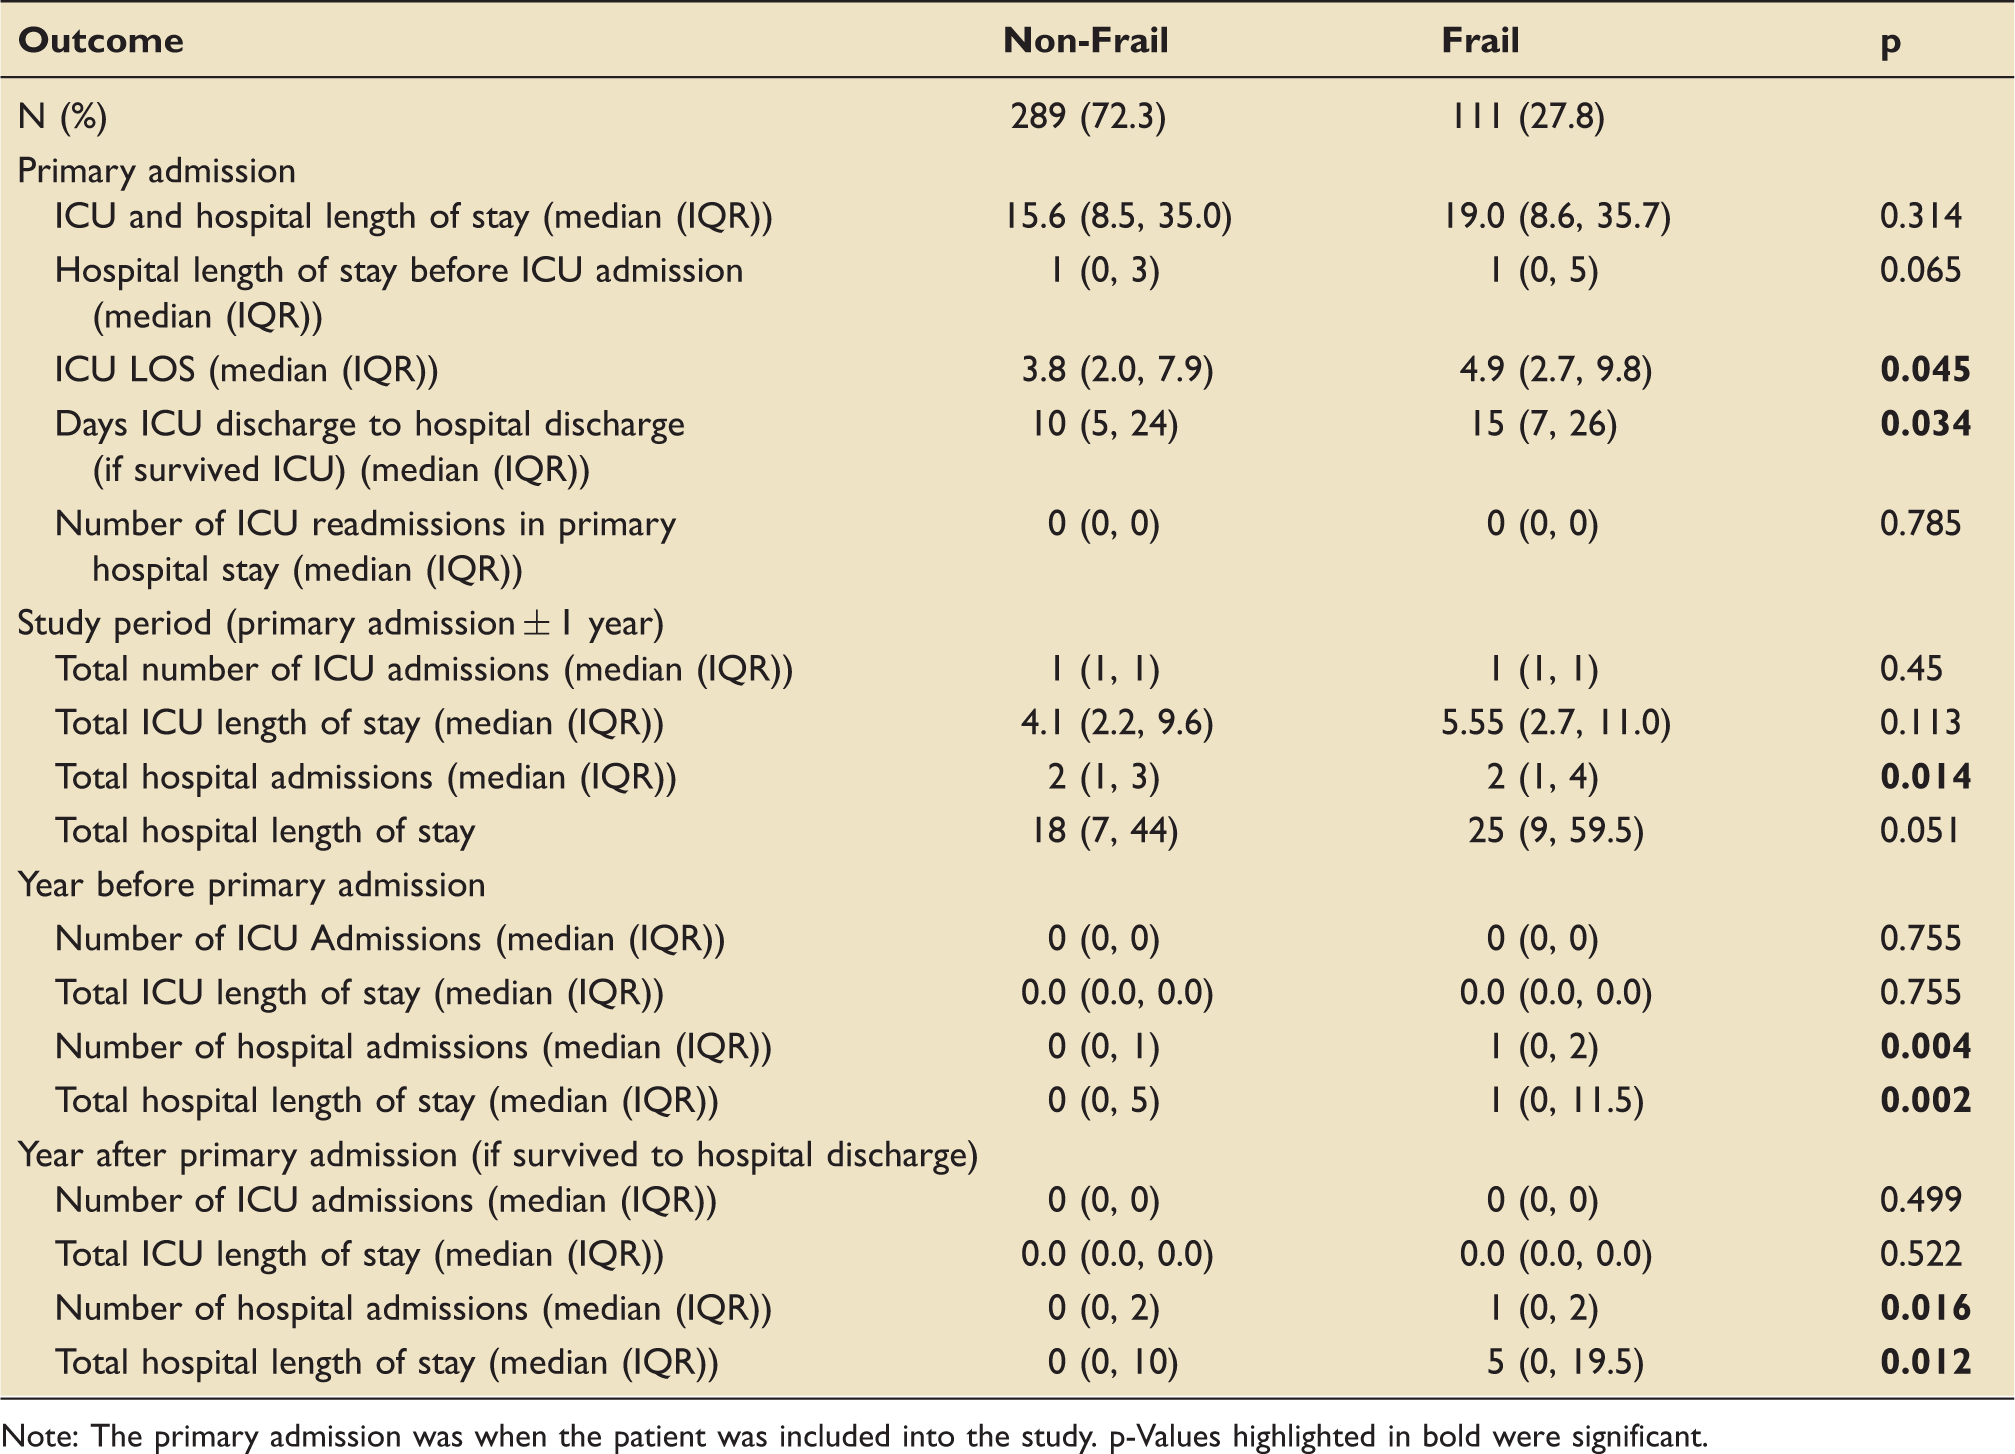
Note: The primary admission was when the patient was included into the study. p-Values highlighted in bold were significant.
Outcome measures within one year, grouped by frailty status.
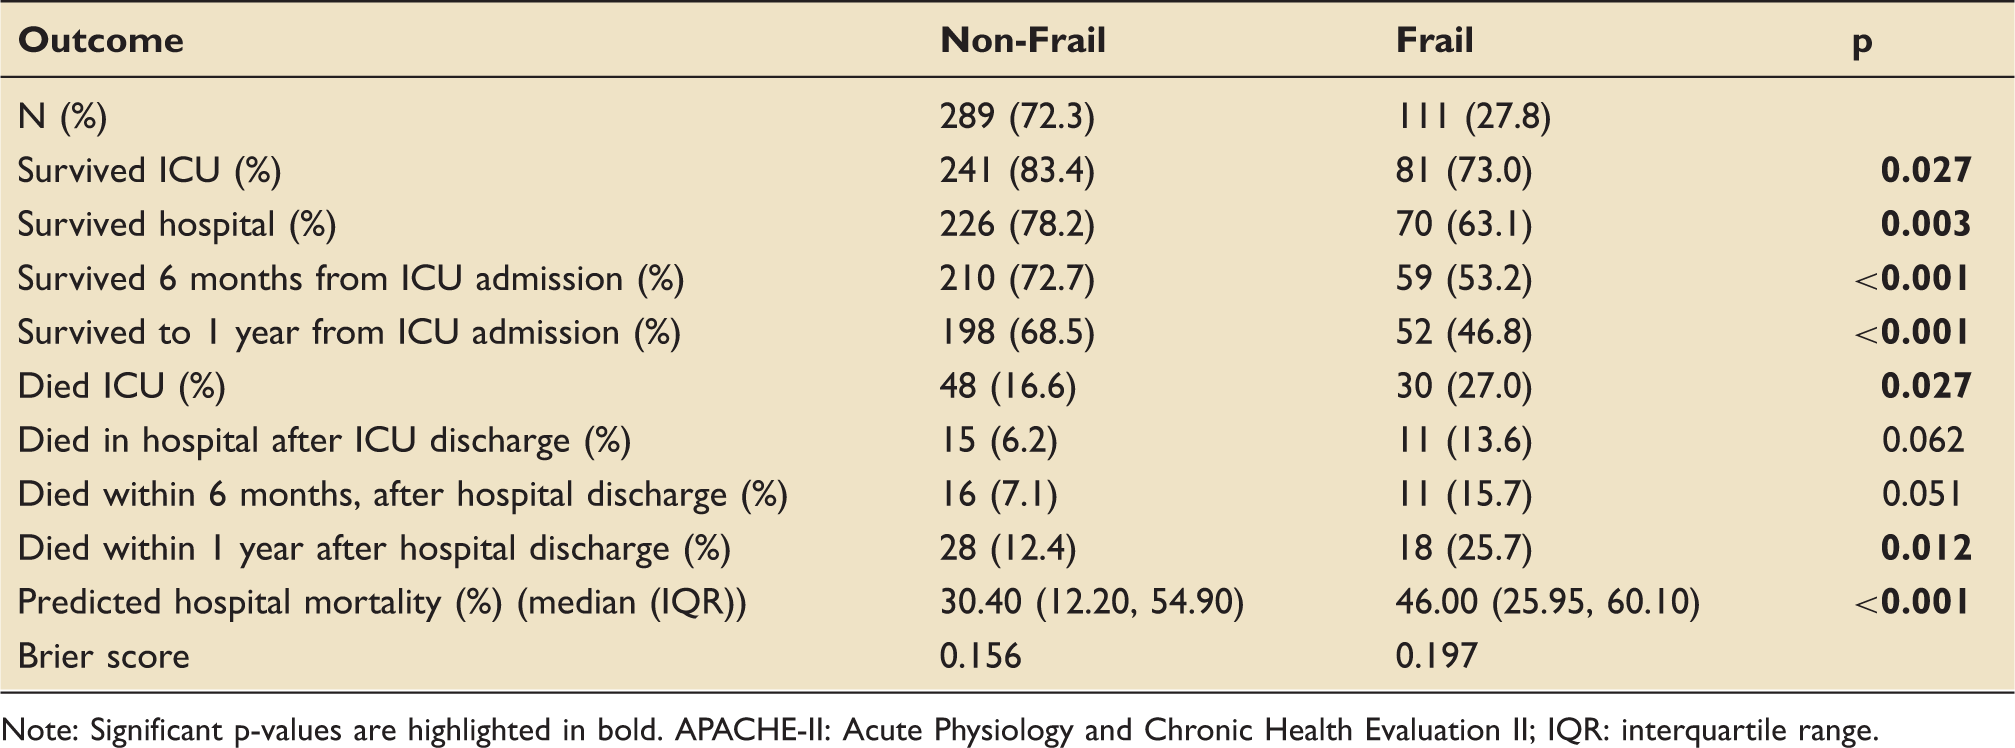
Note: Significant p-values are highlighted in bold. APACHE-II: Acute Physiology and Chronic Health Evaluation II; IQR: interquartile range.
Frailty status and unadjusted survival
Frail patients were significantly less likely to survive to one year compared to non-frail patients (46.8% vs. 68.5%, p < 0.001). Similarly, frail patients were less likely to survive ICU (73.0% vs. 83.4%, p = 0.027) or hospital after ICU discharge (63.1% vs. 78.2%, p = 0.003). APACHE-II predicted hospital mortality was higher in the frail group compared to the non-frail group (median%(IQR): 46.0(26.0,60.1) vs. 30.4(12.2,54.9)). The Brier score is a measure of predictive accuracy calculated from differences in predicted mortality and observed mortality. It ranges from 0 to 1, where higher scores reflect greater inaccuracy of prediction. The Brier score was higher in frail patients compared to non-frail patients (0.197 vs. 0.156), reflecting a lower APACHE-II predictive accuracy. These results are summarised in Table 3.
There was significantly greater ICU mortality in frail patients (27.0% vs. 16.6%, p = 0.027) but smaller subsequent differences in mortality after ICU discharge. For those who survived ICU, more frail patients died in hospital after ICU discharge (13.6% vs. 6.2%, p = 0.062) and within six months after hospital discharge (15.7% vs. 7.1%, p = 0.051); however, these differences were not statistically significant. For those who survived to hospital discharge in their primary stay, within one year of hospital discharge, there was statistically significantly greater mortality in the frail group (25.7% vs. 12.4%, p = 0.012). These mortality rates are illustrated by the steep initial drop in survival curves in Figure 2, where most of the between-group survival difference was within the first 30 days from ICU admission. Following this, mortality rates decrease for both groups, but the frail group’s mortality persists at a slightly higher rate.
Unadjusted survival curves stratified by frailty status. Kaplan–Meier survival curves representing survival to 365 days, grouped by frailty status. The number and percentage of patients alive, and still at risk of death at each 30-day time point in each group are displayed in the table below the graph.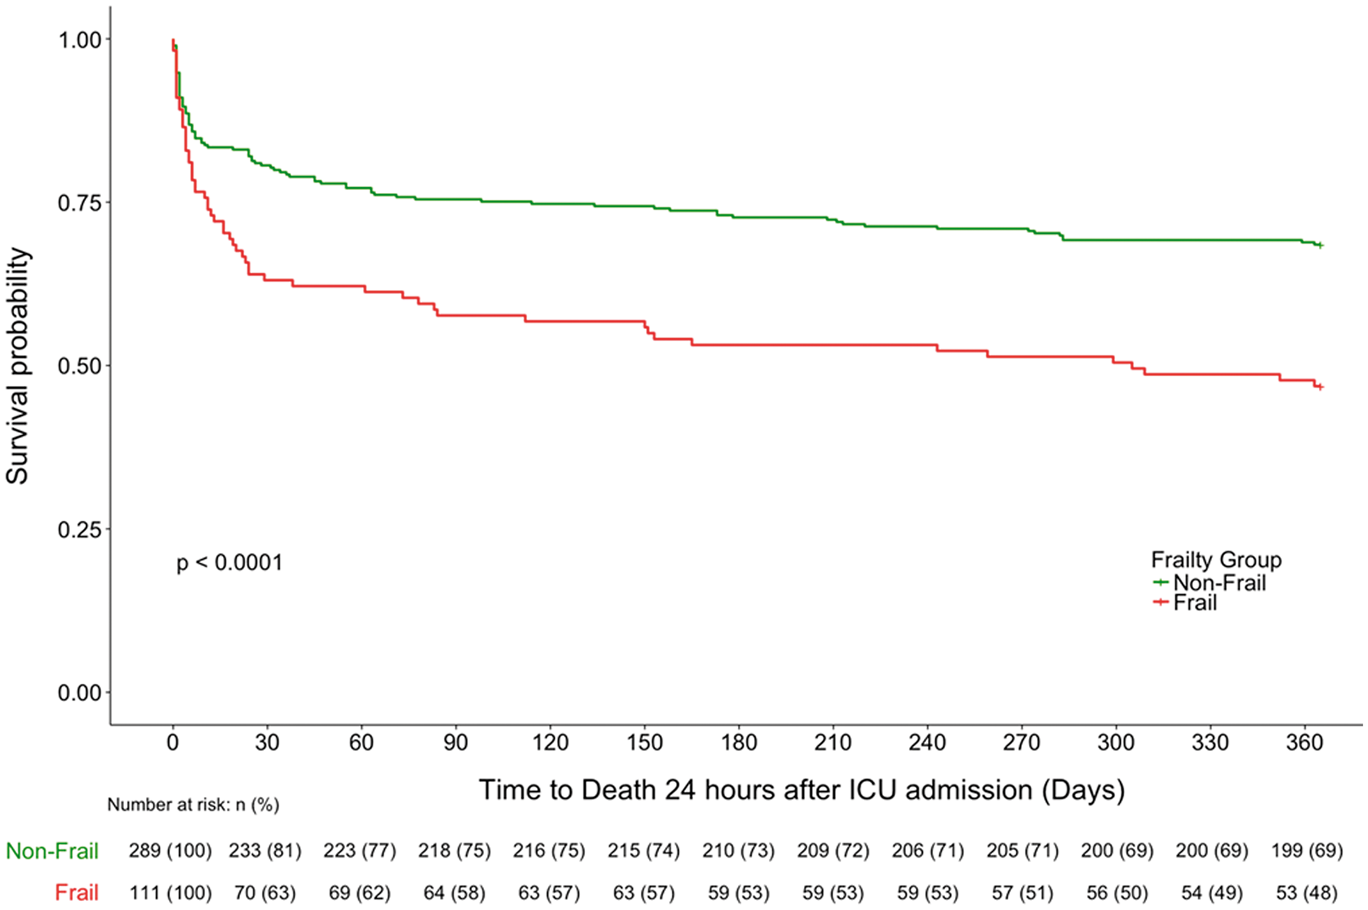
Dose–response relationship of frailty and mortality risk
There were significant between-group differences (p < 0.001) in mortality rates between frailty subgroups (CFS 1–2, CFS 3–4, CFS 5–9) in unadjusted subgroup survival analyses. Figure 3 illustrates the significant evidence supporting the presence of a clearly separated dose–response relationship, where the accumulation of frailty was associated with increasing risks of one-year mortality. In addition to subgroup analyses, the hazard of one-year mortality for each CFS score from 2 to 9 was analysed with reference to CFS 1. CFS scores with a statistically significantly greater HR were CFS 5 (HR 3.34; 95% confidence interval (CI) 1.39–8.06; p = 0.007) and 6 (HR 3.43; 95% CI 1.49–7.87; p = 0.004). CFS 2, 3, 7, 8 and 9 did not have statistically significantly different hazards of one-year mortality compared to CFS 1.
Unadjusted survival curves stratified by frailty subgroups. Kaplan–Meier survival curves representing survival to 365 days, grouped by frailty subgroups. Fit patients had CFS scores of 1 and 2, vulnerable patients were characterised by CFS 3 and 4, and frail patients were defined as CFS 5 and above. The number and percentage of patients alive, and still at risk of death at each 30-day time point in each group are displayed in the table below the graph.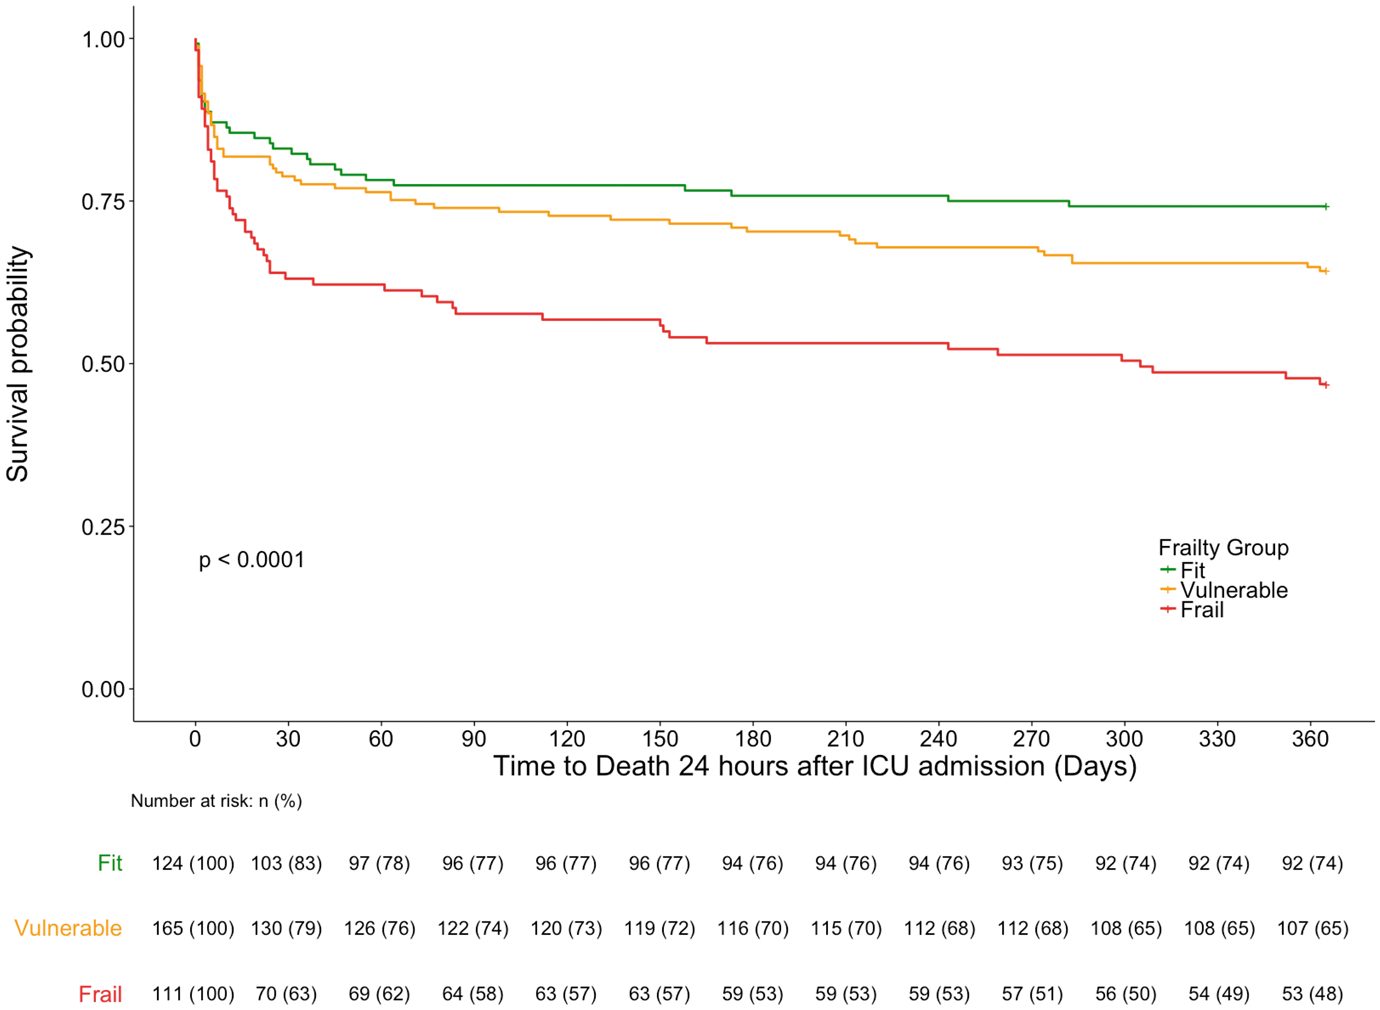
Unadjusted one-year mortality hazards analyses
Unadjusted–adjusted one-year mortality Cox proportional hazards.
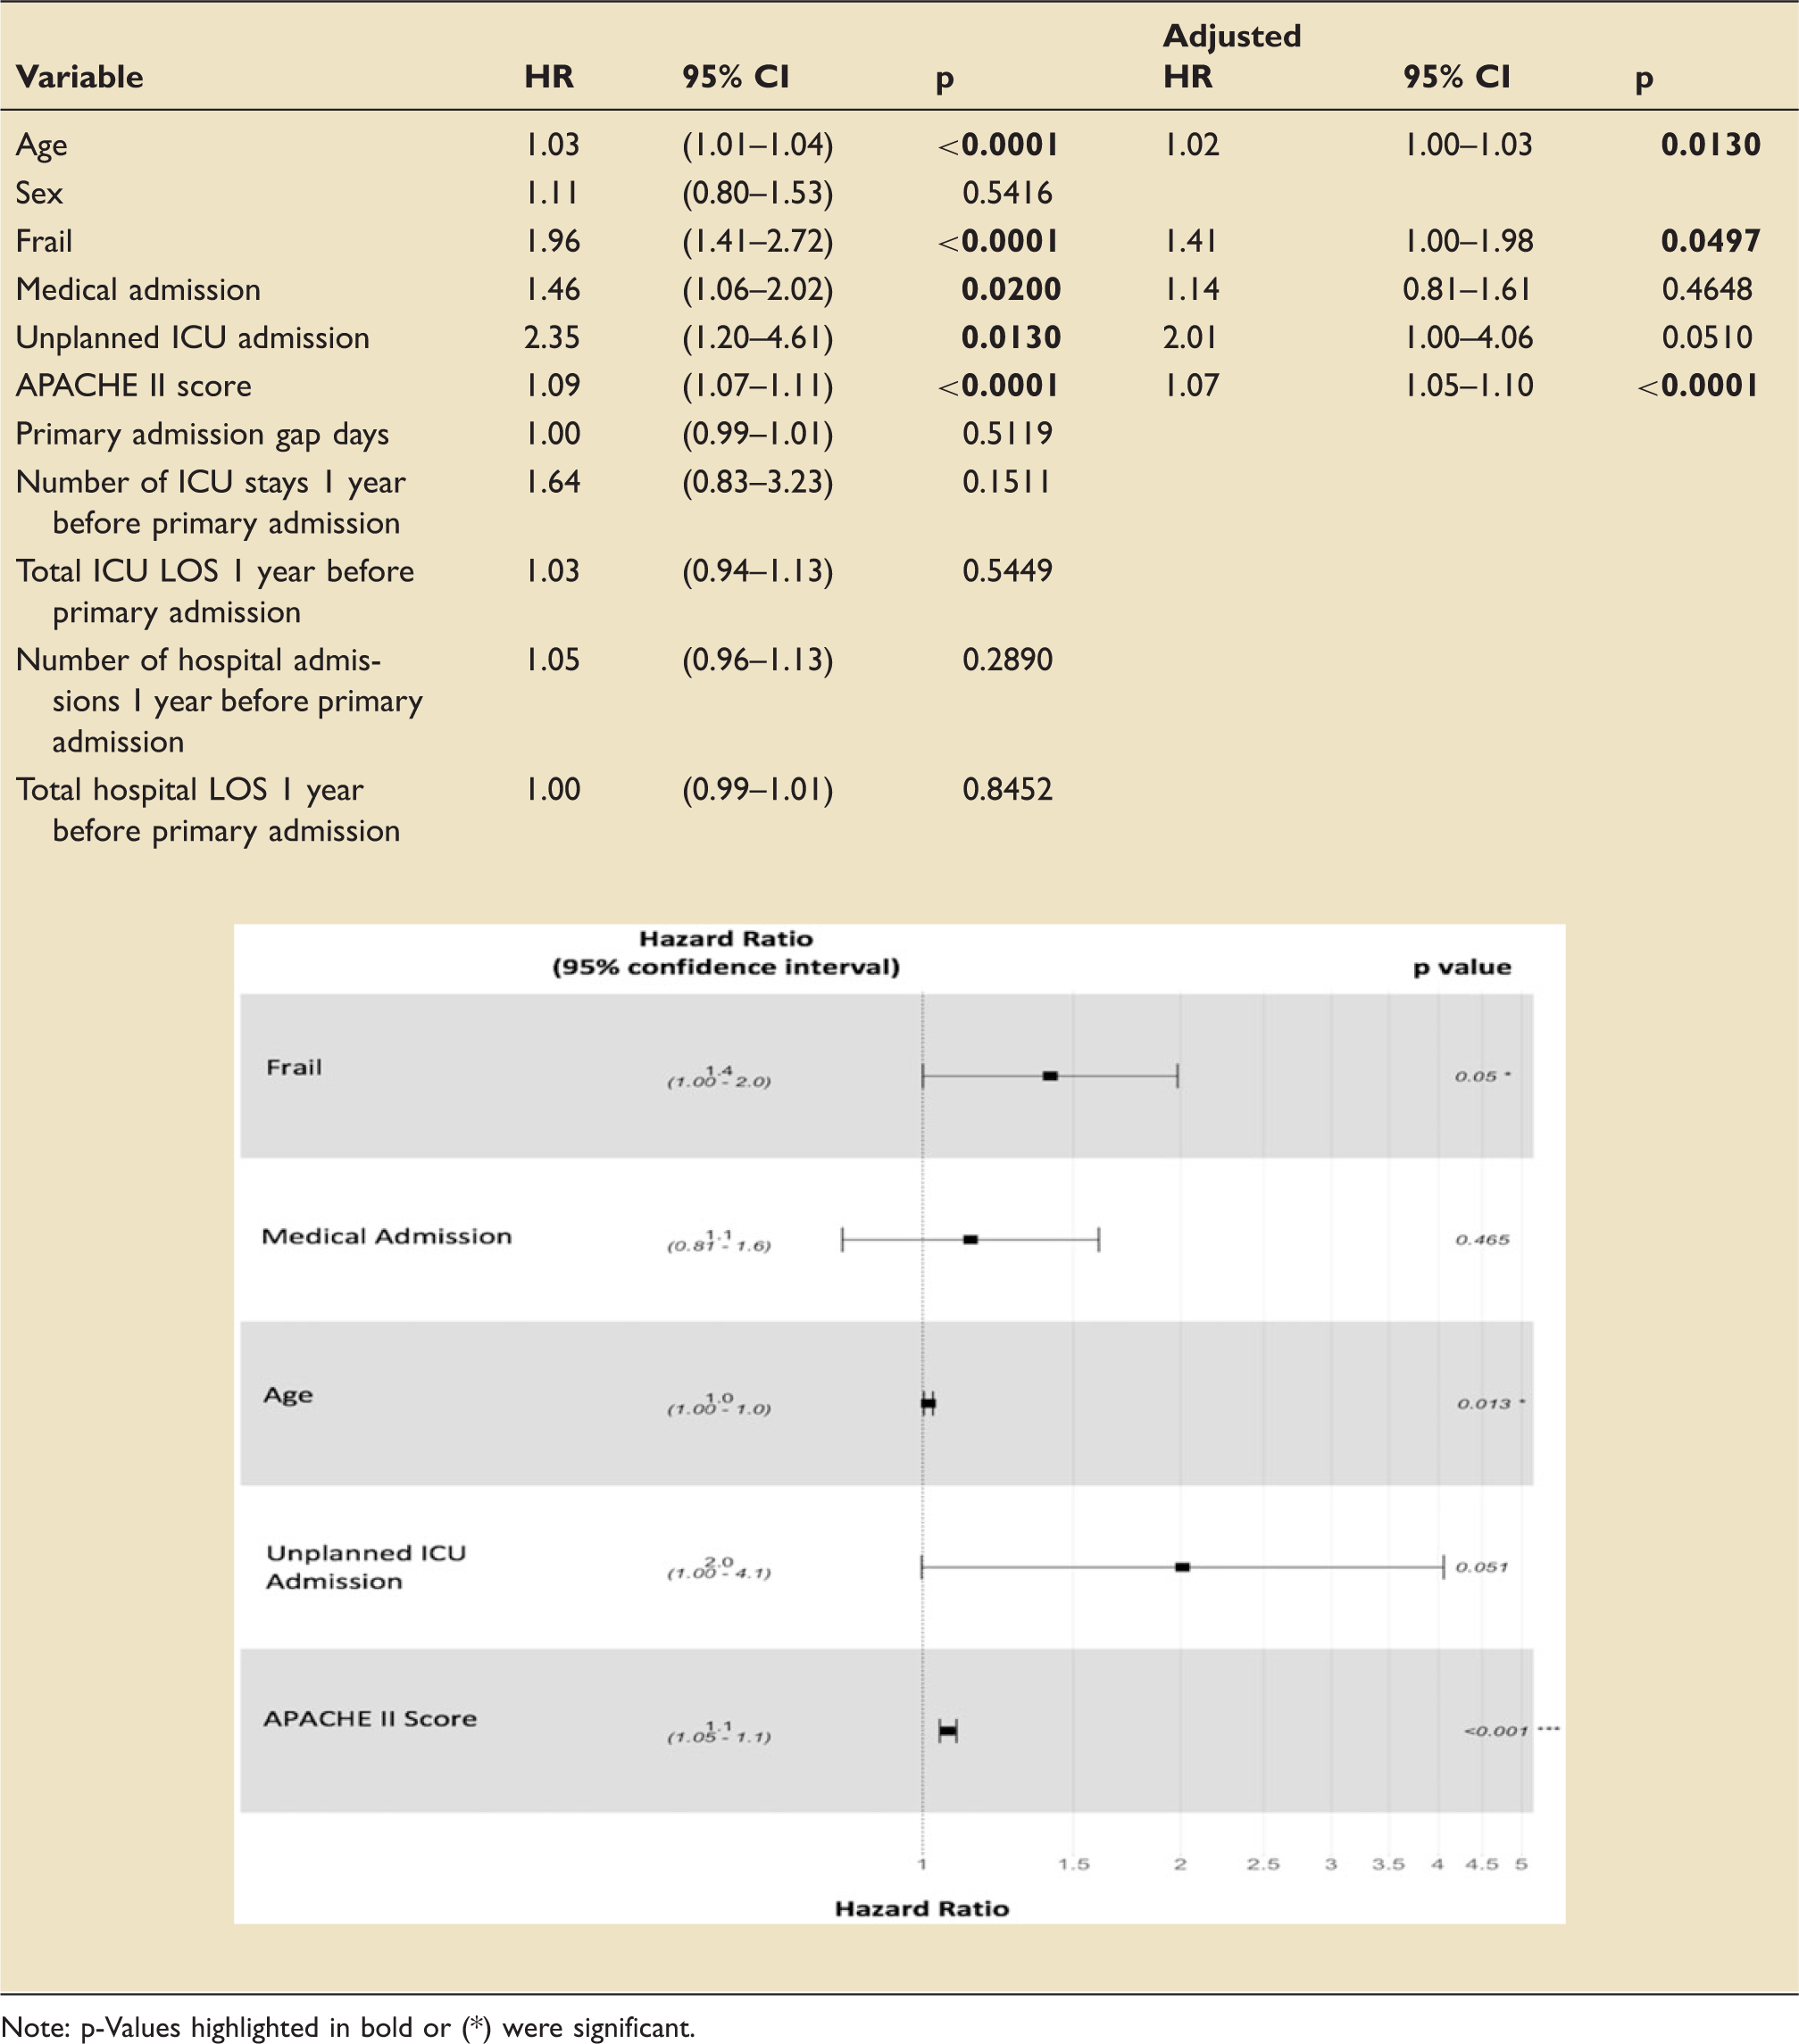
Note: p-Values highlighted in bold or (*) were significant.
Adjusted one-year mortality hazards analyses
After adjusting for covariates, factors independently associated with hazards of mortality at one year were frailty status (HR 1.41; 95% CI 1.00–1.98; p = 0.0497) age (HR 1.02; 95% CI 1.00–1.03; p = 0.013) and APACHE-II score (HR 1.07; 95% CI 1.05–1.10; p < 0.0001). Factors entered into the multivariable model which were not independently associated with one-year mortality were unplanned ICU admissions (HR 2.01; 95% CI 1.00–4.06; p = 0.051) and admitting speciality (HR, 1.14; 95% CI 0.81–1.61; p = 0.465). These results are summarised in Table 4.
Discussion
Interpretation of findings with context to existing literature
Characteristics at inclusion
This single-centre retrospective observational cohort study investigated the epidemiology and impact of frailty in the critically ill. A large number of screened patients had to be excluded from analyses due to uncompleted CFS scores. This was because the CFS was not routinely administered in GRI ICU prior to the study period, and there were inconsistencies in implementing it for every patient. The observed prevalence of frailty was 27.8%, similar to reported values of 30% from a recent meta-analysis of frailty in the critically ill. 8 Reinforcing existing reported demographics,2,3,7,24 frail patients were older and more likely to be female. These factors may increase frailty due to decreased muscle mass, which can lead to decreased mobility, activity and metabolic rate.1,3–5 Supporting prior literature, the groups were very similar in urgency of admission, admitting speciality and surgical status.6,9 Subsequent severity of sickness and mortality were significantly greater in frail patients, reflecting heightened vulnerability despite initially equivalent reasons for ICU admission.
Non-fatal outcomes
The decreased reserve and greater severity of sickness observed in frail patients likely resulted in both more frequent hospitalisation and longer total requirements for in-hospital recovery. Frailty has previously been associated with greater risks of discharge to dependent care living facilities;2,8,25,26 however this was not observed in this study. Comparing pre-admission residence and independence to discharge disposition would have been a better measure of resilience to critical illness but this information was not readily available.
Mortality
Most observed mortality differences stemmed from the weeks following ICU admission. Despite between-group mortality rates converging thereafter, the frail group mortality persisted at a slightly higher rate throughout the study. The frailty syndrome encompasses a number of deficits such as sarcopenia and nutritional deficiencies which could contribute concurrently to decreased reserve and heightened vulnerability to critical illness. This ultimately leads to greater mortality risks from the initial insult and from complications during recovery.1,3,5,8
The unadjusted HR of 1.96 observed in this study is at the upper end of reported values for similar follow-up periods ranging from 1.4 to 2.0.6–9,27,28 Most of the published literature has stemmed from North America and mainland Europe. 8 The studied population may be more vulnerable to the consequences of frailty, which may explain the observation of a higher than expected HR. Alternatively, the modest sample size may have inflated the observed hazard due to chance.
Dose–response relationship of frailty and mortality
Subgroup survival analyses clearly illustrated a dose–response relationship of frailty and accumulating mortality risk, which reinforces a number of published studies.2,5,6,8,14 The high probability that a dose–response relationship of frailty and mortality exists emphasises the importance of considering frailty and its effects as a spectrum, not a binary entity.
Factors independently associated with mortality at 1 year
Many published ICU frailty studies have been underpowered to detect the independent effects of frailty after covariate adjustment.6,9,14,27,28 To address this, a recent systematic review 8 pooled adjusted analyses and found frailty to be independently associated with increased mortality after ICU treatment. However, the significant heterogeneity between included studies decreased the validity of this result. In this study, frailty was independently associated with an increased risk of mortality at 1 year with borderline significance. As anticipated,2,6,7,13 greater age and higher APACHE-II scores were significantly associated with increased risks of mortality and were important confounders to address. Although significantly associated with increased hazards of one-year mortality in unadjusted analyses, the admitting specialty and whether the ICU admission was emergency or elective was not independently associated with a greater hazard of mortality at 1 year after covariate adjustment. This study may have been underpowered to detect these differences with statistical significance.
Implications and recommendations for future research
Frailty was significantly associated with greater mortality hazards in both unadjusted and covariate adjusted analyses. Since the independent effect of frailty was of borderline significance, future studies should investigate the reproducibility of this finding with more power and precision.
APACHE-II mortality predictions were less accurate in frail patients, which may indicate that the frailty score encapsulated factors affecting mortality that APACHE-II did not. Incorporating elements of frailty scoring into existing predictive tools may better capture overall health alongside acute physiology, allowing more accurate risk assessment and outcome prediction. This would facilitate more informed decisions within the ICU regarding interventions and ceilings of care. 7 Frailty scoring implemented prior to critical illness could aid ICU referral decisions by objectively encapsulating functional status and identifying patients most likely to benefit from intervention.
The principal time period where frail patients exhibited greater mortality rates compared to non-frail patients was within the first 30 days of ICU admission. Future research should aim to identify modifiable components of frailty which increase vulnerability to mortality in this period. Treatments to interrupt sarcopenia and metabolic disturbance such as nutrition therapy, resistance training and hormone replacement therapy1,4 are promising candidates for frailty intervention. These may be applied in hospital or community settings, either reactively or prophylactically. This may result in earlier convergence of survival rates, decrease the impact of frailty on outcomes and reduce mortality disparity.
Limitations
This study has a number of limitations. Firstly, the CFS was dichotomised in most analyses to maximise power. The threshold used was chosen as it signifies a clinically relevant increase in dependence 2 and aids comparison to existing literature.6,27–29 However, dichotomy analyses lowered the sensitivity for detecting the effects of accumulating frailty and decreased the prognostic value of individual CFS scores. Secondly, reliance on clinical judgement to assign CFS scores 2 may be criticised for subjectivity. However, the CFS has been validated against more extensive frailty scores2,3,9 and is the most pragmatic tool frailty assessment in critically ill patients who cannot cooperate.2,3,24 Thirdly, frailty scoring was implemented at ICU admission so there was no direct account of health prior to critical illness. Finally, this was an observational study, where findings imply association not necessarily causation.
Conclusions
There is significant evidence to suggest that both the presence and accumulation of frailty increased mortality risk after ICU admission. Frailty was independently associated with greater mortality hazards at one year. Future studies are required to determine the generalisability and reproducibility of these findings. Frailty scoring is a promising system for risk stratification which could facilitate more accurate outcome prediction and better decision making in intensive care.
Footnotes
Authors’ contributions
DH: Literature review, data acquisition, data analysis, data interpretation, reporting. MGB: Conception of research, initial design of research, reviewing.
Acknowledgements
Participating investigators: DH is very grateful to Dr Shaw, who provided his expert advice on statistical analysis strategy and interpretation. Collected data: Many thanks to Miss Lyndsey Jarvie who assisted DH with the initial patient search to find patients admitted to the ICU within the study period. This work was performed at the Glasgow Royal Infirmary.
Declaration of conflicting interests
The author(s) declared no potential conflicts of interest with respect to the research, authorship, and/or publication of this article.
Funding
The author(s) disclosed receipt of the following financial support for the research, authorship, and/or publication of this article: This work was sponsored by NHS Greater Glasgow and Clyde. The Carnegie Trust provided student funding to DH. Neither of these bodies had any role in the study design, undertaking or reporting.