
Abstract
Background
In critically ill patients, who require multiple blood gas assessments, agreement between arterial and venous blood gas values for pH and partial pressure of carbon dioxide, is not clear. Good agreement would mean that venous values could be used to assess ventilation and metabolic status of patients in intensive care unit.
Methods
All adult patients admitted to Alfred intensive care unit, Melbourne, from February 2013 to January 2014, who were likely to have arterial and central venous lines for three days, were enrolled. Patients on extra-corporeal life support and pregnant women were excluded. After enrolment, near simultaneous arterial and central venous sampling and analysis were performed at least once per nursing shift till the lines were removed or the patient died. Bland-Altman analysis for repeated measures was performed to assess the agreement between arterio-venous pH and partial pressure of carbon dioxide.
Results
A total of 394 paired blood gas analyses were performed from 59 participants. The median (IQR) number of samples per patient was 6 (5–9) with the median (IQR) sampling interval 9.4 (5.2–18.5) h. The mean bias for pH was + 0.036 with 95% limits of agreement ranging from − 0.005 to + 0.078. For partial pressure of carbon dioxide, the values were −2.58 and −10.43 to + 5.27 mmHg, respectively.
Conclusions
The arterio-venous agreement for pH in intensive care unit patients appears to be acceptable. However, the agreement for partial pressure of carbon dioxide was poor.
Keywords
Introduction
Arterial blood gas (ABG) analysis is an integral part of the assessment of oxygenation, ventilation and metabolic status of critically ill patients in intensive care unit (ICU). Since the original description in 19th century, the techniques for assessing gas tensions in blood have undergone refinements resulting in accurate point of care machines.1–3 The physiological description of respiratory failure and metabolic status were originally defined in terms of arterial gas tensions and pH measurements. Consequently, many clinical guidelines for management of respiratory failure specify the use of, and response to, ABG thresholds. 4
Similarly, gas tensions and the pH of blood from the venous compartment can be measured using the same apparatus. The relationship between arterial PCO2, PO2, pH, other metabolic values and their venous counterparts has been explored extensively in well subjects.2,5 More recently several studies have examined arterial-venous (AV) relationships for these values in a variety of settings.6–8 Most of them have been conducted in an emergency department setting on single blood gas values. A few ICU studies have also looked at this relationship.9–15 However, there are methodological issues related to statistical analysis in these studies. Some studies did not use Bland-Altman (BA) analysis. 13 Amongst those which used BA analysis, most treated the repeated measurements per subject as independent measurements and in one ICU study, 10 a mean value of the repeated measures was used to calculate AV agreement.
BA analysis is a commonly used statistical method in method comparison studies. 16 The analysis shows the results by plotting difference between the results of the two methods against their mean in each subject and showing the mean difference between the two methods with their 95% limits of agreement (LOA). The original description of BA analysis was for one pair of measurements done on one occasion. In other words, the analysis assumed independence between the pairs of measurements. When there are repeated measurement pairs taken per subject, this assumption is invalid and doing a naive analysis assuming independence between pairs from the same subject could lead to calculation of narrower 95% LOA leading to false conclusion of good agreement.17,18 Therefore, it is important to account for repeated measures in the analysis. There are techniques described in the literature for this type of analysis.19,20
For patients admitted to ICU, repeated measures of blood gas tensions per subject over an extended period of time is common practice. Thus, assessing the repeatability of AV differences and its impact on agreement is important. It is likely that a variety of physiological factors both within and between patients may influence AV differences for key measures. The relative contribution of these is currently unknown. If the agreement is good in a mixed group of ICU patients over a period of time with varying physiology, it would be feasible to use venous blood gases (VBGs) to assess the ventilation and metabolic status of patients. This may also justify the following of trends in venous values as a guide to patient progress, anecdotally, a practice that has been widely adopted but currently lacks validation.
In this study, we wanted to assess the agreement between the pH and PCO2 of ABG and VBG over a period of time in patients admitted to ICU.
Materials and methods
This study was a prospective observational study undertaken at The Alfred Hospital ICU between February 2013 and January 2014. The Alfred hospital is a 550-bed tertiary adult hospital in Melbourne, Australia, with a 45-bed-capacity ICU, which admits approximately 3000 patients per year including cardiothoracic surgery, general surgery, neurosurgery and general medical admissions. It also hosts regional services for heart and lung transplantation, extracorporeal membrane oxygenation (ECMO) and mechanical cardiac support, adult trauma, burns, cystic fibrosis, hyperbaric medicine, HIV medicine, haematological malignancy and haemophilia.
The study was approved by the local human research ethics committee (Project no. 464/12). Written informed consent was obtained from all the participants or from their next of kin, where individual consent could not be assessed/ given.
Those eligible for the study were adult ICU patients with central venous and arterial catheters in situ, and whose lines were expected to stay in situ for at least three days and who did not need therapy necessitating an extracorporeal circuit (e.g. haemodialysis/filtration or ECMO). Wherever an ABG for routine monitoring or clinical necessity was ordered, this was paired with a VBG from the central line within 5 min. Pairing of samples continued until the lines were removed, the patient died or until 10 pairs of blood gases had been taken. In addition to baseline demographic data and Acute Physiology and Chronic Health Evaluation (APACHE) III severity scores on admission to ICU, data on the location of lines used for blood sampling, sequence of blood sampling, patient temperature, haemodynamics, ventilator settings and organ supports at the time of blood sampling were recorded. All ICU nurses were familiar with standardized protocols for sample collection and were assisted by research nurses where needed.
The paired blood gas analyses were performed immediately one after another in a random order in the same blood gas analyser, using one of the three identical blood gas analysers (Rapidlab® 1265, Siemens Healthcare, Erlangen, Germany) in ICU, measuring typical blood gas and metabolic values together with full co-oximetry. The results, analysis location and analysis timing of each sample were warehoused in a central server networked to each analyser (Rapidcomm®, Siemens Healthcare, Erlangen, Germany) together with a unique patient record number matching the clinical file of the patient. The details of the blood gas analysis, analysis location and analysis time were collected for all the blood samples.
Statistical analysis
Continuous variables were summarized using means and standard deviation (SD), or median with 25th and 75th quartiles. Discrete variables were summarized as percentages. We used the BA method for repeated measurement to compare the agreement between the ABGs and VBGs for pH and PCO2. 20 The results were summarized in terms of BA plots, which show the difference between ABG and VBG results, versus the average of ABG and VBG results, as well as the mean difference between and corresponding 95% confidence intervals (CI), and the 95% LOA. If the mean difference is close to zero, then we can conclude there is minimal bias between the two approaches and there is a good agreement between the two approaches if the 95% LOA are close together. The analysis is based on a mixed modelling approach in which the method (ABG or VBG) by subject agreement and subject by repeated measurement interaction were used as random effects. We also performed sensitivity analysis for PCO2 agreement by dividing the mean PCO2 values into two groups, <35 mmHg and ≥35 mmHg, and repeated the analysis. The repeated measures analyses were performed using Stata 11.2 (StataCorp, Tx, USA) software and SAS® Studio (SAS Institute, Cary NC).
Results
Sixty patients were recruited, contributing a total of 405 paired ABGs and VBGs (810 total samples). Ten pairs were rejected due to very large haemoglobin differences (>20 gm/L) between arterial and venous samples implying poor draw technique. Subsequently one patient had to be excluded from analysis as they had only one valid pair of samples. One additional pair of blood gases was excluded due to presumed contamination of the venous sample which had a pH of 6.73 when the arterial pH was 7.41. Thus, the final study population comprised 59 individuals who had a total of 393 paired ABG and VBG.
Patient characteristics (N = 59).
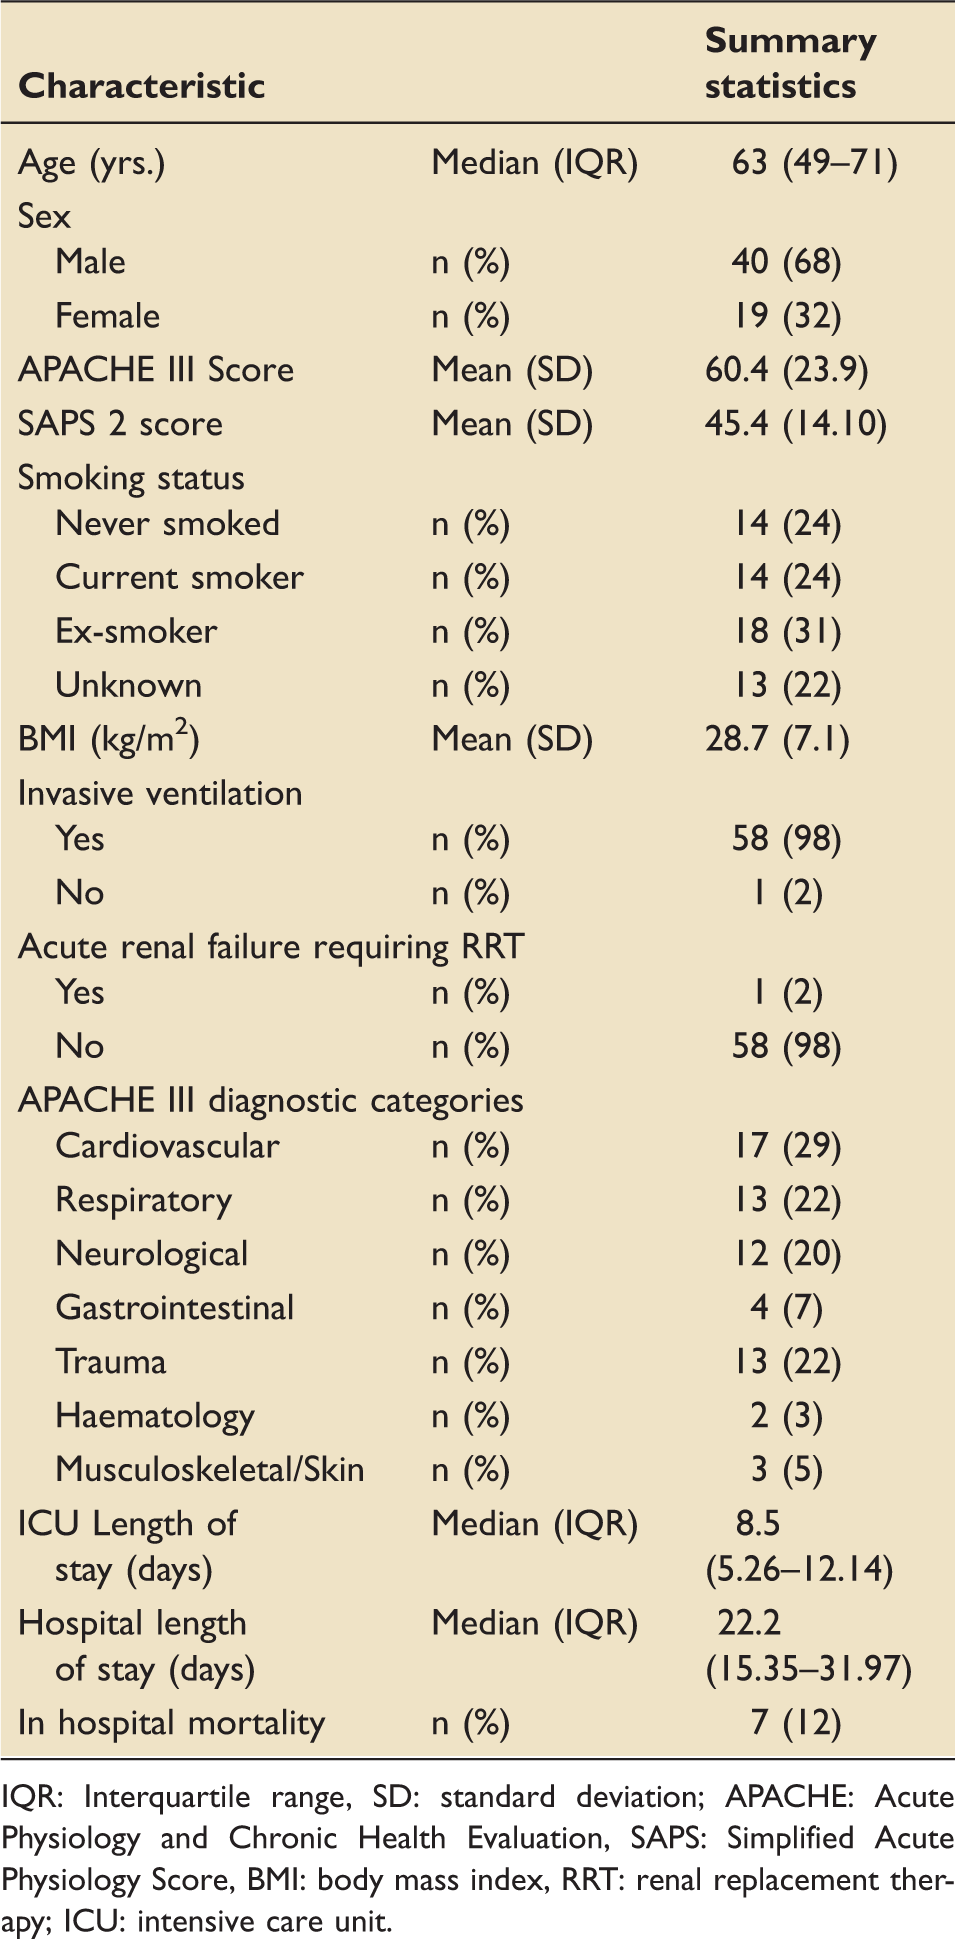
IQR: Interquartile range, SD: standard deviation; APACHE: Acute Physiology and Chronic Health Evaluation, SAPS: Simplified Acute Physiology Score, BMI: body mass index, RRT: renal replacement therapy; ICU: intensive care unit.
Characteristics of blood gas samples and the patient variables at the time of blood gas analysis (N = 393).
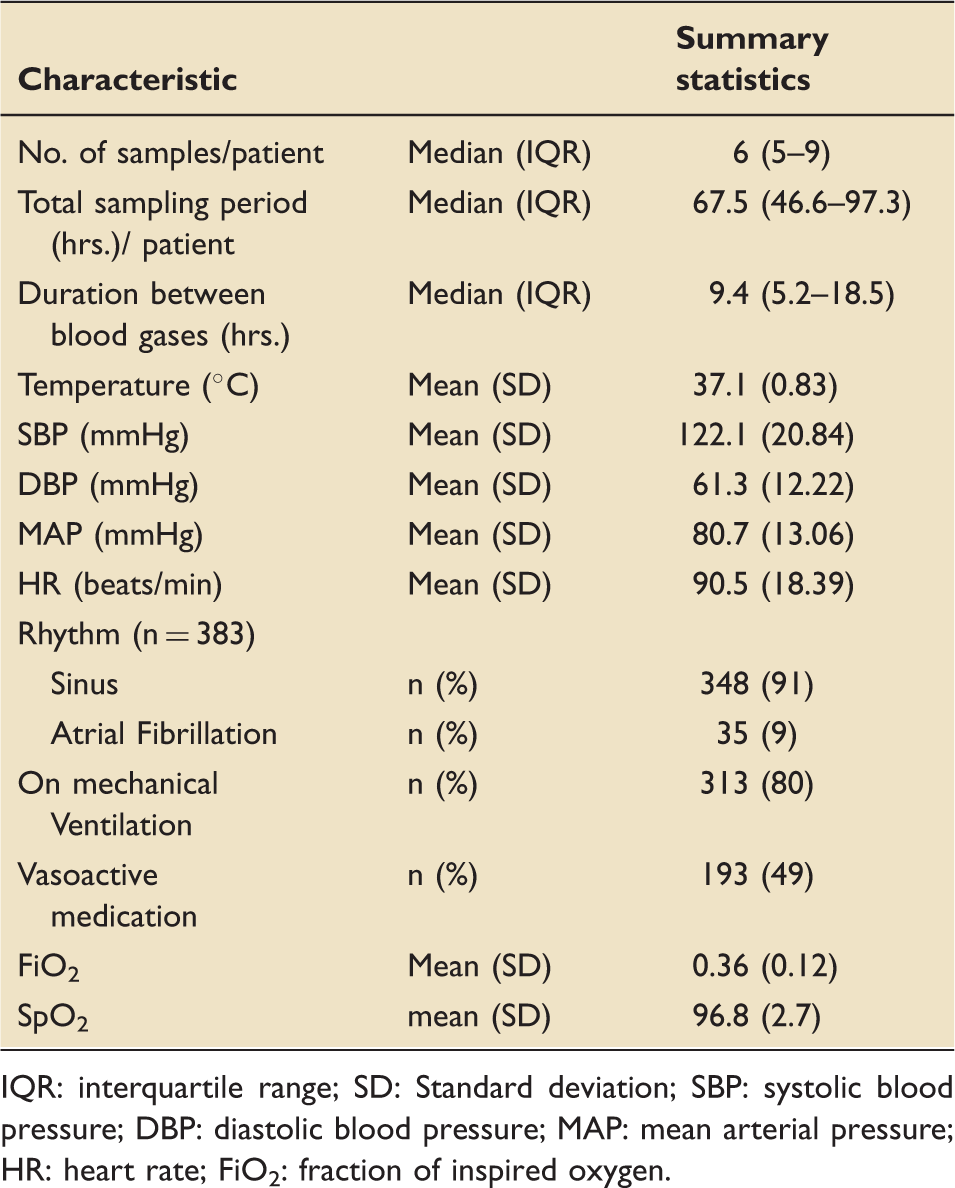
IQR: interquartile range; SD: Standard deviation; SBP: systolic blood pressure; DBP: diastolic blood pressure; MAP: mean arterial pressure; HR: heart rate; FiO2: fraction of inspired oxygen.
Distribution of pairs of central and arterial lines from which the blood gases were sampled (n = 380). a
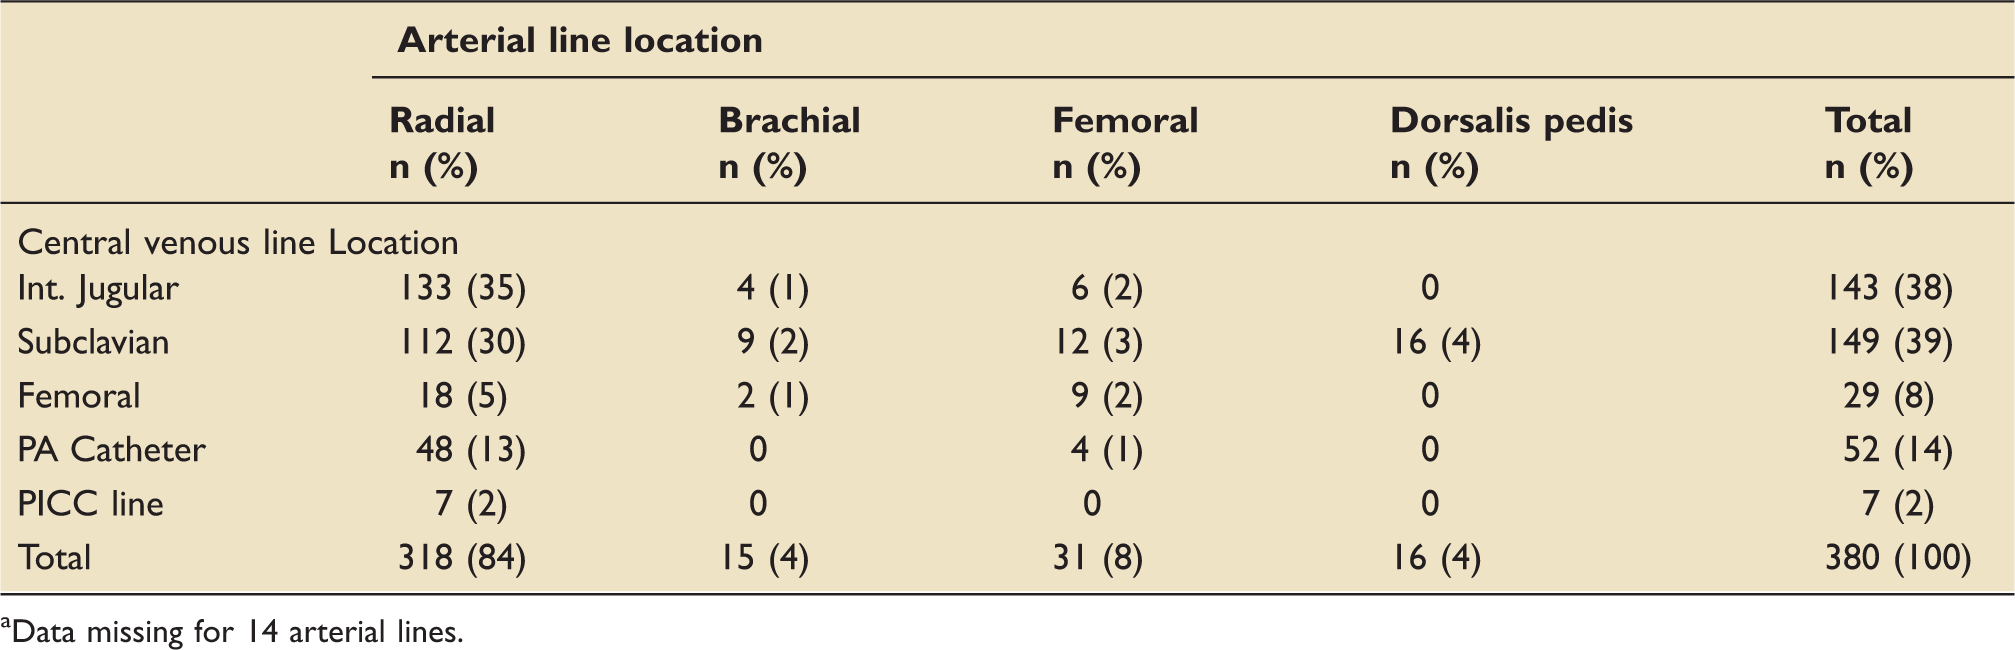
Data missing for 14 arterial lines.
Samples were drawn and analysed in random order, with brief intervals between sample draws (median (IQR) of 3 (2–4.25) min) and short delay to analysis (median (IQR) 2 (2–6.25) min) offering minimal opportunity for within-subject haemodynamic changes between draws or sample deterioration whilst awaiting analysis.
The mean (SD) arterial and venous pH of the samples were 7.42 (0.071) and 7.38 (0.074), respectively. The corresponding mean (SD) PCO2 (mmHg) results were 32.6 (9.53) and 35.5(11.75). Agreement was very good between ABG and VBG for pH (see Figure 1), with the 95% LOA ranging from −0.005 to +0.078, with a mean difference of +0.036 (95%CI 0.033-0.044). For PCO2, agreement between ABG and VBG was poor (see Figure 2(a)); 95% LOA −10.4 to + 5.3 mmHg, with a biased average difference of −2.6 mmHg (95%CI −3.3 to −1.9).
Bland-Altman plot for agreement between arterial and venous (A-V) pH during ICU stay. The middle horizontal line (mean difference) represents the mean difference. The upper (upper LOA) and lower (lower LOA) horizontal lines represent the upper and lower limits of agreement. LOA: limits of agreement. Bland-Altman plot for agreement between arterial and venous (A-V) PCO2 during ICU stay: (a) For all pairs and (b) by subgroup of mean PCO2 < 35 mmHg and mean PCO2 ≥ 35 mmHg. The middle horizontal line (mean difference) represents the mean difference. The upper (upper LOA) and lower (lower LOA) horizontal lines represent the upper and lower limits of agreement. LOA: Limits of agreement; A-V: Arterio-venous.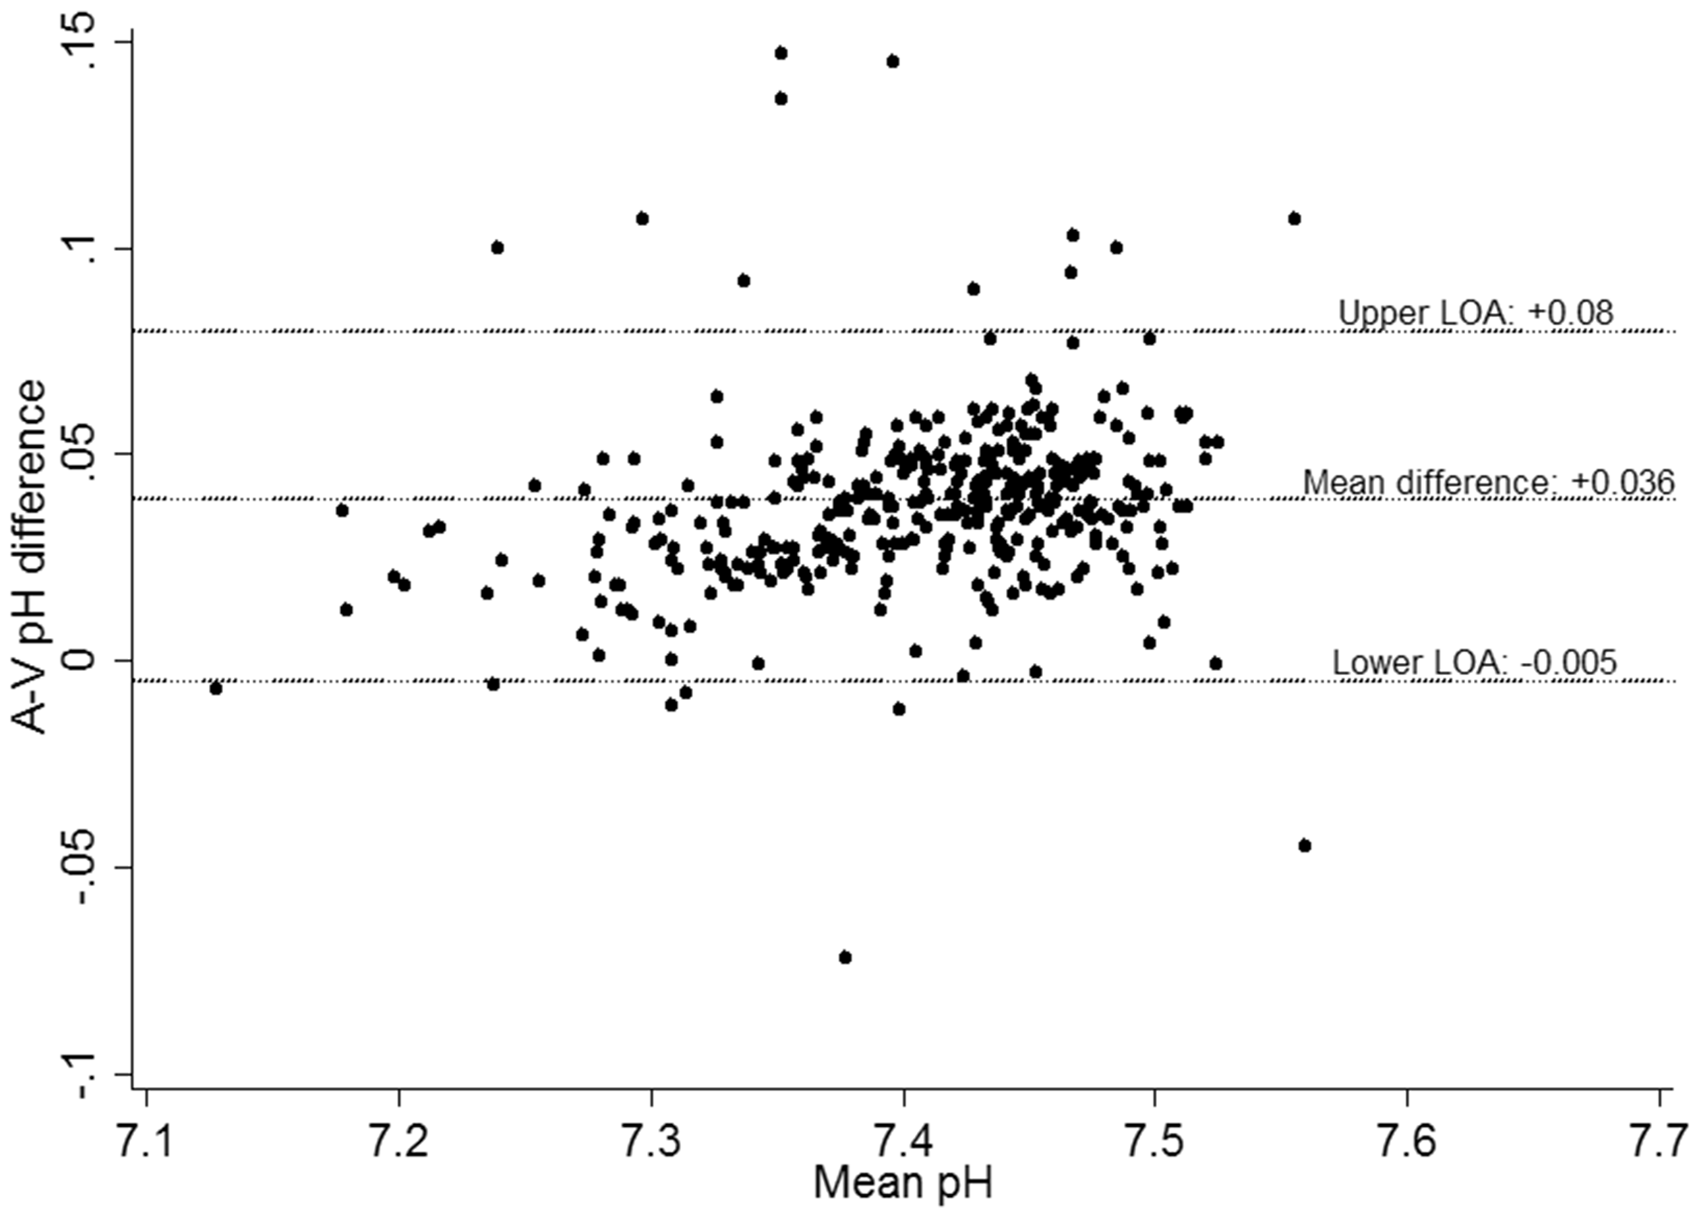
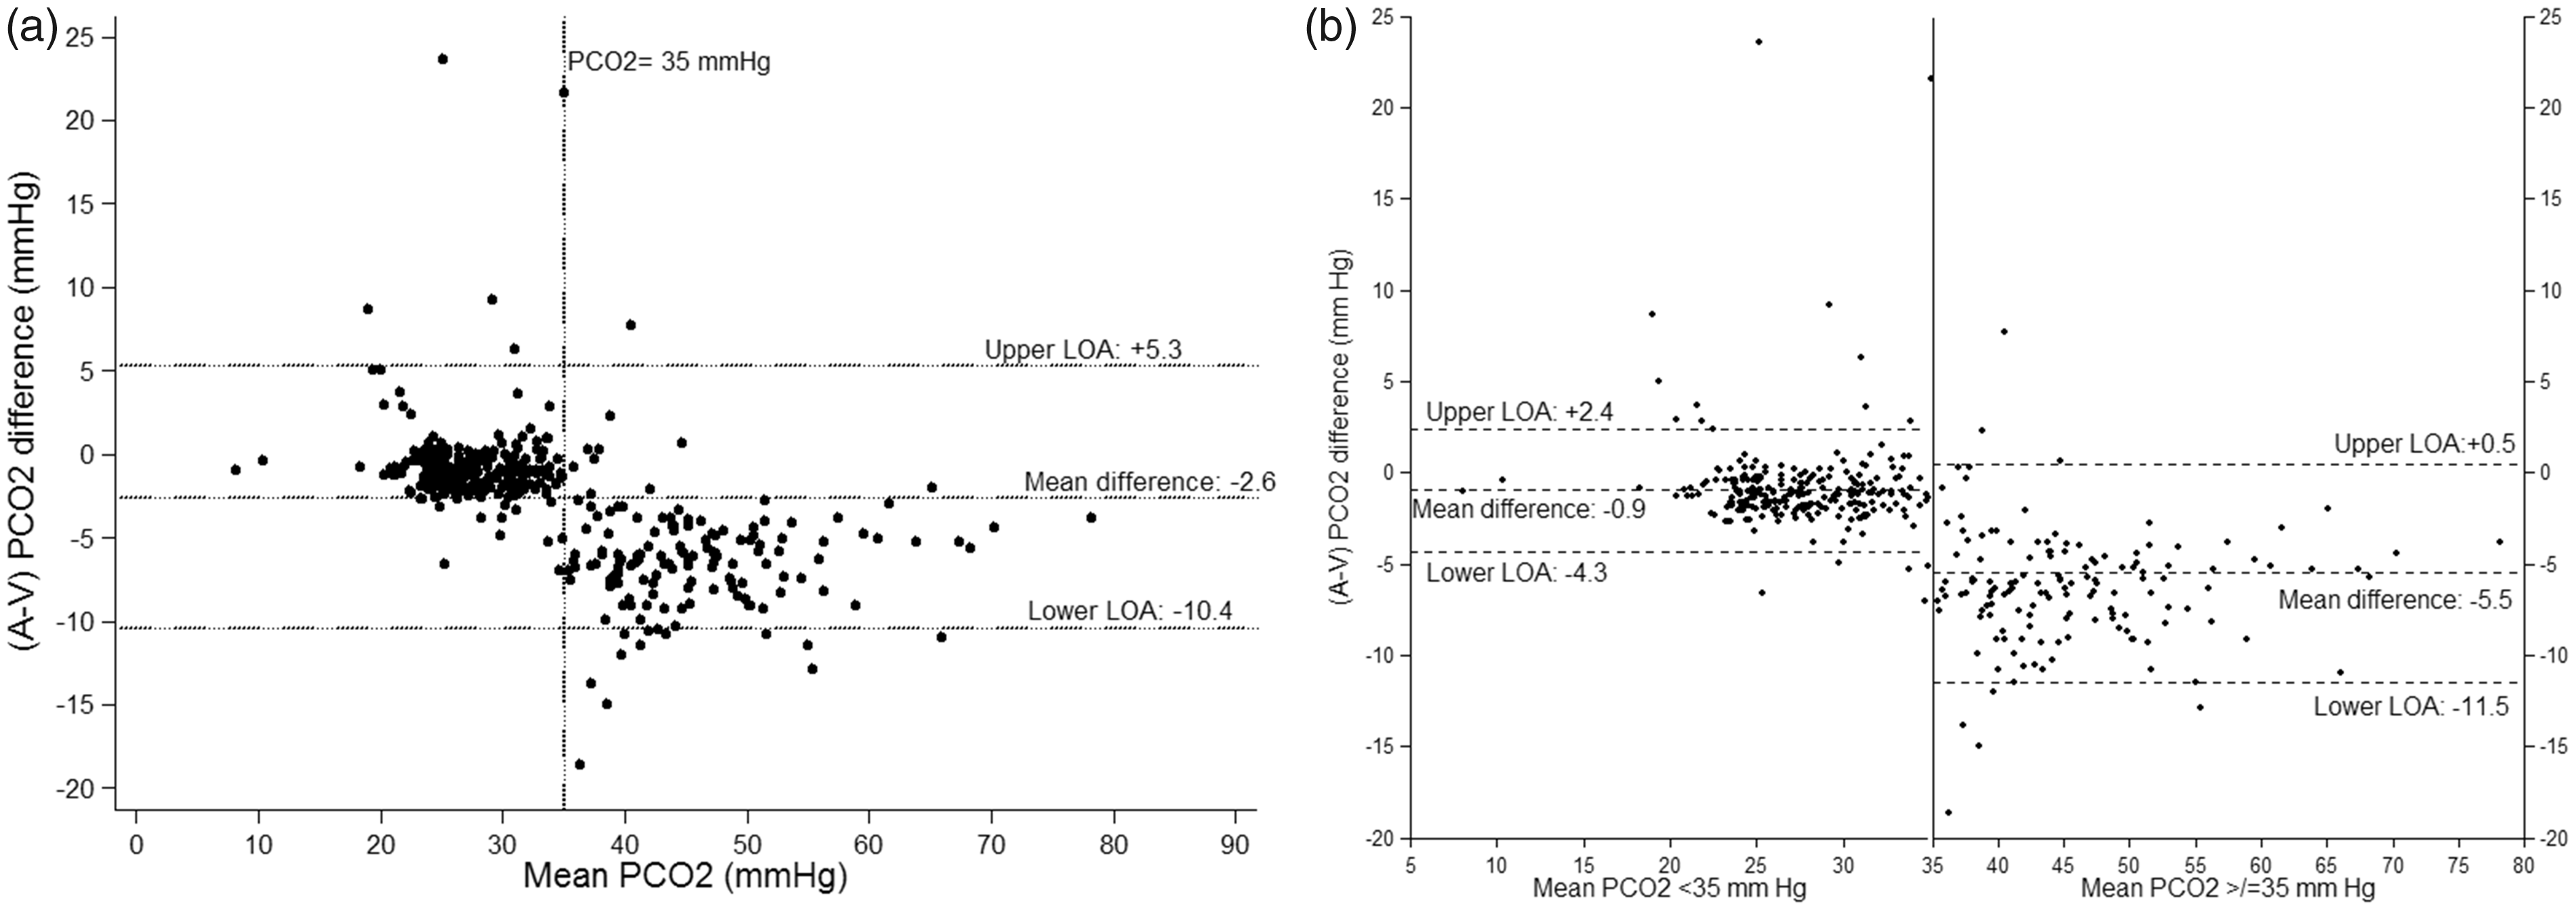
Agreement below mean PCO2 of 35 mmHg (254 pairs from 39 patients) appears to be better compared to ≥35 mmHg (140 pairs from 20 patients) (Figure 2(b)). For mean PCO2 < 35 mmHg, the bias is reduced, with a mean difference of −0.9 mmHg (95%CI −0.7 to 1.1) and better agreement (95% LOA ranging from −4.3 to + 2.4 mmHg). For mean PCO2 ≥ 35 mmHg there is a biased difference, mean bias was −5.5 (95% CI −4.6 to −6.4) with poor agreement (95% LOA −11.5 and +0.5 mmHg). Further sensitivity analysis was performed after separating the PCO2 ≥ 35 mmHg into normocarbic (mean PCO2 35–45 mmHg) and hypercarbic (mean PCO2 > 45 mmHg) groups. For the normocarbic group (77 pairs from nine patients), mean bias was −3.3 (95% CI −1.69 to −4.95) mmHg with poor agreement (95% LOA −10.5 to + 3.8 mmHg). For the hypercarbic group (63 pairs from 11 patients), mean bias was −6.0 (95% CI −6.87 to −5.18) mmHg with poor agreement (95% LOA −10.9 to −1.1 mmHg).
Discussion
In this study, looking at the agreement between the VBG and ABG for patients admitted to ICU we found that the LOA for pH were narrow enough to be clinically useful. However, for PCO2, we found that the AV agreement was too broad for venous PCO2 to substitute arterial PCO2. Furthermore, examination of the BA plot for PCO2 (Figure 2) indicated that agreement for values of mean PCO2 < 35 mmHg was narrower (95% LOA: −4.3 to 2.4) compared to mean PCO2 ≥ 35 mmHg (95% LOA: −11.5 to + 0.5).
The AV agreement for pH and PCO2 in adult ICU patients has been explored previously (see Table 4 in Appendix 1). Malinoski et al. 9 looked at the agreement between ABG and VBG in trauma patients who were mechanically ventilated. They concluded that the 95% LOA in pH were too wide for VBG to be used as a substitute for ABG. It was surprising to note that although similar 95% LOA were found in subsequent studies for pH, the latter studies had concluded that there was good AV agreement for pH.10–15 In comparison to them, our study showed that venous pH showed good agreement and almost always corresponded to a higher arterial pH, which implied that when venous pH was normal, significant acidosis was unlikely.
For PCO2, all the studies conducted to date had concluded that AV agreement was poor. Similarly, in our study, we found that the LOA were broader than the normal range for arterial PCO2. Therefore, substituting corrected venous values for measured arterial values would risk both false positive and false negative errors. Also, the direction of the agreement was both positive and negative, limiting the utility of this approach in identifying pathology as has been shown in previous studies.
One of the main caveats of prior studies was that they had been either limited to one paired blood gas sample per patient or not used repeated measures analysis when multiple samples per subject were collected (Table 4 in Appendix 1). To our knowledge, this is the first study in the literature systematically assessing multiple pairs of samples per patient over a clinically relevant timeframe, and thus the repeatability of the measures – as is required for trend following using venous values.
Our finding of differing AV agreement for populations of mean PCO2 < 35 mmHg and ≥35 mmHg has not been described before in the literature. This may be because our study included more mechanically ventilated patients, whereas other studies had focused solely on patients with normal or elevated PCO2. In contrast to our study, in a study involving healthy volunteers, hyperventilation led to widening of AV PCO2 difference. 21 This was attributed to reduction in blood flow to the peripheries due to hyperventilation as demonstrated on Doppler analysis. However, in that study, the blood was collected from the peripheral veins as opposed to central vein in our study. We speculate that limited blood flow to peripheries due to hypocapnia might be leading to limited CO2 clearance from peripheral tissues, giving rise to a central venous PCO2 closer to arterial PCO2 and thus leading to good agreement. This could also be explained by the oxygen and CO2 dissociation curves. It is well known that respiratory alkalosis leads to left shift of oxygen dissociation curve, which means higher oxygen saturation at lower PO2. 22 This might be shifting the arterial CO2 dissociation curve to right leading to a narrower AV PCO2 difference when mean PCO2 is <35 mmHg.
We recognize that there are outliers in the analysis. One of the values had an A-V CO2 difference of 23.6 mmHg and a mean PCO2 of 25.1 mmHg. Another patient had a difference of 21.6 mmHg and a mean of 35 mmHg. The first patient was a patient with Guillain Barre syndrome who was on pressure support ventilation at the time blood gas samples were collected for analysis. This patient had received plasmapheresis and Immunoglobulin therapy previously and we are not sure whether they would have affected the arterial and venous PCO2 relationship. The second patient was a patient with community-acquired pneumonia who was on pressure support ventilation at the time of blood gas analysis. When we looked and compared the blood gas results, there was no difference in the haemoglobin between the venous and arterial gases and there were no other indications to suggest a measurement error. Hence, we did not remove these abnormal results from the analysis. These two outliers highlight the ‘real-world’ problems of monitoring PCO2 in a patient without an arterial line.
Recently, few studies have looked at the difference between the PCO2 in the mixed venous or central venous and arterial blood samples in patients with septic shock and have suggested that a difference of more than 6 mmHg might be indicative of poor cardiac output or tissue microcirculatory dysfunction.23–27 This has also been shown to be associated with worse clinical outcomes. 25 In our patient population, we noticed that at mean PCO2 < 35 mmHg, the mean difference was much smaller than when mean PCO2 ≥ 35 mmHg (−0.9 vs −5.5 mmHg). Our findings suggest that one needs to be aware of mean PCO2 differences while measuring A-V difference in patients, as the acceptable A-V difference might be different at different mean PCO2 levels. This needs to be evaluated in future studies looking at the A-V PCO2 difference as a surrogate for microcirculatory dysfunction or poor cardiac output.
Ultimately whether an LOA is useful or not is a clinical judgement and will differ between clinicians. Hypothetical examples may illustrate potential pitfalls in substituting venous for arterial values. A venous PCO2 of 45 mmHg could represent arterial PCO2 between 34 and 50.5 mmHg, i.e. patient could be hypocapnic, normocapnic or hypercapnic. Similarly, a venous pH of 7.32 would correspond to an arterial pH range of 7.32–7.40, i.e. patient could have acidaemia or normal arterial pH. Further, it is important to consider that pH is an inverse logarithmic scale where small numerical differences would correspond to much larger variations in the concentration of [H+] in blood. In the example above, the corresponding [H+] concentration would range from 47.9 nmol/L to 35.5 nmol/L, a 35% difference – with implications for the nature of physiology/pathology at each extreme.
Prior studies have also seemingly focused on using the mean bias derived from BA analysis as the basis for an adjustment factor ‘on average’ for venous values to represent arterial values. 10 However, this problematic approach fails to capture the essence of BA analysis. For any given mean bias the 95% LOA agreement could be narrow or wide, where mean bias is considerably smaller than the range of the 95% LOA (as is the case for both pH and PCO2 in this and prior studies) – correcting solely for it would fail to adequately account for the potentially much larger variation described by the LOA. Mean bias would also fail to capture the fact that venous values could be both higher and lower than the corresponding arterial value and that the direction of the agreement might be unpredictable. Also, it should be emphasized that the 95% LOA implies that in 5% of cases, the AV difference will be even more discordant.
Limitations
This was a single-centre study with a relatively small population size (although the largest ICU study addressing this question). There was an under-representation of hypercapnic patients, which might limit the generalizability of our findings. The majority of our patients appeared relatively stable in regard to their pCO2 and pH values and hence may not be the population of most interest for blood gas analysis. However, pairs taken were done so due to clinical requests for ABGs and hence represented current practice within our ICU. Our study design for reasons of pragmatism and resourcing necessitated a variable number of sample pairs per patient, variable sample intervals and a variable sampling period overall limiting statistical analytic methods available. However, the findings of BA approach described above were consistent with prior literature enabling easy comparison of our findings with others.
The bidirectional relationship of PCO2 for AV pairs was somewhat surprising given that normal physiology/respiration typically generates a net excess of CO2 and hydrogen ions; however, our findings were consistent with others. It is possible that the paired sampling method/design common to all these studies introduces systematic error, with treatment effect, sample dilution, sample aeration or other patient/sample errors possible. However, we attempted to control for these through the use of indwelling lines, brief intervals between samples, random pair order and short times to analysis with experienced staff taking samples. The findings of our study are also not easily generalizable to peripheral VBG analysis and non-ICU settings with single paired samples per patient. However, the literature suggests that AV agreement for pH and PCO2 is worse for this group.6,13 We have also not adjusted for inotropic support and site of venous sampling in our study, which might be affecting the relationship. Also, nearly 80% of the gases were taken when the patients were on mechanical ventilation. Hence, generalizability of our results to non-ventilated patients is limited.
Conclusion
In summary, arterio-venous agreement for pH appears to be good in a general ICU population. However, caution should be exercised and results should be interpreted in the clinical context. AV agreement for PCO2 was too broad and unstable to justify the routine clinical use of VBG in initial assessment of ICU patients or to substitute for ABG in monitoring patients. ABG analysis remains the gold standard and should be the preferred sampling methodology where PCO2 measurements are required to guide clinical decision making.
Footnotes
Acknowledgements
The authors acknowledge Ms Odette Youdel, Senior Scientist, Alfred Pathology services, for her help with the study.
Declaration of conflicting interests
The author(s) declared no potential conflicts of interest with respect to the research, authorship, and/or publication of this article.
Funding
The author(s) disclosed receipt of the following financial support for the research, authorship, and/or publication of this article: The work was supported by The Alfred Research Trust Small Project Grant Scheme [464/12]. The funding body did not have any role in the design of the study or collection, analysis and interpretation of data or in writing the manuscript.