
Abstract
Objective
This study investigated the factors related to the ratio of the venoarterial carbon dioxide tension difference [P(v-a)CO2] to the arteriovenous oxygen content difference [C(a-v)O2] (hereafter termed “Ratio”).
Methods
We retrospectively studied 1294 pairs of arterial and central venous blood gas measurements in 352 critically ill patients. A high Ratio was defined as > 1.68 based on published literature. Measurements were divided into four groups: Group I [P(v-a)CO2 ≤ 6 mmHg/central venous oxygen saturation (ScvO2) < 70%], Group II [P(v-a)CO2 ≤ 6 mmHg/ScvO2 ≥ 70%], Group III [P(v-a)CO2 > 6 mmHg/ScvO2 ≥ 70%], and Group IV [P(v-a)CO2 > 6 mmHg/ScvO2 < 70%].
Results
The Ratio’s strongest correlation was with P(v-a)CO2 when compared with ScvO2 and hemoglobin in all data. The P(v-a)CO2 and ScvO2 were significantly higher and the hemoglobin and arterial oxygen saturation were significantly lower in the high Ratio measurements (>1.68) than low Ratio measurements (≤1.68). The P(v-a)CO2 was best for predicting a high Ratio. A P(v-a)CO2 threshold of 7 mmHg was associated with a sensitivity of 41.77% and specificity of 90.62% for predicting a high Ratio.
Conclusions
A high P(v-a)CO2 is the most relevant contributor to a high Ratio among all related factors in critically ill patients.
Keywords
Introduction
The concept of an existing relationship between oxygen delivery (DO2) and oxygen consumption (VO2) has been the cornerstone of shock, and determining DO2/VO2 dependence is a key issue in shock resuscitation.1,2 The ratio of the venoarterial carbon dioxide tension difference [P(v-a)CO2] to the arteriovenous oxygen content difference [C(a-v)O2] [i.e., the P(v-a)CO2/C(a-v)O2 ratio] has garnered much attention as a new marker that reflects the relationship between DO2 and VO2. The ratio between VO2 and global carbon dioxide production (VCO2) is lower in aerobic than anaerobic metabolism. First, a decrease in VO2 accompanies a decrease in aerobically generated carbon dioxide in terms of tissue hypoxia. In a hypoxic cellular environment, however, anaerobic carbon dioxide generation increases as hydrogen ions generated by anaerobic sources of energy are buffered by bicarbonate. 3 Hence, the ratio between VCO2 and VO2 becomes mismatched, and the amount of VCO2 generation becomes greater than the amount of VO2. Consequently, a rise in the respiratory quotient (VCO2/VO2 ratio) reflects the presence of global anaerobic metabolism. 4
Many studies have shown that the P(v-a)CO2/C(a-v)O2 ratio reflects the lactate level, lactate evolution, and lactate clearance and is associated with prognosis.5–12 Furthermore, a high C(v-a)CO2/C(a-v)O2 ratio is an independent risk factor for mortality in critically ill patients.8,10 A P(v-a)CO2/C(a-v)O2 ratio cutoff of 1.68 is a better predictor of a ≥ 15% increase in VO2 induced by an acute increase in DO2 when compared with lactate and central venous oxygen saturation (ScvO2).11,12
The P(v-a)CO2/C(a-v)O2 ratio is calculated from several parameters based on a known formula that mainly involves ScvO2, hemoglobin (Hb), arterial oxygen saturation (SaO2), and P(v-a)CO2. 13 A theoretical mathematical relationship exists among these parameters. However, calculation of the P(v-a)CO2/C(a-v)O2 ratio may involve various combinations of relevant parameters depending on the clinical situation, which could cause a complicated inter-relationship between the P(v-a)CO2/C(a-v)O2 ratio and these related parameters. Therefore, a simple and rapid method for identification of a high P(v-a)CO2/C(a-v)O2 ratio would be of substantial benefit, and the factors contributing to a high P(v-a)CO2/C(a-v)O2 ratio are worthy of consideration in the clinical setting.
To our knowledge, the dependency of the P(v-a)CO2/C(a-v)O2 ratio on ScvO2 and P(v-a)CO2 has not been sufficiently explored in clinical practice. The present study was performed to determine the relationships of ScvO2, Hb, SaO2, and P(v-a)CO2 with the P(v-a)CO2/C(a-v)O2 ratio; define the corresponding factors that contribute to a high P(v-a)CO2/C(a-v)O2 ratio (>1.68) according to the published literature in critically ill patients; 9 and investigate the behavior of the P(v-a)CO2/C(a-v)O2 ratio in given settings based on specific cutoff values of P(v-a)CO2 (6 mmHg) and ScvO2 (70%) for tissue perfusion according to the published literature.14–16
Patients and methods
Patients and data
The Institutional Research and Ethics Committee of the Peking Union Medical College Hospital approved this study. Because this retrospective study involved only the collection of clinical data, the Institutional Research and Ethics Committee waived the need to obtain consent.
The simultaneous arterial and central venous blood gas measurements that were obtained from critically ill patients during their first week of intensive care unit admission from July 2013 to December 2014 were retrospectively reviewed. The blood gas analysis data were stored in an electrical information system in our department. The attending intensivists decided on the placement of arterial and central venous catheters according to the severity of the patient’s condition. The P(v-a)CO2/C(a-v)O2 ratio has been considered a relevant marker of global anaerobic metabolism, and calculation of the P(v-a)CO2/C(a-v)O2 ratio was suggested during resuscitation in our department.
Standard measurement of the P(v-a)CO2/C(a-v)O2 ratio involves the following two steps. First, a central venous catheter is inserted via the jugular or subclavian vein, and placement of the central venous catheter in the superior vena cava is confirmed by chest radiography. Second, arterial and central venous blood gas samples are anaerobically collected in 3-mL heparinized syringes, which are analyzed using a bedside blood gas machine (GEM Premier 3000, model 5700; Instrumentation Laboratory, Bedford, MA, USA or ABL90; Radiometer, Copenhagen, Denmark). The same blood gas machine was used to measure both the arterial and central venous blood gas.
Study definitions
Pairs of arterial and central venous blood samples were used determine the following variables: arterial oxygen tension (PaO2), arterial carbon dioxide tension (PaCO2), central venous oxygen tension (PvO2), central venous carbon dioxide tension (PvCO2), SaO2, and ScvO2. The Hb and lactate concentrations were measured from the arterial blood. The arterial oxygen content (CaO2), central venous oxygen content (CvO2), C(a-v)O2, P(v-a)CO2, P(v-a)CO2/C(a-v)O2 ratio, and oxygen extraction percentage (EO2) were defined as follows:
CaO2 = (1.34 × SaO2 × Hb) + (0.0031 × PaO2) CvO2 = (1.34 × ScvO2 × Hb) + (0.0031 × PvO2) C(a-v)O2 = CaO2 – CvO2 P(v-a)CO2 = PvCO2 – PaCO2 P(v-a)CO2/C(a-v)O2 ratio = (PvCO2 – PaCO2)/(CaO2 – CvO2) EO2 = (SaO2 – SvO2)/SaO2
Moreover, a low and high P(v-a)CO2/C(a-v)O2 ratio was defined as ≤ 1.68 and > 1.68, respectively; a low and high P(v-a)CO2 was defined as ≤ 6 and > 6 mmHg, respectively; and a low and high ScvO2 was defined as < 70% and ≥ 70%, respectively.
Statistical analysis
Descriptive statistics for continuous variables were presented as mean ± standard deviation when the variables were normally distributed and as median and interquartile range (25%–75%) when the variables had a skewed distribution. The Mann–Whitney test was used to compare continuous variables between the groups, and the chi-squared test and Fisher’s exact test were used to compare categorical variables. Comparison of two continuous variables was performed using Spearman’s correlation. The areas under the receiver operating characteristic (ROC) curves were compared using the Hanley–McNeil test. 17 The statistical analysis was performed using SPSS 13.0 (SPSS Inc., Chicago, IL, USA) and MedCalc 11.4.3.0 (MedCalc Software bvba, Ostend, Belgium). All statistical tests were two-sided, and a P-value of < 0.05 was considered statistically significant.
Results
In total, 1294 pairs of simultaneous arterial and central venous blood gas measurements in 352 patients were retrospectively selected for analysis (mean age, 59 years; range, 18–91 years; female, n = 163; male, n = 189). The study population comprised 96 postoperative patients, 236 patients with sepsis, and 20 patients with other diseases. The flow diagram in Figure 1 shows the data analysis of all the measurements.

Flow diagram.
Correlation between relevant parameters and P(v-a)CO2/C(a-v)O2 ratio in all measurements
The distribution of all data reflecting the P(v-a)CO2/C(a-v)O2 ratio measurements was skewed (median, 1.45; interquartile range, 0.93). There was a significant and strong correlation between P(v-a)CO2 and P(v-a)CO2/C(a-v)O2 (r = 0.692, P < 0.0001) among the 1294 sets of measurements. Both the ScvO2 (r = 0.104, P < 0.0001) and Hb (r = −0.159, P < 0.0001) were significantly correlated with P(v-a)CO2/C(a-v)O2, but these relationships were weak. However, P(v-a)CO2/C(a-v)O2, P(v-a)CO2, and ScvO2 were not significantly associated with the arterial lactate level.
Difference between high and low P(v-a)CO2/C(a-v)O2 measurements
Thirty-six percent (462/1294) of the measurements had a high P(v-a)CO2/C(a-v)O2 ratio (>1.68). There was a significantly higher P(v-a)CO2 (P < 0.0001), lower Hb (P <0.0001), higher ScvO2, (P < 0.0001), and lower SaO2 (P = 0.045) among the high than low P(v-a)CO2/C(a-v)O2 ratio measurements (Figure 2(a)–(d)). However, there was no significant difference in lactate (2.7 ± 2.8 vs. 2.7 ± 3.3) between the low and high P(v-a)CO2/C(a-v)O2 ratio measurements.

Difference in (a) hemoglobin, (b) P(v-a)CO2, (c) ScvO2, and (d) SaO2 between high and low P(v-a)CO2/C(a-v)O2 ratio measurements. *P <0.05. P(v-a)CO2, venoarterial carbon dioxide tension difference; ScvO2, central venous oxygen saturation; SaO2, arterial oxygen saturation; C(a-v)O2, arteriovenous oxygen content difference.
The P(v-a)CO2 (area under ROC curve, 0.793) was the best predictor of a high ratio (>1.68) and was significantly better than ScvO2 (area under ROC curve, 0.62) and Hb (area under ROC curve, 0.606) (Figure 3). The areas under the curve of the related variables used to predict a high ratio are shown in Table 1. A P(v-a)CO2 threshold of 7 mmHg was associated with a sensitivity of 41.77% and a specificity of 90.62% for predicting a high P(v-a)CO2/C(a-v)O2 ratio (>1.68).
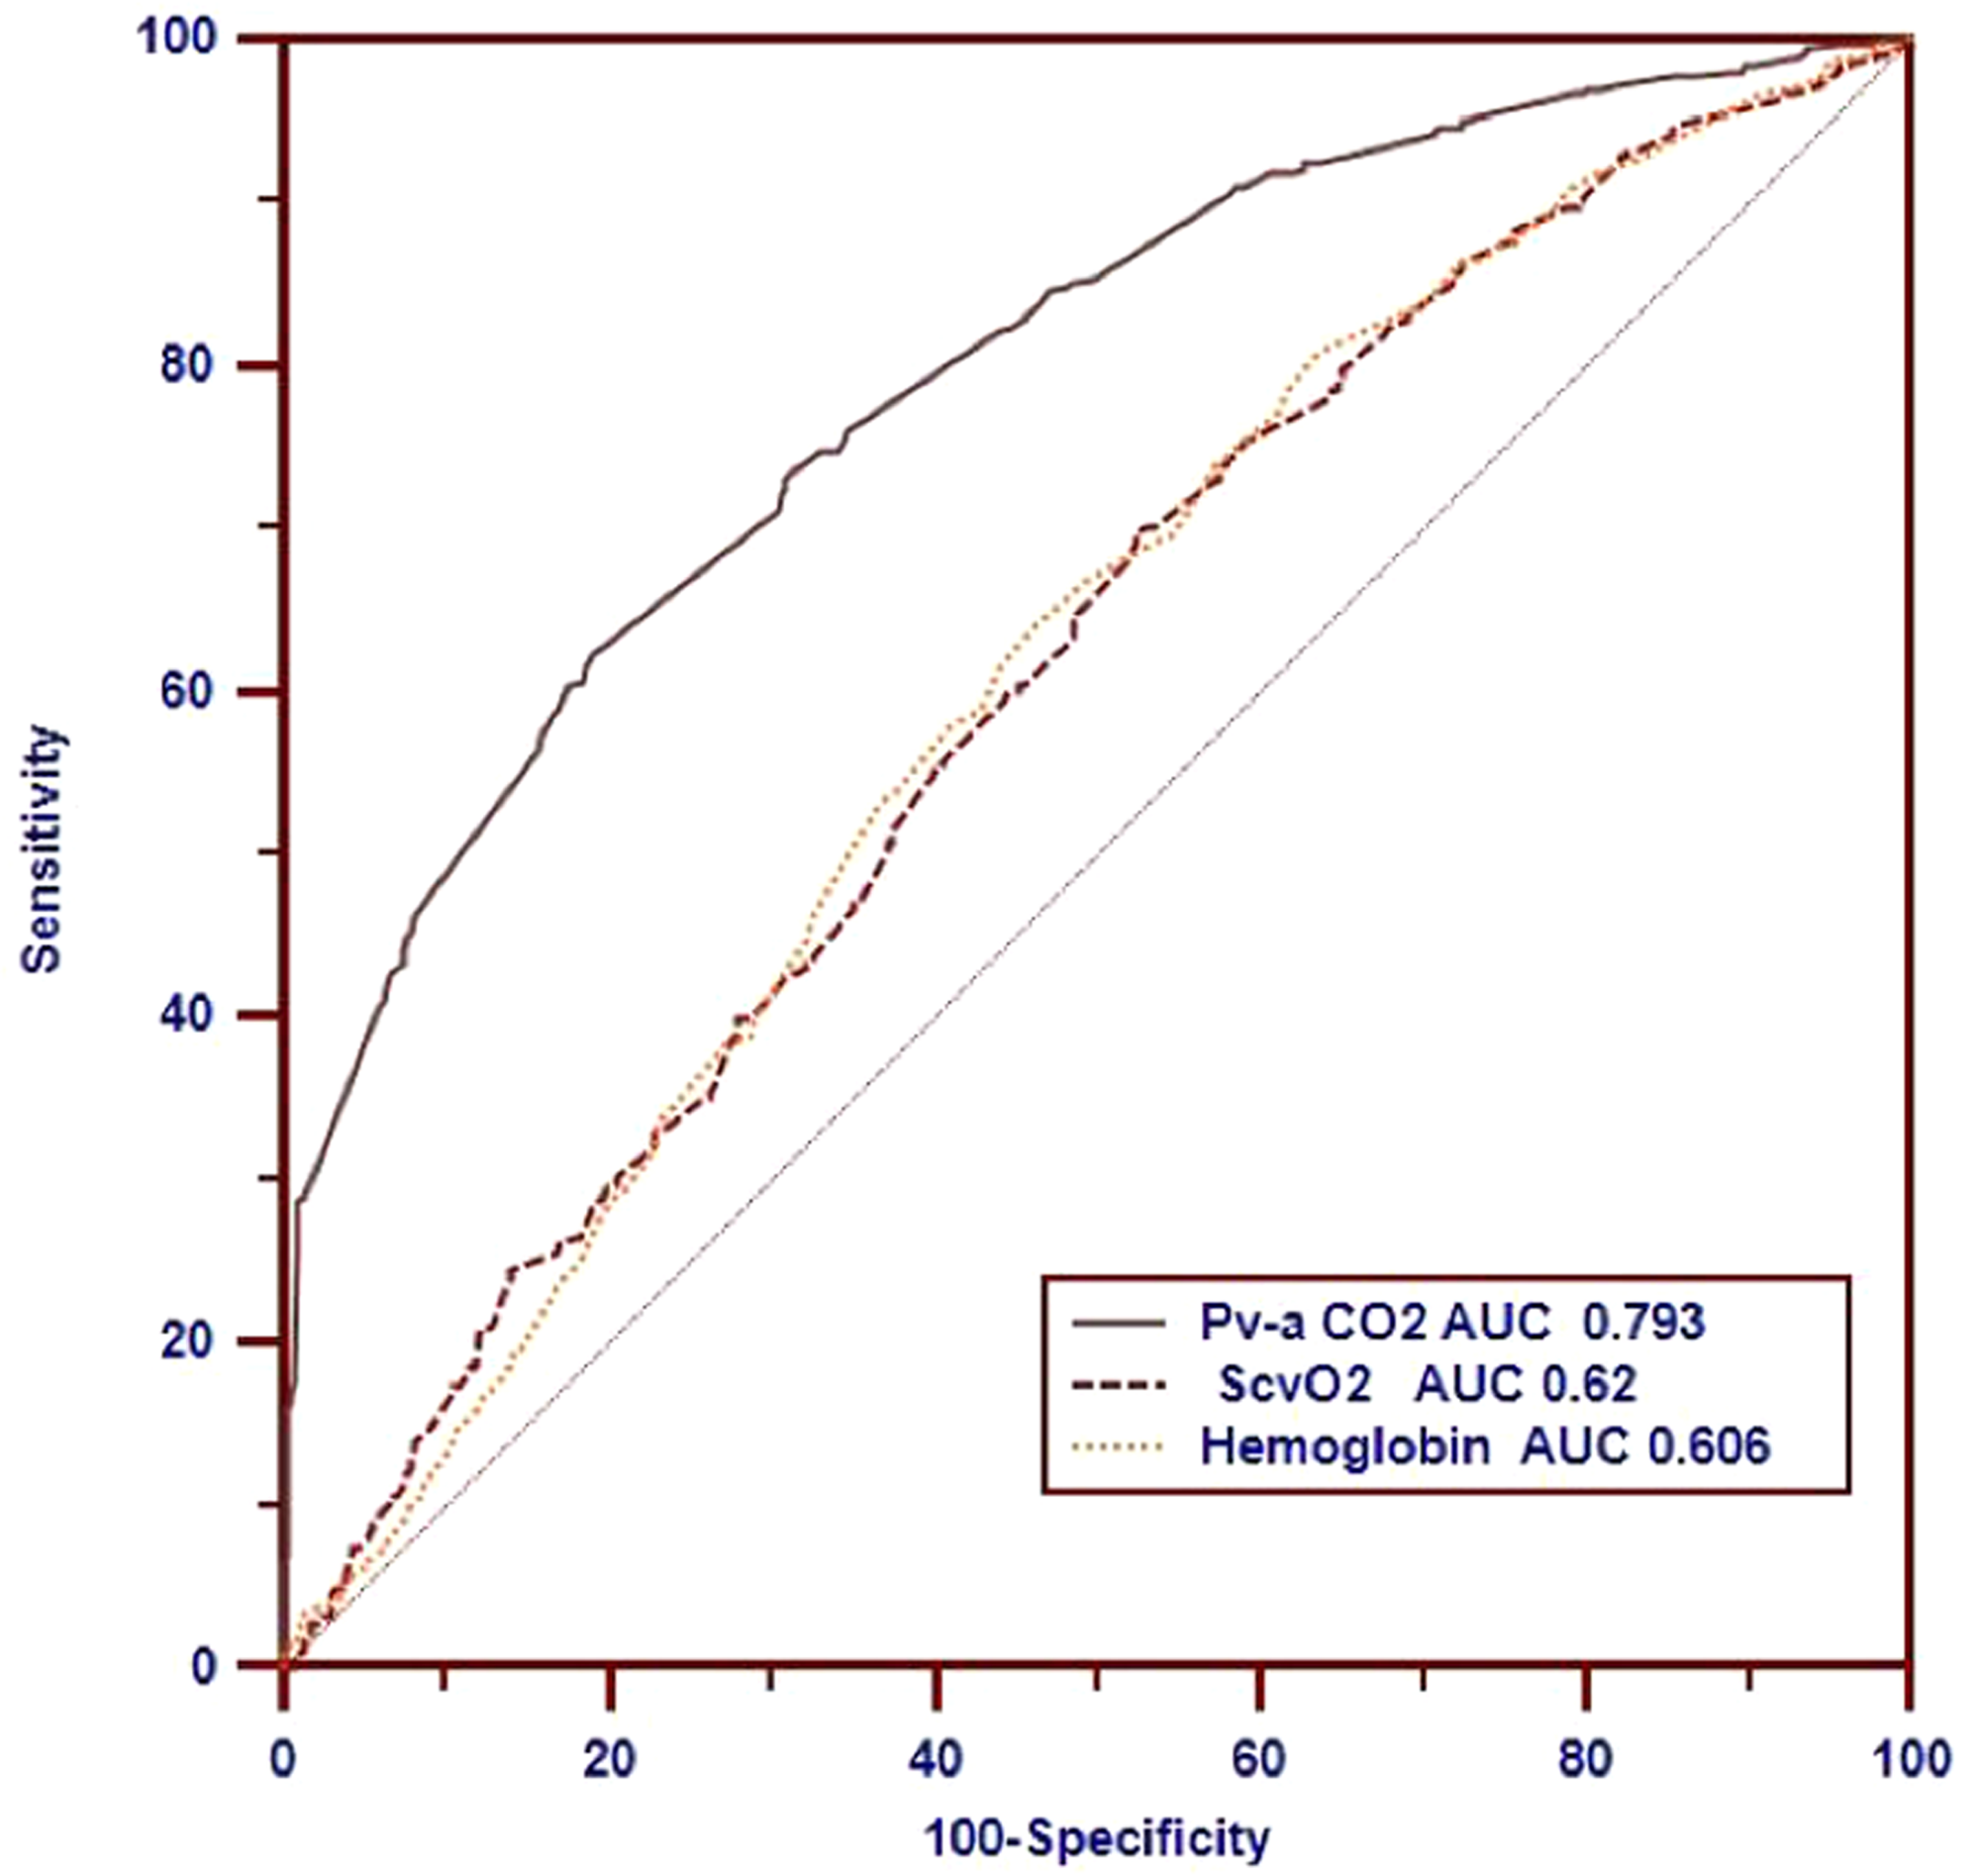
Receiving operating characteristic curves showing the ability of ScvO2, P(v-a)CO2, and hemoglobin to predict a high P(v-a)CO2/C(a-v)O2 ratio of >1.68. ScvO2, central venous oxygen saturation; P(v-a)CO2, venoarterial carbon dioxide tension difference; C(a-v)O2, arteriovenous oxygen content difference.
Comparison of AUCs for predicting a high P(v-a)CO2/C(a-v)O2 ratio (>1.68) in all measurements.

AUC, area under the receiver operating characteristic curve; P(v-a)CO2, venoarterial carbon dioxide tension difference; PaO2, arterial oxygen tension; ScvO2, central venous oxygen saturation; SaO2, arterial oxygen saturation; CI, confidence interval. *P <0.05 for comparison of P(v-a)CO2.
P(v-a)CO2/C(a-v)O2 in different groups based on ScvO2 (70%) and P(v-a)CO2 (6 mmHg)
Based on the cutoffs of ScvO2 (70%) and P(v-a)CO2 (6 mmHg), we assigned all measurements to four categories: Group I [P(v-a)CO2 ≤ 6 mmHg and ScvO2 < 70%], Group II [P(v-a)CO2 ≤ 6 mmHg and ScvO2 ≥ 70%], Group III [P(v-a)CO2 > 6 mmHg and ScvO2 ≥ 70%], and Group IV [P(v-a)CO2 > 6 mmHg and ScvO2 < 70%]. The characteristics of the P(v-a)CO2/C(a-v)O2 ratio in the different groups are shown in Table 2. Group I (n = 136) had the lowest P(v-a)CO2/C(a-v)O2 ratio (1.00 ± 0.46), and Group III (n = 209) had the highest P(v-a)CO2/C(a-v)O2 ratio [2.32 (1.9–3.4)]. Moreover, the lowest percentage of a high P(v-a)CO2/C(a-v)O2 ratio (>1.68) was present in Group I [5.8% (8/136)], and the highest percentage was present in Group III [84% (176/209)] (Figure 4). Group I had a significantly higher lactate level and lower Hb and SaO2 than the other groups (P < 0.05), and Groups I and IV had a significantly higher EO2 than the other groups (Figure 5).

Percentages of a high P(v-a)CO2/C(a-v)O2 ratio (>1.68) in different groups based on the cutoffs of ScvO2 (70%) and P(v-a)CO2 (6 mmHg). *P <0.05. P(v-a)CO2, venoarterial carbon dioxide tension difference; C(a-v)O2, arteriovenous oxygen content difference; ScvO2, central venous oxygen saturation.

EO2 in different groups based on the cutoffs of ScvO2 (70%) and P(v-a)CO2 (6 mmHg). *Group I vs. Groups II, III, and IV; P <0.05. Group IV vs. Groups II and III; P <0.05. EO2, oxygen extraction percentage; ScvO2, central venous oxygen saturation; P(v-a)CO2, venoarterial carbon dioxide tension difference.
Related parameters in the different groups according to cutoffs of ScvO2 (70%) and P(v-a)CO2 (6 mmHg).

Data are presented as median (interquartile range), mean ± standard deviation, or n (%).
ScvO2, central venous oxygen saturation; P(v-a)CO2, venoarterial carbon dioxide tension difference; SaO2, arterial oxygen saturation; EO2, oxygen extraction percentage.
P < 0.05 vs. Group I.
P < 0.05 vs. Group II.
P < 0.05 vs. Group III.
Discussion
This is the largest clinical study to date evaluating the correlation of ScvO2 and P(v-a)CO2 with the P(v-a)CO2/C(a-v)O2 ratio in critically ill patients. The most important finding of the present study is that the relationships of ScvO2 and P(v-a)CO2 with the P(v-a)CO2/C(a-v)O2 ratio were validated and that the characteristics of the P(v-a)CO2/C(a-v)O2 ratio were described in the real-world setting. These data are meaningful for interpretation of this ratio in clinical practice.
Factors contributing to a high P(v-a)CO2/C(a-v)O2 ratio (>1.68)
In the present study, P(v-a)CO2/C(a-v)O2 showed a significantly stronger relationship with P(v-a)CO2 than ScvO2, Hb, and SaO2. Importantly, a high P(v-a)CO2 is the most relevant factor contributing to the high P(v-a)CO2/C(a-v)O2 ratio among these related parameters. Therefore, the first priority might be to address the high P(v-a)CO2 level to restore the P(v-a)CO2/C(a-v)O2 ratio in critically ill patients. It could be argued that the variations in these parameters would impact the relationship between the included parameters and the P(v-a)CO2/C(a-v)O2 ratio. Additionally, both the P(v-a)CO2 and ScvO2 measurements had an abnormal distribution, and the variation in the P(v-a)CO2 and ScvO2 might have been comparable in this large-sample study. Therefore, our study suggests that the priority should be paying close attention to P(v-a)CO2 to correct the P(v-a)CO2/C(a-v)O2 ratio in critically ill patients. Further prospective studies are required to investigate the effects of variations of other related parameters on the P(v-a)CO2/C(a-v)O2 ratio.
Behavior of P(v-a)CO2/C(a-v)O2 ratio in present classification based on ScvO2 and P(v-a)CO2
ScvO2 is a well-known marker that reflects whether DO2 meets the demand of VO2. 18 Additionally, P(v-a)CO2 functions as a global flow parameter that reflects whether the systemic flow meets the needs of tissue perfusion.19,20 In Group I of the present study, the combination of low P(v-a)CO2 and low ScvO2 indicated that the global flow was sufficient but that DO2 did not meet the demand of VO2. This group had a significantly lower SaO2 and Hb and higher EO2 than the other groups. Both arterial hypoxia and hemodilution could contribute to low ScvO2 resulting from insufficient DO2 with a high EO2 and low P(v-a)CO2 from high compensatory cardiac output. Interestingly, Group I had the lowest P(v-a)CO2/C(a-v)O2 ratio (1.00 ± 0.46) and lowest percentage of a high P(v-a)CO2/C(a-v)O2 ratio [5.8% (8/136)]. Theoretically, using a low P(v-a)CO2/C(a-v)O2 ratio to reflect the absence of anaerobic metabolism should be done with caution in patients with low ScvO2 together with low P(v-a)CO2, who have special hemodilution and arterial blood hypoxemia conditions with high VO2. A potential pathophysiologic mechanism is as follows. First, the cardiac output shows a compensatory increase to restore DO2 under conditions of hypoxemia and/or hemodilution, which could cause a decrease in the P(v-a)CO2 gap. Second, a low ScvO2 commonly indicates an compensatory increase in the EO2 because of high oxygen demand. Third, the P(v-a)CO2 might further decrease in the presence of low ScvO2 through the Haldane effect. 21 Hence, in Group I of the present study, the “pseudo-normalization” of the P(v-a)CO2/C(a-v)O2 ratio might have been related to high cardiac output together with high VO2. 22 A recent experimental study also showed that the P(v-a)CO2/C(a-v)O2 ratio might be a misleading surrogate for anaerobic metabolism in the presence of hemodilution. 23 Further clinical studies are required to validate the meaning of the P(v-a)CO2/C(a-v)O2 ratio in the Group I condition.
Group II had high ScvO2 and low P(v-a)CO2. In this case, both global flow and DO2 appeared to be adequate to meet tissue cell needs. Sepsis may have been a common cause of the results seen in Group II, especially given the hyperdynamic hemodynamic status after early resuscitation. Studies have supported that normal ScvO2 does not exclude tissue hypoxia, and even high ScvO2 has been associated with poor clinical outcomes.24–28 Moreover, 25.9% (195/751) of the measurements had a high P(v-a)CO2/C(a-v)O2 ratio in Group II. In other words, normalization of both ScvO2 and P(v-a)CO2 could not totally exclude the independence of the presence of anaerobic metabolism. Here, we stress that a high P(v-a)CO2/C(a-v)O2 ratio cannot be simply taken as a marker of increased DO2 to meet the tissue perfusion needs under conditions of high ScvO2 and low P(v-a)CO2. First, oxygen cannot be effectively transported into tissue cells through the microcirculation when there is a loss of coherence between the macro- and microcirculation.29,30 Second, if a disassociation exists between cellular oxygen utilization and tissue perfusion, an increase in DO2 would not help to correct the high P(v-a)CO2/C(a-v)O2 ratio. Further study is required to determine whether correction of the P(v-a)CO2/C(a-v)O2 ratio can improve tissue perfusion and/or the clinical outcome when ScvO2 and P(v-a)CO2 have been normalized.
Group III had a high P(v-a)CO2 of > 6 mmHg and high ScvO2 of ≥ 70%, indicating that the global flow might be insufficient for tissue perfusion, although the DO2 had reached the threshold for the physiologic requirements. Eighty-four percent (176/209) of the measurements had a high P(v-a)CO2/C(a-v)O2 ratio (>1.68) in Group III, and a high P(v-a)CO2/C(a-v)O2 ratio indicates a high possibility of anaerobic metabolism. A high ScvO2 might result from dysfunction of the microcirculation (shunting) and oxygen utilization.26–28 Moreover, an elevated P(v-a)CO2 is not only dependent on the effect of the global flow related to tissue hypoxia but is also dependent on the ability of the microcirculatory blood flow to clear the additional carbon dioxide even during normal/high global flow. Recent clinical research has shown that the P(v-a)CO2 gap may also reflect alterations in the microcirculation in patients with septic shock. 16 Therefore, we suggest that restoration of the P(v-a)CO2/C(a-v)O2 ratio should focus on both global flow and microcirculation flow in the Group III condition. Some might argue the lactate level was not higher in Group III and that lactate is always taken as a marker of anaerobic metabolism. However, the agreement between the P(v-a)CO2/C(a-v)O2 ratio and lactate level should not be interpreted as representative of anaerobic metabolism. Studies have shown the hyperlactatemia is not always of hypoxic origin in critically ill patients.31–33
Group IV had a high P(v-a)CO2 of > 6 mmHg and low ScvO2 of < 70%, indicating that both global flow and DO2 were insufficient for the body’s demand. Interestingly, only 42% (83/198) of the measurements had a high P(v-a)CO2/C(a-v)O2 ratio in Group IV. In contrast, 58% of the P(v-a)CO2/C(a-v)O2 ratio measurements were normal (≤1.68). In other words, among patients with high P(v-a)CO2 and low ScvO2, there might be a more than 50% possibility for the absence of anaerobic metabolism. Hence, calculation of the P(v-a)CO2/C(a-v)O2 ratio might also provide information that would help to avoid over-resuscitation in patients with a high P(v-a)CO2 of > 6 mmHg and low ScvO2 of < 70%. Moreover, low ScvO2 and high P(v-a)CO2 might result from a high VO2 condition; in such cases, both the EO2 and VCO2 are increased. Our study also showed that Group IV had the highest EO2. The potential clinical meaning of the P(v-a)CO2/C(a-v)O2 ratio in the four groups is summarized in Table 3.
Characteristics and potential meaning of the P(v-a)CO2/C(a-v)O2 ratio in the four groups.

P(v-a)CO2, venoarterial carbon dioxide tension difference; ScvO2, central venous oxygen saturation; DO2, oxygen delivery; VO2, oxygen consumption; EO2, oxygen extraction percentage; SaO2, arterial oxygen saturation; FiO2, fraction of inspired oxygen; PEEP, positive end-expiratory pressure.
Disassociation of lactate and P(v-a)CO2/C(a-v)O2 ratio
A significant relationship between lactate and the P(v-a)CO2/C(a-v)O2 ratio was not found in the present study. Moreover, there was no significant difference in the lactate level between low and high P(v-a)CO2/C(a-v)O2 ratio measurements. This result seems to oppose those of published studies,4–7 and it should be interpreted with caution. The ability of the P(v-a)CO2/C(a-v)O2 ratio and lactate to reflect anaerobic metabolism was not questioned and/or compared in our study. Several factors could have confounded the relationship between lactate and the P(v-a)CO2/C(a-v)O2 ratio in the present study, such as the lactate clearance ability, washout effect, and stress factors. However, our study supports the notion that incoherence of lactate and the P(v-a)CO2/C(a-v)O2 ratio might be common in critically ill patients. We stress that attention should be paid to the disassociation of lactate and the P(v-a)CO2/C(a-v)O2 ratio in clinical practice. Traditionally, a high lactate level is always taken as a marker of anaerobic metabolism and an indicator of the need for resuscitation. This viewpoint has been challenging because high lactate cannot result from cellular hypoxia in the intensive care unit. A recent study showed that the P(v-a)CO2/C(a-v)O2 ratio can provide additional information on anaerobic metabolism when compared with the lactate level. 9 Further study is required to validate how to combine lactate and the P(v-a)CO2/C(a-v)O2 ratio to identify cellular hypoxia and guide resuscitation.
In summary, the P(v-a)CO2/C(a-v)O2 ratio is a potential marker of global anaerobic metabolism that could provide additional information regarding the relationship of global DO2/VO2 when combined with ScvO2 and P(v-a)CO2 in clinical practice. The above-described findings could be of interest and should be considered in the application of the P(v-a)CO2/C(a-v)O2 ratio in clinical practice.
Limitations
Several limitations of this study should be acknowledged. First, this was a retrospective study, and we only focused on the relationships between relevant parameters and the P(v-a)CO2/C(a-v)O2 ratio. Validation of the P(v-a)CO2/C(a-v)O2 ratio as a marker of cellular hypoxia was not the aim of this study; therefore, information regarding prognosis, other tissue perfusion parameters, cellular hypoxia indicators, DO2, and cardiac output are unavailable. Importantly, the most significant points of this study were demonstration of the profile of the P(v-a)CO2/C(a-v)O2 ratio and identification of the risk factors contributing to changes in parameters used in calculation of the ratio in clinical practice. Second, we acknowledge that some conclusions in this study are speculative according to reasonable pathophysiologic principles. Hence, further investigations are required to validate that hemodilution and hypoxemia with a high VO2 result in pseudo-normalization of the P(v-a)CO2/C(a-v)O2 ratio. Third, the P(v-a)CO2/C(a-v)O2 ratio functions as a parameter to predict the response of an increase in DO2 according to the concept of oxygen transport. The DO2 challenge test is the related method used to evaluate DO2/VO2 dependence. The limitations of the global DO2 challenge test must be taken into consideration; namely, the balance time of the DO2 challenge and the mathematical coupling of data when using the P(v-a)CO2/C(a-v)O2 ratio. 34
Conclusion
The P(v-a)CO2/C(a-v)O2 ratio is always low in a low ScvO2 + low P(v-a)CO2 condition, and the P(v-a)CO2/C(a-v)O2 ratio is always high in a high ScvO2 + low P(v-a)CO2 condition. A high P(v-a)CO2 is the most relevant factor that contributes to the high P(v-a)CO2/C(a-v)O2 ratio in critically ill patients. Before the P(v-a)CO2/C(a-v)O2 ratio is used for shock resuscitation in the clinical setting, further prospective studies are required to validate the P(v-a)CO2/C(a-v)O2 ratio in different clinical conditions.
Abbreviations
DO2 = oxygen delivery; VO2 = oxygen consumption; P(v-a)CO2 = venoarterial carbon dioxide tension difference; C(a-v)O2 = arteriovenous oxygen content difference; VCO2 = global carbon dioxide production; C(v-a)CO2 = venoarterial carbon dioxide content difference; ScvO2 = central venous oxygen saturation; SaO2 = arterial oxygen saturation; PaO2 = arterial oxygen tension; PaCO2 = arterial carbon dioxide tension; PvO2 = central venous oxygen tension; PvCO2 = central venous carbon dioxide tension; Hb = hemoglobin; CaO2 = arterial oxygen content; CvO2 = central venous oxygen content; EO2 = oxygen extraction percentage.
Footnotes
Declaration of conflicting interest
The authors declare that there is no conflict of interest.
Funding
This work was supported by the Fundamental Research Funds for the Central Universities (No. 3332018010).