
Abstract
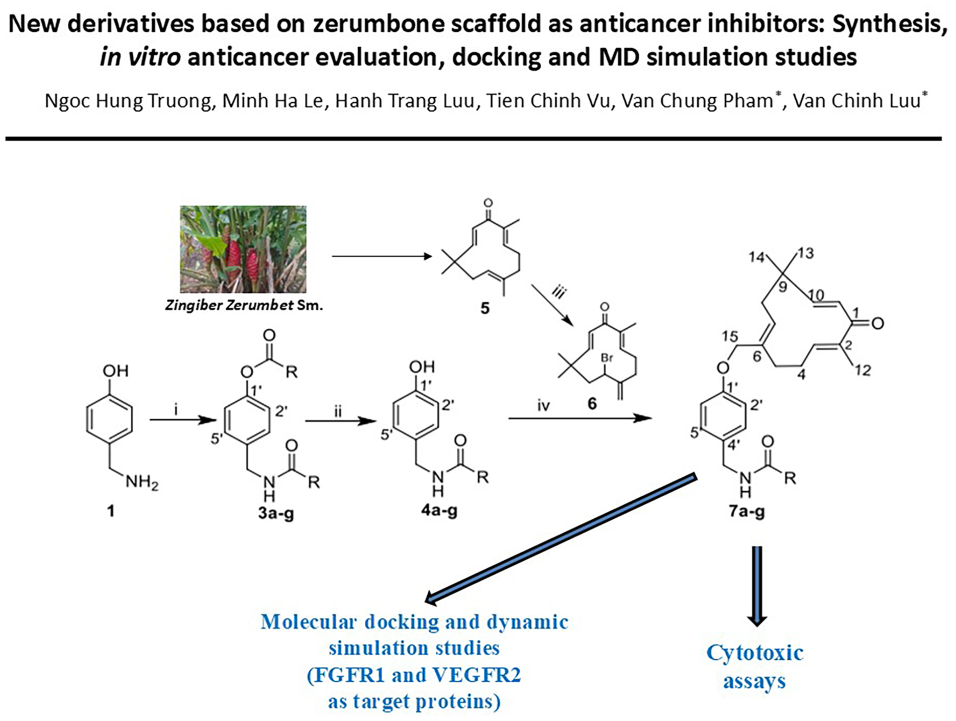
A three-step procedure was applied to synthesize seven novel zerumbone ethers
Introduction
Ethers are organic molecules with a C–O–C bond connecting alkyl or aryl groups. Many known natural and synthetic organic compounds have one or more ether groups presented in their molecules.1,2 The ether bond can be located in different positions in the molecule such as intracyclic, exocyclic, or acting as a bridge between two molecules in their conjugates.3 –5 In pharmaceutical chemistry, the presence of an ether group can improve the solubility in polar solvents such as water due to acting as a hydrogen bond acceptor. Moreover, ether group-containing molecules can enhance lipophilicity 6 and promote the balance between hydrophilic and lipophilic properties. 7 The ether group also serves as a proton acceptor forming hydrogen bonds when small molecule-target protein complexes are formed. Notably, ether linkages are often used as a common structure for the hydroxyl-protecting group in drug synthesis 8 and a useful moiety in studying the inhibition of target proteins in virtual screening. 9
Zerumbone is a natural sesquiterpene abundantly found in the Vietnamese traditional medicinal plant Zingiber zerumbet. 10 This sesquiterpene possesses strong anticancer activity, which has been explored in the last two decades.11,12 The pentadienone structural moiety and the original zerumbone scaffold are the required structures for its bioactivity, which must be kept in converting zerumbone into derivatives.13,14 This approach has resulted in impressive anticancer activity results and diverse structures reported in recent studies.15 –18 Accordingly, the bromination of the allyl structure moiety of zerumbone has yielded bromine derivatives suitable for the Williamson etherification as described in several studies.15 –18 To date, this approach has received intensive attraction from scientists to explore potential candidates of zerumbone for research and development of anticancer drugs.
In oncology, both proteins FGFR1 (Fibroblast Growth Factor Receptor 1, PDB ID: 1agw) and VEGFR2 (Vascular Endothelial Growth Factor Receptor 2, PDB ID: 4asd) play important roles in the development of cancer. 19 FGFR1 is a member of the tyrosine kinase family of molecules that plays a role in many biological processes, such as regulating tissue growth and repair. Alterations in FGFR1, such as gain, splicing, mutations, aberrant epigenetic or metabolic modifications, and altered tumor-tissue interactions in the tumor environment, can lead to the development and/or tumor progression for cancer cells. FGFR1 is an important component of FGF-FGFR signaling, playing a key role in the oncogenic process. VEGFR2 is a key component of VEGF-VEGFR signaling, the most important pathway for stimulating angiogenesis.20,21 The inhibition of this signaling chain has been a successful method in treating cancer. FGF/FGFR inhibitors are considered a promising approach for treating tumors with FGFR alterations. Several FGFR1 inhibitors have demonstrated benefit in clinical trials with groups of patients whose tumors contain FGFR1 alterations. 22 Several FGFR1 inhibitors are approved by the Food and Drug Administration (FDA), such as erdafitinib to treat metastatic bladder cancer with FGFR3 alterations and pemigatinib to treat inoperable biliary cancer with FGFR2 alterations. 23 Studies show that the effectiveness and anticancer range of the above drugs are limited and have side effects. Therefore, combining FGF/FGFR inhibitors with VEGF/VEGFR inhibitors is a good way to optimize treatment efficacy and expand the anticancer spectrum. This combination can target cancer cells and the tumor’s microbial environment. 24 Therefore, the new derivatives inhibiting FGFR1 and VEGFR2 proteins may lead to new candidates for further research on anticancer drug development.
In organic chemistry, 4-hydroxy benzylamine has been used to synthesize spirooxazoline. 25 In addition, its structural moiety has been found in synthesizing modified chitosan derivatives.26,27 However, its structure is also suitable for the role of a bonding bridge to connect bioactive compounds such as zerumbone with other compounds due to the ether and amide linkage formation from its hydroxy and amine groups. In molecular modeling, 4-hydroxybenzylamine moiety has been predicted to enhance the inhibition of target proteins, as the hydroxy and amine groups act as proton acceptors and donors, facilitating π-cation interaction. Interestingly, no studies on the synthesis, cytotoxic valuation, and in silico FGFR1/VEGFR2 inhibitory activities of zerumbone ethers with aromatic acids through the 4-hydroxy benzyl bridge are available. In the present work, we introduce herein the synthesis, cytotoxic activity evaluation, and docking studies on in silico FGFR1 and VEGFR2 inhibitory activity of novel zerumbone ethers with seven various aromatic acids.
Results and discussion
The synthesis of

The synthesis of zerumbone derivatives
In the second part, bromide
The synthesized derivatives in series
The cytotoxic activities of derivatives

Data represent the mean ± standard error of the mean of three independent wells.
Ellipticine (Merck, Germany) was employed as a positive control.
According to the IC50 data in Table 1, the derivatives
Docking study
The structural difference in the active binding pocket area between the two receptors FGFR1 (ID: 1agw) and VEGFR2 (ID: 4asd) can be recognized due to the three-dimensional model, as illustrated in Figure 1(a) and (b). The active binding domain of PDB ID 1agw is characterized by a bilobed structure typical of kinase domains. The N-terminal lobe (N-lobe) consists mainly of β-sheets, while the C-terminal lobe (C-lobe) is predominantly α-helical. The ATP-binding site is located in the cleft between these two lobes, where the inhibitor binds, stabilizing the inactive conformation of the kinase. 31
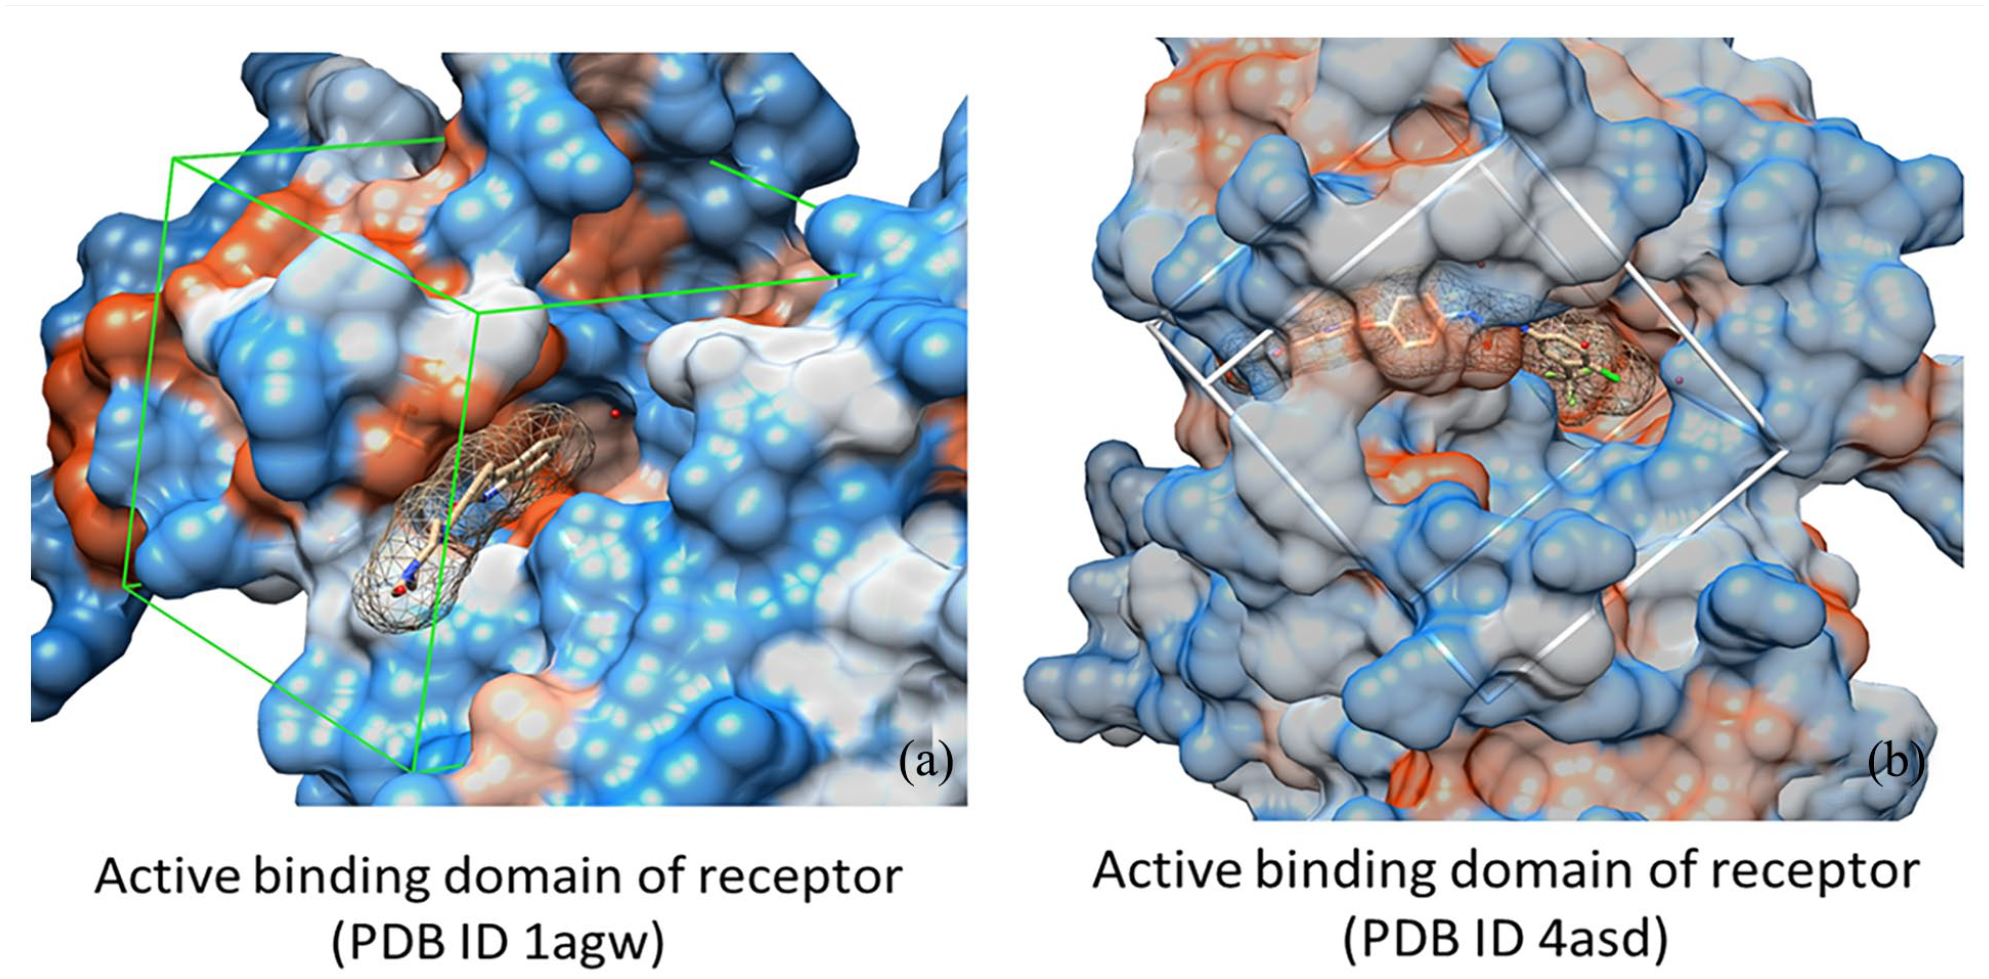
3D surface of active binding pocket: (a) receptor PDB ID 1agw and (b) receptor PDB ID 4asd.
For PDB ID 4asd, the structure of the active binding domain includes two regions: the Juxtamembrane domain, located adjacent to the cell membrane, plays a crucial role in regulating receptor activity. This domain often participates in dimerization (combining two receptors) and receptor activation through interactions with other molecules. The kinase domain is responsible for the receptor’s enzymatic activity, known as the process of phosphorylation (adding a phosphate group to target molecules). The kinase domain typically has a bilobed structure, with an N-terminal lobe and a C-terminal lobe, and the ATP-binding site is situated between these two lobes. 32 This structural arrangement significantly impacts the ability of the ligand or substrate to make contact, create interactions, and lead to biological reactions. Receptor 1agw (a) has higher flexibility than receptor 4asd (b).
Analysis docking result of receptor 1agw
Autodock Vina software is selected to dock the receptors (PDB ID 1agw and 4asd) with ligands
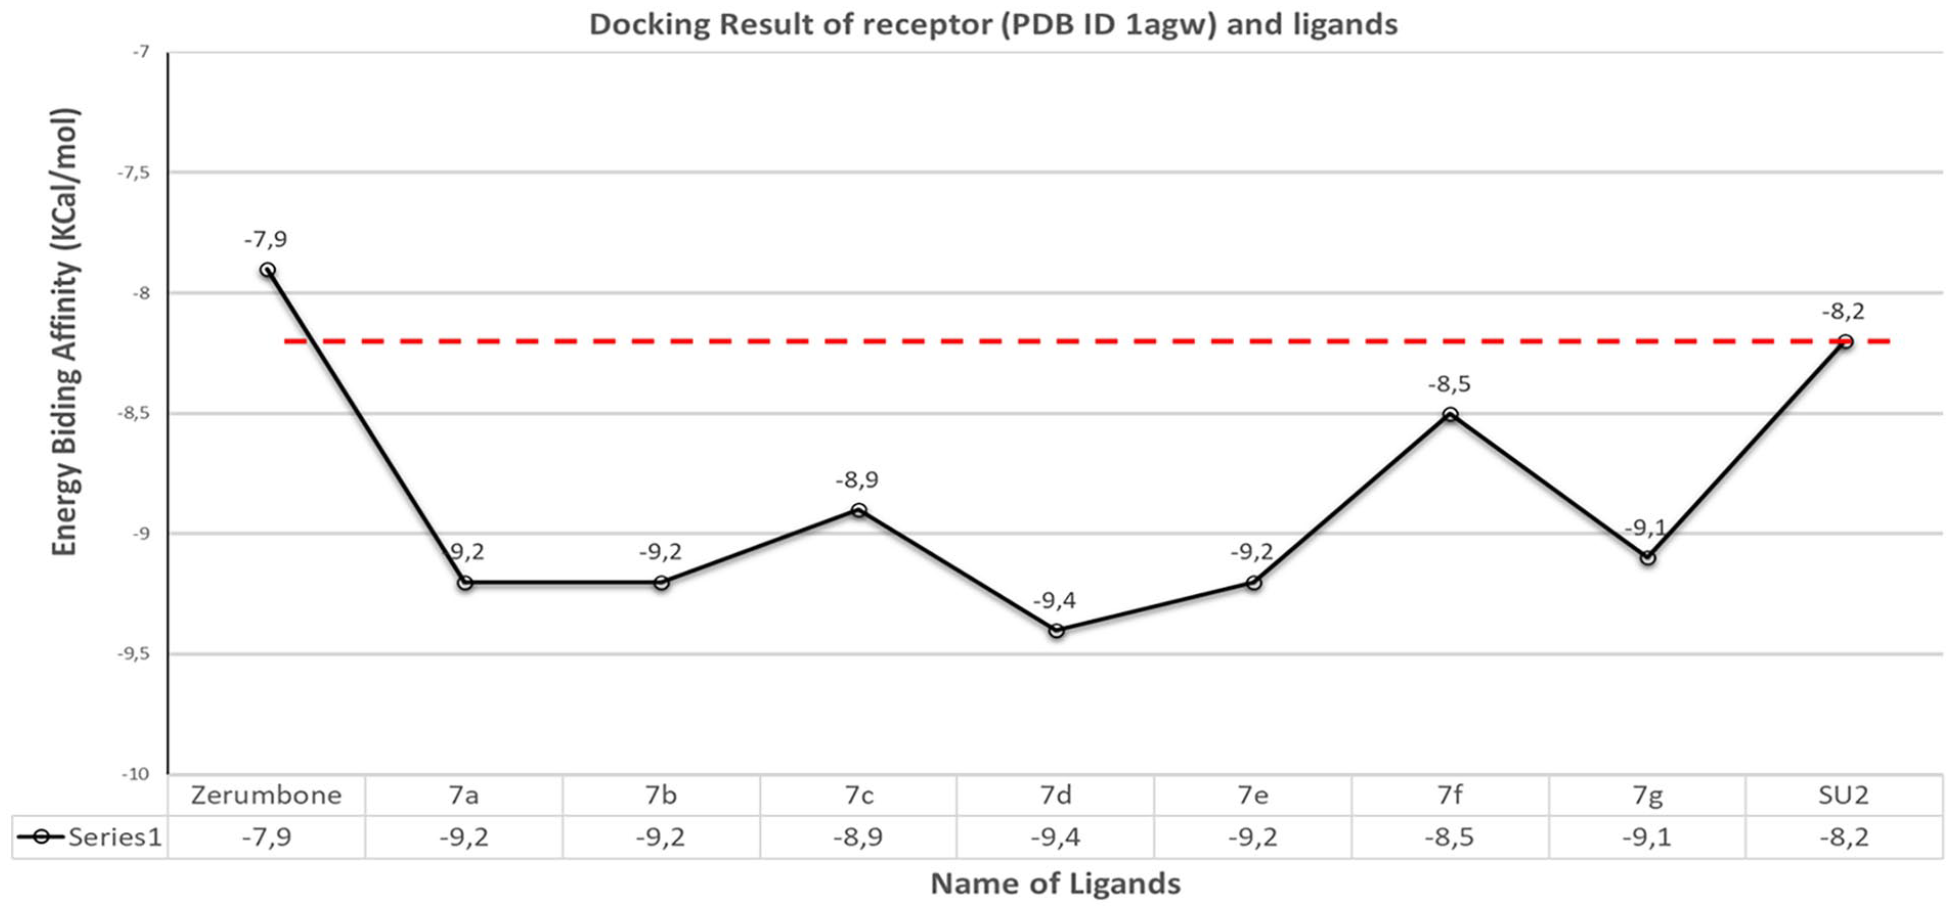
Binding affinity of the complexes between receptor (PDB ID 1aw) and ligands
Summarize the interactions of the ligands with the receptor FGFR1 (PDB ID 1agw).

(*) There are two interactions between the key residues of the receptor and the ligand molecules.
(**) There are three interactions between the key residues of the receptor and the ligand molecules.
The docking data in Table 2 show a significant improvement in the energy-binding affinity of series

3D interaction of SU2, zerumbone, and ligand
The interaction analysis of complexes formed by the receptor FGFR1, PDB ID 1agw with derivatives
Analysis docking result of receptor 4asd
The binding affinity data of complexes between the references BAX (sorafenib), infigratinib,

Binding affinity diagram of the docking results between the receptor (PDB ID 4asd) and the ligands
Summarize the interactions of the ligands with the receptor (PDB ID 4asd).

There are two interactions between the key residues of the receptor and the ligand molecules.
The residue ASP 1046 is crucial for coordinating the binding of ligand. According to the binding affinity data in Figure 4 and Table 3, the derivatives

3D interaction of: (a) sorafenib (BAX) and infigratinib; (b) zerumbone and ligand
The summarized data in Table 3 confirm that the derivatives
Furthermore, in the 3D surface simulation images from the docked poses (as described in Figure 6), an umbrella effect outside the active binding domain of the receptor has been formed due to the hydrophobic interactions of zerumbone. This effect prevents the substrate ATP (adenosine triphosphate) from approaching the active binding site, inhibiting ATP to ADP biotransformation reaction. This unique feature differentiates the derivatives

3D surface simulation of the docked poses of the derivatives
Through docking studies of receptors PDB ID 1agw and 4asd with derivatives
Moreover, it can be predicted that the derivatives
Molecular dynamics simulation
RMSD analysis
The RMSD analysis results of complexes between the receptors FGFR1 and VEGFR2 and derivatives

Comparison RMSD of the complexes formed by the receptor (PDB ID 1agw) with zerumbone, SU2, and derivatives
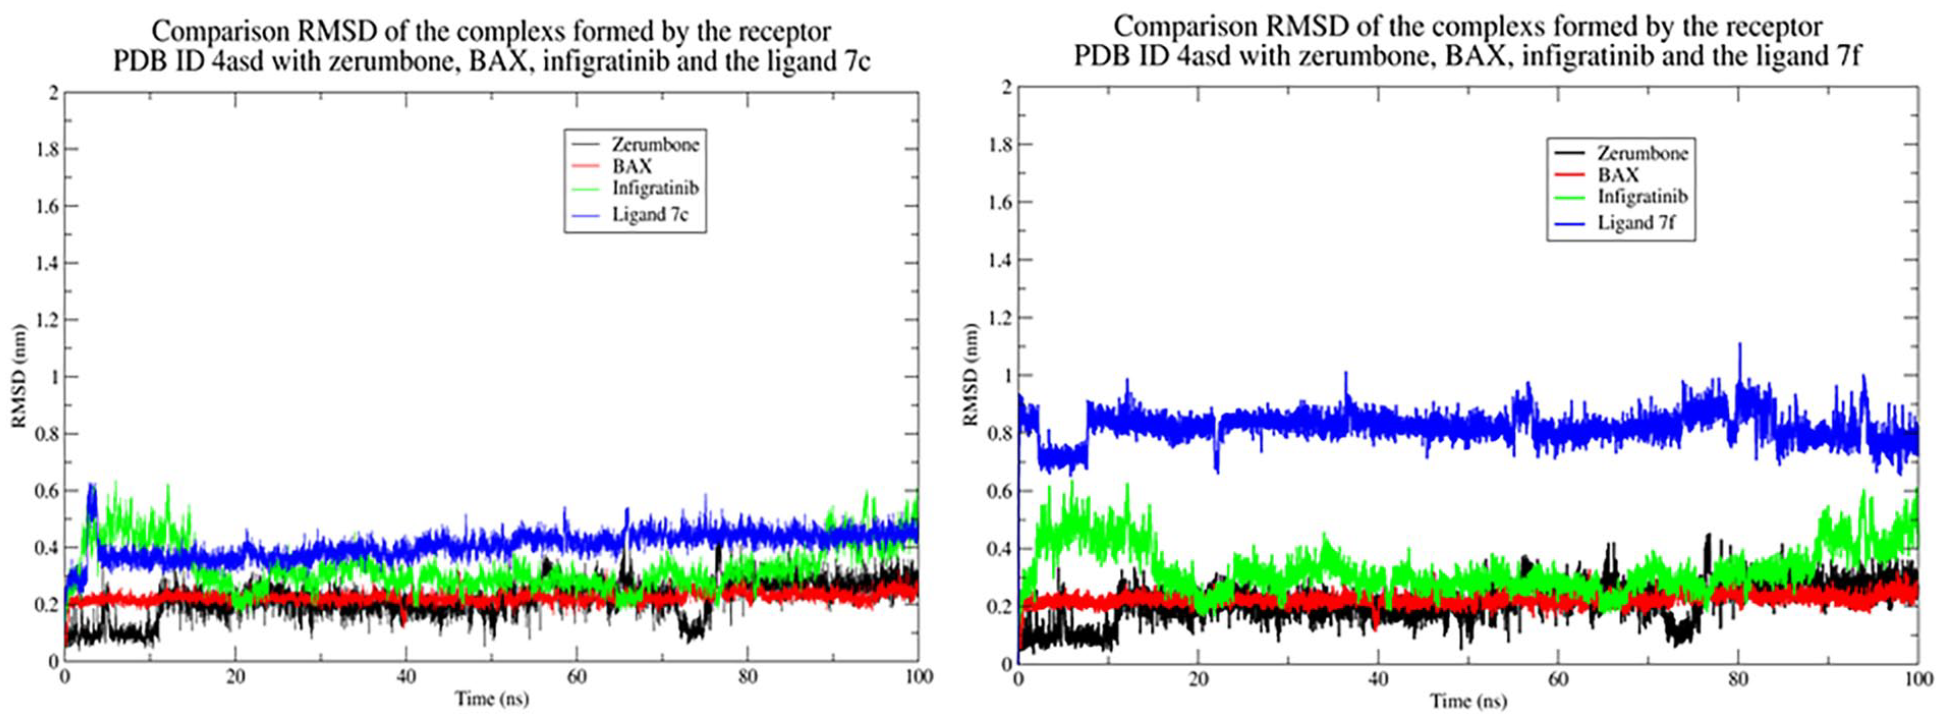
Comparison RMSD of the complexes formed by the receptor (PDB ID 4asd) with zerumbone, SU2, and derivatives
The RMSD values of complexes between 7a–g with receptor FGFR1 (PDB ID 1agw)
The complexes with reference compounds (including zerumbone and SU2) show relatively stable RMSD values. Meanwhile, the complexes between the receptor and derivatives

Comparison of the number of contacts of the complex formed by the receptor (PDB ID 1agw) with the specific compound of derivatives
The RMSD values of complexes between 7a–g with receptor VEGFR2 (ID: 4asd)
Due to the difference in the structure of the active binding domain of receptor VEGFR2 (PDB ID 4asd) compared to FGFR1 (PBD ID 1agw) as described in Figure 1(a) and (b), the interaction ability of zerumbone and its derivatives with key residues in the active binding pocket of receptor PDB ID 4asd is better than receptor PDB ID 1agw (see Appendix 9, Supplementary Material 2). The contact numbers in the complexes formed by zerumbone with receptors (PDB ID 1agw and 4asd) are shown in

Comparison of the number of contacts (<0.6 nm) in the complexes formed by the receptor (PDB ID 4asd) with zerumbone, BAX, and infitinib.

Comparison of the number of contacts of the complex formed by the receptor (PDB ID 4asd) with the specific compound of derivatives
RMSF analysis
This metric measures a particle’s root mean square fluctuation (e.g. a protein residue) over time compared to a reference position (usually the time-averaged position of the particle). Therefore, RMSF analyzes the parts of the structure that fluctuate the most (or least) compared to their average structure. For the receptor, RMSF describes local changes along the protein chain. A high RMSF value for a protein residue indicates that this part has large fluctuations during the simulation, while a low RMSF value suggests that this part fluctuates less.
The RMSF data of the receptors (PDB IDs 1agw and 4asd) are presented in Figures 12 and 13, and Appendices 10 and 11, Supplementary Material 2. The results show the differences in the shape of spectral and RMSF values of the receptors (1agw and 4asd) in their complexes with zerumbone. This confirms that interactions between zerumbone with the key residues in the active binding domain of proteins (PDB ID 4asd and 1agw) are different. However, in their interactions with derivatives

Comparison RMSF of the receptor (PDB ID 1agw) in the complexes formed with reference compounds (zerumbone, SU2) and derivatives

Comparison RMSF of the receptor (PDB ID 4asd) in the complexes formed with reference compounds (zerumbone, SU2) and derivatives
Hydrogen bond analysis (Hbond)
Hydrogen bond formation during the interaction between the residues of protein and the atoms in the functional group of ligands contributes to the stability of the complex. Furthermore, hydrogen bonds are a supportive factor in evaluating improvements in new drug design. Thus, this study analyzes the number of hydrogen bonds formed between ligands
As the simulation results in Figures 14 and 15, and Appendices 4 and 5, Supplementary Material 2, the derivatives
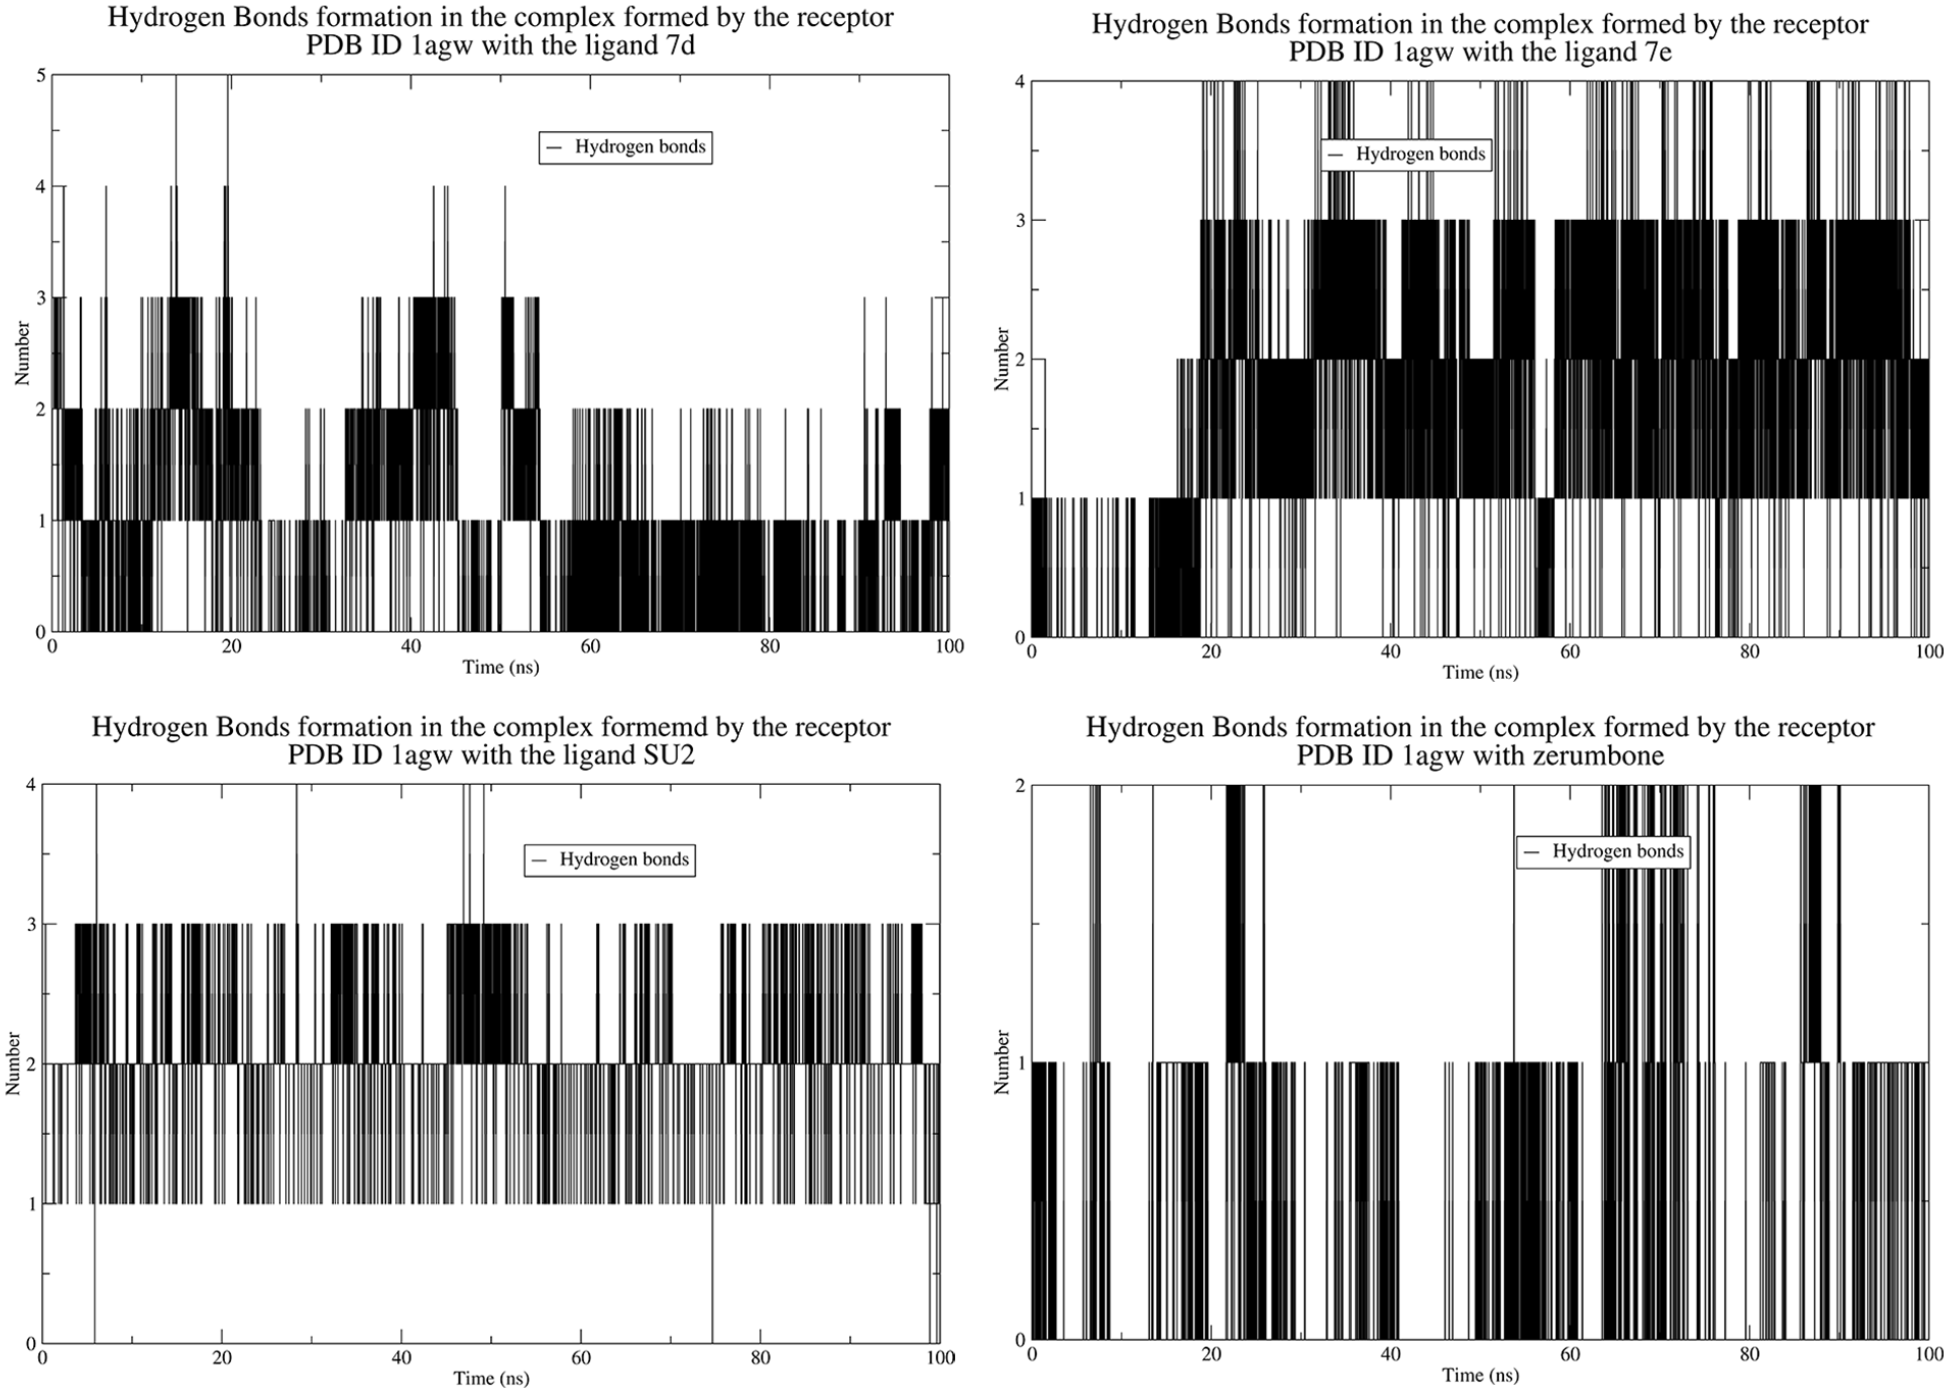
Hydrogen bond formation in the complexes formed by the receptor PDB ID 1agw with derivatives

Hydrogen bond formation in the complexes of receptor PDB ID 4asd with derivatives
The observation of hydrogen bond formation during the MD simulation of ligands
Number of contact analysis
The number of contact metric measures the number of contacts between two related groups of protein and ligand. Each contact is determined based on the shortest distance between the two groups. The number of contacts between the protein and ligand can help evaluate their interaction level. The ligand–protein complex has many contacts in the active binding domain referring to their strong interaction and resulting in its stability. As a result, this ligand is potent in inhibiting protein overexpression.
Comparing the number of contacts during the complex formation between the receptor (PDB ID 4asd) and the compounds: zerumbone, BAX, infigratinib, and
Binding free energy analysis
In this research, the MMPBSA (Molecular Mechanics Poisson-Boltzmann Surface Area) method is applied to calculate the binding free energy of protein–ligand complexes. The binding free energy is calculated by the difference in energy between the bound and unbound states of two molecules in a solvent. This value reflects the ability of the ligand to interact with the key residues in the active binding domain of the receptor. Furthermore, free binding energy values can reveal the inhibitory ability of ligands toward the receptor. The mentioned energies of the complexes between
Interaction energy of receptor (PDB ID 4asd) with specific compounds.

Interaction energy of receptor (PDB ID 1agw) with specific compounds.

All energies are in kcal mol−1.
ΔTOTAL, total binding free energy; ΔVDWAALS, van der Waals energy; ΔEEL, electrostatic energy; ΔEGB, polar solvation energy in Generalized-Born method; ΔESURF, nonpolar solvation energy in Generalized-Born method; ΔGGAS, gas-phase molecular mechanics free energy; ΔGSOLV, solvation free energy; MM/GB(PB)SA, Molecular Mechanics/Poisson-Boltzmann (Generalized-Born) Surface Area.

Binding free energy of the complexes formed by the receptor (PDB ID 4asd) with the ligands.

Binding free energy of the complexes formed by the receptor (PDB ID1agw) with the ligands.
Analysis of the free binding energy of complexes between receptors (PDB ID 1agw and 4asd) with derivatives
For the receptor FGFR1 (PDB ID 1agw), its complexes with derivatives
In conclusion, derivatives
Conclusion
Zerumbone ethers
Experimental
The preparation of zerumbone was mentioned in our previous studies.16
–18 The intermediate
General procedure for the synthesis of intermediates 3a–g
A solution of 4-(aminomethyl) phenol
4-((3-methoxybenzamido)methyl)phenyl 3-methoxybenzoate (3e): Quantitative yield, white solid, m.p.: 123 °C; R f = 0.43 (n-hexane: acetone-3:1). 1H NMR (600 MHz, DMSO-d6, δ (ppm)): 7.72 (d, J = 7.8 Hz, 1H, H-6), 7.59 (d, J = 1.2 Hz, 1H, H-2), 7.51 (m, 2H, H-6″, H-5), 7.47 (s, 1H, H-2″), 7.40 (m, 3H, H-3′, H-5′, H-5″), 7.31 (dd, J1 = 1.8 Hz, J2 = 7.8 Hz, 1H, H-4″), 7.24 (d, J = 7.8 Hz, 2H, H-2′, H-6′), 7.10 (dd, J1 = 1.8 Hz, J2 = 7.8 Hz, 1H, H-4), 4.52 (d, J = 6.0 Hz, 2H, 1′-CH2-), 3.85 (s, 3H, 3-OCH3), 3.81 (s, 3H, 3″-OCH3). 13C NMR (150 MHz, DMSO-d6, δ (ppm)): 165.9 (C=O amide), 164.5 (C=O ester), 159.4 (C-3), 159.2 (C-3″), 149.3 (C-4′), 137.4 (C-1″), 135.7 (C-1), 130.3 (C-1′), 130.1 (C-5″), 129.4 (C-5), 128.3 (C-2′, C-6′), 122.0 (C-6), 121.7 (C-3′, C-5′), 120.1 (C-6″), 119.4 (C-4), 117.1 (C-4″), 114.2 (C-2), 112.4 (C-2″), 55.4 (3-OCH3), 55.2 (3″-OCH3), 42.1 (1′-CH2-).
General procedure for the synthesis of intermediates 4a–g
A solution of each crude
N-(4-hydroxybenzyl)-3-methylbenzamide (4d): Yield: 88%, white solid, m.p.: 183–184 °C; R f = 0.39 (n-hexane:acetone-2:1). 1H NMR (600 MHz, DMSO-d6, δ (ppm)): 9.24 (s, 1H, 4′-OH), 8.84 (t, J = 6.0 Hz, 1H, -NH-), 7.70 (s, 1H, H-2″), 7.67 (m, 1H, H-5″), 7.33 (m, 2H, H-4″, H-6″), 7.13 (d, J = 8.4 Hz, 2H, H-2′, H-6′), 6.71 (m, 2H, H-3′, H-5′), 4.36 (d, J = 6.0 Hz, 2H, 1′-CH2-), 2.35 (s, 3H, 3″-CH3). 13C NMR (150 MHz, DMSO-d6, δ (ppm)): 166.1 (C=O, amide), 156.2 (C-4′), 137.5 (C-3″), 134.5 (C-1″), 131.6 (C-1′), 129.9 (C-2″), 128.6 (C-2′, C-6′), 128.1 (C-4″), 127.8 (C-5″), 124.3 (C-6″), 115.0 (C-3′, C-5′), 42.1 (1′-CH2-), 20.9 (3″-CH3). ESI-HRMS calculated for C15H16NO2: [M+H]+ (m/z): 242.1181, found: 242.1170.
N-(4-hydroxybenzyl)-3-methoxybenzamide (4e): Yield: 91%, white solid, m.p.: 135–137 °C; R f = 0.35 (n-hexane:acetone-2:1). 1H NMR (600 MHz, DMSO-d6, δ (ppm)): 9.24 (s, 1H, 4′-OH), 8.89 (s, 1H, -NH-), 7.45 (d, J = 7.8 Hz, H-6″), 7.43 (s, 1H, H-2″), 7.36 (t, J = 7.8 Hz, 1H, H-5″), 7.12 (d, J = 7.8 Hz, 2H, H-2′, H-6′), 7.08 (d, J = 7.8 Hz, 1H, H-4″), 6.70 (d, J = 7.8 Hz, 2H, H-3′, H-5′), 4.36 (d, J = 6.0 Hz, 2H, 1′-CH2-), 3.80 (s, 3H, 3″-OCH3). 13C NMR (150 MHz, DMSO-d6, δ (ppm)): 165.7 (C=O amide), 159.1 (C-3″), 156.2 (C-4′), 135.9 (C-1″), 129.8 (C-1′), 129.4 (C-5″), 128.6 (C-2′, C-6′), 119.4 (C-6″), 117.0 (C-4″), 115.0 (C-3′, C-5′), 112.3 (C-2″), 55.2 (3″-OCH3), 42.2 (1′-CH2-). ESI-HRMS calculated for C15H16NO3: [M+H]+ (m/z): 258.1130, found: 258.1115.
N-(4-hydroxybenzyl)cinnamamide (4g): Yield: 85%, white solid, m.p.: 157–158 °C; R f = 0.37 (n-hexane:acetone-2:1). 1H NMR (600 MHz, DMSO-d6, δ (ppm)): 9.31 (s, 1H, 4′-OH), 8.46 (t, J = 5.7 Hz, 1H, -NH-), 7.57 (d, J = 8.4 Hz, 2H, H-2″, H-6″), 7.47 (d, J = 15.6 Hz, 1H, H-7″), 7.41 (m, 2H, H-3″, H-5″), 7.37 (m, 1H, H-4″), 7.11 (dd, J1 = 1.8 Hz, J2 = 8.7 Hz, 2H, H-2′, H-6′), 6.73 (ddd, J1 = 1.8 Hz, J2 = 4.8 Hz, J3 = 8.4 Hz, 2H, H-3′, H-5′), 6.69 (d, J = 15.6 Hz, 2H, H-8″), 4.29 (d, J = 6.0 Hz, 2H, 1′-CH2-). 13C NMR (150 MHz, DMSO-d6, δ (ppm)): 164.7 (C=O, amide), 156.3 (C-4′), 138.8 (C-7″), 134.9 (C-1″), 129.5 (C-1′), 129.4 (C-4″), 128.9 (C-3″, C-5″), 128.8 (C-2′, C-6′), 127.5 (C-2″, C-6″), 122.2 (C-8″), 115.1 (C-3′, C-5′), 41.9 (1′-CH2-). ESI-HRMS calculated for C16H16NO2: [M+H]+ (m/z): 254.1181, found: 242.1165.
General procedure for the synthesis of derivatives 7a–g
A mixture of each
N-(4-(((1Z,5E,8E)-4,4,8-trimethyl-7-oxocycloundeca-1,5,8-trien-1-yl)methoxy)benzyl)benzamide (7a): Yield: 57%, white solid, m.p.: 95–96 °C; R f = 0.38 (n-hexane:acetone-3:1). 1H NMR (600 MHz, DMSO-d6, δ (ppm)): 8.96 (t, J = 6.0 Hz, 1H, -NH-), 7.88 (m, 2H, H-2″, H-6″), 7.52 (m, 1H, H-4″), 7.46 (m, 2H, H-3″, H-5″), 7.24 (m, 2H, H-2′, H-6′), 6.92 (m, 2H, H-3′, H-5′), 6.00 (t, J = 5.7 Hz, 1H, H-3), 5.97 (m, 2H, H-10, H-11), 5.53 (t, J = 8.1 Hz, 1H, H-7), 4.66 (s, br, 1H, H-15a), 4.40 (d, J = 6.0 Hz, 2H, 1′-CH2-), 4.27 (s, brd, 1H, H-15b), 2.58 (m, 1H, H-5a), 2.46 (m, 2H, H-4a, H-8a), 2.21 (m, 2H, H-4b, H-5b), 1.97 (m, 1H, H-8b), 1.69 (s, 3H, H-12), 1.23 (s, 3H, H-13 or H-14), 1.04 (s, 3H, H-14 or H-13). 13C NMR (150 MHz, DMSO-d6, δ (ppm)): 202.7 (C-1), 166.0 (C=O, amide), 159.7 (C-10), 157.4 (C-4′), 148.8 (C-3), 137.7 (C-2), 135.5 (C-6), 134.4 (C-1″), 131.8 (C-1′), 131.1 (C-4″), 129.8 (C-7), 128.5 (C-2′, C-6′), 128.2 (C-3″, C-5″), 127.2 (C-2″, C-6″), 127.0 (C-11), 114.4 (C-3′, C-5′), 64.6 (C-15), 42.0 (1′-CH2-), 41.5 (C-8), 37.0 (C-9), 34.8 (C-5), 28.9 (C-13 or C-14), 24.3 (C-4), 23.7 (C-14 or C-13), 11.8 (C-12). ESI-HRMS calculated for C29H34NO3: [M+H]+ (m/z): 444.2538, found: 444.2515.
4-methyl-N-(4-(((1Z,5E,8E)-4,4,8-trimethyl-7-oxocycloundeca-1,5,8-trien-1-yl)methoxy)benzyl)benzamide (7b): Yield: 61%, white solid, m.p.: 76–77 °C; R f = 0.38 (n-hexane:acetone-3:1). 1 H NMR (600 MHz, DMSO-d6, δ (ppm)): 8.86 (t, J = 6.0 Hz, 1H, -NH-), (t, J = 8.4 Hz, 2H, H-2″, H-6″), 7.24 (m, 4H, H-3″, 5H″, H-2′, H-6′), 6.92 (m, 2H, H-3′, H-5′), 6.01 (t, J = 6.0 Hz, 1H, H-3), 5.97 (m, 2H, H-10, H-11), 5.52 (t, J = 8.4 Hz, 1H, H-7), 4.66 (d, J = 9.0 Hz, 1H, H-15a), 4.39 (d, J = 6.0 Hz, 2H, 1′-CH2-), 4.27(d, J = 9.0 Hz, 1H, H-15b), 2.58 (m, 1H, H-5a), 2.46 (m, 2H, H-4a, H-8a), 2.35 (s, 3H, 4″-CH3) 2.20 (m, 2H, H-4b, H-5b), 1.96 (m, 1H, H-8b), 1.69 (s, 3H, H-12), 1.21 (s, 3H, H-13 or H-14), 1.04 (s, 3H, H-14 or H-13). 13C NMR (150 MHz, DMSO-d6, δ (ppm)): 202.7 (C-1), 165.9 (C=O, amide), 159.6 (C-10), 157.4 (C-4′), 148.8 (C-3), 140.9 (C-4″), 137.7 (C-2), 135.5 (C-6), 131.9 (C-1″), 131.6 (C-1′), 129.8 (C-7), 128.7 (C-3″, C-5″), 128.5 (C-2″, C-6″), 127.2 (C-2′, C-6′), 114.4 (C-3′, C-5′), 64.6(C-15), 42.0 (1′-CH2-), 41.5 (C-8), 37.0 (C-9), 34.8 (C-5), 28.9 (C-13 or C-14), 24.3 (C-4), 23.6 (C-14 or C-13), 20.9 (4″-CH3), 11.8 (C-12). ESI-HRMS calculated for C30H36NO3: [M+H]+ (m/z): 458.2695, found: 458.2667.
4-methoxy-N-(4-(((1Z,5E,8E)-4,4,8-trimethyl-7-oxocycloundeca-1,5,8-trien-1-yl)methoxy)benzyl)benzamide (7c): Yield: 73%, white solid, m.p.: 72–73 °C; R f = 0.37 (n-hexane:acetone-3:1). 1H NMR (600 MHz, DMSO-d6, δ (ppm)): 8.80 (t, J = 6.0 Hz, 1H, -NH-), 7.86 (d, J = 8.7 Hz, 2H, H-2″, H-6″), 7.23 (d, J = 8.7 Hz, 2H, H-2′, H-6′), 6.99 (d, J = 8.7 Hz, 2H, H-3″, H-5″), 6.91 (dd, J1 = 2.4 Hz, J2 = 8.7 Hz, 2H, H-3′, H-5′), 6.02 (t, J = 6.0 Hz, 1H, H-3), 5.97 (m, 2H, H-10, H-11), 5.52 (t, J = 8.4 Hz, 1H, H-7), 4.66 (d, J = 9,0 Hz, 1H, H-15a), 4.38 (d, J = 6.0 Hz, 2H, 1′-CH2-), 4.27 (d, J = 9,0 Hz, 1H, H-15b), 3.80 (s, 3H, 4″-OCH3), 2.58 (m, 1H, H-5a), 2.46 (m, 2H, H-4a, H-8a), 2.20 (m, 2H, H-4b, H-5b), 1.96 (m, 1H, H-8b), 1.69 (s, 3H, H-12), 1.21 (s, 3H, H-13 or H-14), 1.05 (s, 3H, H-14 or H-13). 13C NMR (150 MHz, DMSO-d6, δ (ppm)): 202.7 (C-1), 165.5 (C=O, amide), 161.5 (C-4″), 159.7 (C-10′), 157.4 (C-4′), 148.8 (C-3), 137.7 (C-2), 135.5 (C-6), 132.1 (C-1′), 129.8 (C-7), 129.0 (C-2″, C-6″), 128.5 (C-2′, C-6′), 127.0 (C-11), 126.6 (C-1″), 114.4 (C-3′, C-5′), 113.4 (C-3″, C-5″), 64.7 (C-15), 55.3 (4″-OCH3), 42.0 (1′-CH2-), 41.5 (C-8), 37.0 (C-9), 34.8 (C-5), 28.9 (C-13 or C-14), 24.3 (C-4), 23.7 (C-14 or C-13), 11.8 (C-12). ESI-HRMS calculated for C30H36NO4: [M+H]+ (m/z): 474.2644, found: 474.2619.
3-methyl-N-(4-(((1Z,5E,8E)-4,4,8-trimethyl-7-oxocycloundeca-1,5,8-trien-1-yl)methoxy)benzyl)benzamide (7d): Yield: 63%, white solid, m.p.: 80–81 °C; R f = 0.39 (n-hexane:acetone-3:1). 1H NMR (600 MHz, DMSO-d6, δ (ppm)): 8.89 (t, J = 6.0 Hz, 1H, -NH-), 7.70 (s, 1H, H-2″), 7.67 (m, 1H, H-5″), 7.33 (m, 2H, H-4,″ H-6″), 7.21 (dd, J1 = 2.7 Hz, J2 = 8.4 Hz, 2H, H-2′, H-6′), 6.92 (ddd, J1 = 2.7 Hz, J2 = 4.8 Hz, J3 = 8.4 Hz), 6.01 (t, J = 5.7 Hz, 1H, H-3), 5.98 (d, J = 16.8 Hz, 1H, H-10), 5.96 (d, J = 16.8 Hz, 1H, H-11), 5.52 (t, J = 8.4 Hz, 1H, H-7), 4.66 (d, J = 8.4 Hz, 1H, H-15a), 4.40 (d, J = 6.0 Hz, 2H, 1′-CH2-), 4.27 (d, J = 8.4 Hz, 1H, H-15b), 2.58 (m, 1H, H-5a), 2.46 (m, 2H, H-4a, H-8a), 2.35 (s, 3H, 3″-CH3), 2.22 (m, 2H, H-4a, H-5a), 1.96 (m, 1H, H-8b), 1.69 (s, 3H, H-12), 1.21 (s, 3H, H-13 or H-14), 1.04 (s, 3H, H-14 or H-13). 13C NMR (150 MHz, DMSO-d6, δ (ppm)): 202.7 (C-1), 166.1 (C=O, amide), 159.6 (C-10), 157.4 (C-4′), 148.8 (C-3), 137.7 (C-2), 137.5 (C-3″), 135.5 (C-6), 134.4 (C-1″), 131.9 (C-1′), 131.6 (C-2″), 129.8 (C-7), 128.5 (C-2′, C-6′), 128.1 (C-4″), 127.7 (C-5″), 127.0 (C-11), 124.3 (C-6″), 114.4 (C-3′, C-5′), 64.7 (C-15), 42.0 (1′-CH2-), 41.5 (C-8), 37.0 (C-9), 34.8 (C-5), 28.9 (C-13 or C-14), 24.3 (C-4), 23.6 (C-14 or C-13), 20.9 (3″-CH3), 11.8 (C-12). ESI-HRMS calculated for C30H36NO3: [M+H]+ (m/z): 458.2695, found: 458.2670.
3-methoxy-N-(4-(((1Z,5E,8E)-4,4,8-trimethyl-7-oxocycloundeca-1,5,8-trien-1-yl)methoxy)benzyl)benzamide (7e): Yield: 68%, white solid, m.p.: 90–91 °C; R f = 0.37 (n-hexane:acetone-3:1). 1H NMR (600 MHz, DMSO-d6, δ (ppm)): 8.94 (t, J = 6.0 Hz, 1H, -NH-), 7.46 (d, J = 7.8 Hz, 1H, H-6″), 7.43 (t, J = 1.8 Hz, 1H, H-2″), 7.37 (t, J = 7.8 Hz, 1H, H-5″), 7.25 (d, J = 7.8 Hz, 2H, H-2′, H-6′), 7.,08 (d, J1 = 1.8 Hz, J2 = 7.8 Hz, 1H, H-4″), 6.92 (m, 2H, H-3′, H-5′), 6.00 (m, 3H, H-3, H-10, H-11), 5.52 (t, J = 8.4 Hz, 1H, H-7), 4.66 (d, J = 8.4 Hz, 1H, H-15a), 4.40 (d, J = 6.0 Hz, 2H, 1′-CH2-), 4.27 (s, brd, 1H, H-15b), 3.80 (s, 3H, 3″-OCH3), 2.50 (m, 1H, H-5a), 2.46 (m, 2H, H-8a, H-4a), 2.33 (m, 2H, H-5b, H-4b), 1.96 (m, 1H, H-8b), 1.69 (s, 3H, H-12), 1.21 (s, 3H, H-13 or H-14), 1.04 (s, 3H, H-14 or H-13). 13C NMR (150 MHz, DMSO-d6, δ (ppm)): 202.7 (C-1), 165.7 (C-amide), 159.6 (C-10), 159.1 (C-3″), 157.4 (C-4′), 148.8 (C-3), 137.7 (C-2), 135.8 (C-1″), 135.5 (C-6), 131.8 (C-1′), 129.8 (C-7), 129.3 (C-5″), 128.5 (C-2′, C-6′), 127.0 (C-11), 119.4 (C-6″), 117,0 (C-4″); 114,4 (C-3′, C-5′); 112,3 (C-2″); 64,6 (C-15); 55,2 (2″-OCH3); 42,1 (1′-CH2-), 41.5 (C-8), 37.0 (C-9), 34.8 (C-5), 28.9 (C-13 or C-14), 24.3 (C-4), 23.6 (C-14 or C-13), 11.8 (C-12). ESI-HRMS calculated for C30H36NO4: [M+H]+ (m/z): 474.2644, found: 474.2617.
3,4,5-trimethoxy-N-(4-(((1Z,5E,8E)-4,4,8-trimethyl-7-oxocycloundeca-1,5,8-trien-1-yl)methoxy)benzyl)benzamide (7f): Yield: 67%, white solid, m.p.: 91–92 °C; R f = 0.35 (n-hexane:acetone-3:1). 1H NMR (600 MHz, DMSO-d6, δ (ppm)): 8.90 (t, J = 5.7 Hz, 1H, -NH-), 7.24 (m, 4H, H-2′, H-6′, H-2″, H-6″), 6.93 (d, J = 8.4 Hz, 2H, H-3′, H-5′), 6.01 (t, J = 5.7 Hz, 1H, H-3), 5.97 (m, 2H, H-10, H-11), 5.52 (t, J = 8.1 Hz, 1H, H-3), 4.66 (s, brd, 1H, H-15a), 4.41 (d, J = 6.0 Hz, 2H, 1′-CH2-), 4.28 (s, brd, 1H, H-15b), 3.82 (s, 6H, 3″-OCH3-, 5″-OCH3), 3.71 (s, 3H, 4″-OCH3), 2.58 (m, 1H, H-5a), 2.47 (m, 2H, H-4a, H-8a), 2.20 (m, 2H, H-4b, H-5b), 1.97 (m, 1H, H-8b), 1.69 (s, 3H, 2 -CH3- or H-12), 1.21 (s, 3H, H-13 or H-14), 1.05 (s, 3H, H-14 or H-13). 13C NMR (150 MHz, DMSO-d6, δ (ppm)): 202.7 (C-1), 165.4 (C=O, amide), 159.6 (C-10), 157.4 (C-4′), 152.5 (C-3″, C-5″), 148.8 (C-3), 139.9 (C-4″), 137.7 (C-2), 135.5 (C-6), 131.8 (C-1″), 129.8 (C-7), 129.5 (C-1′), 128.6 (C-2′, C-6′), 127.0 (C-11), 114.4 (C-3′, C-5′), 104.8 (C-2″, C-6″), 64.7 (C-15), 60.0 (4″-OCH3), 55.9 (3″-OCH3, 5″-OCH3), 42.1 (1′-CH2-), 41.5 (C-8), 37.0 (C-9), 34.8 (C-5), 28.9 (C-13 or C-14), 24.3 (C-4), 23.6 (C-14 or C-13), 11.8 (C-12). ESI-HRMS calculated for C32H40NO6: [M+H]+ (m/z): 534.2825, found: 534.2855.
N-(4-(((1Z,5E,8E)-4,4,8-trimethyl-7-oxocycloundeca-1,5,8-trien-1-yl)methoxy)benzyl)cinnamamide (7g): Yield: 55%, white solid, m.p.: 73–74 °C; R f = 0.39 (n-hexane:acetone-3:1). 1H NMR (600 MHz, DMSO-d6, δ (ppm)): 8.52 (t, J = 5.7 Hz, 1H, -NH-), 7.56 (d, J = 8.4 Hz, 2H, H-2″, H-6″), 7.46 (d, J = 15.9 Hz, 1H, H-7″), 7.39 (m, 3H, H-3″, H-4″, H-5″), 7.22 (d, J = 8.4 Hz, 2H, H-3′, H-5′), 6.93 (dd, J1 = 1.8 Hz, J2 = 8.4 Hz, 2H, H-3′, H-5′), 6.68 (d, J = 15.9 Hz, 1H, H-8″), 6.01 (t, J = 6.3 Hz, 1H, H-3), 5.99 (m, 2H, H-10, H-11), 5.53 (t, J = 8.4 Hz, 1H, H-7), 4.67 (d, J = 9.6 Hz, 1H, H-15a), 4.30 (s, brd, 1H, H-15b), 2.58 (m, 1H, H-5a), 2.47 (m, 2H, H-4a, H-8a), 2.22 (m, 2H, H-4b, H-5b), 1.96 (m, 1H, H-8b), 1.69 (s, 3H, H-12), 1.21 (s, 3H, H-13 or H-14), 1.05 (s, 3H, H-14 or H-13). 13C NMR (150 MHz, DMSO-d6, δ (ppm)): 202.8 (C-1), 164.8 (C=O, amide), 159.7 (C-10), 157.5 (C-4′), 148.9 (C-3), 138.8 (C-7″), 137.7 (C-2), 135.6 (C-6), 134.9 (C-1″), 131.5 (C-1′), 129.9 (C-7), 129.4 (C-1′), 128.9 (C-3″, C-5″), 128.8 (C-2′, C-6′), 127.5 (C-2″, C-6″), 127.1 (C-11), 122.1 (C-8″), 114.5 (C-3′, C-5′), 64.7 (C-15), 41.8 (1′-CH2-), 41.6 (C-8), 37.1 (C-9), 34.8 (C-5), 29.0 (C-13 or C-14), 24.4 (C-4), 23.7 (C14 or C-13), 11.9 (C-12). ESI-HRMS calculated for C31H36NO3: [M+H]+ (m/z): 470.2695, found: 470.2644.
Biology
The in vitro cytotoxic evaluation against HepG2, A549, and HeLa cancer cell lines was carried out according to the described protocols.33,34 Accordingly, stock solutions of the derivatives
Docking study
The Autodock Vina integrated with Chimera version 1.17.3 software 35 was applied to dock ligands and receptors (PDB IDs 1agw and 4asd). In addition, MolAICal software 36 and SwissDock web tool 37 were also referenced to improved Autodock tools for evaluation.
The molecules infigratinib, BAX, SU2, DHA, zerumbone and derivatives
The docking process with Chimera version 1.17.3 was carried out following a similar our previous procedure 18 in which a grid box was established to identify the active binding site with coordinate parameters (x,y,z) and size (x,y,z) of the receptors as shown in Table 6.
Parameters identifying the active binding site of the receptor.

Protein-Ligand Interaction Profiler (PLIP) 38 at the address https://plip-tool.biotec.tu-dresden.de/plip-web/plip/index was used to analyze the interaction results between ligand and protein. The docking results are presented in Appendix 1, Supplementary Material 2.
Ligand–protein molecular dynamics simulation studies
In the current study, molecular dynamics (MD) simulation was carried out using the Gromacs software version 2024.1 on the SuperMicro GPU SuperWorkstation 7048GR-TR system, equipped with 2 x Intel Xeon E5-2696 V4 (2.2Ghz Turbo 3.6Ghz) 44 Core/88 Threads; 4 x Nvidia Tesla P100 16Gb HBM2, 128 DDR4 Ecc Buss 2400, 2 x SSD Nvme PCie 2TB. The simulation process was performed according to the method described by Truong et al., 18 but with the simulation time extended up to 100 ns.
To ensure the accuracy and reliability of the MD simulation results, preliminary simulation steps were performed to achieve temperature and pressure equilibrium in the system. Initially, an NVT (Number of particles, Volume, and Temperature) simulation was performed with fixed temperature (T) and volume (V) for the system to achieve temperature equilibrium and appropriate energy distribution. Subsequently, an NPT (Number of particles, Pressure, and Temperature) simulation was performed with fixed temperature (T) and constant pressure (P) for the system to achieve pressure equilibrium and adapt to environmental pressure, preparing for the next step of running MD.
To minimize the ligand moving far from the active binding domain during the simulation, at the energy minimization stage, the energy step size (emstep) is set to 0.01 nm, the maximum number of steps to perform (nsteps) was 500,000; the maximum force was lower than 100 kJ mol−1 nm−1 (emtol = 100) using the position restraint technique with tension for constraints in all three directions x,y,z is 1000 kJ mol−1 nm−2. During the simulation process from NVT to NPT and MD, the RMSD and number of contacts of the protein–ligand complex were evaluated to ensure the simulations achieve stability.
During the MD simulation process, kinetic values and interactions between particles in the system were recorded according to the change in position and speed of the particles over time. The recorded results for interaction analysis include RMSD, RMSF, Hbond, and number of contacts. The binding free energy was calculated using the “g_mmpbsa” tool on GROMACS according to the method described by Valdés-Tresanco et al. 39 and applied by Truong et al. 18
Supplemental Material
sj-docx-1-chl-10.1177_17475198241312456 – Supplemental material for New derivatives based on zerumbone scaffold as anticancer inhibitors: Synthesis, in vitro anticancer evaluation, docking, and MD simulation studies
Supplemental material, sj-docx-1-chl-10.1177_17475198241312456 for New derivatives based on zerumbone scaffold as anticancer inhibitors: Synthesis, in vitro anticancer evaluation, docking, and MD simulation studies by Ngoc Hung Truong, Minh Ha Le, Hanh Trang Luu, Tien Chinh Vu, Van Chung Pham and Van Chinh Luu in Journal of Chemical Research
Supplemental Material
sj-docx-2-chl-10.1177_17475198241312456 – Supplemental material for New derivatives based on zerumbone scaffold as anticancer inhibitors: Synthesis, in vitro anticancer evaluation, docking, and MD simulation studies
Supplemental material, sj-docx-2-chl-10.1177_17475198241312456 for New derivatives based on zerumbone scaffold as anticancer inhibitors: Synthesis, in vitro anticancer evaluation, docking, and MD simulation studies by Ngoc Hung Truong, Minh Ha Le, Hanh Trang Luu, Tien Chinh Vu, Van Chung Pham and Van Chinh Luu in Journal of Chemical Research
Footnotes
Author contributions
Data availability statement
The data supporting the findings of this study are available from the corresponding authors upon reasonable request.
Declaration of conflicting interests
The author(s) declared no potential conflicts of interest with respect to the research, authorship, and/or publication of this article.
Funding
The author(s) disclosed receipt of the following financial support for the research, authorship, and/or publication of this article: This study was financially supported under the project with the code: VAST04.01/23-24 by the Vietnam Academy of Science and Technology.
Supplemental material
Supplemental material for this article is available online.
References
Supplementary Material
Please find the following supplemental material available below.
For Open Access articles published under a Creative Commons License, all supplemental material carries the same license as the article it is associated with.
For non-Open Access articles published, all supplemental material carries a non-exclusive license, and permission requests for re-use of supplemental material or any part of supplemental material shall be sent directly to the copyright owner as specified in the copyright notice associated with the article.