
Abstract
Activated carbon is produced from Burmese grapes using NaOH as the activator under microwave irradiation. Through scanning electron microscopy, Fourier-transform infrared spectroscopy, X-ray diffraction analysis, and Brunauer–Emmett–Teller analysis methods, the activated carbon material is found to have a rough and uneven surface with the formation of pores, an amorphous structure, and possesses hydroxy, C–H, carbonyl, alkene, and ether functional groups. The surface area (478.5 m2 g−1) and pore size (about 3.4 nm) are calculated from the adsorption N2 equation. The adsorption mechanism of activated carbon is evaluated and follows a pseudo-first-order kinetic model (large single adsorption) and the Langmuir isotherm model (physical interaction). The factors affecting ciprofloxacin adsorption using activated carbon derived from Burmese grapes are also evaluated and optimized by the response surface method model based on influencing factors including the contact time, the solution pH, the antibiotic concentration, and the material dosage. The optimal parameters are as follows: pH = 6.26, concentration = 58.9 mg L−1, content = 0.15 g L−1, time = 54 min. Under optimal conditions, the adsorption capacity predicted from the model is 191.33 mg g−1 with an efficiency of 41.35%.

Introduction
Recently, a very urgent issue that has received significant attention from scientists, government ministries, and seafood enterprises is the problem of antibiotic residues in shrimp products, and fish that exceed the allowable limit according to food hygiene and safety standards (Hazard Analysis and Critical Control Points—HACCP). On 9 June 2017, the Agro-Forestry-Fisheries Quality Assurance Department of the Ministry of Agriculture and Rural Development Country Vietnam received a letter from the US Food and Drug Administration (FDA) reporting concerns about antibiotic residues in seafood. Many drugs are used in livestock and aquaculture. 1 Of these, antibiotics are often used to prevent disease rather than cure it. 2 The widespread use of antibiotics can lead to an increase in the resistance of harmful bacteria to antibiotics.2,3 Their potential threat to human health has also been reported. 4 Initial reports reveal that antibiotics may have some adverse central nervous system (CNS) effects with symptoms of neurotoxicity, headaches, tremors, dizziness, and psychosis.5,6 In addition to limiting the use of antibiotics in aquaculture, the treatment of residues of these substances in the aquatic environment is an issue that needs much attention and research investment. To date, many methods, including photodegradation, adsorption, coagulation, and membrane filtration, have been investigated for the removal of antibiotic-based industrial pollutants.7 –12 To solve the above problems, scientists have developed many different solutions, of which the adsorption method is considered to be a highly effective method because it is simple and easy to use. Among the described methods, adsorption is the most favored for antibiotic removal due to the many advantages such as fast activity, high efficiency, and ease of handling. 13 Activated carbon (AC) is a typical porous material with an extremely diverse structure that can be used as an adsorbent and is an excellent candidate for use in removing antibiotics due to its high adsorption capacity.14,15
AC has been researched and synthesized from many different sources such as coal, agricultural by-products, bamboo, coconut, and wood. Utilizing agricultural by-products is one of the long-term sources of raw materials and increases the value of agricultural products, thereby avoiding negative impacts on the environment.16 –21 The Burmese grape (BG) tree is a species commonly found in the western or mountainous regions of Vietnam. BG has a fast growth rate and is adapted to the tropical conditions found in Vietnam. From August to September every year, the tree bears fruit. Fast-growing, durable plant varieties can be grown in all types of soil such as red basalt soil, loam soil, sandy soil, and the alluvial soil found in the Mekong Delta. 22 BG has large, round, long-chained, ripe fruits that are lemon yellow or green in color. The pulp of BG is milky yellow, sour, and slightly sweet. 23 Although it is easy to grow and affords large yields, the BG tree is rarely consumed and is only used in the field of medicine and pharmacy. AC has been synthesized by many methods including physical, chemical, and physicochemical activation.7,8,24 In Roy et al.’s 25 study, AC from blueberries was synthesized using the activator H3PO4. In Ehsanur’s research, AC from grape was synthesized by a microwave-assisted method. 26 In addition, the current microwave-assisted activation method utilizes microwaves to provide heat during the activation process. It can be seen that research on the production of AC from BG peel is quite limited. In this study, BG peel was used as the AC source, which is utilized for the removal of antibiotics.
Results and discussion
Preparation and characterization of AC
BG was synthesized into AC by microwave-assisted activation with NaOH. For suitable applications, the structural characteristics of AC have been analyzed in terms of morphology, structure, functional groups, surface area, and pores. Scanning electron microscopy (SEM) was used to determine the morphology of BG peel and activated carbon from Burmese grape (ACBG) peel (Figure 1). With a size of 10 µm, BG takes the form of stacked spheres. ACBG has a rough, uneven surface like a coral reef with the presence of pores. Pore formation is believed to be due to the evaporation of large volatile molecules during the NaOH activation process. 25 In Roy et al.’s 25 research, the holes on the surface of coal were mostly circular and elliptical following KOH activation. It can be seen that the shape of AC is partly based on the morphology of the material, and the creation of many pores will help the adsorption process.27,28
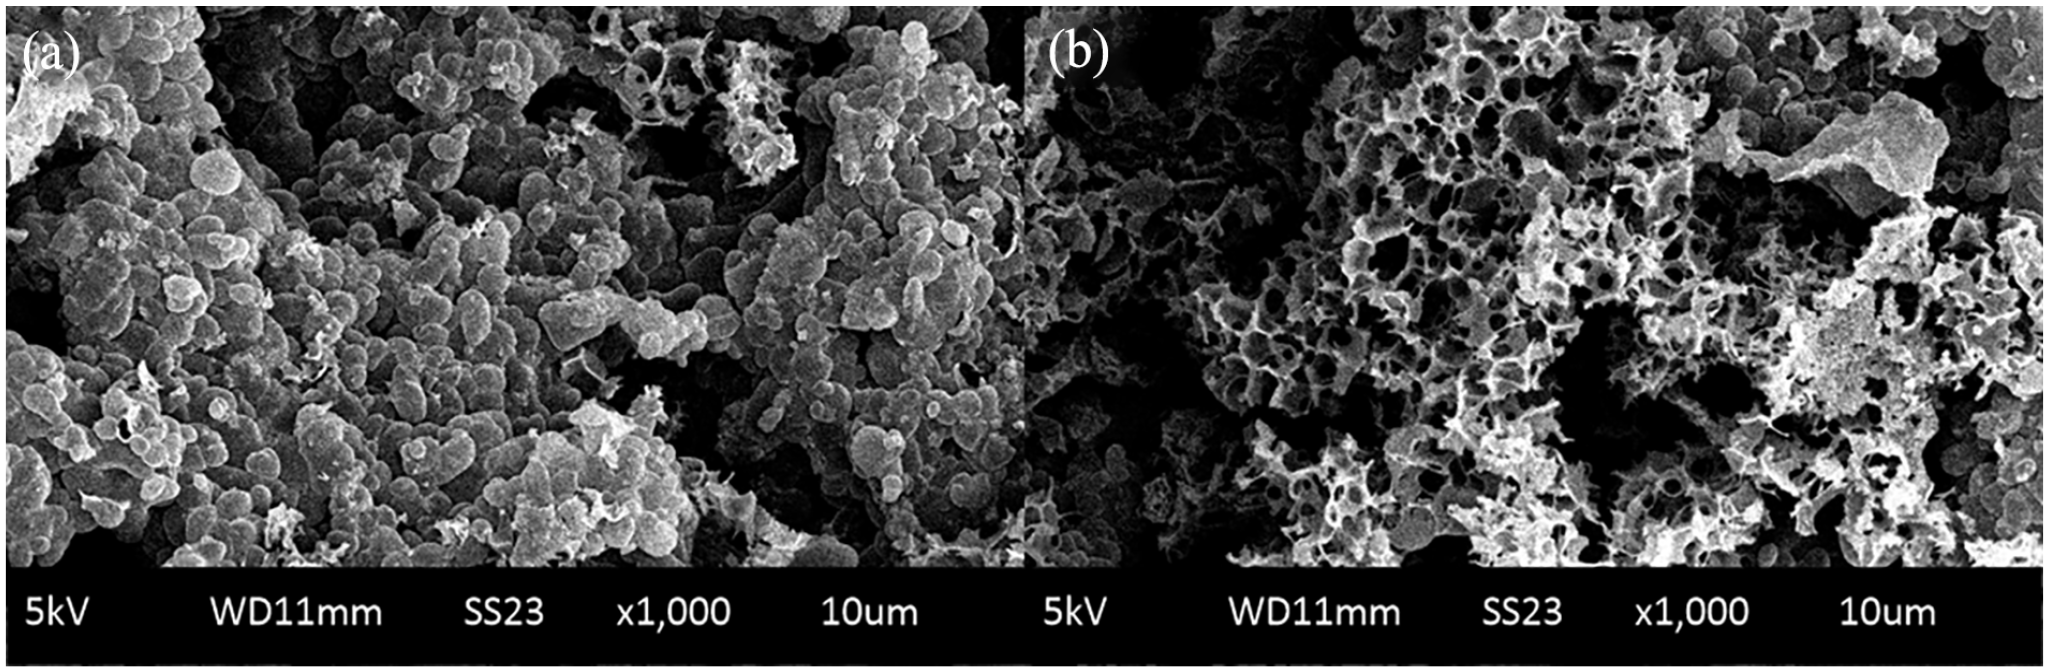
SEM images of BG (a) and ACBG (b) at a size of 10 μm.
The Brunauer–Emmett–Teller (BET) analysis was used to determine the pore size and the surface area of ACBG. The analytical results show that the ACBG has a specific surface area of 478.5581 m2 g−1, and an average adsorption pore diameter of 34,305 nm is considered to be a biochar. The nitrogen adsorption isotherm plot of ACBG is shown in Figure 2. The amount of adsorption increased markedly at P/Po value from 0 to 0.2 and from 0.8 to 1, which indicates the high porosity of the material. 29 The isotherm of the material in the range from 0.4 to 0.99 P/Po shows that it has a wide pore distribution. Materials tend to follow patterns II (adsorption isotherm) and III (desorption isotherm). The adsorption process is described by adsorption constants and adsorption energy parameters such as the maximum adsorption energy and the adsorption activation energy given by the International Union of Pure and Applied Chemistry (IUPAC). These results were similarly demonstrated in a study by Thommes et al. 30 Overall, this shows that ACBG has high porosity and possesses pores with large surface areas, which is beneficial for the adsorption of materials.

BET nitrogen adsorption isotherm plot.
The X-ray diffraction (XRD) analysis of the material is shown in Figure 3(a). There are two peaks with values of 2θ = 30o and 41o, which correspond to the (002) and (100) planes, respectively. The obtained diffraction peaks are indexed according to the corresponding peaks of the (002), (100), and (101) crystal planes of graphite.31,32 The diffraction patterns agree well with the standard JCPDS file (41–1487), which confirms the formation of the crystalline structure of graphite. 31 The peaks represent the structural features of AC, as demonstrated in the study of Kalyani and Anitha. 33 The absence of sharp peaks in AC indicates that it has an amorphous structure, which is a favorable property for the adsorbents evaluated in the study by Das and Samal. 34 The Fourier-transform infrared spectroscopy (FTIR) analysis is used to determine the nature of the functional groups on the surface of the AC and the spectrum is shown in Figure 3(b). The peaks at 3418 cm−1 are due to the stretching and bending vibrations of the O–H group corresponding to the free hydroxyl present on the surface of the material. 35 The formation of O–H bonds occurs during by the AC material activation process. 36 At the peaks at 2878 cm−1 is due to the vibration of the C-H group of the carboxyl present in the carbon chain of the material. 37 The peaks at 1705 cm−1 fluctuate strongly and correspond to the C=O group of the carboxyl. 38 The peaks at 1567 cm−1 correspond to the C=C bond of the alkene group in the benzene ring of the carbon chain. 39 The 1182 cm−1 peak corresponds to the stretching of the C–O bond of the carboxyl group in secondary alcohol compounds.35,39
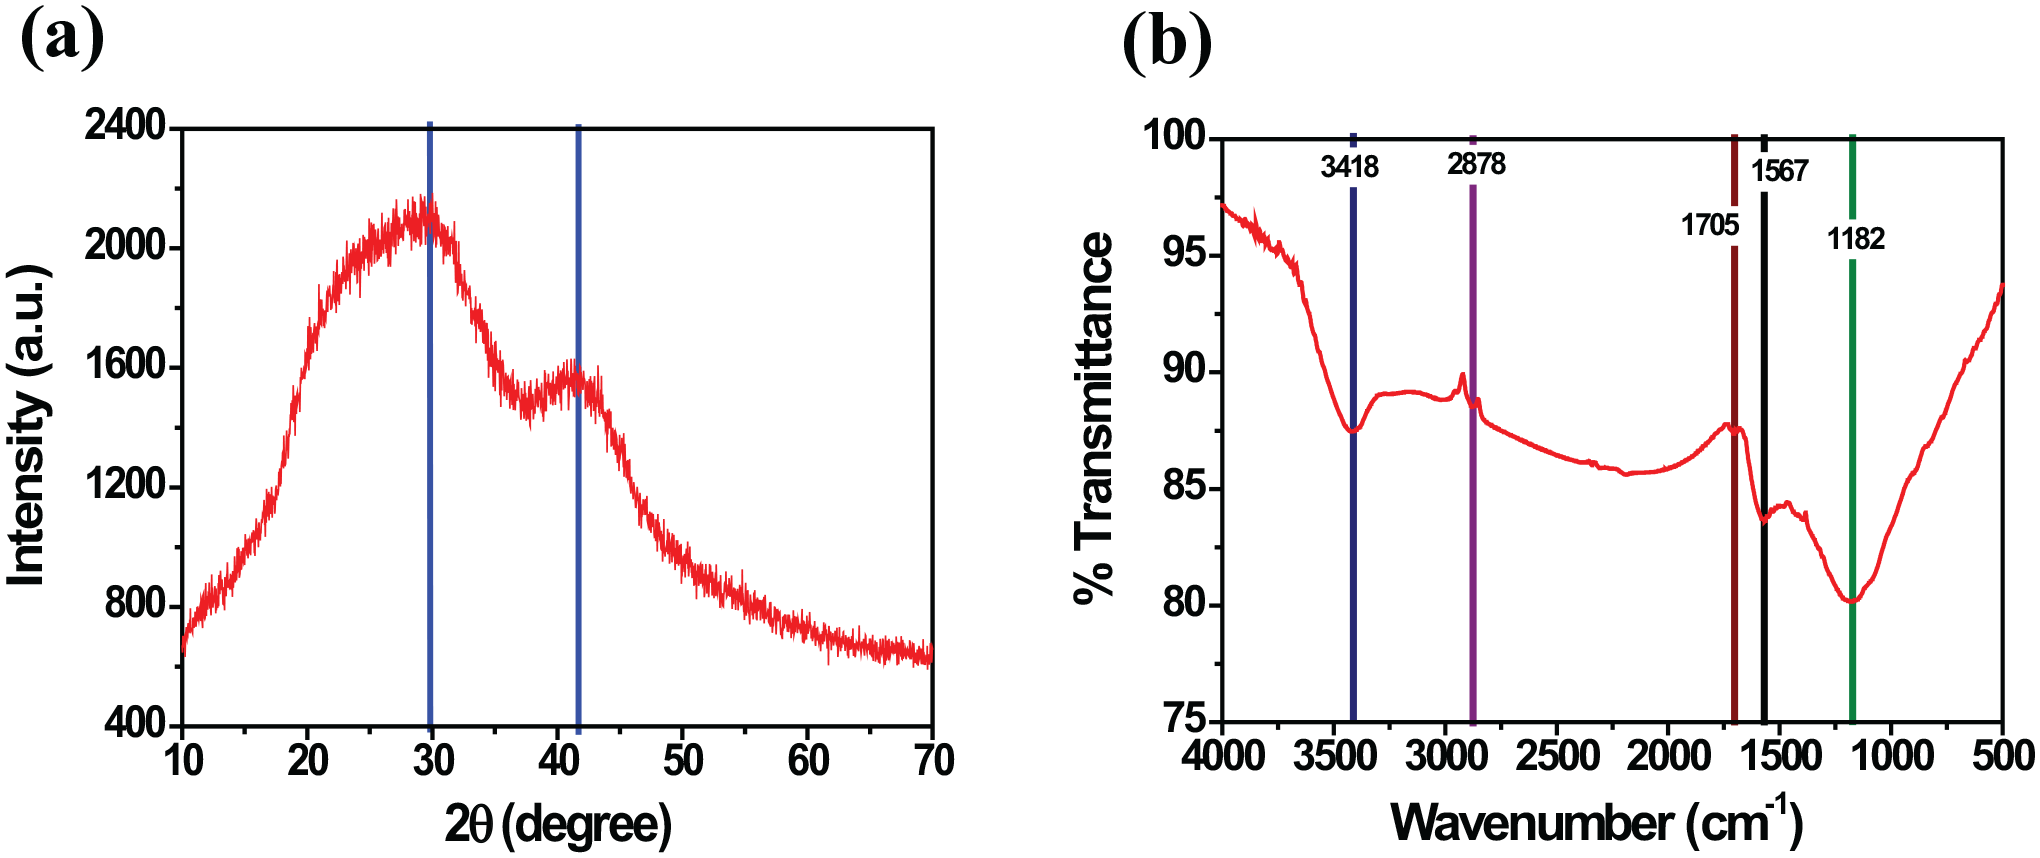
XRD pattern (a) and the FTIR spectrum (b) of ACBG.
Adsorption studies
The adsorption capacity was evaluated with four antibiotics: ciprofloxacin (CFX), chloramphenicol (CPC), tetracycline (TCC), and oxytetracycline (OTC). The results shown in Figure 4 show that the adsorption capacities of the material were 19.96 mg g−1 (TCC), 20.98 mg g−1 (CFX), 18.72 mg g−1 (CPC), and 18.24 mg g−1 (OTC). It can be seen that ACBG can adsorb the four different antibiotics with almost the same adsorption capacity. Among them, ACBG adsorbed CFX the best (adsorption capacity 20.98 mg g−1). Therefore, the antibiotic CFX was chosen to evaluate the predisposing factors and to optimize the response surface methodology (RSM) model.

Antibiotic adsorption by ACBG.
The predisposing factors to be evaluated include time, pH, temperature, concentration, and concentration of the CFX. The effect of the adsorption time on the adsorption capacity is shown in Figure 5(a). The results in the graph show that the adsorption capacity increased from 0 to 57.78 mg g−1 in the first time period from 0 to 60 min. The interval from 60 to 90 min showed that the adsorption capacity decreased from 57.78 to 47.12 mg g−1, while during the period time from 90 to 150 min, the adsorption capacity increased to 58.8 mg g−1. Finally, between 150 and 180 min, the adsorption capacity decreased to 50.33 mg g−1. It can be seen that after 60 min, a desorption process occurs, and then the adsorption continues. These processes tend to repeat many times. Therefore, an adsorption time of 60 min was selected to evaluate the remaining factors. The effect of the adsorption temperature is shown in Figure 5(b). With an adsorption time of 60 min, the results of the graph show that the adsorption capacity changed from 73.36 to 49.41 mg g−1 at temperatures of 30 and 40 °C. From 50 to 60 °C, the adsorption capacity decreased from 59.3 to 34.63 mg g−1. It can be seen that when the temperature is increased from 30 to 60 °C, the adsorption capacity decreases sharply (from 73.36 to 34.63 mg g−1). As the temperature increases, the adsorption rate also increases due to the faster motility of molecules in solution. However, when the temperature is too high, the mixing process takes place faster, causing the adsorption process to be hindered, which has also been demonstrated in the study of Mahmuda et al. 40 Overall, the results show that at 30 °C the adsorption capacity reached its highest value of 73.36 mg g−1; hence, an adsorption temperature of 30 °C was selected for further investigations.

Effect of the adsorption time (a) and temperature (b) on the adsorption capacity of ACBG.
One of the important parameters in adsorption studies is the solution pH, which is related to the surface charge of the adsorbent and the degree of ionization of CFX molecules.41,42 The results of studies on the effect of the solution pH on the adsorption capacity of ACBG are shown in Figure 6(b). It can be seen that the pH of the solution greatly affects the adsorption capacity of the materials. In the range from pH 2 to pH 6, the adsorption capacity increased sharply from 20.65 to 68.42 mg g−1, and in the range of pH 6 to pH 10, the adsorption capacity decreased to 51.14 mg g−1. To evaluate the influence of pH on the adsorption capacity, a pHpzc experiment was conducted. The results (Figure 6(a)) show that the ACBG material gives a pHpzc value of 4.1. However, the pH value for the highest adsorption capacity is pH 6 (68.42 mg g−1). This can be explained by the fact that because the surface of the material tends to be negatively charged, it will attract positively charged molecules. The pH of the solution represents a neutral environment with approximately equal proportions of positive and negative ions. When the negative ions interact with the surface charge of the material, causing charges of the same sign to repel each other, the disturbance of the solution increases. This makes it easier for the positive ions to interact and bond with the negative charges on the surface of the material. To explain the adsorption mechanism, the materials were evaluated by adsorption kinetic models, with pH 6 being selected as the optimum value for evaluating further experiments.
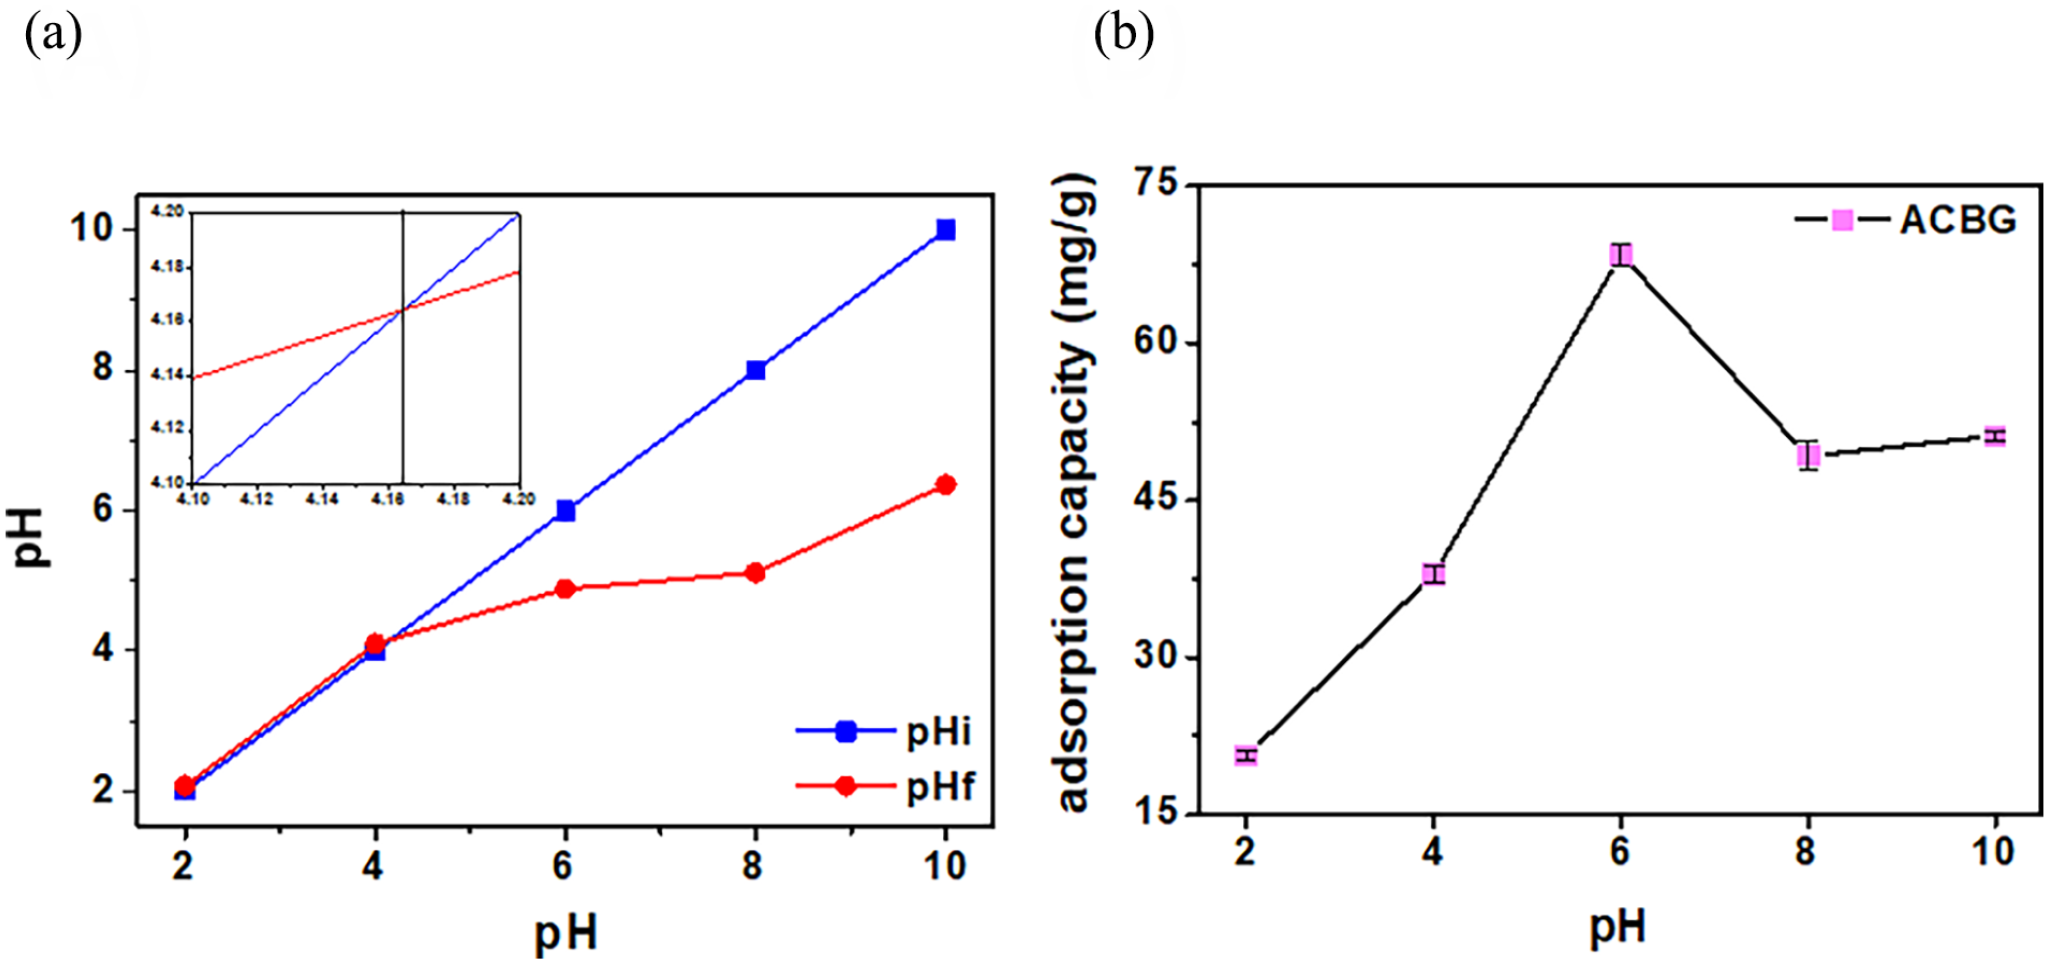
The pHpzc study of ACBG (a), and the effect of the pH (b) on the adsorption capacity of ACBG.
The effect of the ACBG dosage is shown in Figure 7(a). The process of evaluating the adsorption content is considered based on the adsorption efficiency because the formula for calculating the adsorption capacity is affected by the dosage of the AC material. With a dosage rate of 0.1 g L−1, the adsorption capacity and efficiency are shown to correspond to Q = 39.35 mg g−1 and H = 29.17%. With a dosage rate of 0.2 g L−1, the adsorption capacity and efficiency are shown to correspond to Q = 26.85 mg g−1 and H = 39.81%. With a dosage rate of 0.3 g L−1, the adsorption capacity and efficiency are shown to correspond to Q = 23.52 mg g−1 and H = 52.3%. With a dosage rate of 0.4 g L−1, the adsorption capacity and efficiency are shown to correspond to Q = 21.09 mg g−1 and H = 62.53%. Therefore, the selected adsorption concentration is 0.4 g L−1. The results of the concentration evaluation are shown in Figure 7(b) with concentration values from 0 to 100 mg L−1. In the concentration range of 0 to 60 mg L−1, the adsorption capacity increased from 0 to 128.33 mg g−1. When the concentration increased from 60 to 100 mg L−1, the adsorption capacity decreased to 101.22 mg g−1. The adsorption process reached an equilibrium value at a concentration of 60 mg L−1 (the adsorption capacity was 128.33 mg g−1). Hence, the optimum conditions for ACBG to give the highest adsorption capacity include a time of 60 min, pH 6, a dosage of 0.4 g L−1, a temperature of 30 °C, and a CFX concentration of 60 mg L−1. These parameters were subsequently used to evaluate adsorption kinetics and isotherms.
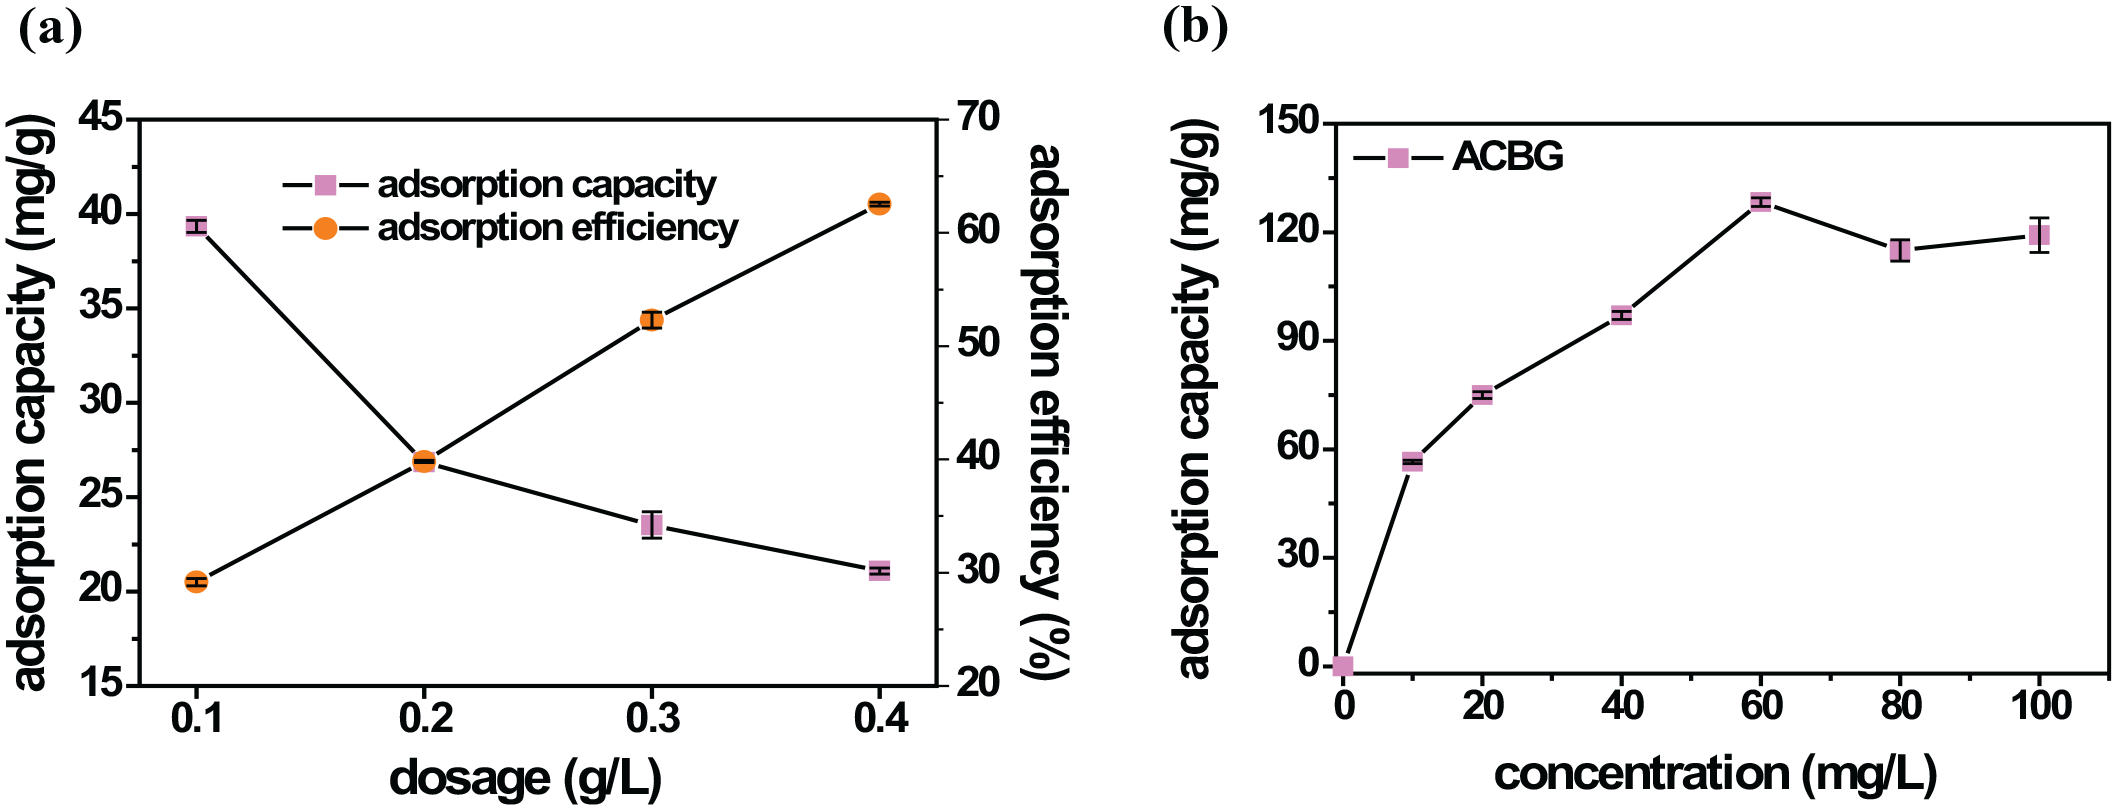
Effect of the dosage of ACBG (a) and the CFX concentration (b) on the adsorption capacity of ACBG.
Kinetic and isothermal models
The adsorption kinetic model is intended to predict the mechanisms of the adsorption process. Kinetic models (pseudo-first-order (PFO), pseudo-second-order (PSO), Elovich, and Bangham) were used, and the results are presented in Figure 8(a). The parameters of the adsorption kinetic model are presented in Table 1. The PFO kinetic model is consistent with the adsorption data for the AC material as demonstrated by the highest correlation coefficient (R2bib2 = 0.987). Besides, the adsorption capacity at equilibrium (qe) and the PFO kinetic rate constant (k1) are 51.79 mg g−1 and 0.099, respectively. The results show that the adsorption of CFX antibiotics on ACBG is mainly controlled by both physical and chemical processes in which the physical process is dominant. The adsorption process was also evaluated in the study of Roy et al. 25

Kinetic models (a) and isotherm models (b).
Kinetic and isothermal parameters for CFX adsorption on ACBG.
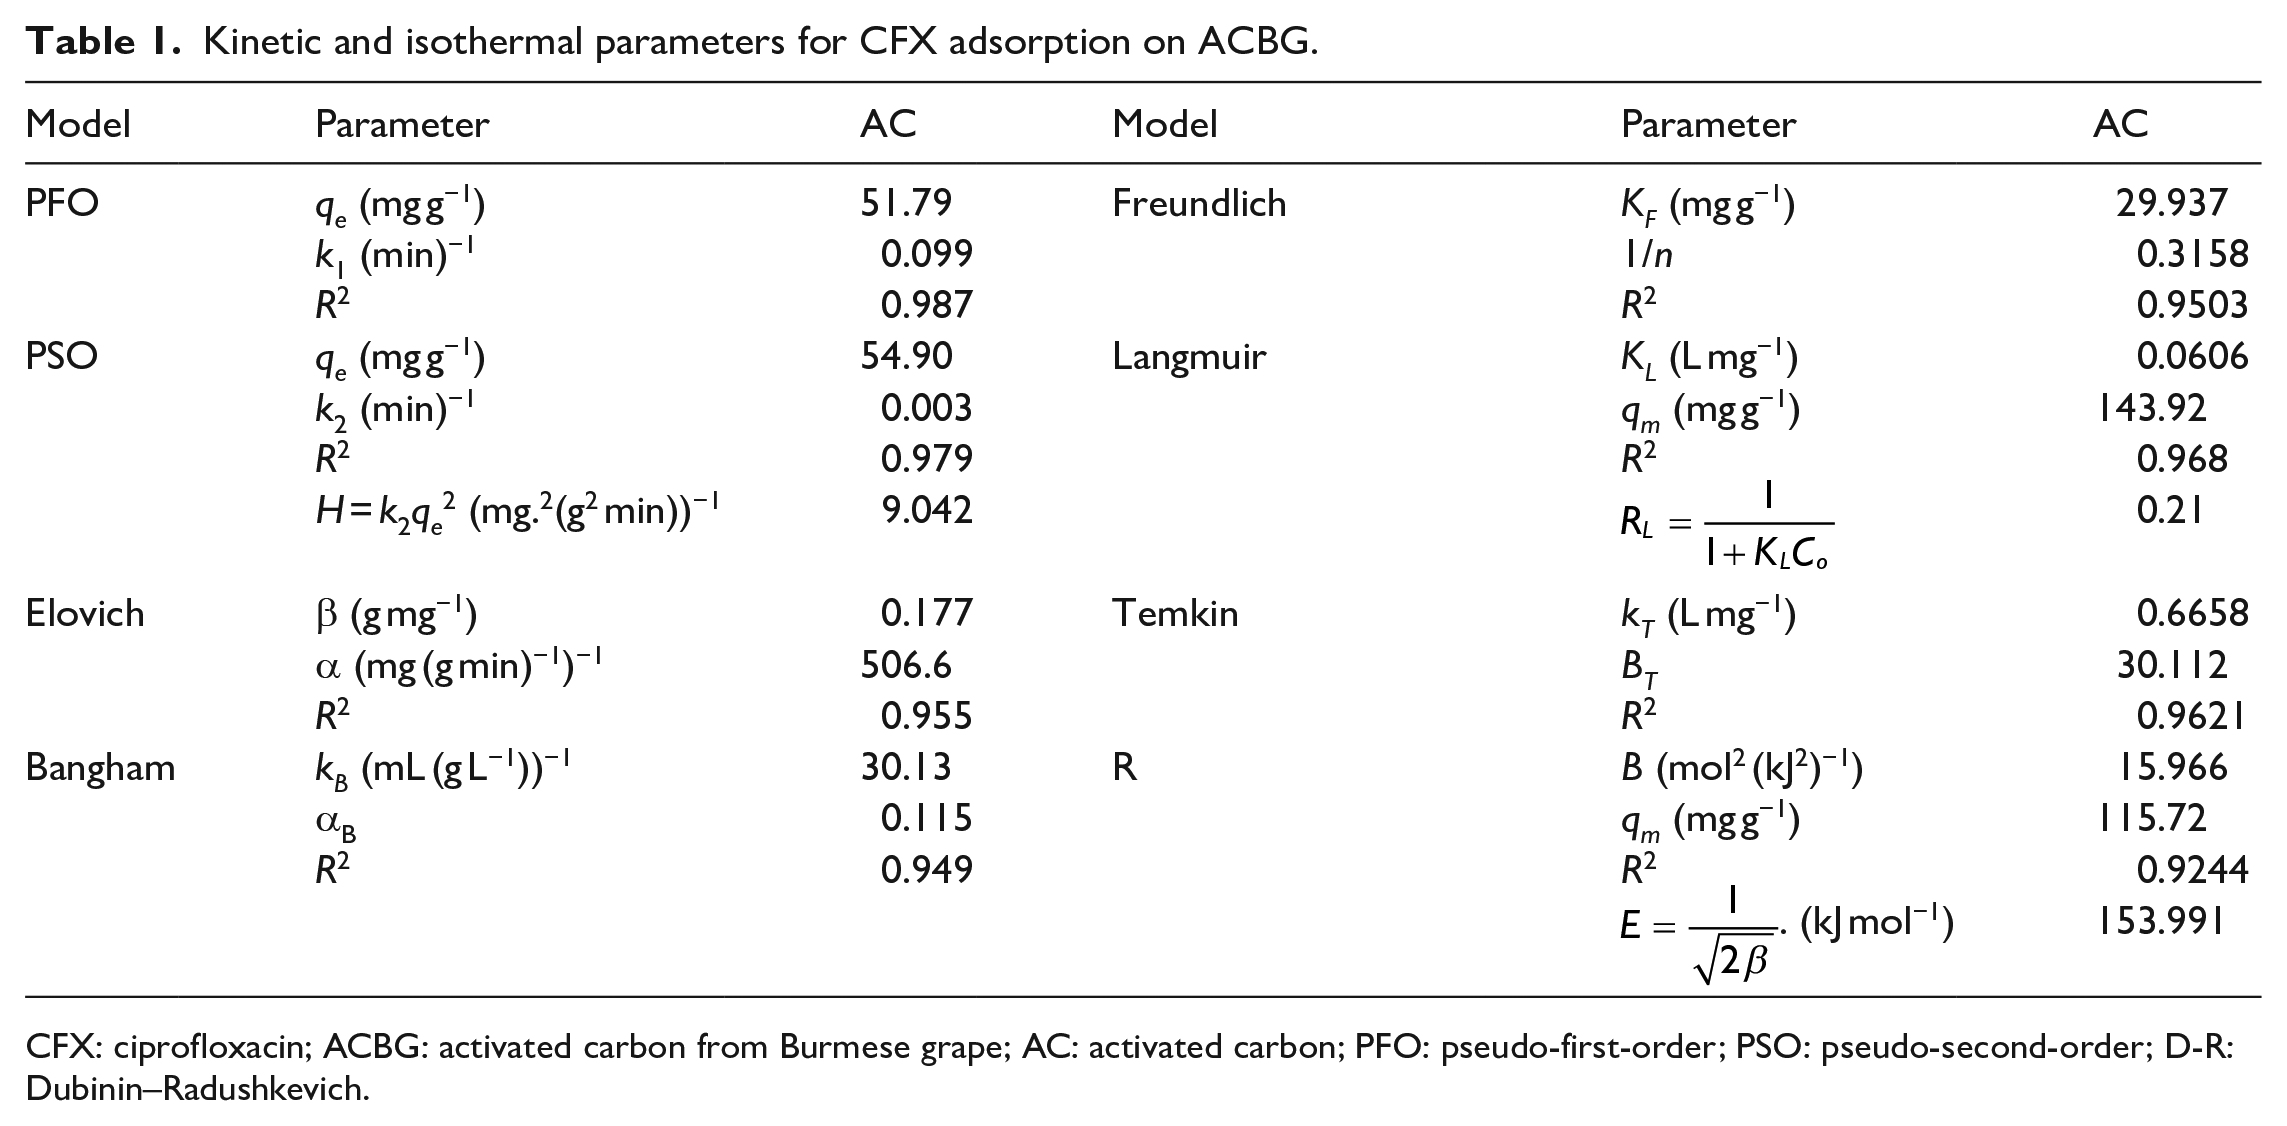
CFX: ciprofloxacin; ACBG: activated carbon from Burmese grape; AC: activated carbon; PFO: pseudo-first-order; PSO: pseudo-second-order; D-R: Dubinin–Radushkevich.
The adsorption isotherm model is intended to describe the adsorption process of the models. The Langmuir, Freundlich, Temkin, and Dubinin-Radushkevich (D–R) isotherms are shown in Figure 8(c). The parameters of the adsorption isotherm model are presented in Table 1. It can be seen that the Langmuir isotherm model is best described for CFX adsorption (R2 = 0.968), while the correlation coefficients from the Freundlich, Temkin, and D-R models are 0.95, 0.962, and 0.924 respectively. Besides, the values of maximum adsorption capacity per adsorbent mass (qm), and the Langmuir adsorption constant (kL) are 143.92 mg g−1 and 0.0606 L mg−1, respectively. The results show that the adsorption process of the material is monolayer and homogeneous. The adsorbed substances form a monomolecular layer, and adsorption can only occur at an equally defined number of fixed sites. The adsorption process was also evaluated and commented upon similarly in the study of Mirsoleimani-Azizi et al. 43
Possible adsorption mechanisms
Evaluation of the adsorption isotherms and kinetic models allowed predictions on the adsorption mechanism of ACBG and the results showed compliance with the PFO and Langmuir models for physical and monolayer adsorption, respectively. Besides, the PSO (chemical adsorption) and Temkin (diffusion processes) models also give high correlation coefficients, although they are not the main processes. In Mohammad’s study, CFX had two pKa of 5.9 and 8.9 with pH < 5.9 (positive charge—CFX is protonated and retains its positive charge) and pH > 8.9 (negative charge—CFX is deprotonated and retains its negative charge). 44 In the pH range 6–7, the drug CFX becomes uncharged with the strongest H-bonding occurring with the adsorbent surface. 44 FTIR results show that the free functional groups on the surface of the material can be O–H, C=C, C–O, C=O, and C–H groups. The controlling process is mainly physical adsorption on the monolayer surface via electrostatic interactions. At the same time, the hydrogen bonds act as a block of magnets that attract molecules of opposite or the same sign with greater electronegativity. In Maria’s study, AC was predicted to adsorb CFX with the mechanism of electrostatic interaction, O–H bonding, and dipole–dipole interaction. 41 In Roy et al.’s 25 study, AC was predicted to have mesopores size, H bonds, electrostatic interactions, and π–π conjugation of the surface functional groups and aromatic moieties of the biochar. As mentioned, the role of electrostatic attraction is not enough to explain the favorable adsorption capacity at different pH points. In summary, the reasonable mechanisms of pore filling, electrostatic interaction, H-bonding interaction, and π–π interaction can shed light on the CFX adsorption capacity of ACBG as shown in Figure 9.

Mechanism for adsorption of CFX antibiotic onto the ACBG.
RSM
From the RSM model, the residual plots include normal plots of residual, residual versus predicted and residual versus run plots (Figure 10). Figure 10(a) shows 30 experiments giving results using 30 different colored dots, ranging from 1% to 99%. In Figure 10(b), the residual versus predicted model fits well because the data are evenly distributed together on the line. In Figure 10(c), the residual versus run plots are randomly distributed and do not adhere to any model or trend.45,46

Graphs of the residual values of ACBG.
The quadratic equation describing the correlation between the response factor (y) and the independent variables is determined as follows

Data on the analysis of variance (ANOVA) values for the regression equations are presented in Table 2 and are used to determine if the quadratic model is sufficient to describe the actual results. The significance of the regression models is determined by the p- and F-values. In general, the smaller the p-value and the larger the F-value, the more they demonstrate the statistical significance of the model. The model is effective when p < 0.05, while the model is not effective when p > 0.05. A p-value of less than 0.05 shows the statistical significance of the effect factors (95% confidence level). The results of the ANOVA analysis showed that the model was statistically significant (p < 0.05). The factors with statistical significance (p < 0.05) are dosage, concentration, pH, and time. The significance of the regression models was determined and best evaluated by the coefficients: SSres (sum of squares of residuals), SSlof (sum of squares of lack of fit), SSE (sum of errors), MSE (mean squares of errors), and correlation coefficient (R2). Response models are considered statistically significant at 95% relevance of the following coefficients meet the requirements p < 0.05 and R2 > 0.9. The larger the correlation coefficient of ACBG, the more compatible the model is with the experiment (R2 = 0.996). In Thuan’s research, it is assumed that if R2 is greater than 0.80 and close to 1.00, then the model fits well with experimental data. 45 The coefficients SSres and SSlof are small, proving that the error from the experimental value and predicted value is very low and consistent with the model. The lack of fit value for the model is 20.18 (0.0012% chance that the lack of fit value of the model can be significantly inappropriate due to noise in the experiment), which confirms that the model predicting the ability of ACBG to eliminate CFX is appropriate.46,47
Variance and ANOVA of the model.
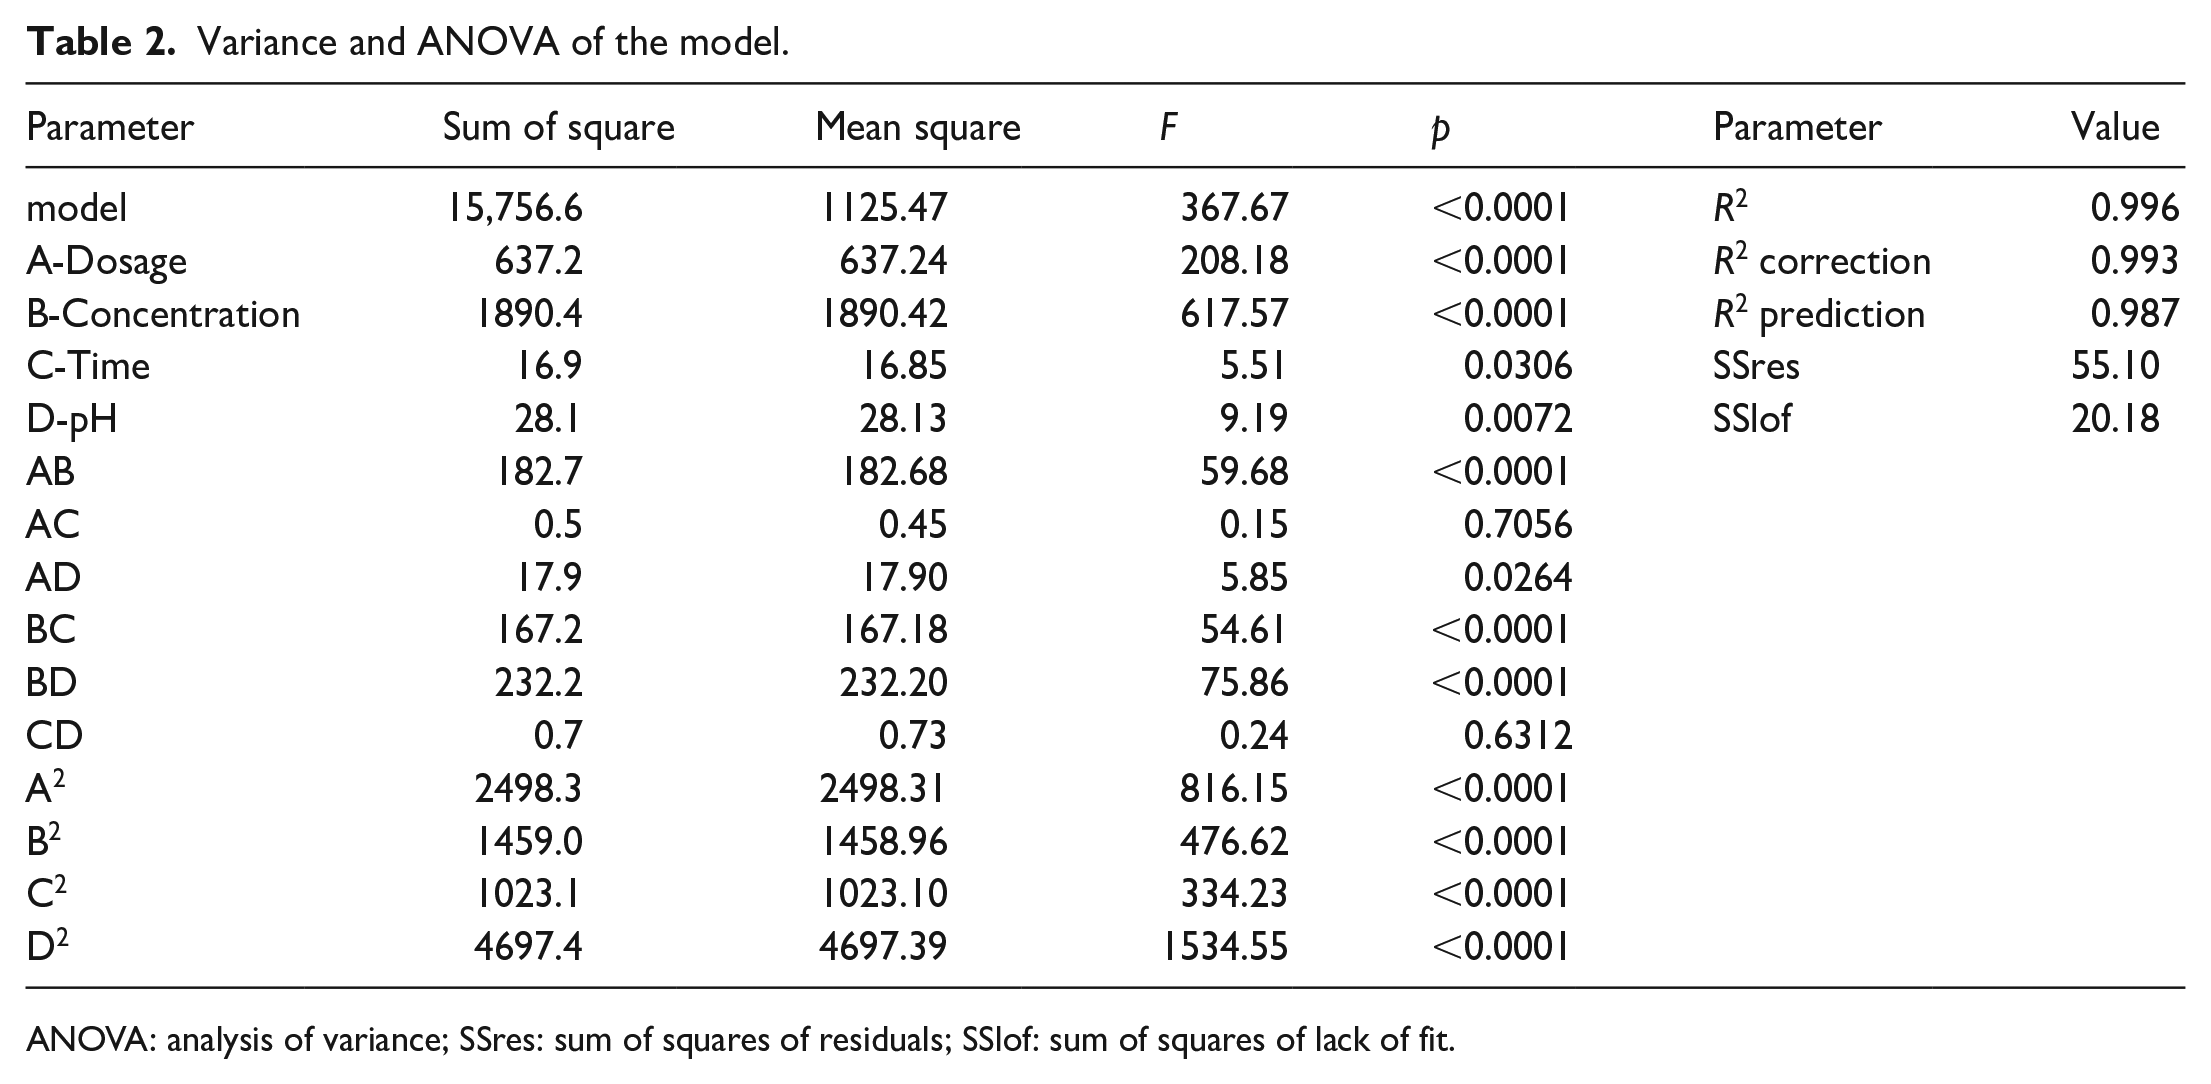
ANOVA: analysis of variance; SSres: sum of squares of residuals; SSlof: sum of squares of lack of fit.
The optimal value region of the model is shown in Figure 10. The red area indicates the highest CFX adsorption efficiency, and the blue area indicates the lowest. Correlation plots of concentration and dosage show that the optimal region is expressed between 20 and 40 mg L−1 and 0.14 to 0.2 g L−1, the optimal region is described, and correlation plots of concentration and concentration show that the optimal region is expressed between clearly shown in Figure 11(a). Looking at the correlation graph of time and concentration shows that the optimal region is represented between 55 and 65 min and 0.15 to 0.18 g L−1, the optimal region is described and expressed and clearly shown in Figure 11(b). Analyzing the correlation graph of pH and concentration shows that the optimal region is represented between pH 5.5 and pH 6.5 and 0.14–0.18 g L−1, with the optimal region being described and clearly shown in Figure 11(c). The correlation graph of time and concentration shows that the optimal region is shown between 50 and 80 min and 20–40 mg L−1; the optimal region is described and clearly shown in Figure 11(d). The correlation graph of pH and concentration shows that the optimal region is expressed between pH 5 and pH 8 and 20–40 mg L−1, with the optimal region being depicted and clearly shown in Figure 11(e). The correlation graph of pH and time shows that the optimal region is present between pH 5 and pH 7 and 50–70 min; the optimal region is depicted and clearly shown in Figure 11(f).

Line graphs showing the correlation between factors: (a) dosage and concentration, (b) dosage and time, (c) dosage and pH, (d) time and concentration, (e) concentration and pH, and (f) pH and time of ACBG.
The optimal values have been calculated and selected based on the optimal area from the influencing factors. In Figure 12, the optimal value of ACBG is clearly shown with the best values. The optimal value was recorded at pH 6.41, a concentration of 29.65 mg L−1, a dosage of 0.15 g L−1 and a time of 60 min. With optimal conditions, the adsorption capacity predicted from the model is expected to be 153.11 mg g−1 with an efficiency of 63.35%. The desired level = 1.0000 shows that all the tests at the given optimal conditions have a high fit for the proposed models with a 100% probability of achieving the response values. 45

Optimal values from the RSM models.
The optimal parameters from the model can predict the adsorption capacity of the material when applied in practice. Table 3 shows a comparison of ACBG with other types of AC. It can be seen that ACBG has superior CFX adsorption capacity compared to coal samples of different origins. In this work, the CFX adsorption capacity was relatively high at 153.11 mg g−1, compared with some previous works as reported in the literature.48 –51 This superiority is similar to Lemna minor plant and folium cycas AC.52,53
Comparison of ACBG’s adsorption capacities for different activated carbons to remove CFX.

ACBG: activated carbon from Burmese grape peel; CFX: ciprofloxacin; AC: activated carbon.
Conclusion
In this study, BG was utilized to synthesize AC by microwave-assisted activation with NaOH. The preponed ACBG was shaped like coral reefs, with an amorphous structure and mainly with O–H, C–H, C=O, C=C, and C–O functional groups. The synthesis showed pore formation with a surface area of 478.5 and a pore size of about 3.4 nm. The potential application of ACBG was also evaluated for CFX removal. Factors affecting the removal process were considered such as the time, the solution pH, the temperature, the ACBG dosage, and the CFX concentration. The adsorption process has also been predicted and described through adsorption kinetic and isothermal models. The results show that ACBG follows the PFO kinetics model and the Langmuir isotherm model with a monolayer adsorption mechanism with physical interactions. During the evaluation process, it was observed that the factors of CFX concentration, time, ACBG dosage, and pH of the solution have a certain influence on CFX removal. Therefore, the factors were optimized using the RSM model. The model shows a high correlation between the experimental and predicted values when R2 = 0.996 and R2 correction = 0.993. Most factors show their influence on the model when p < 0.05. The optimal parameters were calculated from the model and recorded at a pH of 6.26, a concentration of 58.9 mg L−1, a dosage of 0.15 g L−1, and a time of 54 min. With optimal conditions, the adsorption capacity predicted from the model is determined to be 191.33 mg g−1 with an efficiency of 41.35%. With its high removal ability, ACBG is a potential material for practical applications and is preponed via a simple, fast, and cost-effective process.
Experimental
Pretreatment and chemicals
CFX, CPC, TCC, and OTC were obtained from Sigma (US). Ethanol (purity ⩾ 95%) and sodium hydroxide (NaOH) were supplied from Xilong Science Co., Ltd (China). BG peels were collected in Tien Giang Province, Vietnam. BG peel is removed from the damaged part and rinsed with water to remove dirt. BG was dried at 70 °C for 24 h to completely dry the shell sample. After drying, BG is ground into powder and stored in a desiccator before synthesizing AC.
Preparation of AC
NaOH was used to activate the raw materials as the chemical activation method and as shown in Figure 13.55 –57 50 g of BG was soaked with 100 mL of concentrated NaOH solution (5 g/100 mL) for 2 h. The mixture was dried at 100 °C for 24 h to remove water before activation. Then, the mixture was heated with the help of microwaves at a power of 600 W for 2 min. After activation, the AC products were washed several times with HCl (1M) and distilled water to remove residual NaOH in the sample. Washing was terminated until the constant pH. Finally, the ACBG was dried at 110 °C for 24 h and stored in a desiccator for later use in the experiment.

Activated carbon synthesis from Burmese grape.
Characterization
An SEM was used to investigate the morphology of AC (S4800, Japan). A Nicolet 6700 spectrometer (FTIR) was used to obtain the IR spectrum and identify the surface functional groups in the range of 4000–400 cm−1 (KBr). XRD patterns were obtained using a Siemens D5000 diffractometer at a scan rate of 2 °min−1 (2θ) with CuK (1.5406 Å) radiation. A micromeritics 2020 volume analyzer system was used to capture N2 by adsorption/desorption with 1 g (cm3)−1 degas at 150 °C over 12 h, and the isothermal equation was used to measure the surface area (BET theory). A UV-Vis spectrophotometer (Shimadzu-1601 PC spectrophotometer) was used to analyze the concentration of CFX in the water sample.
Adsorption experiment
The adsorption conditions are selected as follows: time (from 10 to 240 min), dosage of ACBG (from 0.1 to 0.4 g L−1), temperature (from 30 to 60 °C), antibiotic concentration (from 10 to 100 mg L−1), and pH (from pH 2 to pH 10). The sample was prepared in a 250-mL Erlenmeyer flask with the adsorption conditions fixed. 48 The experimental was run on a shaker set at 200 r/min. After the selected time, take the sample was filtered and the UV-Vis spectrum was recorded. The selectivity results were determined based on the adsorption capacity of the AC material for the test antibiotics. Factors such as adsorption time, solution pH, adsorbent content, temperature, and initial concentration were investigated to evaluate the adsorption capacity and efficiency. The adsorption capacity of the material (mg g−1) and the adsorption efficiency (%) were calculated according to the following formula

where qe is the adsorption capacity (mg g−1); Co is the initial antibiotic concentration (mg L−1); Cf is the antibiotic concentration after adsorption (mg L−1); dosC is the adsorbent dosage (g L−1); W is the mass of the adsorbent (g); and V is the volume of the solution (L)
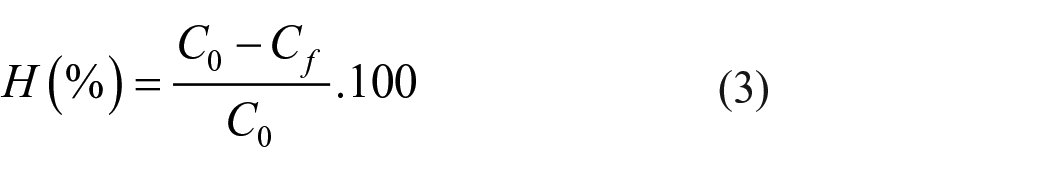
where H is the adsorption efficiency (%); Co is the initial antibiotic concentration (mg L−1); and Cf is the antibiotic concentration after adsorption (mg L−1).
The acids/bases surface and zeta potential measurement (pHpzc)
The pHpzc value was measured using the method reported by Lalhmunsiama and Tiwari, 58 with minor modifications. First, 0.1 g of the AC material was added to Erlenmeyer flask containing 100 mL of 0.1 mol L−1 KCl at initial pH values (pHi) ranging from 2 to 10. For stabilization, the mixture was shaken for 24 h at room temperature. Then, the AC samples were separated from the mixture and the pH value of the final solution (pHf) was measured with a pH meter. The pHpzc value was determined at pHi = pHf in the plot of the final pH value against the initial pH value by measuring the angle formed between the solid–liquid surface. 59
Adsorption kinetics
The adsorption kinetic model was used to assume the adsorption mechanism and reaction rate of the CFX adsorption AC process.27,60 The experimental data were described based on kinetic models including Elovich, Bangham, PFO, and PSO in the following nonlinear forms


where qt (mg/g) is the adsorption capacity of the adsorbent at time t, β is the desorption rate, α is the rate of chemical absorption, kB and αB are the Bangham constants, k1 (1−1 min) and k2 (g (mg min))−1 are the rate constants of the PFO and the PSO models, and qe (mg−1 g) is the adsorption capacity at equilibrium.
Adsorption equilibrium isotherm
The adsorption isotherm represents the basis for considering the interaction between adsorbents and adsorbents in gas/liquid/solid interfaces.27,60 This can indicate that the important parameters related to the adsorption mechanisms and the adsorption processes are provided by the adsorption isotherms. The advantages and behavior of adsorption processes were precisely described by isothermal models such as Langmuir, Freundlich, Temkin, and Dubinin-Radushkevich (D–R). Models were calculated using the following formula


where Ce (mg L−1) is the amount of dye remaining at equilibrium, qm (mg g−1) and qe (mg g−1) are the adsorption contents at maximum and the time of equilibrium in 1 g adsorbent, KL (L mg−1) is the Langmuir constant, and RL is the dissociation coefficient (RL > 1 (unfavorable), RL = 1 (linear), 0 < RL < 1 (favorable) and RL = 0 (not reversed)). In the Freundlich equation, the Freundlich constant and the adsorption intensity are Kf ((mg g−1).(L mg−1)n) and 1/n with n < 1 (one-layer adsorption) and n > 1 (multi-layer adsorption). In the Temkin equation, the relation to the equilibrium link has the isotherm Temkin constant (Kt, L g−1); the correlation coefficients with adsorption heat and isothermal constants are Bt and b (L mol−1). In the D-R equation, e (kJ mol−1) is the adsorption energy, and ε is the Polanyi potentiality (Mol 2 /kJ) 2 is the D-R constant.
RSM
The RSM model was used to optimize the CFX adsorption on ACBG with the parameters for the adsorption process. We used Design-Expert software (version 11, State Ease, MN, USA) for statistical analysis by applying the Box–Behnken design (BBD) model. To achieve a suitable assessment, appropriate adsorption conditions are selected to evaluate the RSM model. These include time, pH, concentration, and content.46,47 The parameters of the factors are designed using the BBD model with three levels: central variable (0), low level (−1), high level (+1), and they are shown in Table 4. 61 ANOVA of the quadratic linear regression model was used to analyze the influence of the input, and output variables as well as the correlation of response functions and independent variables. 62 The total number of experiments of the BBD matrix is calculated from the formula
Matrix of independent variables and levels.
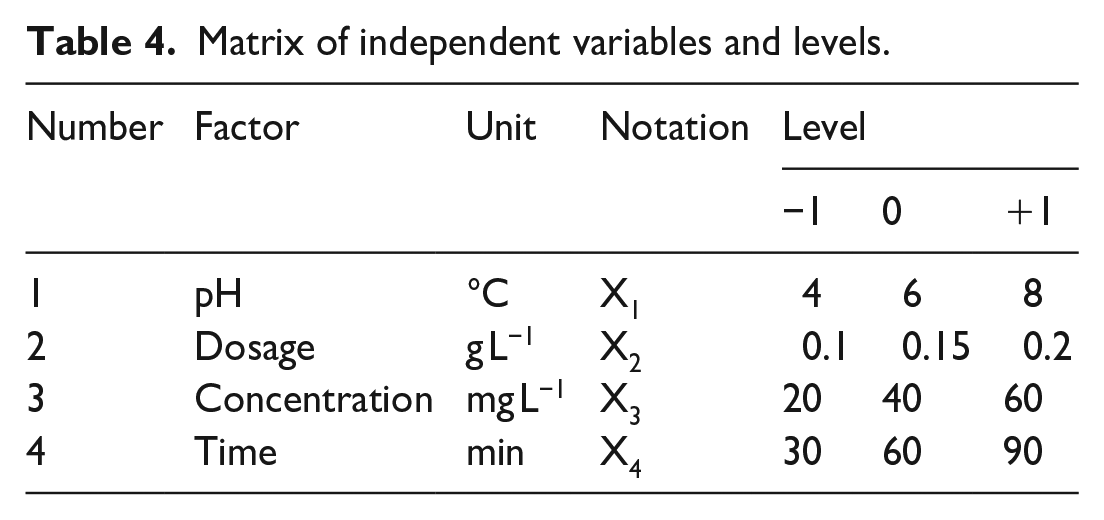

where k is the number of independent variables; N is the total number of experiments; and c is the number of times the central experiment is repeated.
From the best adsorption conditions, the RSM model is built based on the central and boundary values. Based on BBD, the experimental results for evaluating the CFX adsorption efficiency of the material samples are presented in Table 5. From the RSM matrix, a total of 30 experiments were performed.
Table of BBD values of 30 independent experiments.

Footnotes
Author contributions
N.B.H. and H.L.Q. contributed to original draft preparation. N.V.P. and L.V.T. contributed to data curation. N.V.P. and H.L.Q. contributed to methodology. T.T.T. and H.N.B. contributed to review and editing. All authors have assented to the published version of the manuscript.
Declaration of conflicting interests
The author(s) declared no potential conflicts of interest with respect to the research, authorship, and/or publication of this article.
Funding
The author(s) disclosed receipt of the following financial support for the research, authorship, and/or publication of this article: This research was funded by Nguyen Tat Thanh University, Ho Chi Minh City, Vietnam with code (2023.01.124/HĐ-KHCN).