
Abstract
In this present work, an attempt has been made to develop a more accurate surface roughness prediction model using response surface methodology based on center composite rotatable design with Box–Cox transformation in turning of AISI 1019 steel. The analysis has been carried out in three stages. In the first stage, a quadratic model has been developed in terms of feed, speed, depth of cut and nose radius. In the second stage, an improved prediction model has been developed by improving the normality, linearity and homogeneity of the data using a Box–Cox transformation. This improved model has been found to yield good prediction accuracy when compared to the previous one. In the third stage, confirmation experiments have been carried out, which clearly show that the Box–Cox transformation has a strong potential to improve the prediction capability of empirical models. An attempt has also been made to investigate the influence of cutting parameters on surface roughness. The result shows that the feed is the main influencing factor on the surface roughness while the depth of cut has no significant influence.
Introduction
Machinability of a material indicates its adaptability to be manufactured by a machining process. Generally, better machinability refers to an optimal combination of factors such as low cutting force, high material removal rate, good surface finish, accurate workpiece geometrical characteristics of the workplace and low tool wear rate. 1
Among the these factors, surface finish is the one of the critical performance parameter that has an appreciable effect on several mechanical properties of machined parts such as fatigue behavior, corrosion resistance and creep life. It also affects other functional attributes of machined parts like friction, wear, light reflection, heat transmission, lubrication and electrical conductivity. 1 Hence, achieving the desired surface quality is of great importance for the functional behavior of the mechanical parts. 2
The surface finish of the machined parts is greatly influenced by the machining conditions such as feed rate, cutting speed, depth of cut, nose radius, tool angles, tool material, chip formation, workpiece material, tool wear and vibration during cutting. 3 Among the various machining conditions, the feed, speed and depth of cut are the main parameters that affect the surface roughness. These three are the primary parameters governing the performance of any basic machining operation. The machine operator has complete control over these parameters. Other factors such as kind of material, type of tool, tool angles, acceleration and vibrations are also expected to influence the performance, but these are difficult to be controlled by an operator, right at the machine.
These machining parameters during cutting should be selected to optimize the surface finish of the workpieces. Manufacturing units have long depended on the skill and experience of machine-tool operators for the optimal selection of cutting conditions. Due to inadequate knowledge of the complexity and factors affecting the surface finish, an improper decision may cause high production costs and low surface finish. To overcome these problems, the researchers extensively used statistical design of experiments to investigate the machinability of materials.4–11
Choudhury and Ei-Baradie 12 investigated the effects of cutting parameters on the surface roughness and tool life in turning of EN24T steel using response surface methodology (RSM) combine with factorial design. Escalona and Cassier 13 experimentally investigate the effect of cutting parameters on surface roughness in turning operation. The experiments have been carried out on AISI 1020, AISI 1045 and AISI 4140 steel using carbide inserts. The first-order mathematical models in terms of speed, feed depth of cut and nose radius have also been developed using regression analysis for each steel. The results revealed that surface roughness increases with increase in feed rate while decreases with increase in speed and nose radius. Davim 14 employed Taguchi methodology to establish a correlation between cutting parameters (cutting velocity, feed and depth of cut) and responses (average surface roughness and maximum peak-to-valley height) in turning of free machining steel. The result shows that cutting speed has been found most significant variable followed by the feed, and depth of cut has no significant effect on the roughness. Suresh et al. 15 developed surface roughness prediction model using RSM in turning of mild steel. For the experimentation plan, three-level, four-factor design has been adopted. The first-order surface roughness prediction model has been developed in terms of speed, feed depth of cut and nose radius. An attempt has also been made to optimize the surface roughness prediction model using genetic algorithms (GAs). Sahin and Motorcu 16 used RSM to develop surface roughness prediction models in turning of mild steel (AISI 1040). The first-order and second-order prediction models have been developed in terms of feed, speed and depth of cut. They concluded that surface roughness increased with increasing the feed rate but decreased with increasing the cutting speed and the depth of cut. Singh and Rao 17 established surface roughness prediction model using RSM in hard turning of the bearing steel (AISI 52100) with mixed ceramic inserts. Results indicated that the feed is the dominant factor affecting the surface roughness, followed by the nose radius, cutting velocity and effective rake angle. Nalbant et al. 18 optimized cutting parameters (feed, depth of cut and nose radius) for minimum surface roughness in turning of AISI 1030 carbon steel using the L9 orthogonal array–based Taguchi methodology. The authors concluded that nose radius has most significant effect on surface roughness followed by feed and depth of cut. Bhattacharya et al. 19 used L16 orthogonal array–based Taguchi approach, to optimize the machining parameters in turning of AISI 1045 steel. The speed, feed and depth of cut have been considered as machining parameters while surface roughness parameters and power consumption have been considered as response. The results show that cutting speed has been found most significant parameter that affects the surface roughness (Ra) followed by feed and depth of cut. For power consumption, once again cutting speed has been found to be the most significant parameter followed by depth of cut. Suhail et al. 20 used Taguchi methodology to optimize the machining parameters in turning of AISI 1020 steel. The cutting speed, feed and depth of cut have been considered as machining parameters, while surface roughness (Ra) and workpiece temperature have been considered as response. The experiments have been designed on the basis of L9 orthogonal approach. The results revealed that for minimum surface roughness, optimum combination is achieved at highest level of cutting speed, lowest level of feed and highest level of depth of cut. Chavoshi and Tajdari 21 studied the effect of workpiece hardness and spindle speed on surface roughness (Ra) in turning of AISI 4140. A multiple regression analysis has been carried out to develop surface roughness prediction model. In addition to this, a prediction model using artificial neural network (ANN) has also been developed. The predicted surface roughness using both models has been compared with the experimental data, which shows the preference of ANN in prediction of surface roughness. Finally, a reverse ANN model has been constructed to estimate the hardness and spindle speed from surface roughness values. The result indicates that the reverse ANN model did not have acceptable prediction accuracy. Eli et al. 22 investigated the influence of tool geometry on the surface finish (Ra) in turning of AISI 1040 steel using RSM. The experiments have been carried out according to L27 orthogonal array–based Taguchi design. The surface roughness prediction model has been developed in terms of nose radius, approach angle and rake angle. The results indicate that the tool nose radius has been found to be the most dominant factor that affects the surface roughness followed by approach angle and rake angle. In addition, a good agreement between the predicted and measured surface roughness values has been found.
The AISI 1019 carbon steel is widely used as a common engineering material in various industries such as automotive industries, aerospace and aircraft industries where superior machinability is the most important factor. The literature reveals that the earlier work reported on this material or other similar materials is very limited. In general, the authors performed experimental study and obtained optimal combination of machining parameters (speed, feed and depth of cut) or at the most obtained the first-order surface roughness prediction model representing only the linear relationship. Thus, the research work for machining on AISI 1019 needs to be strengthened.
In the present work, the effect of machining parameters (cutting speed, feed, depth of cut and nose radius of cutting insert) on surface roughness in turning of AISI 1019 steel has been studied. The RSM based on center composite rotatable design (CCRD) has been employed to develop quadratic surface roughness prediction model and to identify the most significant machining parameter that affects the surface roughness. To increase the accuracy of the analysis (prediction model, significant effect of parameters or combination of parameters), the Box–Cox transformation has been used. The error analysis has also been carried out to study the improvement in the prediction models.
Turning experiments
Test specimens
The material used in the experiment is AISI 1019 steel in the form of round bar of dimensions of Ø
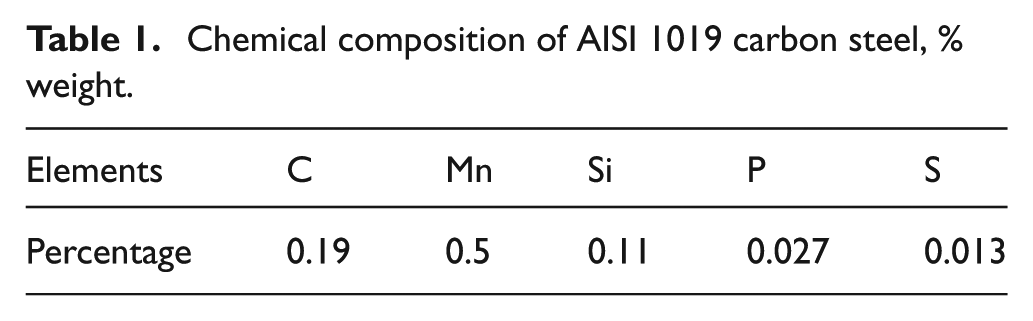
Chemical composition of AISI 1019 carbon steel, % weight.
Tools and equipment
To evaluate the effects of insert radius and cutting parameters on surface roughness, the turning experiments were carried out on a Super Jobber computer numerical control (CNC) lathe. The lathe equipped with continuously variable spindle speed from 50 to 3500 r/min and 20 kW motor drive was used for machining experiment. The cutting inserts used for the turning of AISI 1019 steel bars were DNMG 150604EN-TMF (55° rhombus-shaped insert with 0.4 mm nose radius) and DNMG 150608EN-TMF (55° rhombus-shaped insert with 0.8 mm nose radius) manufactured by Ceratizit. The TMF designation indicates that it has a chip breaker for medium to finish cutting with stable cutting edge style. Both the coated carbide inserts are designated by this CTC1135 grade.
Cutting parameters and their levels
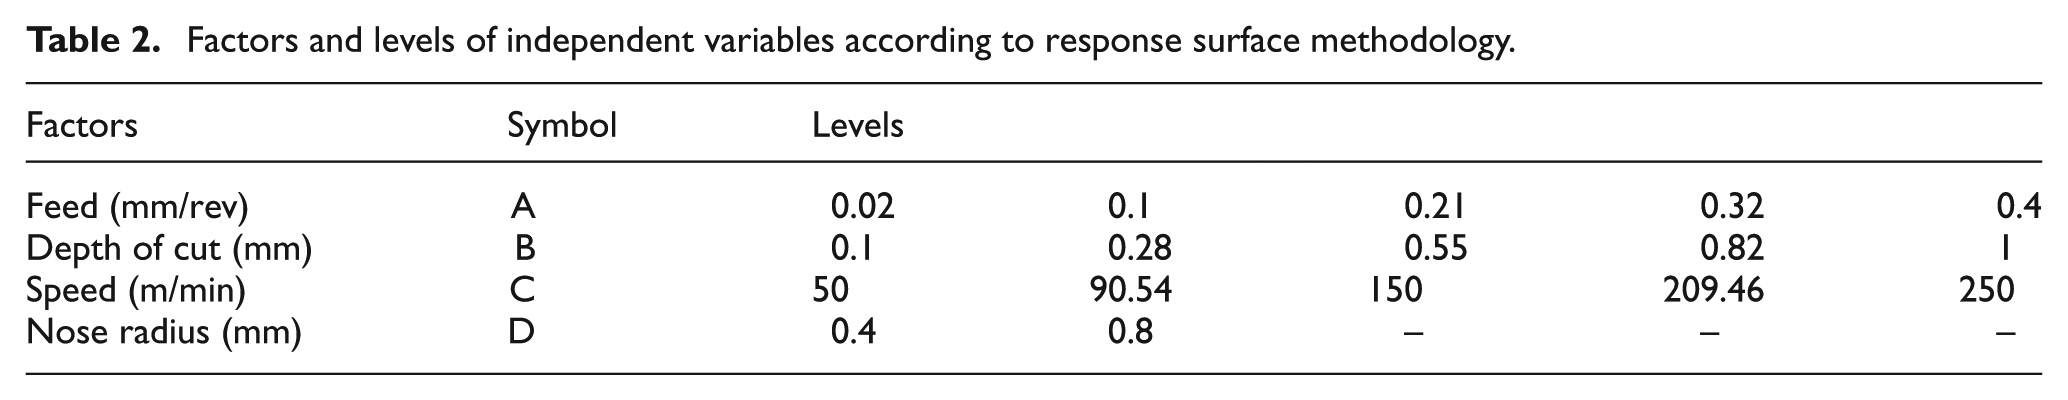
A common method of evaluating machining performance in a turning operation is based on the surface roughness. Proper selection of the cutting parameters (feed, speed, depth of cut and nose radius) can yield better surface finish. Optimization of these cutting parameters based on the parameter design (level of factors) of the RSM is adopted in this study to improve surface finish in turning operation. The design factors and their levels are shown in Table 2.
Factors and levels of independent variables according to response surface methodology.
Design of experiment
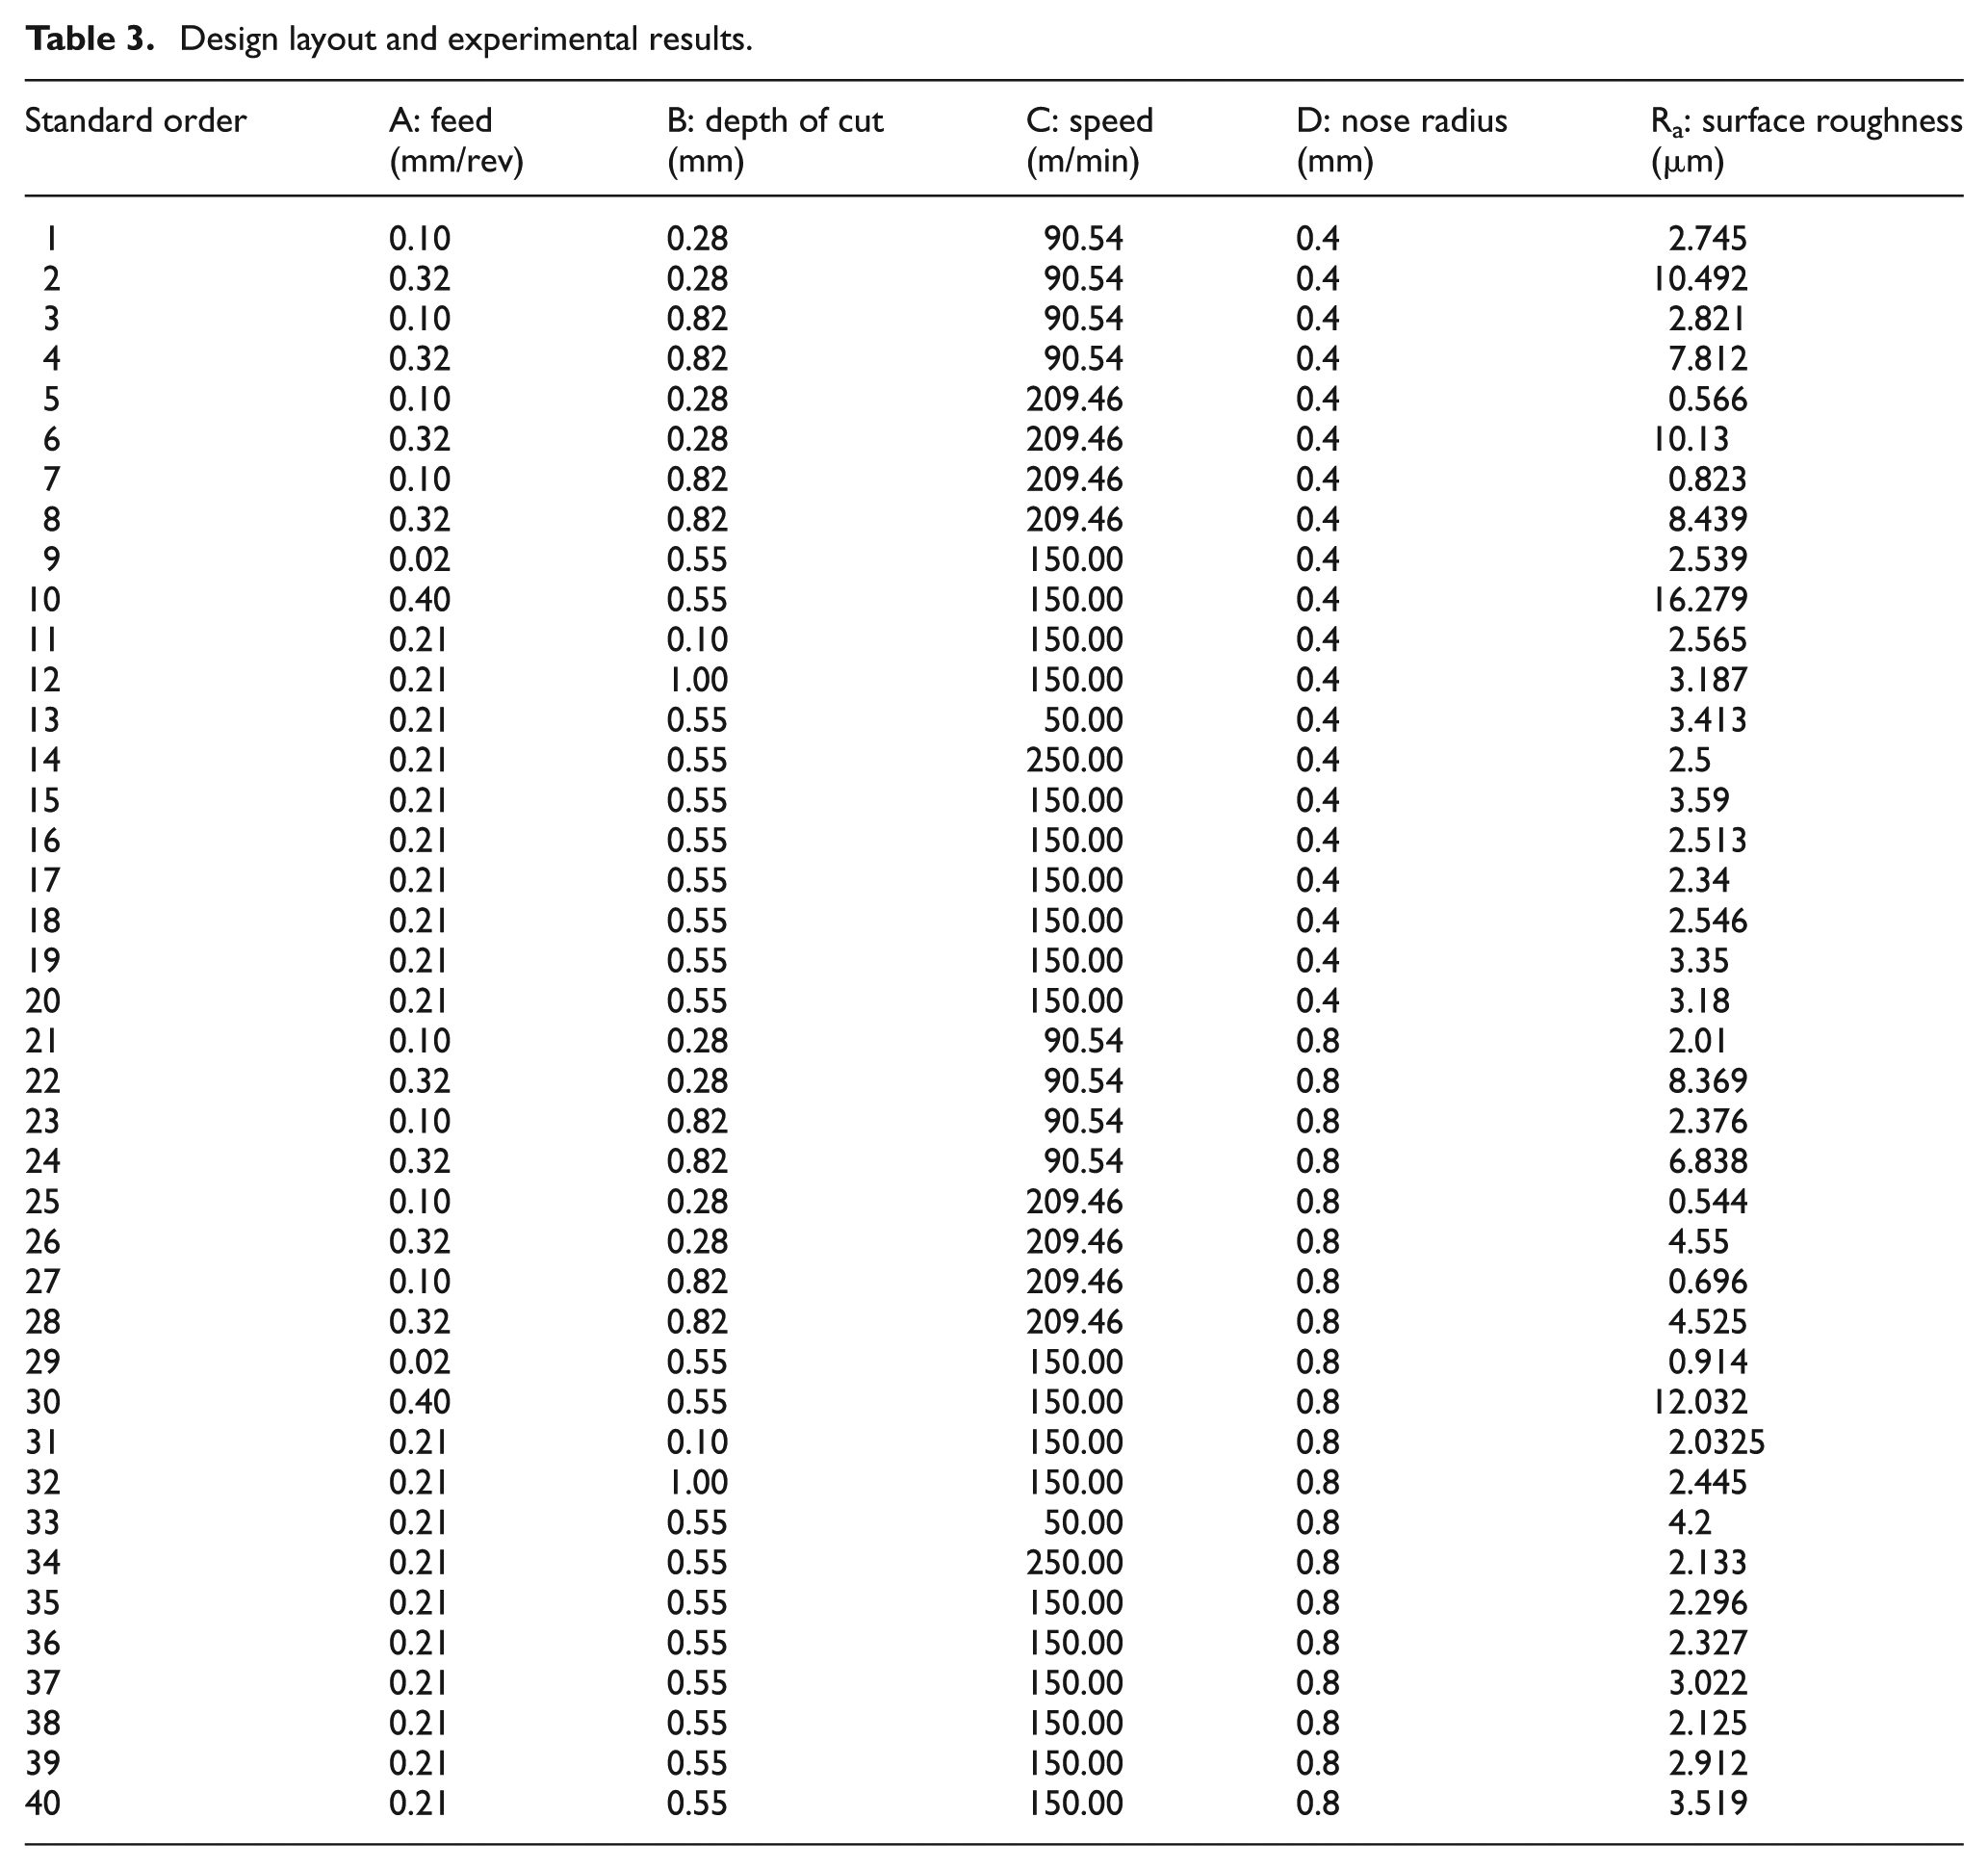
To develop a mathematical model, total 40 sets of experiments were sorted out based on RSM. The complete design layout for experiments is given in Table 3.
Design layout and experimental results.
Surface roughness measurement
Surface roughness is defined as the finer irregularities of the surface texture that usually result from the inherent action of the machining process. 23 There are many parameters related to surface roughness used in the literatures. Among the various roughness parameters, the centerline average (CLA) surface roughness denoted by Ra is the most accepted and widely used parameter in industries.24–28
To measure the CLA surface roughness values (Ra) of finish workpieces, a portable surface roughness tester (surf coder SE 1200) has been used. It has three measuring modes namely skid, skidless and right angle to drive. In the present study, the measurements have been taken in skidless mode according to ISO 97 R standard, which includes Gaussian filter, cutoff length of 0.8 mm and evaluation length of 4.0 mm (5 × 0.8 mm). Figure 1 shows the setup for the measurement of surface roughness.
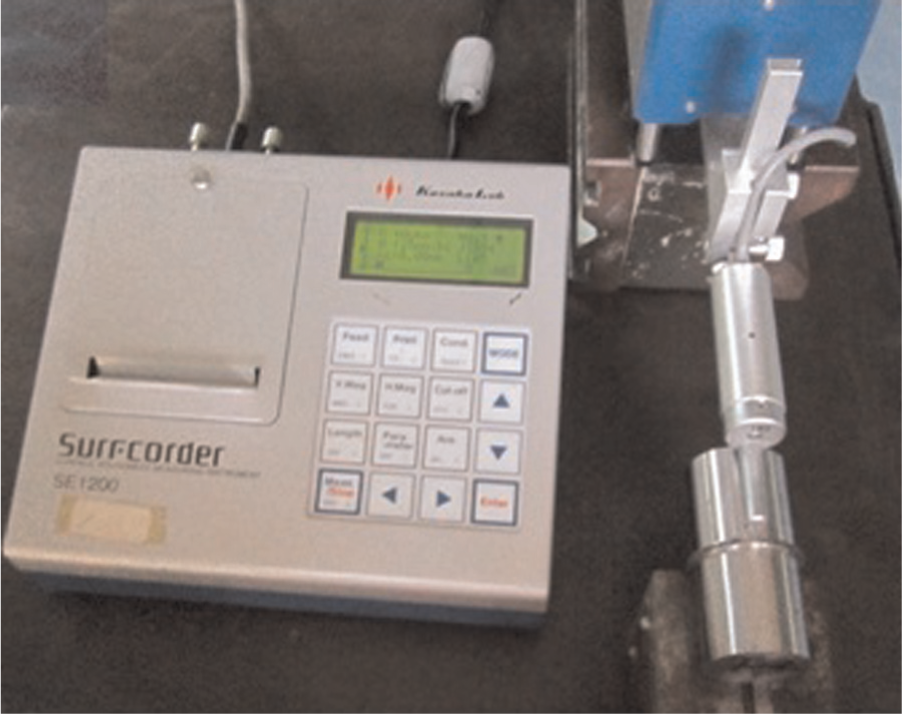
Setup for measurement of Ra.
The measurements have been repeated at three different locations of the finished workpiece in the direction of the tool movement. Finally, mean of all three CLA surface roughness values (Ra) has been considered for the particular trial.
Results and discussion
The results obtained from the machining trials performed as per the experimental plan are shown in Table 3. These results were input into the Design Expert 8.0.4.1 software for further analysis.
Development of prediction model without transformation
Analysis of variance (ANOVA) is commonly used to perform test for significance of the regression model, significance on individual model coefficients and lack of fit of the model. This analysis is based on two assumptions: (1) the variables are normally distributed and (2) homogeneity of variance. Significant violation of either assumption can increase the chances of committing either a Type I or Type II error depending on the nature of the analysis and violation of the assumption. 29
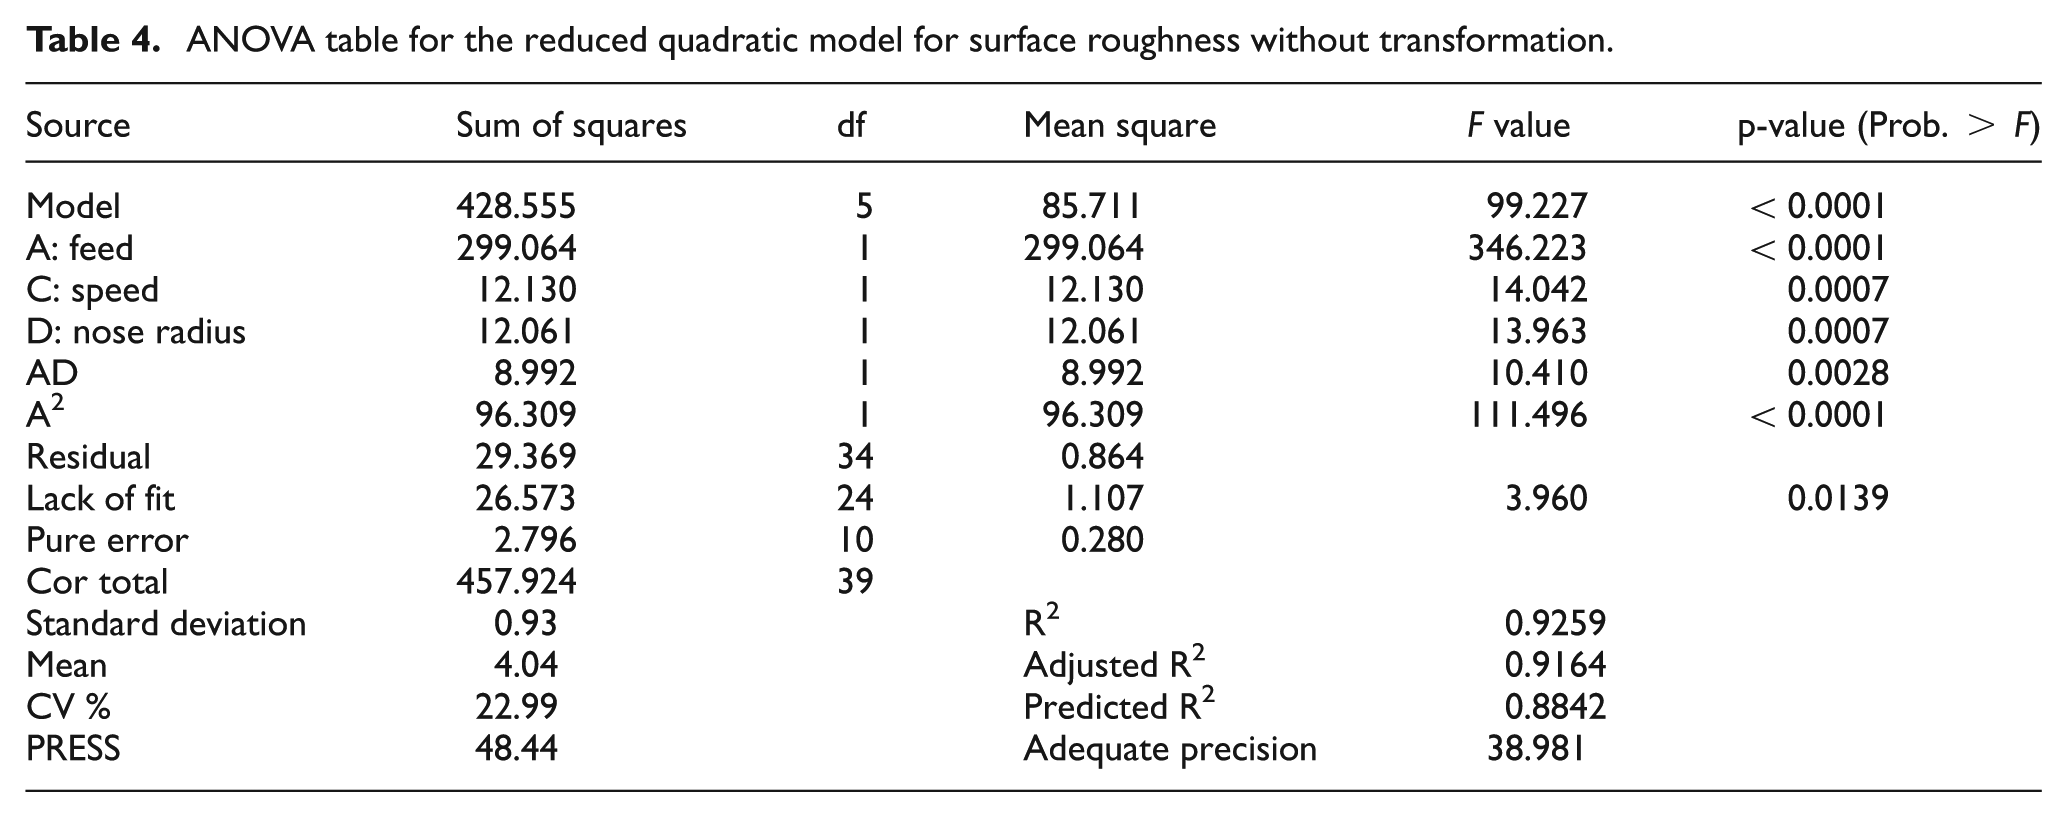
Table 4 shows the ANOVA table for response surface reduced quadratic model for surface roughness. This analysis was carried out for a significance level of α = 0.05, that is, for a confidence level of 95%. The value of “Prob. > F” for the model is 0.0001, which is less than 0.05, that indicates the surface roughness model is significant, and it indicates that the terms in the model have a significant effect on the surface roughness. In the same way, the value of “Prob. > F” for main effect of feed, speed, nose radius and two-level interaction of feed and nose radius are less than 0.05, indicating these terms to be significant model terms.
ANOVA table for the reduced quadratic model for surface roughness without transformation.
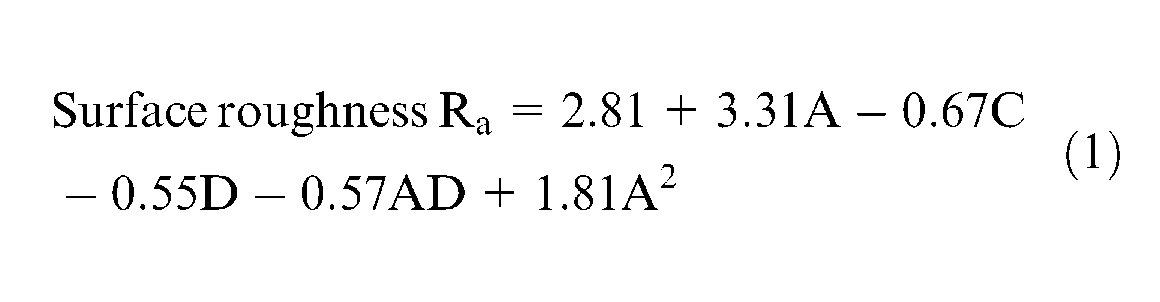
The final regression model without transformation for surface roughness in terms of coded factors is represented as
Development of prediction model with transformation
To improve the results obtained from the quadratic model, the Box–Cox transformation has been employed. The Box–Cox approach provides a family of transformations to normalize the data, which are not normally distributed by identifying an appropriate exponent (lambda, λ). The lambda value indicates the power to which all data should be raised. The Box and Cox originally envisioned this transformation as a panacea for simultaneously correcting normality, linearity and homogeneity. 29
Figure 2 shows a Box–Cox plot for power transformation. In this figure, the blue line indicates the current value of lambda for residuals as 1, which is lying outside the 95% confidence limits. But the best recommended value of lambda is approximately 0.5 as shown by the green line. Thus, the square root transformation on the response is required to make the residuals normally distributed.
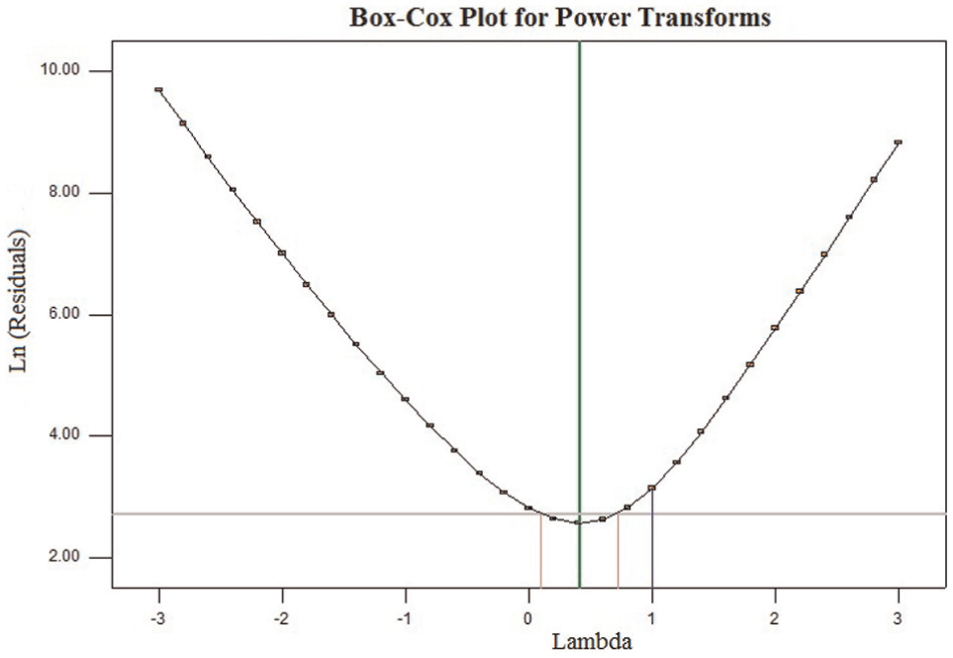
Box–Cox plot for power transformation.
Figure 3 shows the normal distribution plot for residuals after the Box–Cox transformation. It infers that the residuals fall on a straight line implying that the residuals are distributed normally.
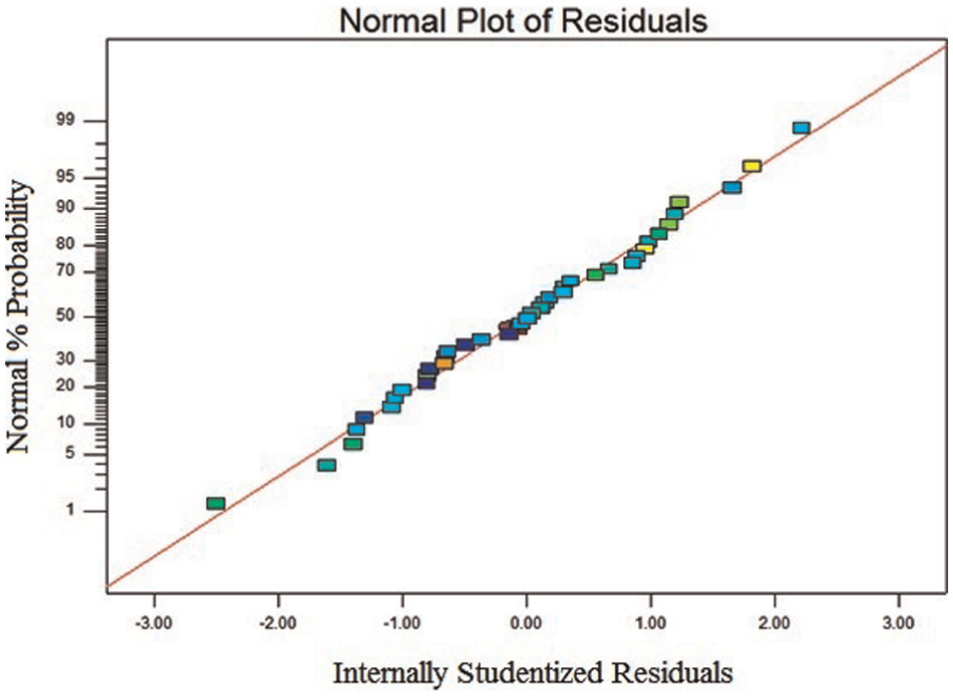
Normal probability plot of residuals for Ra data after Box–Cox transformation.
Table 5 shows the ANOVA for the reduced quadratic model for surface roughness by selecting the forward elimination procedure to automatically reduce the terms that are not significant. This table shows that the model is still significant. However, main effect of feed, speed, nose radius and two-level interaction of feed and speed and the second-order effect of feed are the significant model terms. The main effect of depth of cut, two-level interaction of feed and depth of cut, feed and nose radius were added to support hierarchy. This scenario can be explained by the hierarchical principle, which indicates that if there is a high-order term in the model, it will contain all the lower order terms in the model. The value of “Prob. > F” for lack of fit is 0.1450, which is greater than 0.05 that indicates that lack of fit is still insignificant.
ANOVA for reduced quadratic model with transformation (response:surface roughness, Ra).
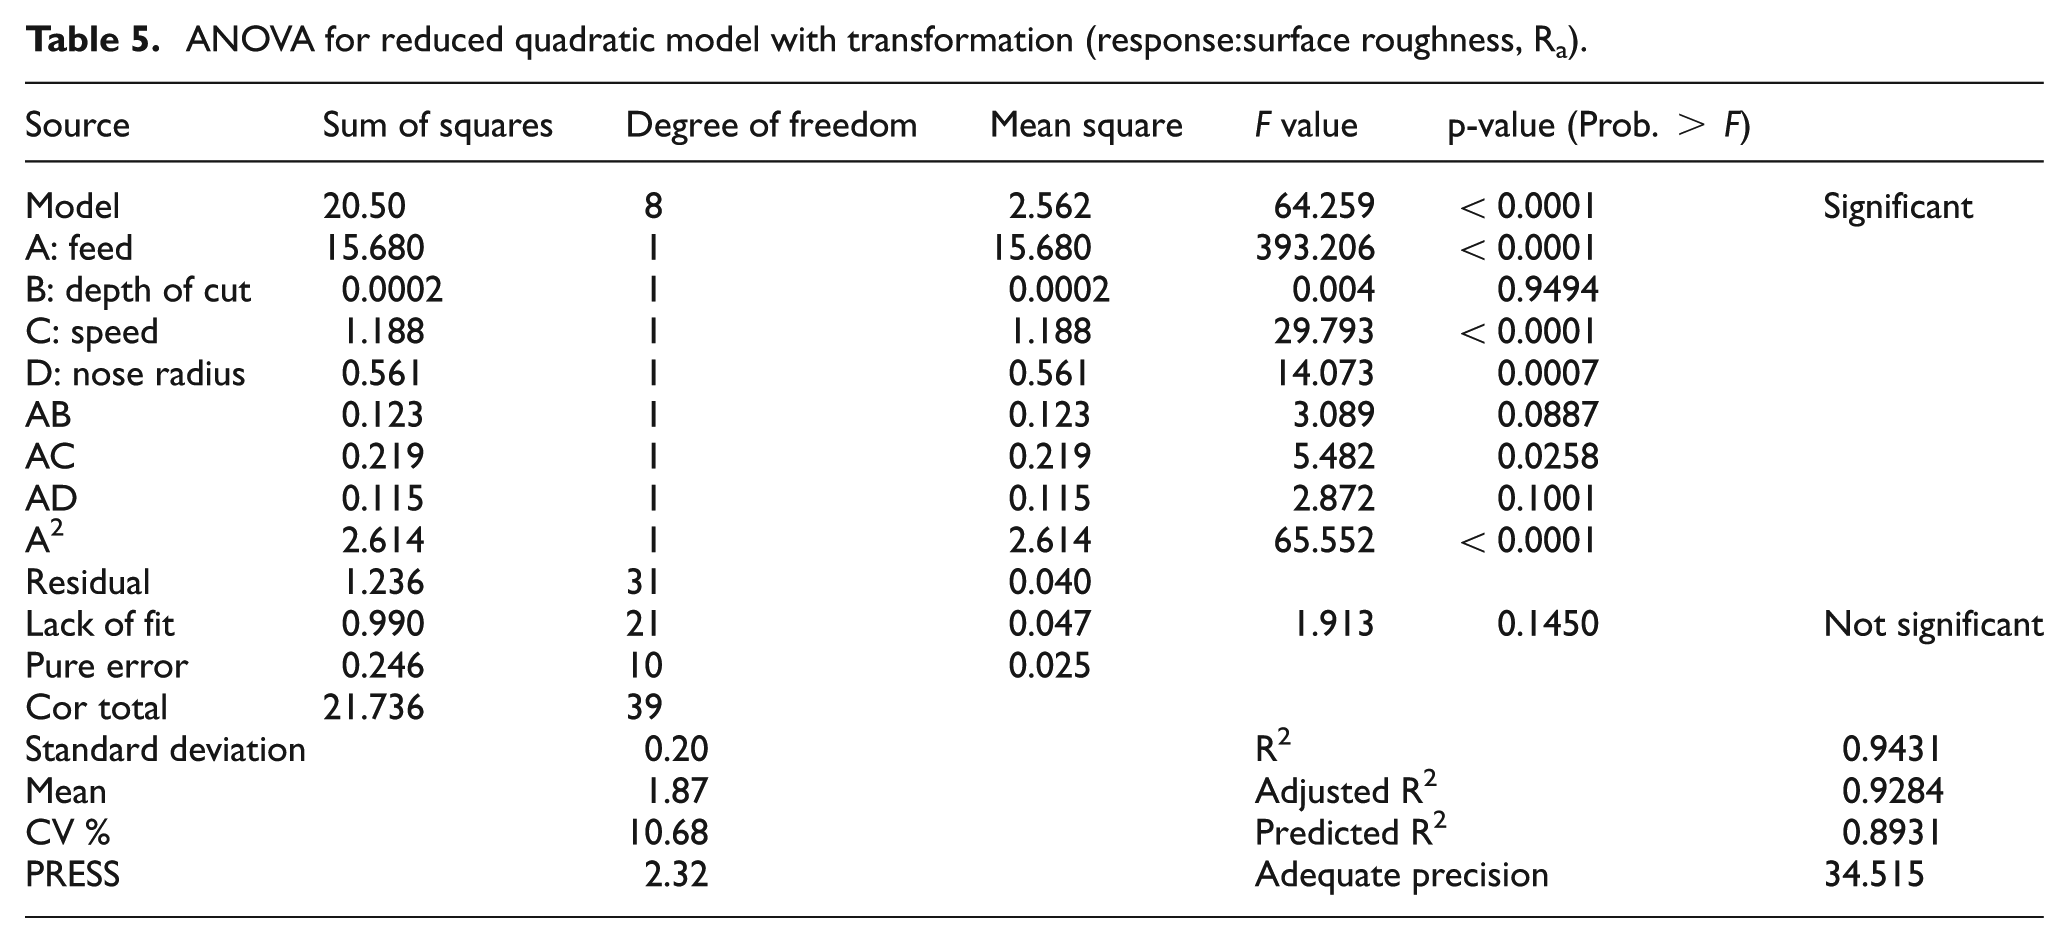
The R2 value, which is the measure of proportion of total variability explained by the model, is equal to 0.9431 or close to 1, which is desirable. The adjusted R2 value is equal to 0.9284, and it is particularly useful when comparing models with different numbers of terms. The result shows that the adjusted R2 value is very close to the ordinary R2 value. The adequate precision value is equal to 34.515; a ratio greater than 4 is desirable, which indicate adequate model discrimination. Adequate precision value compares the range of the predicted values at the design points to the average prediction error.
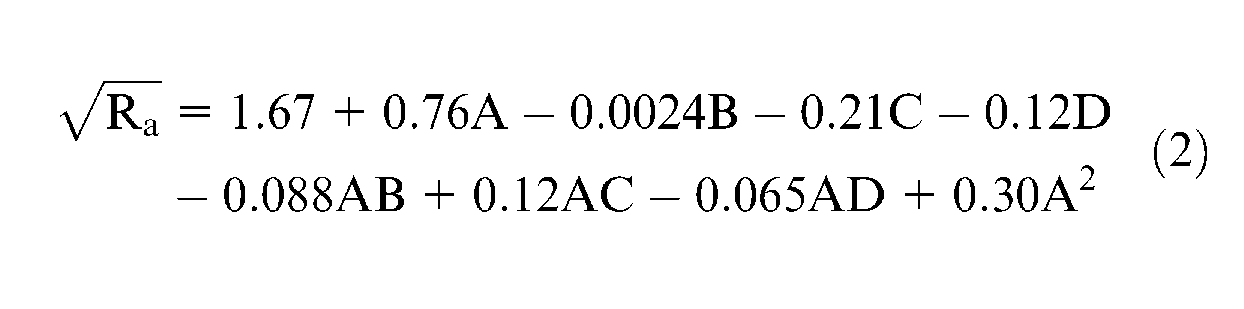
The final regression model for surface roughness in terms of coded factors is represented in equation (2)
Error analysis for prediction models
In order to know the predictability of models, a comparison has been made on the basis of the statistical methods of percentage mean absolute error (%MAE), percentage mean square error (%MSE) and correlation coefficient (R2 values). These values are determined using equations (3) and (4)
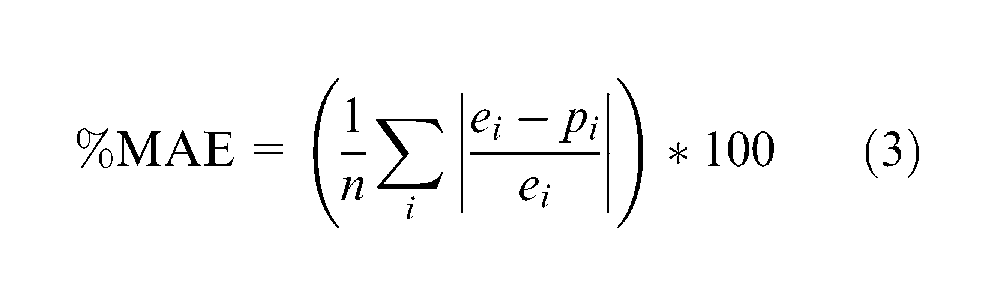

where e is the experimental value, p is the predicted value and n is the number of treatments for experimentation.
Table 6 represents the comparative assessment of the results obtained using quadratic models for the entire data set. The analysis of table shows that the maximum percentage absolute error reduces from 204.15 to 64.74 using a Box–Cox transformation.
Predicted values of surface roughness by models and their % absolute error.
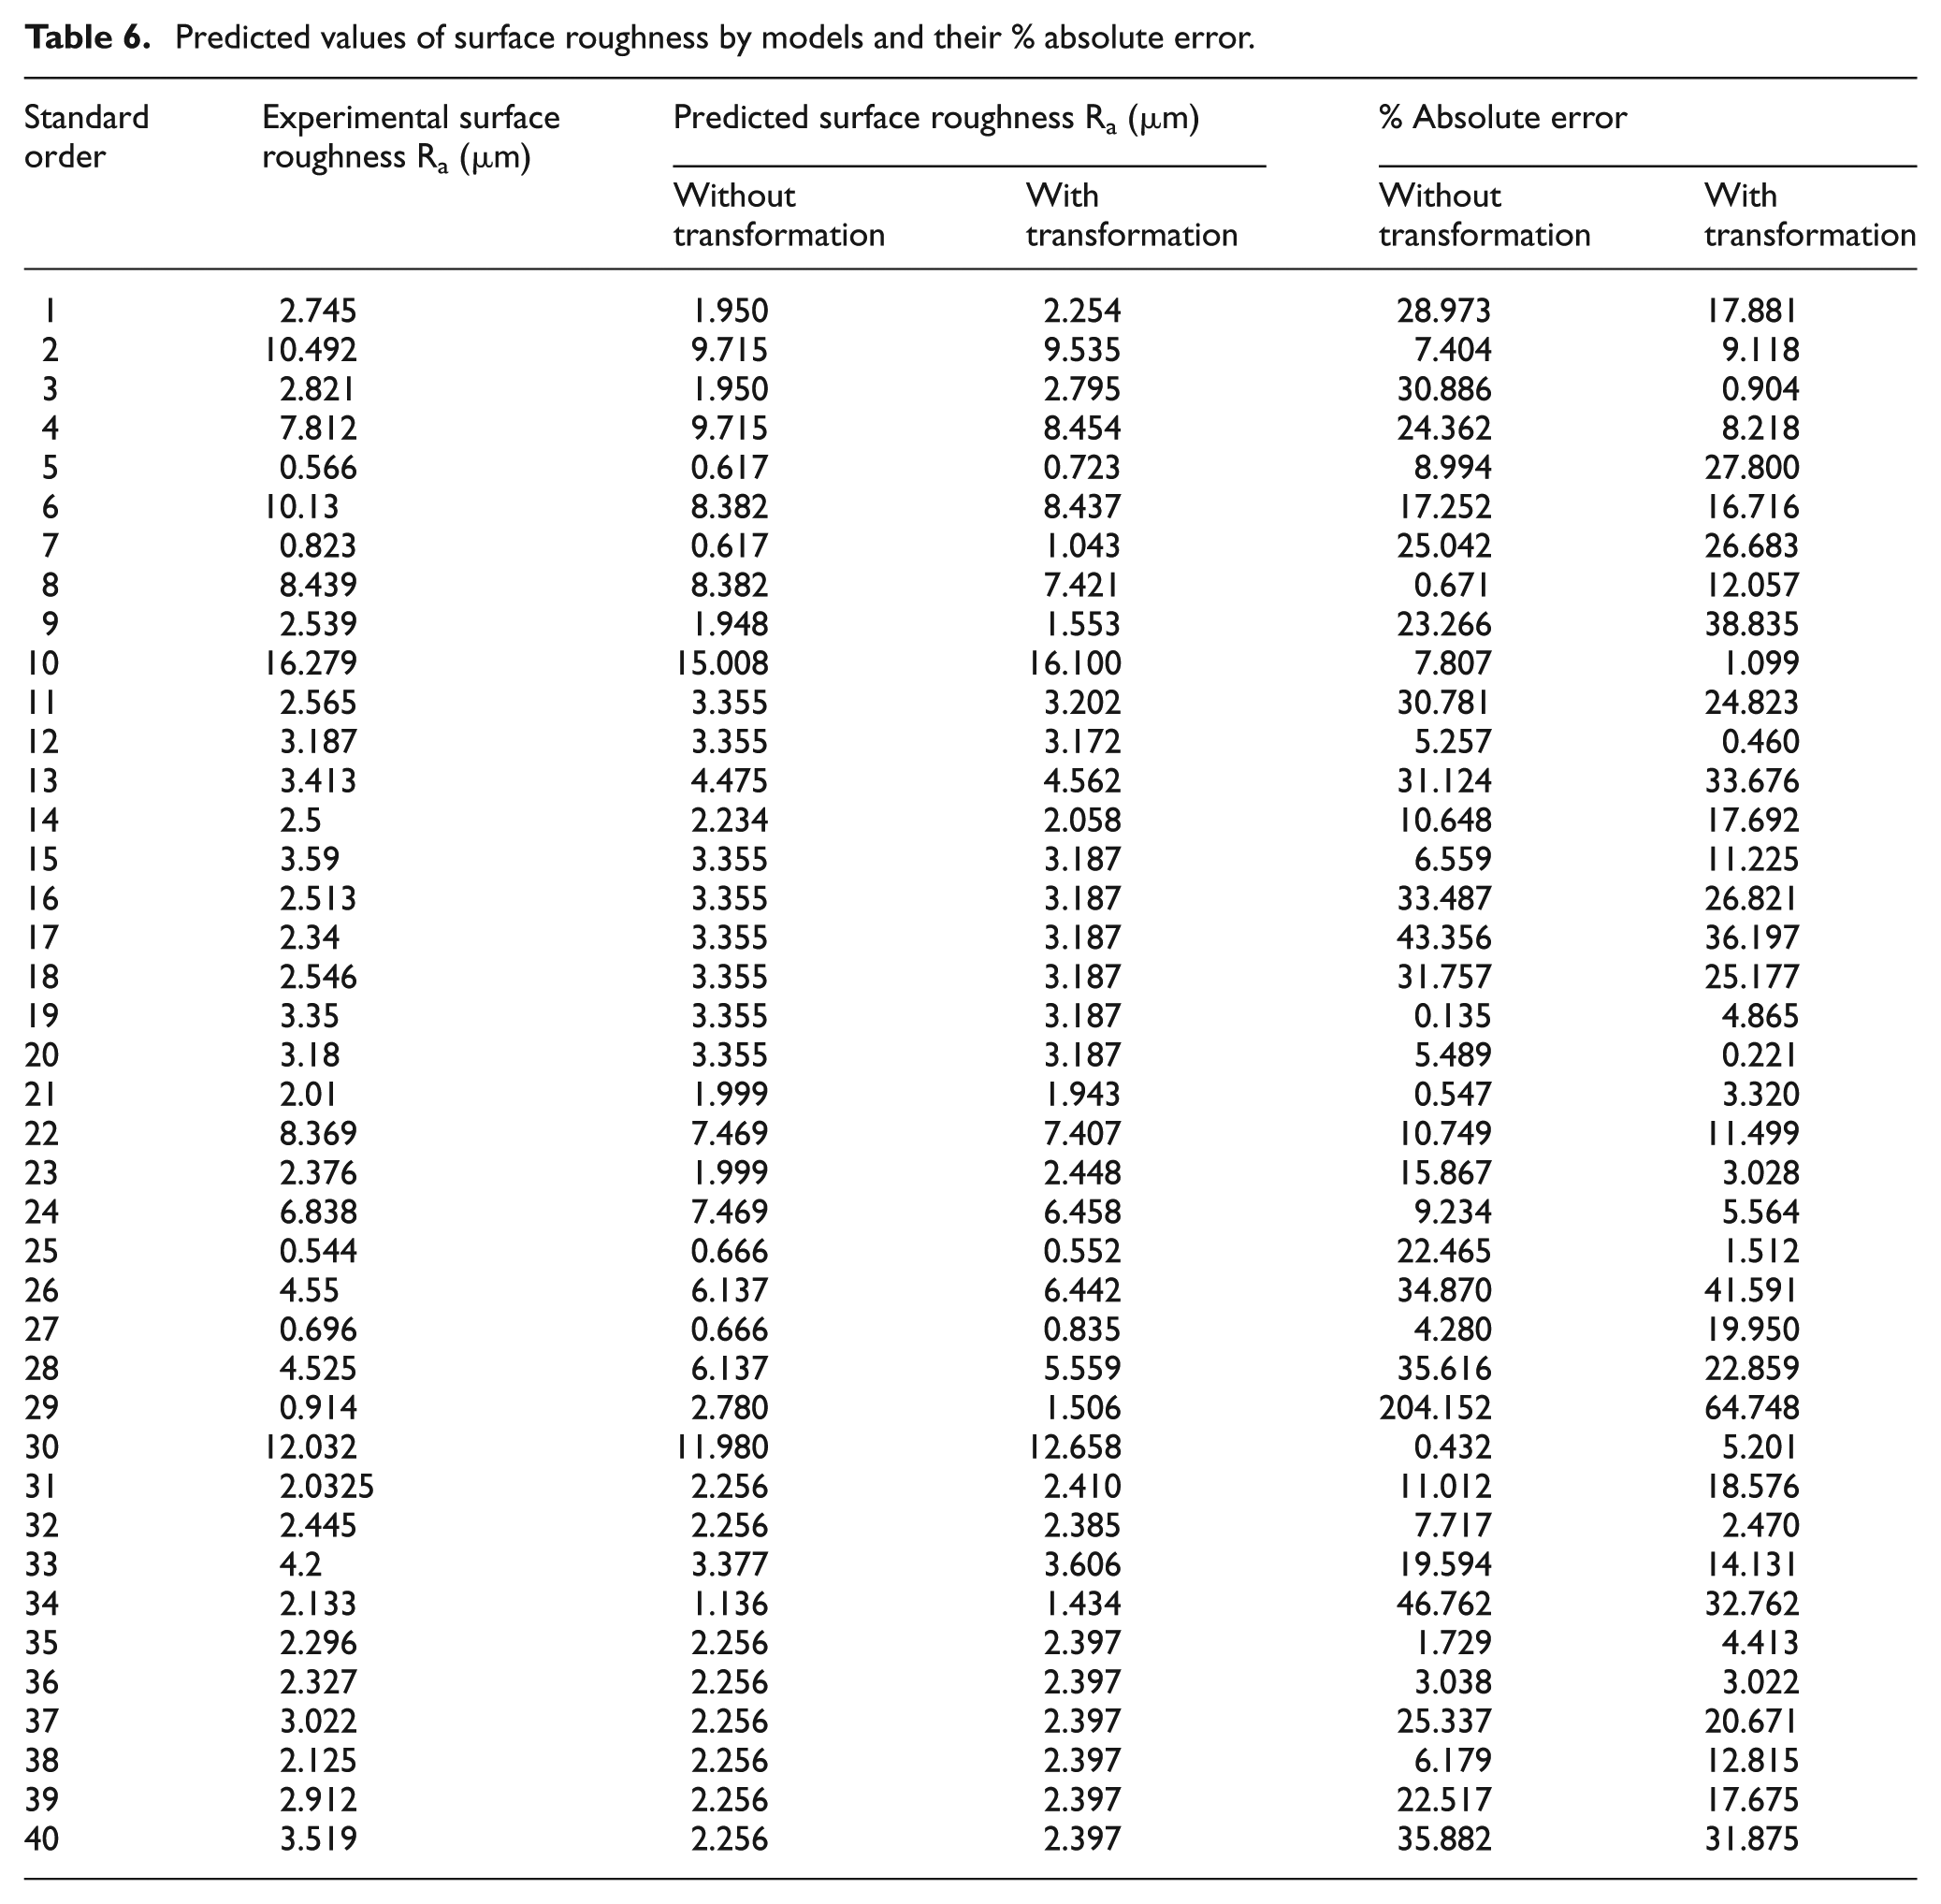
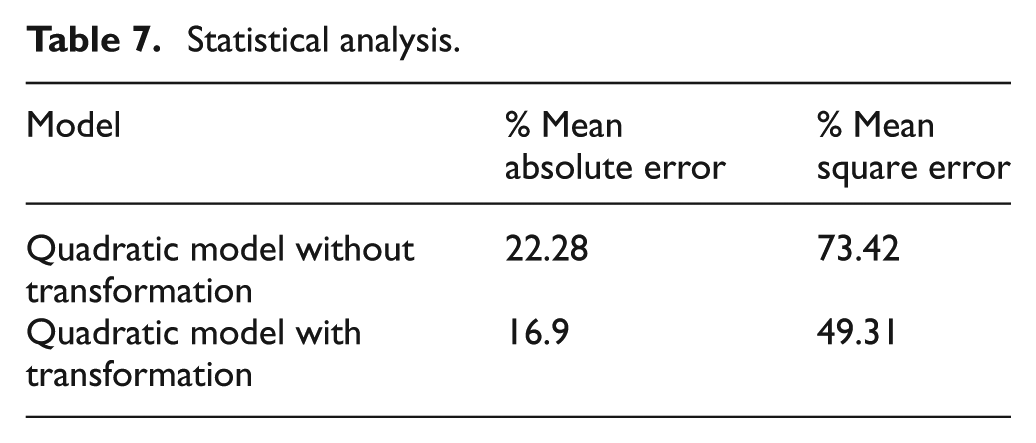
Table 7 represents the comparative evaluation of the results obtained using quadratic models on the basis of percentage absolute error and %MSE. It is clearly observed from this table that the Box–Cox transformation reduces the %MAE from 22.28 to 16.9 and %MSE from 73.42 to 49.31; this indicates the improved prediction ability of the quadratic model using the Box–Cox transformation.
Statistical analysis.
Influence of machining parameters on surface roughness
The percentage contribution of the significant model terms on surface roughness is shown in Figure 4. This figure shows that feed is the dominant factor affecting the surface roughness among all machining parameters with 77% contribution followed by speed (with contribution of 6%) and nose radius (with contribution of 3%).
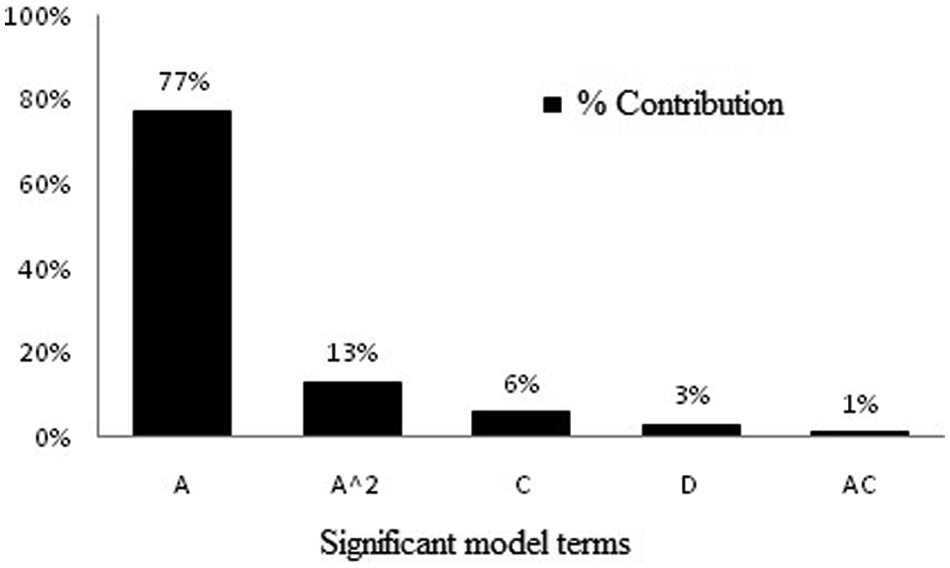
Bar chart for percentage contribution.
Influence of nose radius on the average surface roughness at constant feed of 0.21 mm/rev, constant depth of cut of 0.55 mm and constant speed of 150 m/min is shown in Figure 5. It is clear from this figure that the surface roughness decreases with increase in nose radius when other machining conditions are remain constant.
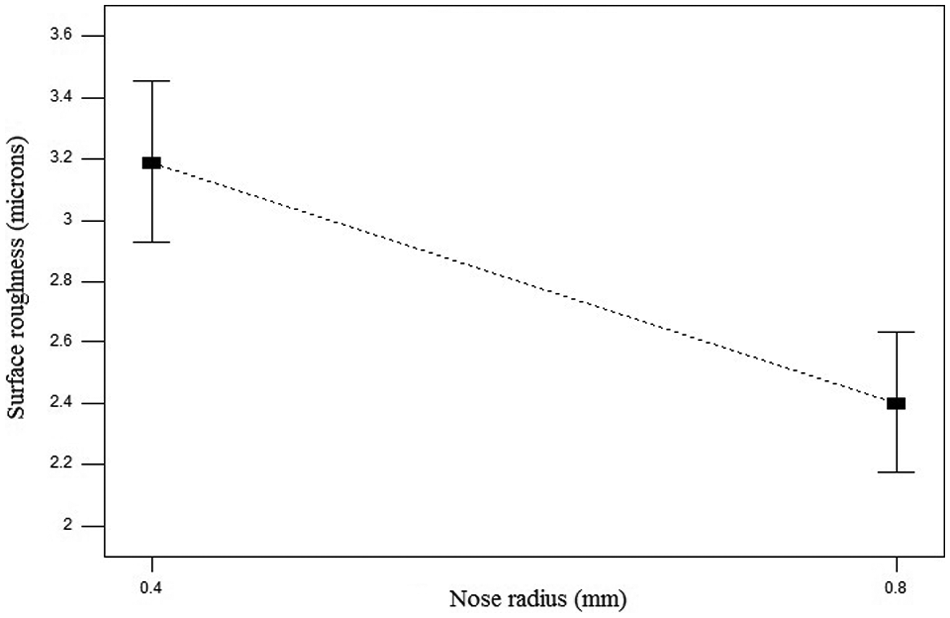
Plot between nose radius and surface roughness.
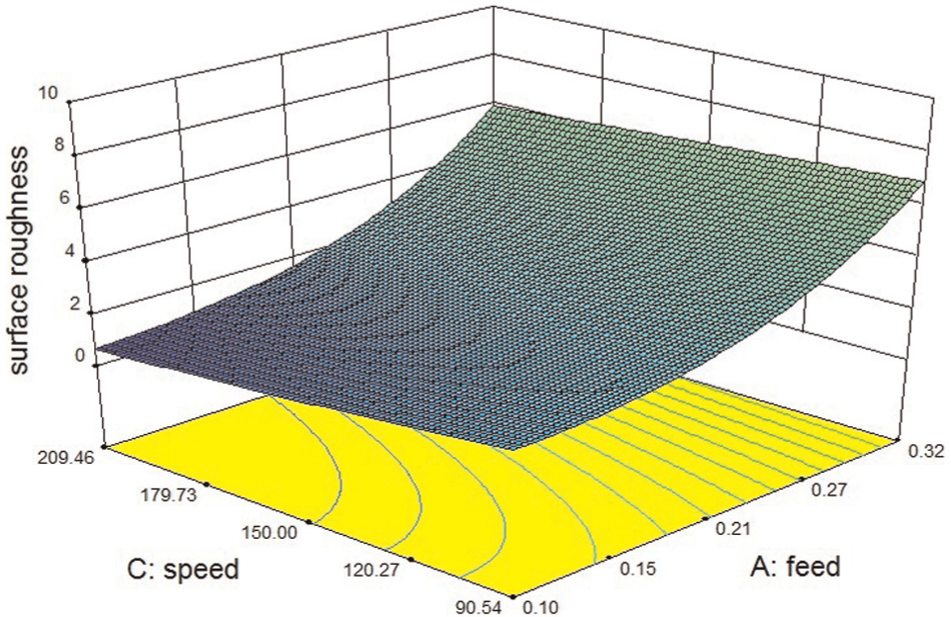
The three-dimensional (3D) surface graphs for surface roughness at two selected levels of nose radius (0.4 and 0.8 mm) are shown in Figures 6 and 7, respectively; the curves have curvilinear profile in accordance with the quadratic model fitted. From the both 3D plots, it is clear that as the feed increases, the surface roughness increases. This is due to the fact that at higher feed rate, tool traverses the workpiece too fast, resulting in deteriorated surface quality and also high feed increase the chatter, which leads to higher surface roughness. On the other hand, surface roughness decreases with increasing cutting speed due to increase in temperature during cutting, which softens the material to enhance the cutting performance leading to reduced surface roughness. 2
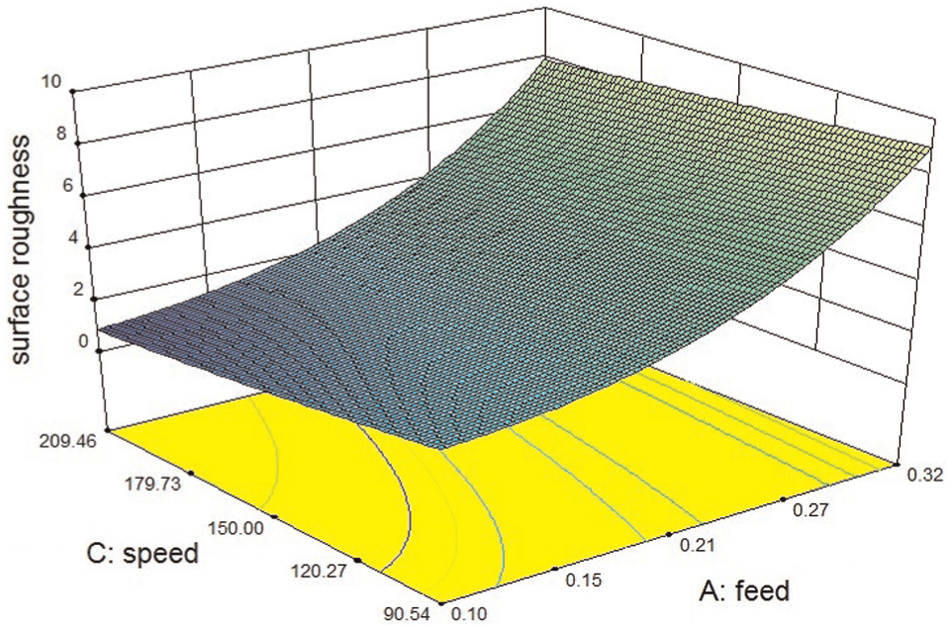
3D surface graph for surface roughness at depth of cut of 0.55 mm and nose radius of 0.4 mm.
3D surface graph for surface roughness at depth of cut of 0.55 mm and nose radius of 0.8 mm.
It has been concluded from the analysis of Figures 5–7, the minimum surface roughness is achieved at a combination of low feed, high cutting speed and high level of nose radius.
Confirmation experiments
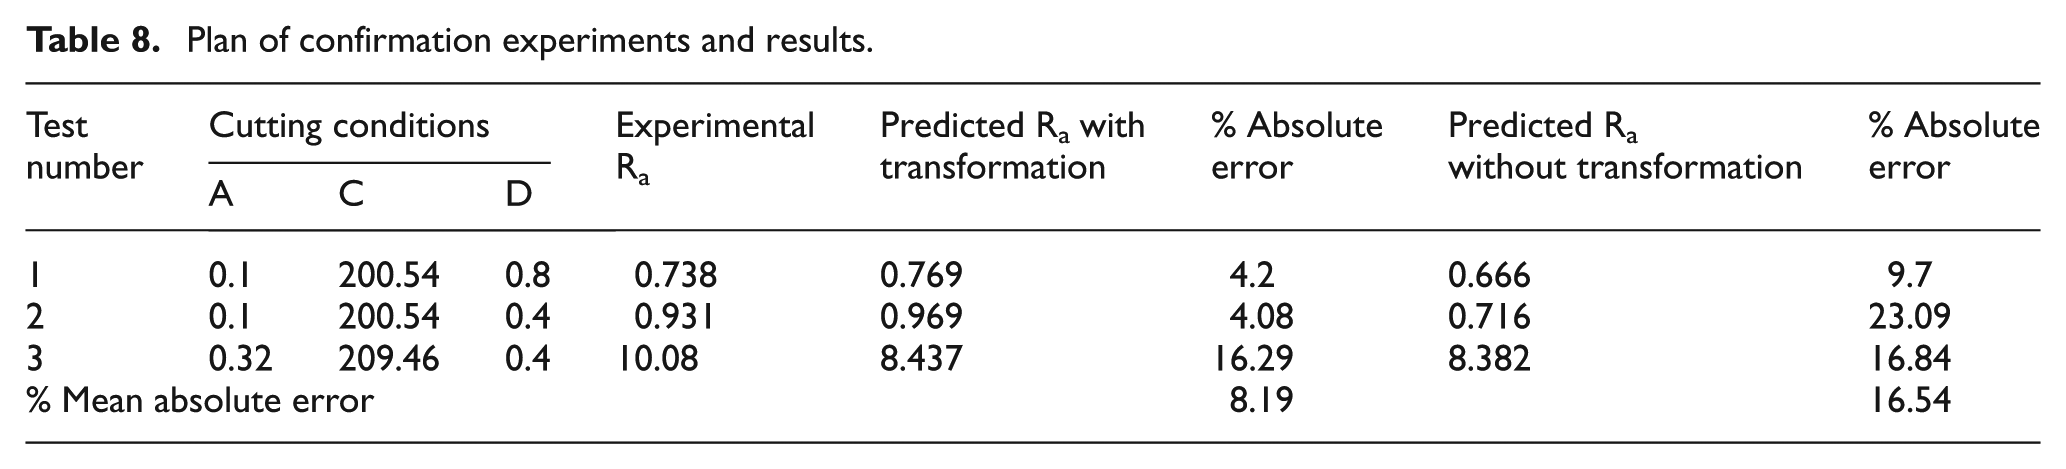
Statistically developed mathematical models for Ra have already been validated through F-tests and lack-of-fit test. This conclusion is further supported through the confirmation runs. A set of two confirmation runs have been performed to verify the prediction ability of the developed surface roughness models. The details of the confirmation runs are given in Table 8. The values of Ra obtained by confirmation runs and those predicted through models are compared in Table 8. The average percentage absolute errors between the experimental and the predicted values of Ra using model with transformation and without transformation have been found to be 8.19 and 16.54, respectively.
Plan of confirmation experiments and results.
Conclusion and future scope
The literature reveals that the earlier work reported on AISI 1019 steel or other similar materials is seems to be very limited. Thus, the research work for machining this material needs to be strengthened.
In the present work, the effect of machining parameters (cutting speed, feed, depth of cut and nose radius of cutting insert) on surface roughness in turning of AISI 1019 steel has been studied. The RSM based on CCRD has been used to develop quadratic surface roughness prediction model and to identify the most significant machining parameter that affects the surface roughness. To increase the accuracy of the analysis (prediction model, significant effect of parameters or combination of parameters), the Box–Cox transformation has been used. The error analysis has also been carried out to study the improvement in the prediction models. The experimental result has led to the following conclusions:
Percentage contribution of feed on surface roughness has been found to be 77, which clearly indicates that feed is the dominant factor followed by speed (with contribution of 6%) and nose radius (with contribution of 3%).
The effect of depth of cut on surface roughness has been found insignificant.
The results clearly illustrate that surface roughness increases with increasing the feed rate while an increase in the cutting speed and nose radius decreases the surface roughness.
A linear relationship has been observed between cutting speed and roughness.
The rate of increase of surface roughness at lower values of feed (between 0.1 and 0.21 mm/rev) has been found less as compared to higher values (from 0.21 to 0.32 mm/rev) of feed.
The application of Box–Cox transformation has reduced the statistical errors in prediction of surface roughness, that is, mean absolute error (from 22.28% to 16.9%) and mean square error (from 73.42% to 49.31%).
As the experimental study is based on only two values of nose radii, it may not be appropriate to statistically generalize the result. However, the observation of the effect of the nose radii on surface roughness is important and an indicative one.
In this study, the machining parameters considered are cutting speed, feed, depth of cut and nose radius. Other factors such as workpiece material, tool material, tool geometry (tool angles, more values of nose radius and so on), acceleration and vibrations may also influence the machining performance. An exhaustive study considering all these parameters shall be more useful.
In this study, the CLA value (denoted by Ra) has been adopted as the measure for the surface roughness. A better approach would be to consider other measures for the roughness, such as Rq (RRMS, that is, root mean square value) and Rz (maximum peak to valley).
Footnotes
Declaration of conflicting interests
The authors declare that there is no conflict of interest.
Funding
This research received no specific grant from any funding agency in the public, commercial or not-for-profit sectors.