
Abstract
This article is about the implementation of an acquisition system for the measurement of micro-electro discharge machining process parameters and the statistical analysis of their influence on the process performance. The micro-electro discharge machining drilling of 316L stainless steel with copper tubular electrodes was studied and the exchanged power was taken into account as a comprehensive variable able to represent the effect of the peak current and voltage on the final result. The direct proportionality between the exchanged power and the nominal process parameters was verified. A linear and non-linear regression approach was used in order to obtain predictive equations for the most important aspects of micro-electro discharge machining process, such as the machining time and the electrode wear.
Keywords
Introduction
The need for products containing micro-features has shown a noticeable and continuous growth in many fields of application, and within the different types of micro-feature, the need for products containing micro-holes has shown remarkable growth in some industrial sectors. 1 For example, micro-holes are widely used for the production of several industrial components such as medical and optical devices, turbine blades, cooling channels, and diesel fuel injection nozzles. 2 At the same time, materials with distinctive mechanical and physical properties, such as titanium- or nickel-based alloys, tungsten carbide and its composites, tool steels, and other super alloys, have been developed to meet the needs of specific applications. In general, these materials have high performing properties in terms of hardness, toughness, low heat sensitivity, high fatigue, and corrosion resistance with respect to other more common materials, even though they are often more difficult to be machined. 3 Micro-electro discharge machining (EDM) is a manufacturing technology that, by means of rapid electric spark discharges, is able to remove material from the workpiece. Since micro-EDM involves the use of electrical discharges, it allows the machining of metals and all the conductive materials, regardless of the hardness or high-strength materials, such as titanium and hardened steel. The micro-EDM material removal mechanism takes place in total absence of contact between the tool and the workpiece: the sparks cause the melting and the vaporizing of the material, in the constant presence of a dielectric. The dielectric flushing in the machining area helps keeping the electrical condition under control and, at the same time, it helps keeping the area clean from unwanted metal particles. The dielectric fluid in fact helps removing the so-called debris, in other words, the small metallic particles that are melted during the process and rapidly solidified after having been removed from the workpiece.
These particles are always unwanted in the machining area because they enhance the electrode wear phenomenon: their presence in the machining zone causes electrical discharges that are not aimed at the actual material removal and for this reason they increase the electrode wear and the inefficiency of the machining. The wear phenomenon, together with the machining time, is one of the most relevant aspects of the micro-EDM process, especially from the industrial point of view. In Murray et al., 4 it was demonstrated that, for particular discharge gap conditions, the debris can be rapidly solidified and re-attached to the tool electrode. The importance of the dielectric and the performance ensured by different dielectric fluids were investigated in Zhang et al.: 5 five dielectrics were studied and compared in order to deepen the knowledge about the performance of liquid and gas dielectrics, about their peculiarities, and characteristics.
As regards the process parameters, in Puertas et al., 6 the influence of peak current, pulse time and duty cycle on the surface roughness, electrode wear, and material removal rate (MRR) was investigated. In this case, especially for the electrode wear, the combined effect of the process parameters has the most relevant influence. On the contrary, the duty cycle is the only factor having a negligible influence on the final indicators. In Muthuramalingam and Mohan, 7 the authors demonstrated that the peak current and the pulse duration are the most relevant factors from a process performance point of view. Similarly, in Gostimirovic et al., 8 the influence of the discharge duration and the peak current on the main performance indicators (MRR, tool wear ratio (TWR), and surface roughness) was investigated.
In Yu et al., 9 the authors carried out an experimental study in order to investigate the influence of the process parameters on the machining characteristics of micro-EDM. They demonstrated the close relationship existing between the performance and the pulse energy, the dielectric, and the debris distribution. Similarly, in Tiwary et al., 10 the authors investigated the influence of the process parameters on the most commonly used process performance indicators, such as the MRR, the TWR, and the diametrical overcut (DOC) for the machining of Ti-6Al-4V. The authors developed mathematical models in order to find the optimal values of micro-EDM process parameters and it was possible to demonstrate that the obtained results are satisfactory and in accordance with the results obtained experimentally. In Rasheed et al., 11 the influence of the process parameters on the same indicators (TWR, MRR, and surface roughness) was investigated in the case of Ni–Ti shape memory alloy. The authors demonstrated that the Taguchi approach was the best when analyzing the optimal process conditions: among all the factors, the capacitance resulted to be the best together with the discharge voltage, for both brass and tungsten electrode. Moreover, the influence of the thermal and electrical properties of the material on the responses was demonstrated. Based on these assumptions, the selection of the process parameters was strongly dependent on the match between the electrode and the workpiece.
The selection of the process parameters strongly depends on the match between the electrode and the workpiece. As mentioned before, the removal mechanism is based on electrical discharges, and for this reason, the thermal and electrical characteristics of the materials involved in the erosion (electrode and workpiece) are of great importance. Copper, brass, and WC are commonly used as tool electrode in micro-EDM.
In Her and Weng, 12 a comparison between copper electrode and tungsten carbide electrode was carried out. It was demonstrated that the WC electrode ensures higher MRR when negative polarity is selected. Moreover, copper electrode provides better surface roughness and lower electrode wear than the WC electrode, but the WC electrode provides higher removal rate than a copper electrode using both positive and negative polarity. Similarly, in Khan, 13 a comparison between copper and brass electrode for the machining of aluminum and mild steel was carried out. It was found that the brass electrode shows the highest wear ratio during the machining of steel, because of its lower thermal conductivity if compared to the copper one. This causes less heat loss, and brass lower melting point results in fast melting of the electrode material. From this point of view, the copper electrode can be considered preferable.
In Jahan et al., 14 different electrode materials (tungsten, W, copper tungsten, CuW, and silver tungsten, AgW) were used for the machining of tungsten carbide. It was found that AgW electrodes produce smoother and defect-free nanosurface, and that CuW electrodes achieve the highest MRR followed by AgW. From the electrode wear point of view, the W electrode had the lowest wear followed by CuW and AgW.
Other authors investigated the possibility to use copper composites as tool electrodes. In Marafona and Wykes, 15 the authors carried out an investigation about the optimization of the EDM process exploiting the effect of carbon which has migrated from the dielectric to tungsten–copper electrodes. A two-stage EDM process, where different EDM settings are used for the two stages of the process, was developed.
In Tsai et al., 16 electrodes made by means of powder metallurgy technology from Cu/Cr powders were used to increase wear resistance. According to the results, it was possible to demonstrate that the composite electrodes ensured a higher MRR than Cu metal electrodes.
In Lee et al., 17 a composite Cu/W electrode was used for the machining of AISI 1045 carbon steel. The influence of the EDM parameters on various aspects of the surface integrity was investigated and it was possible to demonstrate that the MRR, surface roughness, hole enlargement, average white layer thickness, and induced residual stress tend to increase at higher values of pulse current and pulse-on duration. A linear relationship between the maximum residual stress and the average white layer thickness was identified and an effective control of the residual stress can be carried out with appropriated pulse durations.
The literature reports some mathematical formal relationships regarding both the process performance and the geometrical characteristics. In Kuppan et al., 18 the influence of the EDM process parameters in deep hole drilling of Inconel 718 was investigated, and mathematical models for MRR and depth average surface roughness were derived using response surface methodology. Micro-EDM drilling of titanium super alloy was investigated in Pradhan et al.; 19 the process parameters were optimized and some mathematical models were developed to establish the relationship between various significant process parameters and micro-EDM performance criteria. A different approach was used in Allen and Chen 20 where MRR for micro-EDM on molybdenum was analyzed using a MATLAB-based thermo-numerical model, which simulated a single-spark discharge process. Using this model, the effects of important process parameters were studied. In Jeong and Min, 21 a geometry prediction of EDM-drilled holes and tool electrode shape was investigated, developing a two-dimensional geometric simulation model of EDM drilling with cylindrical tool. The model predicts the change in tool and workpiece geometries during the machining due to the end/corner wear and interaction with the workpiece. The simulation performance was verified experimentally by comparison with the experimental results. Even though hole making by EDM is a common process, a lack of information about the measurement of the actual process parameters in micro-EDM and their influence on the process performance emerged from the literature.
The aim of this article is to deepen the knowledge about the process parameters’ influence in micro-EDM drilling of stainless steel with copper electrode. The main contribution and the novelty aspects of this work are based on the use of actual electrical parameters instead of the nominal ones. As a matter of fact, the Sarix SX200 process parameters, namely, the peak current and the energy levels are only representative of the physical quantities involved in the process: they are expressed as indexes and they only have a relation with the real physical quantity value. This issue is a remarkable problem, still under investigation, due to the difference between the nominal and actual values of the process parameters. This aspect is particularly significant if we consider that different actual conditions can occur using the same nominal parameters, due to minimal physical local differences of both the workpiece and electrode. For this reason, a dedicated data acquisition system was implemented: the system is able to directly measure and to record the peak current and voltage signals during operation, to filter and analyze them in order to obtain reliable information about the micro-drilling process.
The process parameters and the statistical analysis of their effect on the final response were carried out: in particular, the effect of the peak current, voltage, and exchanged power was studied, and the process performance as well as the geometrical characteristics of the holes were evaluated. A linear and non-linear regression approach was set up, allowing the implementation of predictive equations for the most relevant aspects of the drilling procedure, such as the machining time and the electrode wear.
Experimental campaign
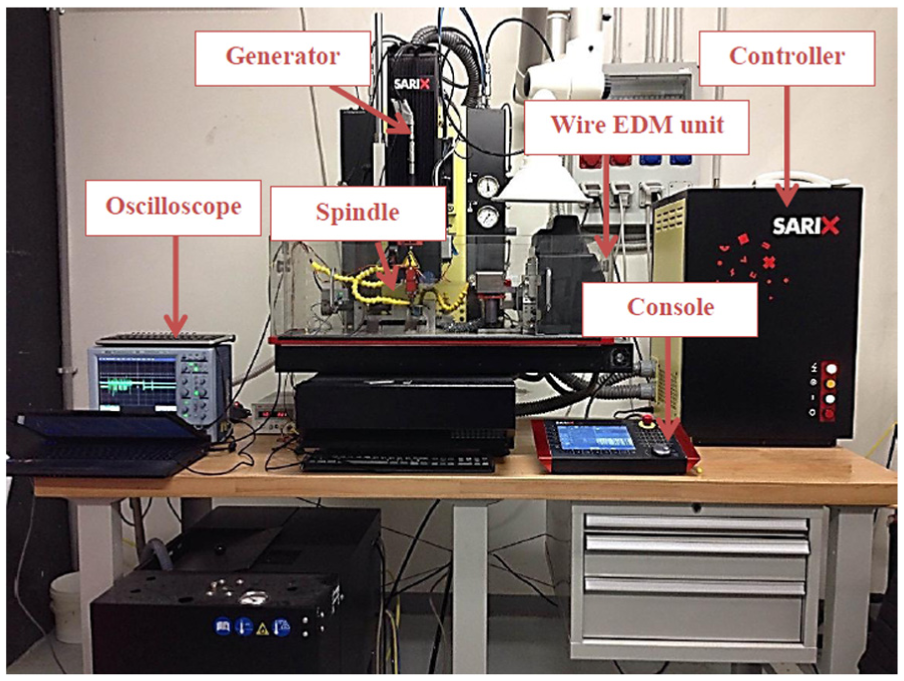
A Sarix SX200 machine (Figure 1) was used for the experimental campaign. Tubular electrodes made of copper (Cu) having, respectively, external diameter equal to 300 and 150 µm and internal diameter equal to 120 and 60 µm were used to collect information about the influence of the electrode diameter on the indicators.
Experimental setup.
The experimental campaign was carried out on 316L stainless steel sheets having thickness equal to 1 mm. The electrode and workpiece material characteristics are reported in Table 1, and Table 2 reports the characteristics of the dielectric fluid, adduced to the machining zone with a pressure of 20 bar.
Electrode and workpiece material characteristics.

Dielectric characteristics of kerosene oil.

Some preliminary drilling tests were executed in order to collect information about the process performance (time and wear). Based on this information, the final process parameters were selected in order to minimize the machining time and the electrode wear. In particular, for every electrode diameter, two different wave shapes, in other words energy levels, were used for the experimental tests.
Experimental plan
The experimental procedure was based on the execution of through micro-holes on stainless steel sheets. A full-factorial design of experiment (DOE) approach was adopted: two process parameters (namely, peak current I and voltage V) were varied on three levels, codified as “low,”“medium,” and “high.” Five repetitions for every experimental condition were executed. Moreover, the energy level was varied on two levels for each diameter, codified as 365 (high) and 206 (low). For the 300 and 150 µm electrode diameter, 45 holes were carried out for each energy level, 180 through micro-holes in total. Tables 3 and 4 show the fixed and varied process parameters for every electrode diameter and for every energy level, respectively. As regards the 150 µm electrode, since the electrode bending is a relevant aspect to monitor for the realization of acceptable geometrical characteristics of the holes, a ceramic guide was employed. In particular, the ceramic guide was used to limit the electrode bending due to the considerable electrode length (>8 mm) necessary to carry out the through holes. The preliminary experimental tests provided some information about the electrode wear, and such an electrode length was imposed by the considerable electrode wear. The ceramic guide helps controlling the run out phenomenon and the development of a more repeatable machining procedure, since the electrode is kept in place by the ceramic guide.
Fixed process parameters.

Varied process parameters.

Thanks to an automatic drilling program, the machining time was recorded after the execution of each hole and the electrode wear was measured by means of an electrode touch in a referential point on the workpiece. After the execution of each hole, the electrode needs to be cut in order to carry out the machining procedure with the same electrode conditions. This happens because the tool electrode as well as the workpiece are characterized by a certain wear that damages the initial cylindrical shape of the electrode. After a series of sparks, the material is eroded from the electrode bottom and sides and the electrode assumes a conical shape which can have a negative effect on the micro-holes’ geometry.
Signal acquisition system
In order to find a formal relationship between machine input and output, a signal acquisition system was implemented. A general schematic of the acquisition system is given in Figure 2, and the experimental setup is depicted in Figure 3.
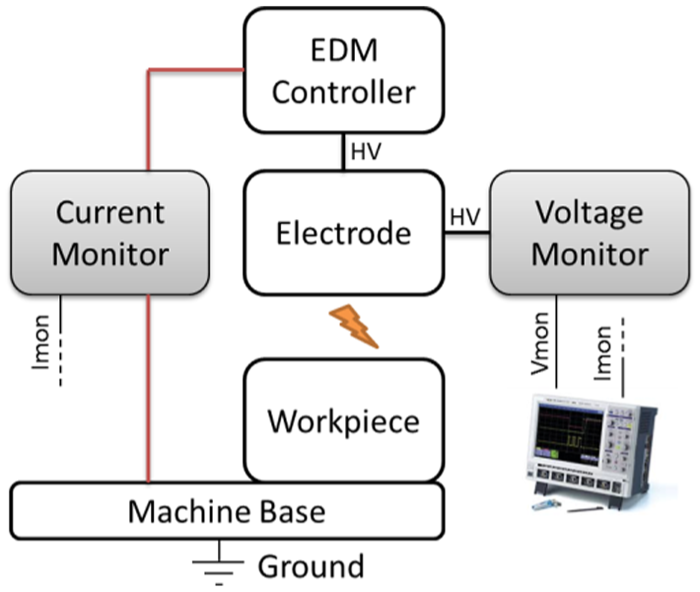
Block diagram of the data acquisition system.
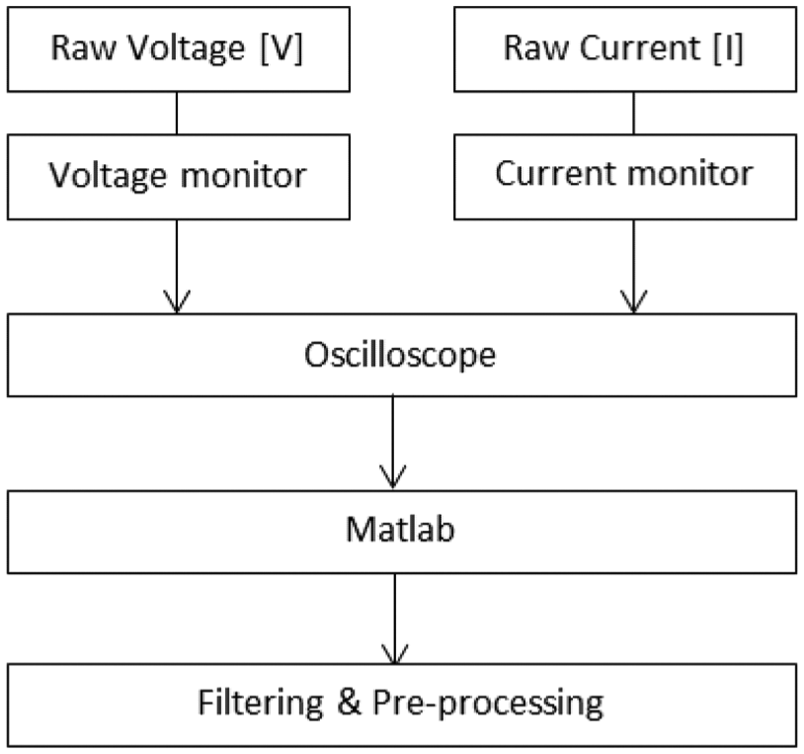
Overview of the data acquisition procedure.
Two electronics modules have been developed for monitoring the electrode voltage on the high side and the discharge current on the low side, respectively. By providing a bipolar supply, the system is able to monitor the machining process even at inverted polarity. Both the modules provide large bandwidth (BW) (direct current (DC) < BW < 10 MHz) in order to preserve the microsecond-based structure of the EDM process and suitable gain in order to enter the scope with signals in the order of few volts. In particular, the voltage sensing is based on a high-value resistor divider, in order to not affect the machine parameters. The obtained low voltage from the divider is successively amplified and buffered, providing the capability at the output to drive a 50-Ω load on a coaxial cable. As concerns the current monitor module, the current is sensed at machine low side in order to not use high-voltage components; the current drawn from the ground passes through a high-power, 10-mΩ resistor. The voltage drop across this resistor is then differentially amplified and buffered for a 50-Ω matching on a coaxial cable. The electronics modules, enclosed in metallic boxes, are mounted on the EDM machine, close to the measurement points. BNC coaxial cables were finally connected to a Teledyne LeCroy WaveSurfer oscilloscope, programmed to perform simultaneous acquisitions of both voltage and current monitor at 1000 MS/s. The acquisition process was automated with the use of a MATLAB program run on a personal computer connected to the oscilloscope via a local Ethernet network. The data are fetched in regular intervals of time from the oscilloscope and they are saved as MATLAB figure files.
A specially designed MATLAB script that iterates over all the data files and computes values such as energy per spark, peak current, peak voltage, and number of sparks per second contributed to the analysis of the electrical graphs. In order to process the data, a proper data filtering and a system to remove the data noise were implemented. In order to carry out an effective data filtering, it is necessary to consider that the sparks are very short in duration and can be confused with simple noise by a filtering algorithm. As a matter of fact, the frequency band of the noise and the sparks are sufficiently different to allow an effective filtering procedure. Figure 4 shows an example of the data before and after the filtering. Once the filtered peak current and voltage data were created, the power data (P(t)) were created through the multiplication of I and V data. In order to detect the presence of a spark, a function was implemented. This function represents the core of the analysis process since the way it is built is decisive in the computation of all the values extracted from the data. The sparks presence function is the following


Voltage (V), current (A), and power (W) of sparks as a function of time.
Observing the graphs, it is possible to note how the beginning of every spark is characterized by a sudden decrease in the voltage level and it is accompanied by an increase in the current value, in conformity with the literature. 22 Similarly, the spark ends when the current goes back to a value close to 0. Based on the previous observation, it is possible to state that a spark happens when
Voltage is below a certain level Vthreshold;
Current is above a certain level Istart;
and similarly, a spark ends when
A spark is currently ongoing;
The current is below a certain level Iend.
The choice of the three parameters, Vthreshold, Istart, and Iend, is crucial since the function able to detect the sparks needs to return the correct number of sparks. At the same time, the function needs to make the sparks comparable to themselves and achieve a certain level of consistency. Moreover, some information about the main process parameters need to be collected, such as the correct number of sparks and the number of detected sparks that maximize their energy.
For each set of parameters used for the experimental campaign, a file was selected and the number of sparks was counted by means of an algorithm able to detect the beginning and the end of each spark. Knowing the effective number of sparks, it was possible to use that information as a constraint in the optimization process allowing the algorithm to find the values of Vthreshold, Istart, and Iend that maximize the energy of all sparks.
For each hole, it was possible to compute the following data:
Total number of sparks;
Average peak current;
Average peak voltage;
Number of sparks per second;
Average energy transferred per spark;
Average energy transferred per second.
Geometrical characterization
In order to evaluate the geometrical characteristics of the micro-holes, two indicators were taken into account: the DOC and the taper rate (TR). The DOC is calculated as the difference between the hole top diameter (Dtop) and the electrode nominal diameter as reported below

The TR indicator is calculated as follows

where Dbottom is the hole bottom diameter and h is the sheet thickness.
Process performance
The micro-EDM drilling process performances were evaluated with two indicators, the MRR and the TWR, calculated as follows

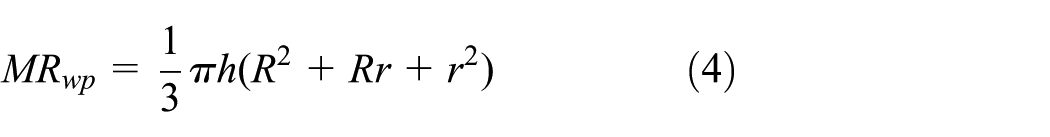
where MRwp represents the material removed from the workpiece and t represents the machining time. The material removed from the workpiece was calculated as the frustum of cone having dimensions equal to the hole top diameter (2R) and the hole bottom diameter (2r), as reported below
As regards the TWR, it is calculated as follows
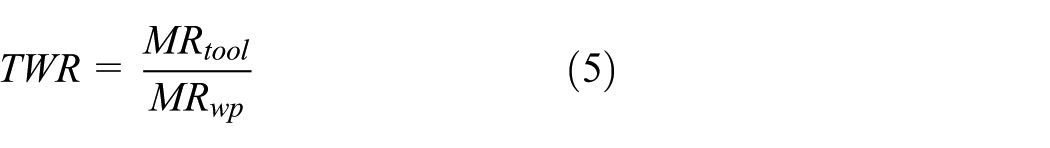
where MRtool is the material removed from the tool, calculated as the volume of the cylinder having external diameter equal to the nominal electrode diameter considering the electrode cavity, since only tubular electrodes were used
Analysis of the results
Analysis of variance
The analysis of variance (ANOVA) was carried out with the nominal values of the process parameters (peak current, voltage, and energy level) in order to identify a possible influence on the final indicators previously described (DOC, TR, MRR, and TWR). First of all, the process parameters I and V were classified as high, medium, and low. Table 5 shows a summary of the ANOVA for the 300-µm electrode and Table 6 shows the p-values for the 150-µm electrode. For the 300-µm electrode diameter, the most relevant factor is the energy level since, if compared with the others, it influences all the indicators except the TR. In general, a factor is considered to have a relevant influence if its p-value is lower than the cutoff limit of α = 0.05. It is possible to note that for the 300-µm electrode, the process performance indicators (MRR and TWR) are more influenced by the factors than if compared with the geometrical indicators’ situation. This aspect is amplified for the 150-µm electrode. In this case, the influence of the process parameters is recorded only on the process performance indicators MRR and TWR: the TWR is influenced by I, V, and the energy level while the MRR is influenced only by the voltage and the energy level. For the 150-µm electrode, no parameters’ interaction is recorded and the geometrical indicators are not influenced by the process parameters. From this first analysis, the difference made by the electrode diameter on the final result appears evident: a reduction in the electrode diameter results in a less considerable influence of the process parameters on the considered indicators. As it is possible to see in section “Effect of the actual electrical power on MRR and TWR,” this effect can be due to the actual value of electrical power that for the tests with 150 µm diameter shows negligible differences among the combination of process parameters (see Figure 12). For both electrode diameters, the TWR indicator is the most influenced by the process parameters and their interaction.
Analysis of variance p-values for diameter of 300 µm.

DOC: diametrical overcut; TR: taper rate; MRR: material removal rate; TWR: tool wear ratio.
Analysis of variance p-values for diameter of 150 µm.

DOC: diametrical overcut; TR: taper rate; MRR: material removal rate; TWR: tool wear ratio.
The performance indicators are the most affected by the process parameters while the geometrical indicators are slightly influenced (only the DOC for the 300-µm electrode is influenced). It can be noted that copper electrode has lower mechanical characteristics (e.g. with respect to tungsten carbide electrode) that damage the geometrical and dimensional accuracy of the machined workpieces. Figure 5(a) and (b) shows the main effects’ plot for DOC for both electrode diameters. An example of entrance and exit sides of a micro-hole obtained using 300 µm electrode diameter is given in Figure 6.

DOC main effects’ plot for (a) 300 µm and (b) 150 µm electrode diameter.
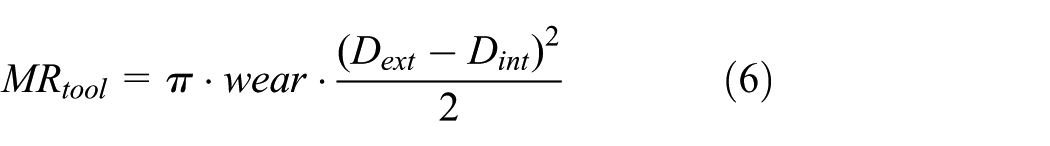
(a) Entrance and (b) exit side images of a micro-hole obtained using 300 µm electrode diameter.
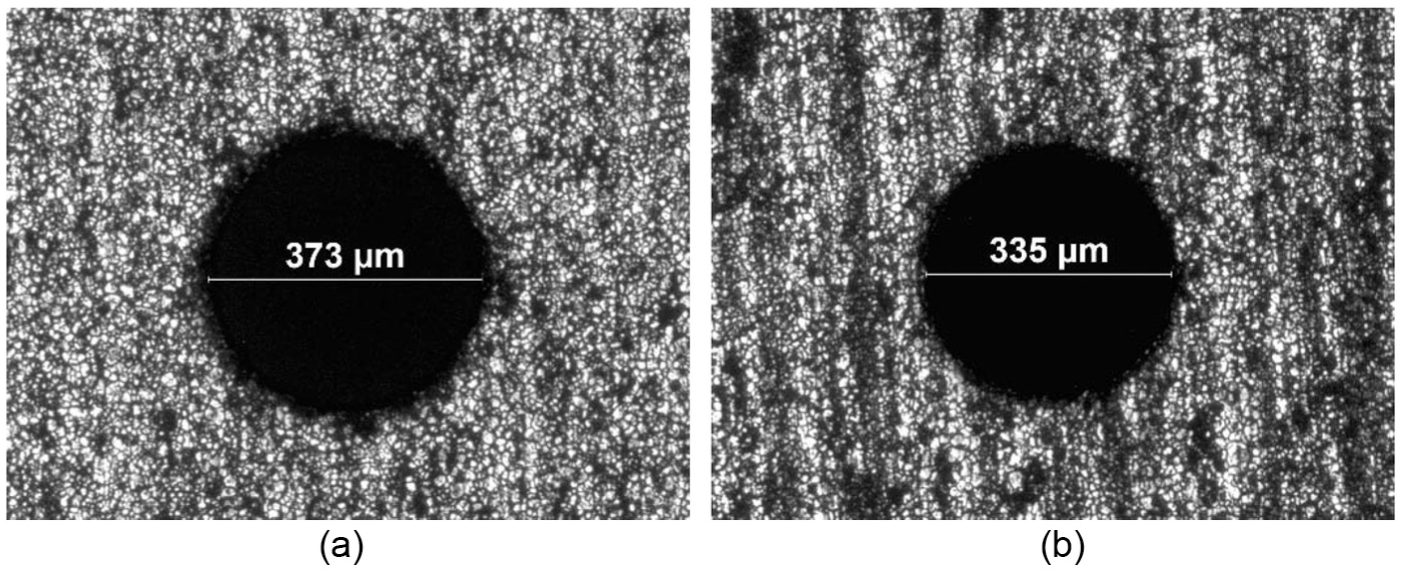
Based on the previous considerations, the results of the ANOVA will be shown for the performance indicators only. The main effects’ plots for the TWR indicator, Figure 7(a) and (b), testify the relevance of the energy level. Even if only the main effects’ plot for the TWR is shown here, it can be considered representative for the MRR indicator, which for the sake of simplicity is not reported. For the 300-µm electrode, the influence of the energy level is more relevant than for the 150-µm electrode, for which the voltage and the current represent relevant factors as well, as previously confirmed by the p-value analysis. These results confirm the tendency previously described by the p-values, for which the electrode diameter has a considerable role influencing the final response.
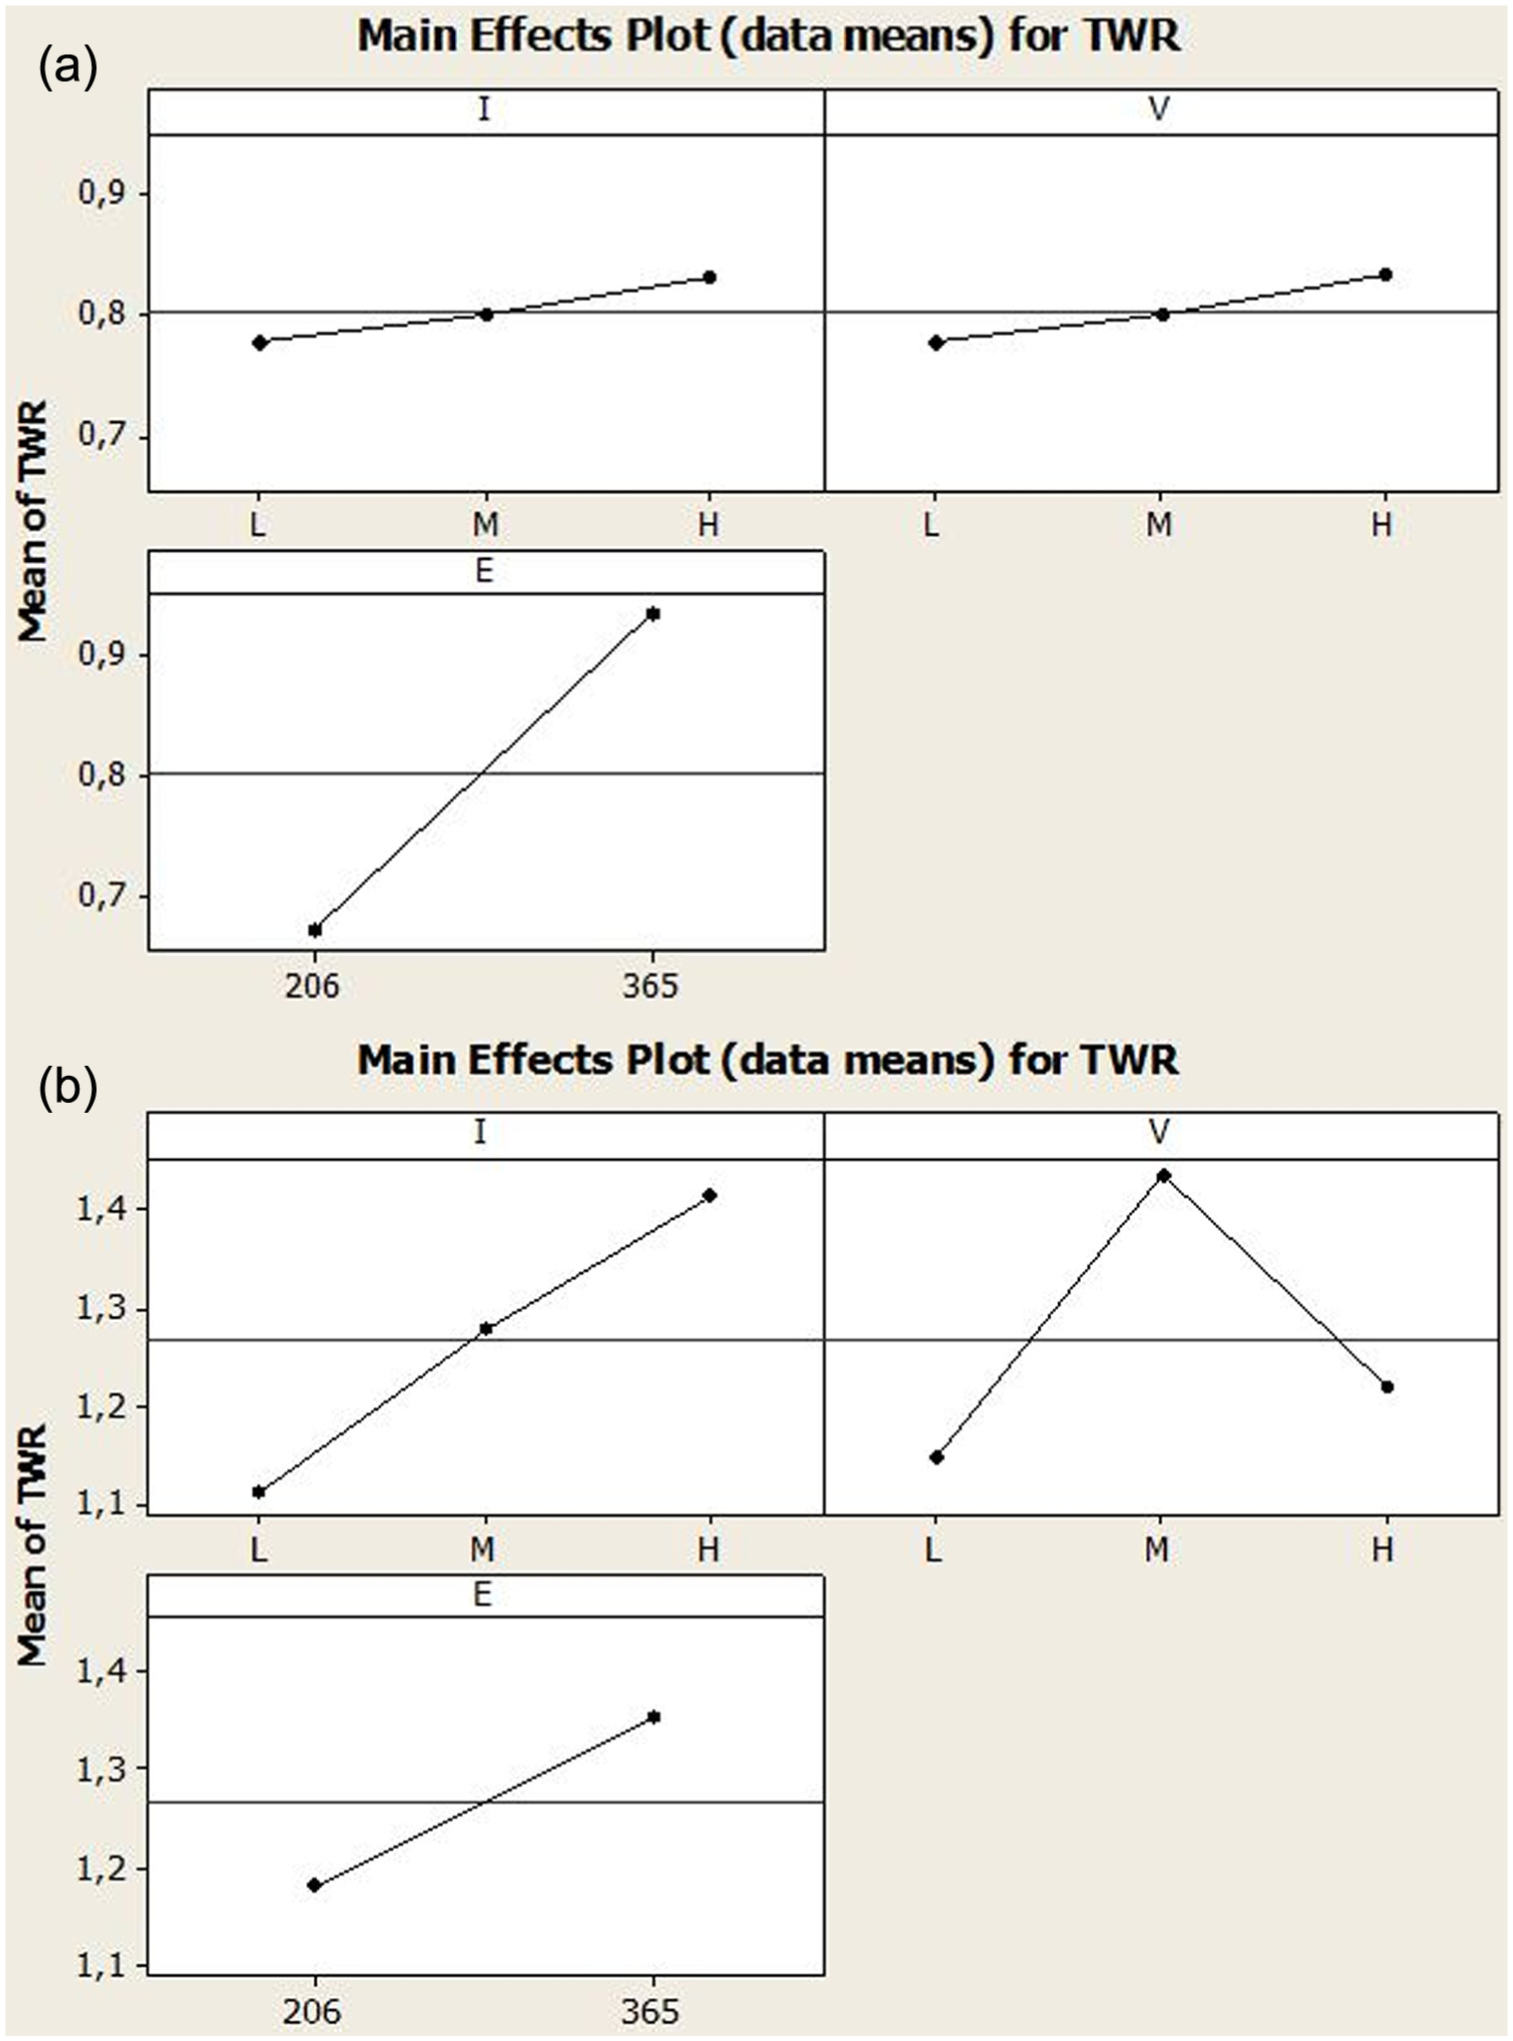
TWR main effects plot for (a) 300 µm and (b) 150 µm electrode diameter.
As an example, Figures 8(a) and (b) and 9(a) and (b) show the interaction plot for the TWR and MRR indicators, respectively. As a matter of fact, even though the p-value analysis for the smaller diameter does not give any relevant information about the combined effect of the factors, a certain interaction is still recorded, as shown in Figure 8(b). In this case, a slight interaction is testified by the different inclination of the curves, which becomes particularly significant for the low level of the peak current.

TWR interaction plot for (a) 300 µm and (b) 150 µm electrode.

MRR interaction plot for (a) 300 µm and (b) 150 µm electrode.
Comparing the results obtained for the 300- and 150-µm electrodes, it is evident how the effect of the process parameters (I, V, and E) is relevant.
Effect of the actual electrical power on MRR and TWR
In order to identify and use a variable able to represent the combined effect of the process parameters, the exchanged electrical power was employed. The power exchanged between the electrodes was considered a variable able to summarize the influence of I, V, and E and to investigate their real influence on the final response. The formulation of the electrical power is the following

where P represents the exchanged power expressed in watts, I the peak current in amperes, and V the voltage in volts. With the acquisition system, the exchanged power can be calculated knowing the number of sparks per second and the energy per spark, obtained from the analysis of the acquired signal previously described.
The combination of the process parameters (low, medium, and high) reported in the x-axis is made of two letters, the first referring to the peak current level and the second to the voltage. The bars are divided into three groups for the three levels of the peak current, and within each peak current bar’s group, the effect of the voltage is always the same, resulting in increasing values of the exchanged power. It is possible to note a considerable difference between the power exchanged for the high level of the energy and the power exchanged with the low level of energy, as shown in Figures 10 and 11, respectively.

Electrical power as a function of the process parameters’ combination, d 300 µm, E 365.

Electrical power as a function of the process parameters’ combination, d 300 µm, E 206.
This phenomenon is partially due to the sparking gap that, in the case of the 300-µm diameter, was increased to the value of 75. This choice was made in order to minimize the number of short circuits and to optimize the removal mechanism. In general, the exchanged power is directly proportional to the value of the process parameters previously set, as shown in Figures 10 and 11, with the only exception of the M-H and H-H process parameters’ combinations for which the exchanged power is inverted.
Different conclusions can be drawn for the 150-µm diameter. In this case, no significant difference is found between the process combinations of parameters, and a general flattening effect is recorded here, as shown in Figure 12. Moreover, the degree of magnitude of the electrical power is significantly inferior with respect to the one obtained using 300 µm diameter. This effect can be related to the diameter reduction and then to the smaller discharge channel.

Electrical power as a function of the process parameters’ combination, d 150 µm, E 365.
Since no significant trend can be found for the 150-µm exchanged power, this article will focus on the result obtained for the 300-µm electrode. Moreover, since the expected trend of the exchanged power was verified, the next step consisted in the evaluation of the indicators as a function of the exchanged power. As regards the MRR indicator, for both energy levels, a significant trend can be found, as shown in Figures 13 and 14 (bars refer to power while dots refer to MRR). The lines indicate the trend due to an increase in voltage (for each trend of data having the same peak current value).
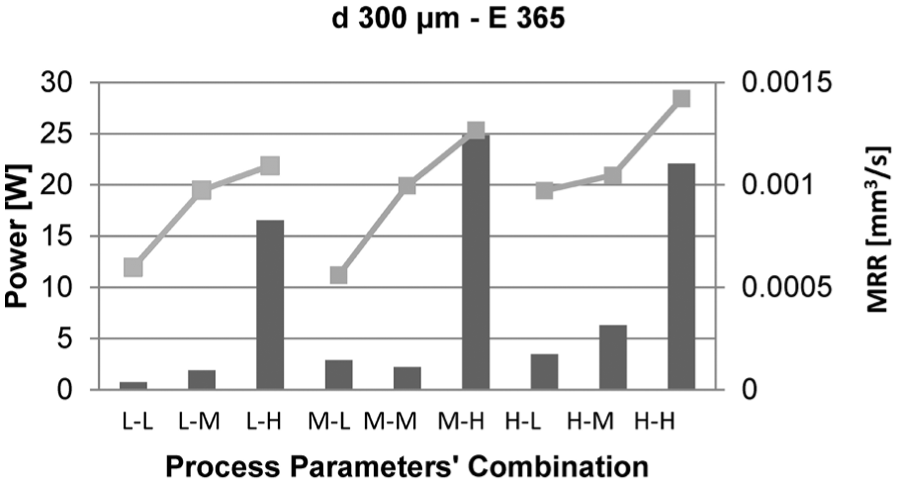
MRR (dots) and electrical power (bars) as a function of the process parameters’ combination, d 300 µm, E 365.

MRR (dots) and electrical power (bars) as a function of the process parameters’ combination, d 300 µm, E 206.
For both energy levels, the increasing exchanged power results in an increasing MRR. This phenomenon is explained considering the aggressiveness of the machining corresponding to higher exchanged power. From a comparison of the results obtained with the two energy levels, it is possible to note that for the 365 wave shape, the exchanged power has an order of magnitude 10 times higher than the 206 wave shape and the same result is observed for the MRR indicator value. Moreover, in both cases the MRR trend is directly proportional to the electrical power. The same result is obtained studying the MRR trend as a function of the exchanged power, as shown in Figure 15. The result reported here for the 206 energy level can be representative of the 365 energy level as well, which for the sake of simplicity is not reported here.

MRR as a function of the electrical power, d 300 µm, E 206.
As regards the TWR, a defined trend can be found for both energy levels. In Figures 16 and 17, the obtained results are shown (bars refer to power while dots refer to TWR). The lines indicate the trend due to an increase in voltage (for each trend of data having the same peak current value).

TWR (dots) and exchanged power (bars) as a function of the process parameters’ combination, d 300 µm, E 365.

TWR (dots) and exchanged power (bars) as a function of the process parameters’ combination, d 300 µm, E 206.
In this case, it is possible to note that the TWR increases for increasing values of the exchanged power. As a matter of fact, the tool wear for the high level of the exchanged energy is more severe, but for the 206 wave shape a more considerable effect on the indicator is found. In this case, in fact, the flattening effect recorded for the 365 wave shape is not recorded. In order to have a better understanding of the TWR trend, Figure 18 shows the TWR as a function of the exchanged electrical power. It is observed that as explained before, the increasing power has a negative effect on the wear ratio: this means that for increasing values of the power, the amount of the material removed from the tool is higher than the material removed from the workpiece. In other words, for increasing values of the power, the machining efficiency decreases.
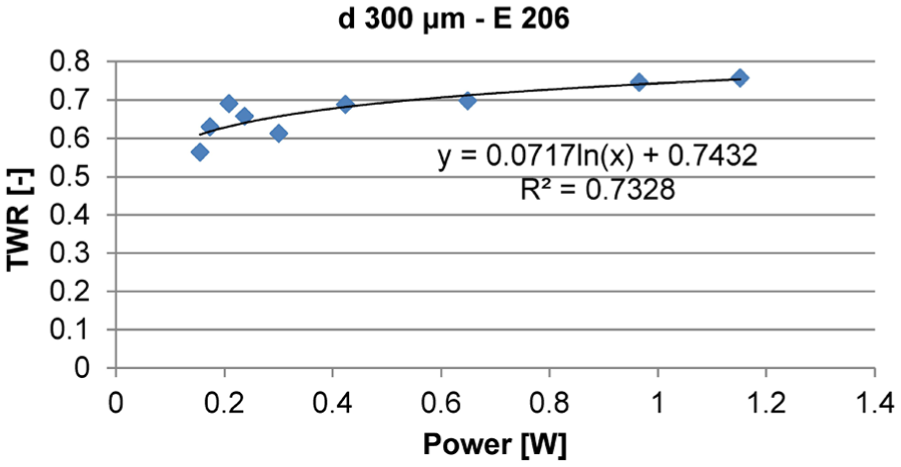
TWR as a function of the electrical power, d 300 µm, E 206.
Predictive models
The possibility to forecast the process performance of the micro-EDM drilling process is particularly useful. In industrial EDM drilling operations, the main variable cost terms are the electrode wear and machining time. Using the proposed models, it is possible to estimate the machining time, wear, and then the related terms in machining costs, and finally the process feasibility.
In order to carry out the regression analysis, Weka, an open source data mining software, was used. 23 From an industrial point of view, the electrode wear and the machining time are the two most relevant aspects of monitor and eventually forecast in micro-EDM. For both indicators, two different approaches were implemented: a “linear” modeling and a “model tree” approach. The linear regression model was used to investigate the dependent variable (Y), given the values of the independent variables (Xi), as reported in the following equation

The coefficients (βi) are provided here, as well as the final equation for the selected variable. The model tree approach instead provides a more detailed relationship between the independent variables for numerous different experimental cases, describing the result with a higher level of confidence and with a lower error. For both models, a 10-fold cross-validation approach was used, meaning that the data set is divided into 10 parts, then 90% is taken for the training and the last 10% is used for testing. Then with the same division (90%–10%), another 90% is selected for training and the other held-out 10% (different from the previous) is used for testing. This procedure is repeated 10 times with different 90% selections. This approach helps for the estimation of the error with the first 10 runs and for the implementation of the classifier with the 11th run. Once the cross-validation was implemented, the software runs the algorithm with the whole data set for the 11th time. This leads to the production of the classifier usable for the prediction of the analyzed variable.
The initial data set variables considered here for the regression are the following:
Electrode nominal diameter (D);
Energy level (E);
Peak current (I);
Peak voltage (V);
Energy per spark (E/spark);
Energy per second (E/s);
Total number of sparks (S);
Number of sparks per second (S/s);
Electrode wear;
Machining time;
Hole top diameter;
Hole bottom diameter.
It is important to remark that the different regression equations presented in the next sections come from the same initial data set variables; then, based on the ANOVA results and regression analysis, the equations for the wear and machining time have been obtained. The input–output relation has been evaluated using both linear model (LM) and non-LM, and the resulting equations can be applied for the estimation of the wear and machining time when stainless steel is EDM-drilled using copper electrode.
Regression model for the electrode wear
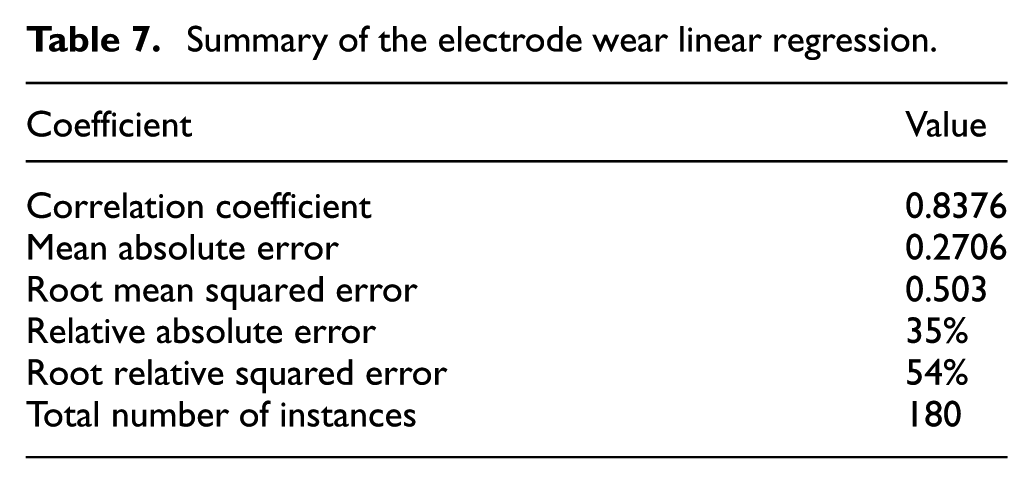
The variables considered here for the linear regression for the electrode wear are the diameter, the energy level, the peak current, the voltage, the energy per spark, the number of sparks, the sparks per second, and the energy per second. Based on their relevance, the factors are selected and included in the predictive models. The linear regression equation is the following

Table 7 shows the summary of the linear regression. It is possible to note that the correlation coefficient is already good and the introduction of the model tree approach does not improve the prediction capabilities of the model.
Summary of the electrode wear linear regression.
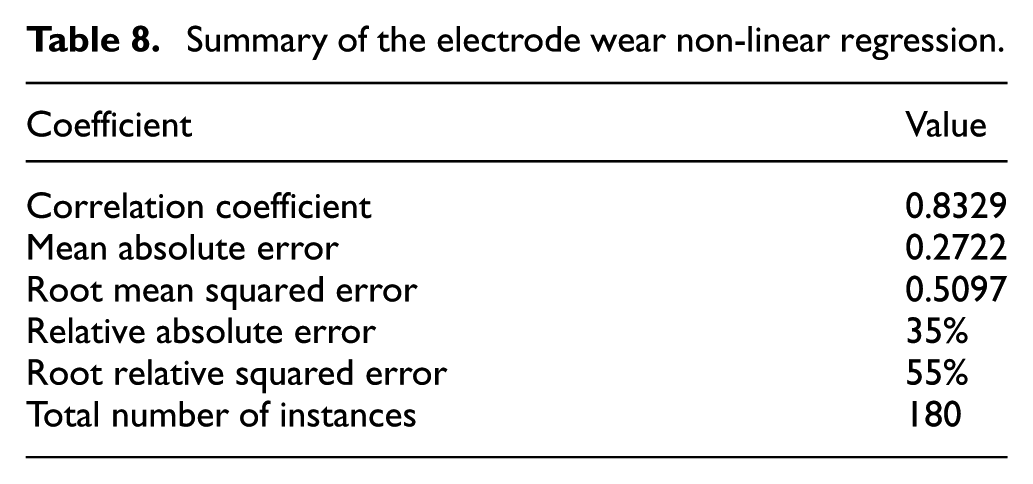
The structure of the non-LM obtained here corresponds to the LM obtained previously. As a matter of fact, in this case, no significant improvement is provided by the non-linear approach, as observed by the details reported in Table 8.
Summary of the electrode wear non-linear regression.
Regression model for the machining time
The same analysis carried out for the electrode wear was executed for the machining time, and the variables considered for the regression are the same as for the electrode wear.
The linear regression equation is reported in the following equation
The correlation coefficient is reported in Table 9.
Summary of the machining time linear regression.

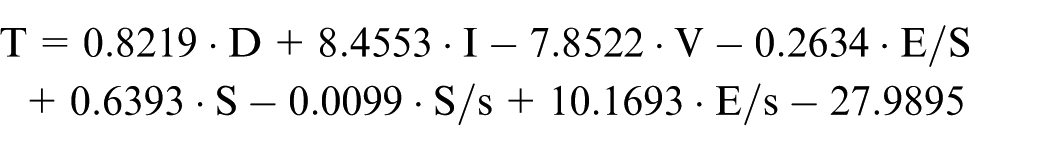
In case of the non-linear regression approach, it is possible to increase the prediction capabilities of the model. The details of the non-linear regression coefficients are shown in Table 10. The graphical model tree is resumed in Figure 19.
Summary of the machining time non-linear regression.


Non-linear regression model tree for machining time.
The details of the LMs corresponding to the branches of the model tree are reported as follows:
LM1: t = 0.1957·D + 64.5968·I − 62.5608·V + 1.1307·E/S + 0.1522·S − 0.0334·S/s + 2.4213·E/s + 638.4333;
LM2: t = 0.1957·D + 77.4663·I − 56.7107·V + 1.1307·E/S + 0.1522·S − 0.0334·S/s + 2.4213·E/s + 582.6172;
LM3: t = 0.1957·D + 14.9971·I − 12.3741·V + 0.8588·E/S + 0.1522·S − 0.0508·S/s + 2.4213·E/s + 513.2256;
LM4: t = 0.1146·D + 3.3339·I − 0.8012·V − 0.0269·E/S + 0.1241·S − 0.0095·S/s − 11.3123·E/s + 215.169;
LM5: t = 0.4086·D − 4.7839·I − 0.8012·V − 0.0269·E/S + 0.1243·S − 0.0018·S/s + 1.0377·E/s + 54.7891;
LM6: t = 0.1499·D − 0.1735·I − 0.8012·V − 0.0269·E/S + 0.1272·S − 0.0018·S/s + 1.0377·E/s + 76.2449;
LM7: t = 0.1499·D − 0.4649·I − 0.8012·V − 0.0269·E/S + 0.1272·S − 0.0018·S/s + 1.0377·E/s + 73.4725.
As a general remark, the non-linear approach ensures a lower error level and better regression capabilities than the simple linear regression. A trade-off between the usability of the model and the prediction capabilities still exists: it is necessary to evaluate for each case whether the real improvement in the regression capabilities is balanced by the considerable increment of complexity of the model. In fact, a linear regression model is in general easier and faster to be used with respect to a non-LM. In several industrial cases, an easier and practical solution is preferred to a complex one, even though the level of accuracy is lightly lower.
Conclusive remarks
The effect of the actual process parameters on the process performance of micro-EDM drilling of stainless steel was investigated. Copper electrodes having different diameters were used in order to investigate the effect of the electrode size on the geometrical characteristics of the micro-holes and on the process performance. In order to investigate the effect of the varied process parameters (current, voltage, and energy level), a DOE approach was applied. As a general remark, the electrode diameter together with the energy level demonstrates to have a great influence on the final value of the indicators. The ANOVA showed two different behaviors for the electrode diameters: for the 300-µm one, the energy is the factor influencing the highest number of indicators (DOC, MRR, and TWR). The process performance indicators (MRR and TWR) result to be more influenced by the parameters’ variation with respect to the geometrical indicators (DOC and TR). As regards the 150-µm diameter, only the process performance indicators are influenced by the varied parameters and no significant effect of the parameters’ interaction is recorded. In order to investigate the influence of the actual process parameters on the final result, the electrical power was chosen as representative variable, able to summarize the effect of peak current, voltage, and energy. The direct proportionality between the exchanged power and the nominal process parameters was verified only for the 300-µm electrode, while a general flattening effect was recorded for the 150-µm ones.
The power exchanged with the 300-µm electrode was 1 order of magnitude bigger than the power exchanged with the 150-µm electrode. As regards the 300-µm electrode, the increasing exchanged power results in increasing removal rates, for both energy levels. The same trend is verified for the TWR, for which the increasing power results in a decreasing machining efficiency.
Finally, LM and non-LM were developed for the electrode wear and machining time prediction. As regards the electrode wear, the non-linear approach does not provide a significant improvement of the prediction capability since the non-LM exactly corresponds to the linear one. Differently, for the machining time, the non-LM provides a better prediction capability, counterbalanced by a considerable complexity of the model.
From an industrial point of view, the measurement of the actual process parameters and the application of machine learning techniques gave a contribution in developing predictive models for the most relevant aspect of the process, such as the machining time and the electrode wear. Further developments may extend the experimental conditions, taking into account different combinations of electrode–workpiece materials, thereby investigating the effect of the material properties.
Footnotes
Appendix 1
Academic Editor: Veeramani Anandakrishnan
Declaration of conflicting interests
The author(s) declared no potential conflicts of interest with respect to the research, authorship, and/or publication of this article.
Funding
The author(s) received no financial support for the research, authorship, and/or publication of this article.