
Abstract
Data for processing of micrometric geometric features via electro-discharge machining are not widely available. This article describes a methodology to produce microfeatures with a low-cost, open-architecture micro-electro-discharge machining setup using a Resistive–Capacitive oscillator as the power source. The goal of this work was to identify process condition parameter values to maintain a stable micro-electro-discharge machining process. The setup consists of a machine under development for the fabrication of two-and-a-half-dimensional microstructures on conductive materials, using 254-µm-diameter brass electrodes. Three performance parameters were defined to characterize the process: material removal rate, ratio of electrode to workpiece wear, and surface finish. Because of their relevance to the viability of the process, voltage and energy were selected as controllable parameters. The effect of controllable parameters on the mean and standard deviation of the performance parameters during machining of an A36 cold drawn steel workpiece was studied. Voltage and energy values that resulted in a stable process were identified from this exploratory study. Microchannels of 290 µm width (discharge over cut of 18 µm on lateral walls), 50 µm depth and various millimeters long were machined to test selected values. Microchannel depth was maintained constant by applying a sloped motion that compensated for electrode wear.
Keywords
Introduction
There is an increasing demand for parts that have geometric details whose dimensions are under 100 µm. 1 Nonconventional manufacturing processes such as laser cutting, electro-discharge machining (EDM), electro chemical machining, and lithography have found extensive use in the fabrication of such components because of their relatively small energy consumption and their ability to process a variety of materials, such as ceramics and metals. 2
Micro-EDM (µEDM) has the capability of producing complex geometries in hard materials such as polycrystalline diamond cutting tools 3 and dressing of metal-bonded diamond grinding wheels. 4 Micromachining of ferrous metals by conventional methods is hindered by the chemical affinity of diamond tools and carbon, which leads to excessive wear and premature failure of tools. 5 This is not an issue with µEDM. Features with aspect ratios of 6 to 1 (depth to width) or more can be manufactured with relative ease. Microholes are a typical example of geometries in which EDM has found extensive use. 6
An emerging trend is the development of low-cost, open-architecture manufacturing equipment for precision applications.7,8 An important factor for the introduction and dissemination of this type of equipment is the availability of process control parameter data. While processing conditions and data for conventional processes are available for a wide variety of materials, EDM process data are difficult to find, particularly for micromanufacture.
This work explores the effects of different process parameters on the characteristics of geometric features produced on a low-cost, open-architecture precision µEDM machine that is under development. This article is organized as follows: section “The µEDM process” presents a literature review on the state of the art. Section “µEDM machine architecture” describes the µEDM machine used for experimentation. Section “Screening of process control parameter levels” discusses the experimental approach used for screening of the process control parameters. Section “Screening experiments results” presents the results and discusses the selection of favorable process conditions. Section “Microchannel fabrication” describes the process of microchannel fabrication and introduces a tool wear compensation technique. Applications for the fabrication of complex channels and the improvement of surface finish are presented in section “Discussion.” Conclusions and future work are presented in section “Conclusion and future work.”
The µEDM process
The µEDM process does not require physical contact of tool and workpiece. A gap is maintained between the part and the electrode during the process. Plasma discharges produced by a voltage difference between electrode and workpiece are responsible for removing material and producing desired features. 9 Constant monitoring of the gap dimension is essential for process stability. Previous work has shown that gaps under 10 µm are needed for a stable process. 10
During the process, the electrode suffers erosion which affects the tool geometry. This electrode wear, inherent to the process, presents an important challenge for obtaining desired geometric features. Electrode wear is difficult to predict because of the nonlinear and time-varying characteristics of the process. 11
Several process control approaches have been used to account for the stochastic nature of µEDM. Liu and Tarng 12 report the development of neural networks to sort pulse types that occur during on-line monitoring of plunge EDM. With this information, they controlled voltage and current values across the gap to produce a stable process. A different approach was proposed by Izquierdo et al., 13 who used numerical models of thermal fields produced by the multiple discharges, to estimate material removal rates (MRRs) and surface finish. In their work, the control parameters were voltage, current, and time of spark duration. Models for single instantaneous discharges and plasma channels, which rely on voltage, time of duration of discharge, energy, gap distance, and electrode diameter as control parameters, have also been proposed. 14 Marafona 15 modeled the effects of the spark generation on the EDM process by calculating the heat generated through the spark discharge channel. A finite element (FE) model was developed to predict temperature patterns in the part and electrode for predetermined values of current and power. From this, surface finishes were predicted, which compared favorably with vendor’s data. Other studies have used statistical approaches such as multi-response optimization with Taguchi methods to predict response characteristics such as MRR, surface finish, wear ratio, and geometrical error. Yet others studied the use of parameters such as pulse-on time, delay time, ignition current intensity, voltage, and energy for process control during statistical studies of powder-mixed EDM and microhole EDM machining.16,17
As shown in the review, previous studies have been successful in establishing and documenting process control strategies for plunge EDM during manufacture of holes and geometries that can be obtained by direct feed of the electrode. For the most part, these studies have used multiple control parameters for the plunge EDM process. Specific parameter values and their effects are seldom presented. This work explores the use of only two process parameters, voltage and magnitude of discharge energy, for the fabrication of channels in a conductive material such as A36 Steel. In particular, this work studies the effects of these parameters for a µEDM process in which a cylindrical electrode feeds laterally. Selected magnitudes of both variables were similar to those reported for a switched µEDM power supply during microhole making.10,18 Voltages under 100 Vdc and energies around 100 µJ were analyzed. The rest of the article discusses the analysis of the effects of these parameters on MRRs and surface finish from which a favorable control parameter combination was identified.
µEDM machine architecture
Experiments were performed in an in-house-built µEDM machine equipped with a Resistive–Capacitive (RC) oscillator power source, shown in Figure 1. The machine consists of an orthogonal structure that uses linear stages with flexible nuts to eliminate backlash. Each linear stage uses a stepper motor of 200 steps per revolution and a microstepping driver to increase resolution. The pulley configuration combined with the lead of the screw provides a theoretical resolution of 1.5 µm of linear displacement per axis. The configuration allows motion of the electrode tool in three axes (X, Y, and Z). The travel range of the machine in the X–Y–Z directions is 100, 50, and 50 mm, respectively. Experimental tests have shown that the machine can achieve a real positioning accuracy of 3 µm. An electrode holder supports segments of brass wire for Wire-EDM of 254 µm diameter (HBZ-K0.010 Hitachi). A piezoelectric bimorph was used to oscillate the electrode with a frequency of 8 kHz and amplitude of 7 µm. This frequency is the same as the natural frequency of discharge of the RC oscillator employed to generate the plasma discharges.
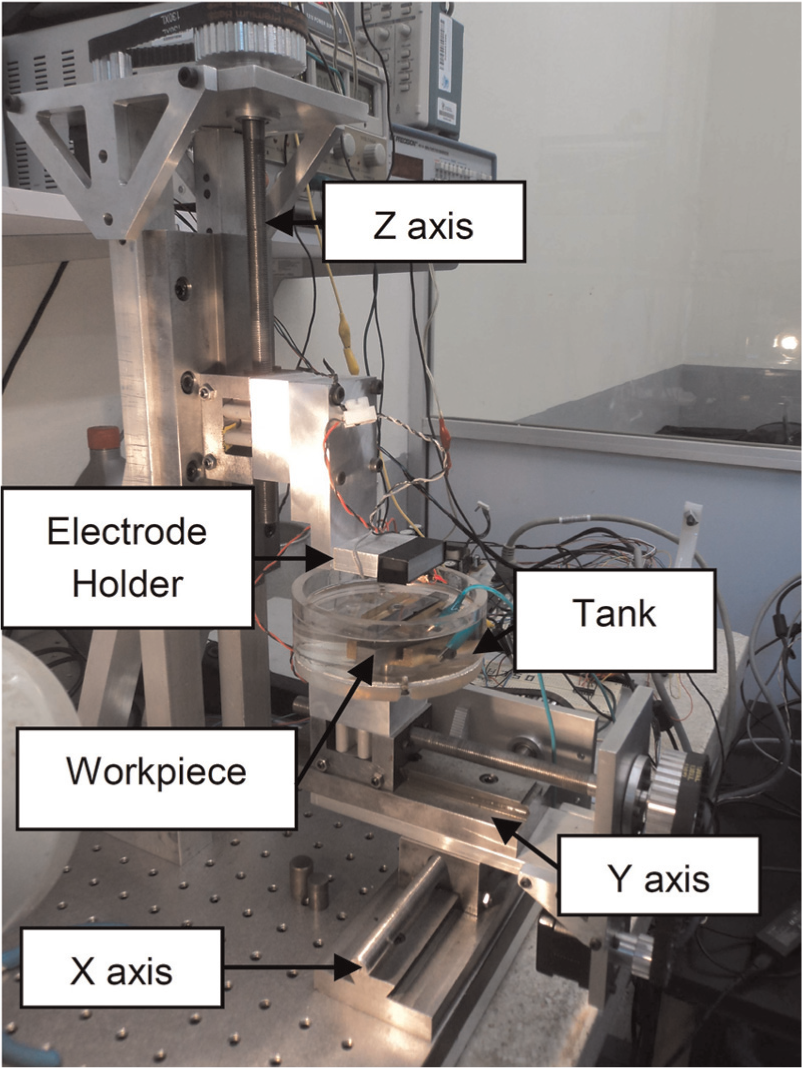
µEDM machine used to perform experimental work.
The machine is controlled by standard numerical control commands. The basic control architecture is presented in Figure 2. Gap control is done by an Arduino board running an Atmel microcontroller using a voltage level detection approach, for indirect measurement of the gap distance. The motion control implementation of the open-source computer numerical control (CNC) is described in detail in Chaides et al. 19 Hydraulic oil Mobil© DTE 25 was used as dielectric fluid.
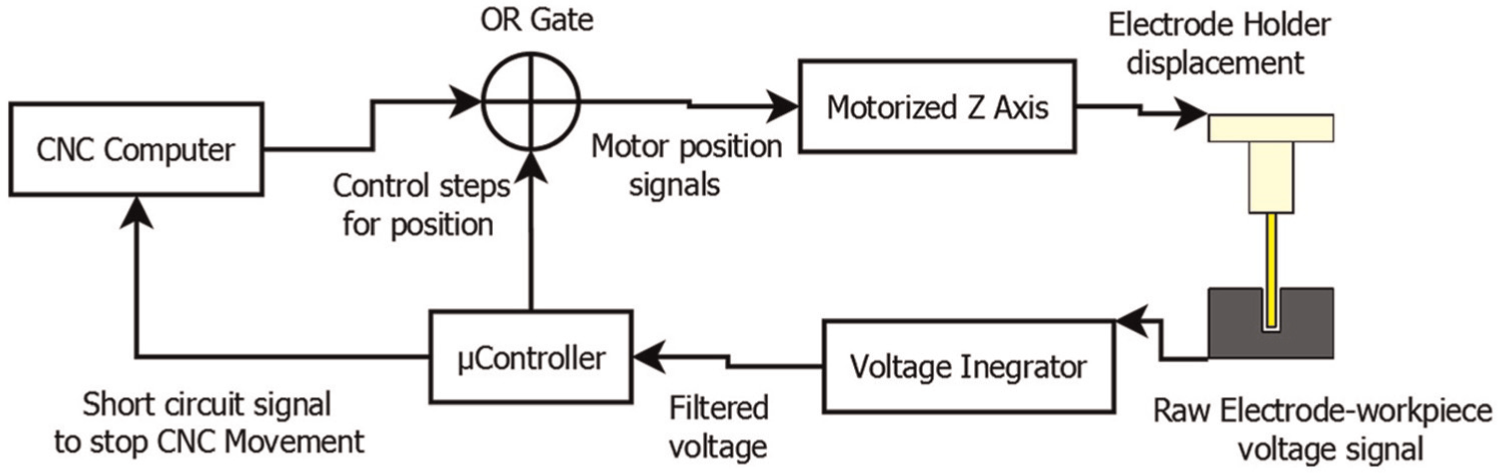
µEDM machine control architecture based on open-source CNC motion controller.
Figure 3 illustrates the gap control strategy which helps maintain a stable process. Voltage across the gap is monitored continuously. A threshold is established for controlling the position of the electrode. The speed of the electrode as it moves into the part, known as feed, is controlled depending on the magnitude of the voltage across the gap.
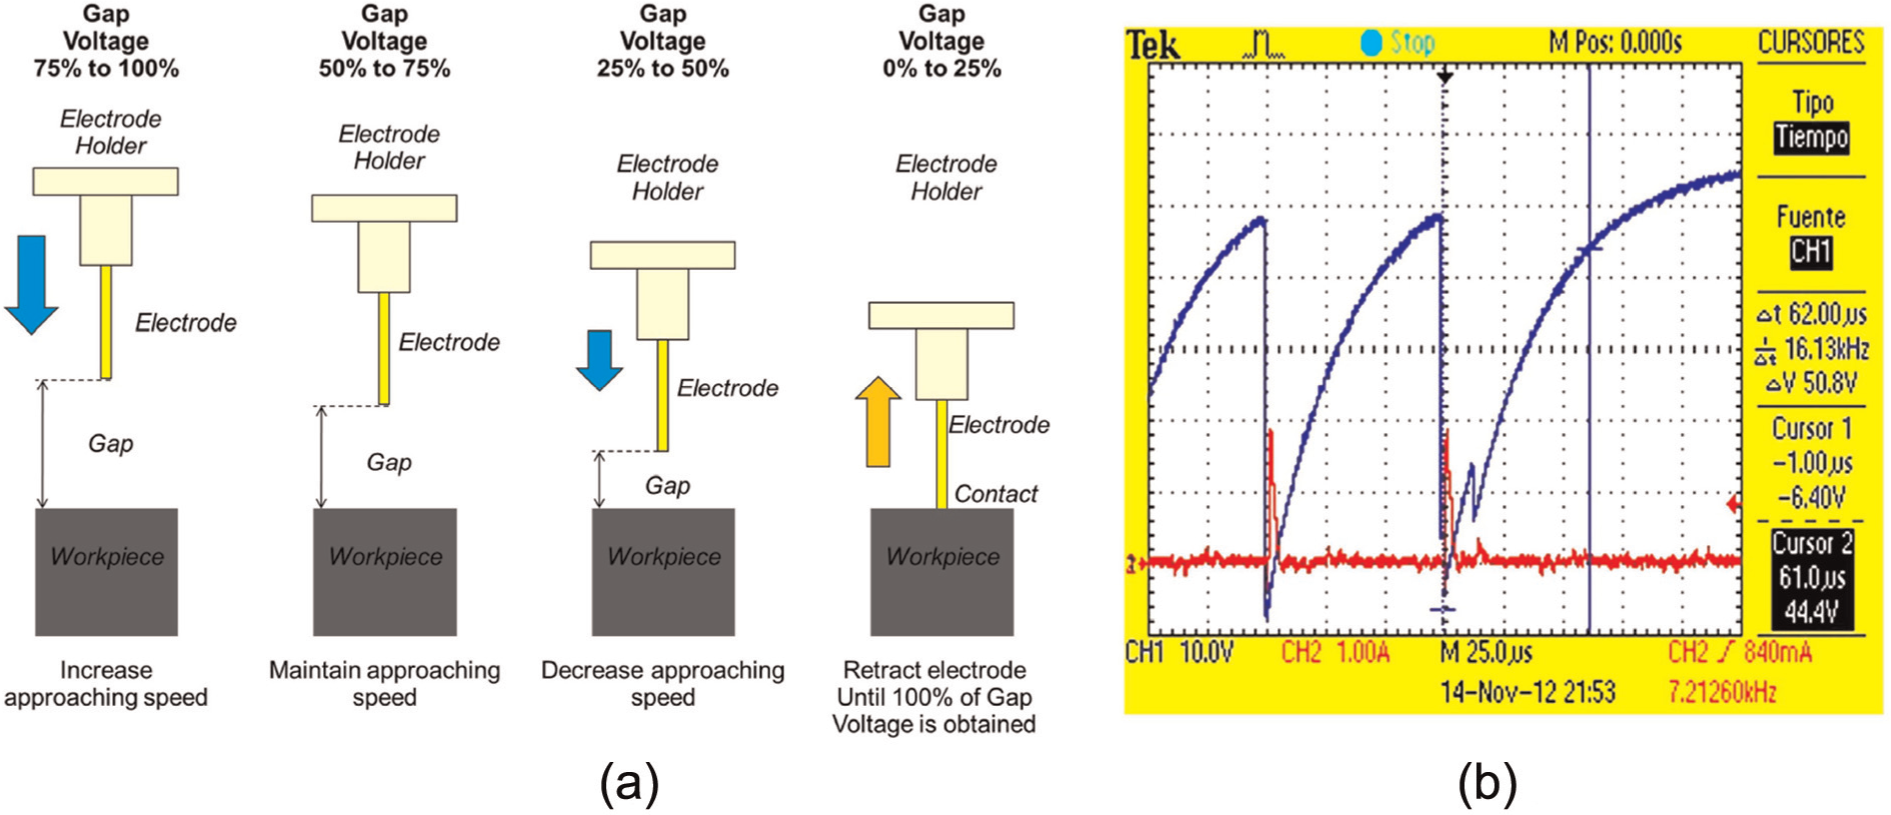
Schematic of gap control strategy: (a) µEDM process stability is attained by maintaining the size of gap in a specific range and (b) voltage and current waveforms between electrode and workpiece in the presence of two consecutive discharges spaced by a 75 µs delay.
The gap distance is maintained in the desired range by monitoring the voltage and moving the electrode in response. By controlling the gap distance, and with proper value of energy, a stable µEDM process can be established. A stable process is characterized by a cyclic generation of voltage and current across the gap, shown in Figure 3(b), which in turn produces a uniform, continuous MRR.
Screening of process control parameter levels
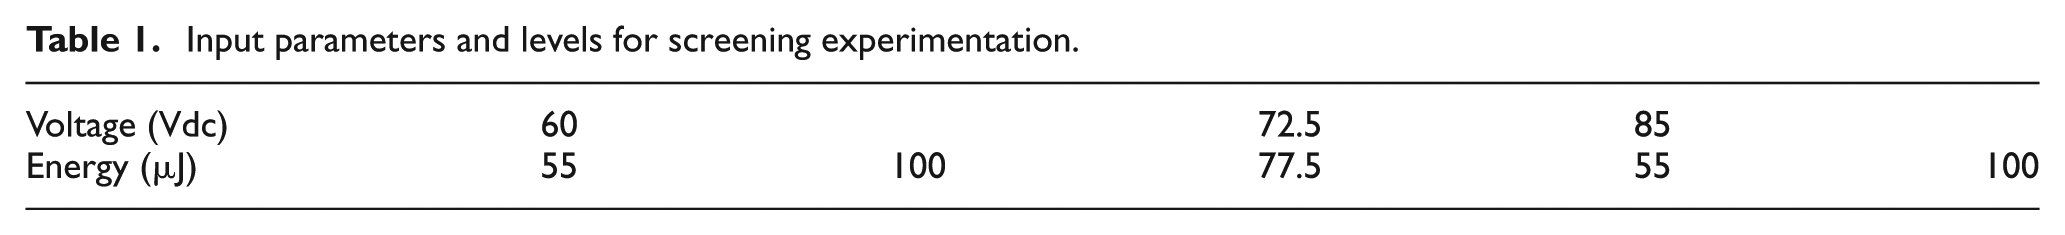
As explained before, this work proposes the use of two parameters to achieve a stable µEDM process. Direct current (DC) voltage between electrode tool and workpiece (Vdc) and energy discharge per spark (µJ) are the process control variables. To find a favorable combination of parameter levels that leads to a stable process, various levels of voltage (Vdc) and energy (µJ) were tried during the fabrication of microholes in a screening experiment. The combinations of levels that were used in these experiments are shown in Table 1. A total of five different combinations were evaluated. The levels chosen for this screening experimentation were based on the results from previous studies. 10 Chosen parameter levels allow continuous processing in a range considered typical of µEDM (energy/discharge < 100 µJ), with direct polarity (electrode connected to the anode).
Input parameters and levels for screening experimentation.
As mentioned before, stable conditions imply a combination of process control values that result in a continuous MRR by the µEDM process, which in turn produces geometric features of consistent quality. To support the selection of favorable control parameter combinations, three quality metrics were defined and monitored. The first one was MRR, defined as the volumetric material removed from the workpiece per unit time, which has a direct effect on the manufacturing time and cost. Equation (1) shows how it is calculated.
The second metric was a dimensionless quantity that represents the ratio of electrode to workpiece wear (RWEW). Numerically, it is the difference in length of the electrode, before and after the process, divided by the depth of a hole machined in the process. Equation (2) shows how RWEW is calculated. This parameter helps evaluate the effectiveness with which the electrode is consumed. Electrodes were cut to a length of 5 mm before each test
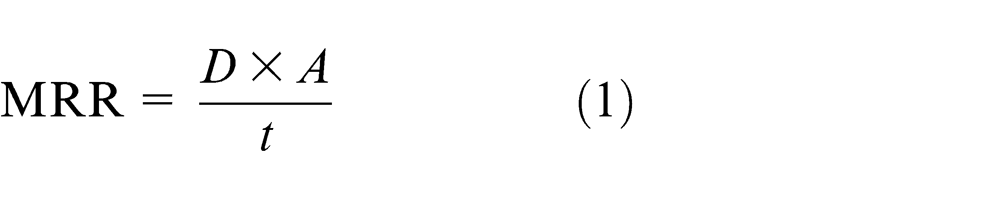
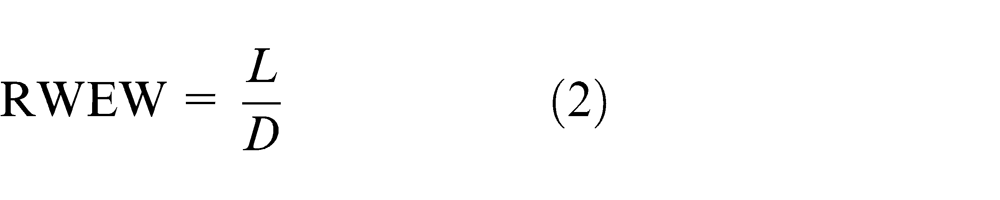
where MRR is the material removal rate, RWEW is the ratio of electrode to workpiece wear, D is the depth of the finished hole, A is the transversal area of the electrode, t is the time (min), and L is the change in the electrode length.
The third metric selected was the surface finish (roughness average (Ra)) in each machined feature, as defined by the ANSI B46.1 Standard. This parameter represents an important physical characteristic of the finished part. For most manufacturing processes, a better surface finish implies longer manufacturing time and higher costs.
Screening experiments were run to establish initial control parameter values. For each combination of parameter values used, MRR, RWEW, and Ra were registered. To eliminate variability caused by the characteristics of the material, holes were manufactured in a single A36 steel workpiece that was polished to near mirror surface finish. For each microhole produced during an experimental run, the electrode was positioned in contact with the surface of the workpiece at the desired XY coordinates. After this, the electrode was fed in the negative direction of the Z axis, with a travel distance of 0.1 mm and a feed rate of 0.08 mm/min (G01Z-1F0.08). This feed rate, combined with the selected process conditions, was seen to produce a uniform and continuous process, without collisions between the electrode and the part. 10 The space between trial holes was 1 mm. Figure 4 shows some of the resulting microholes.
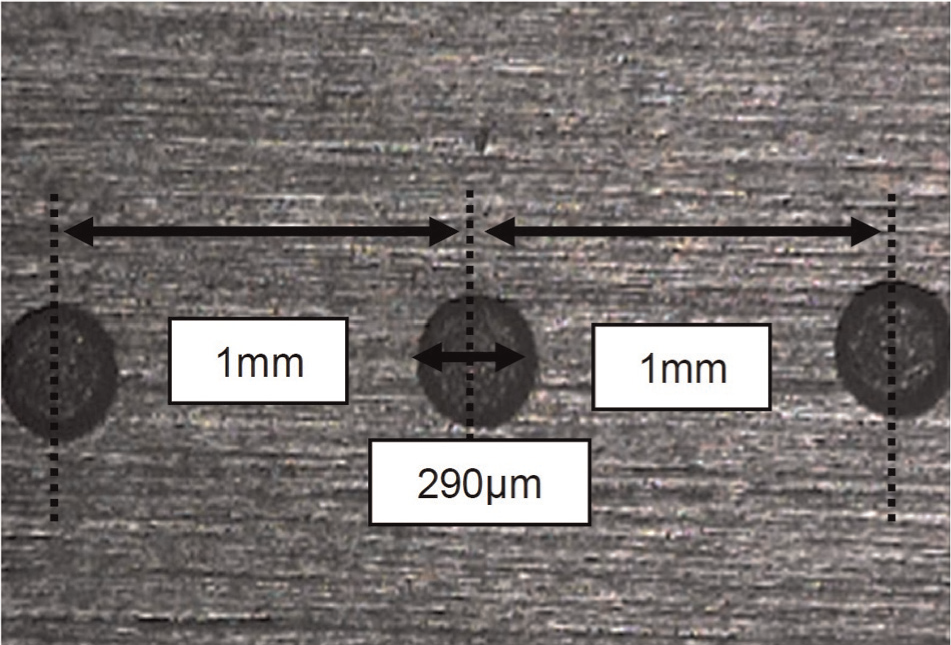
Microholes machined for screening tests.
An optical profilometer Veeco Wyko NT9100 was used for data collection and image generation. The depth and roughness of the bottom of the cavity were recorded for each case. The machining time was obtained directly from the CNC controller. Figure 5 shows graphical measurements of the depth of a microhole. Discontinuities in the readouts are caused by limitations of the equipment and the measurement approach. In particular, regions that have an abrupt change in slope or low light reflection are difficult to scan. In the particular case shown in Figure 5, the depth of the hole reached 78.9 µm. The difference between this value and the target (100 µm) was mostly due to electrode wear. The diameter of the finished hole exceeded the size of the electrode by 36 µm. This was expected because generation of a gap between the tool and the workpiece in all directions is inherent to the process. Overall, hole diameters were very consistent throughout the experimental run. The median diameter for all tests was 289.93 µm, with a standard deviation (SD) of 3.3 µm and a roughness value (Ra) at the bottom of the microhole of 0.57 µm.
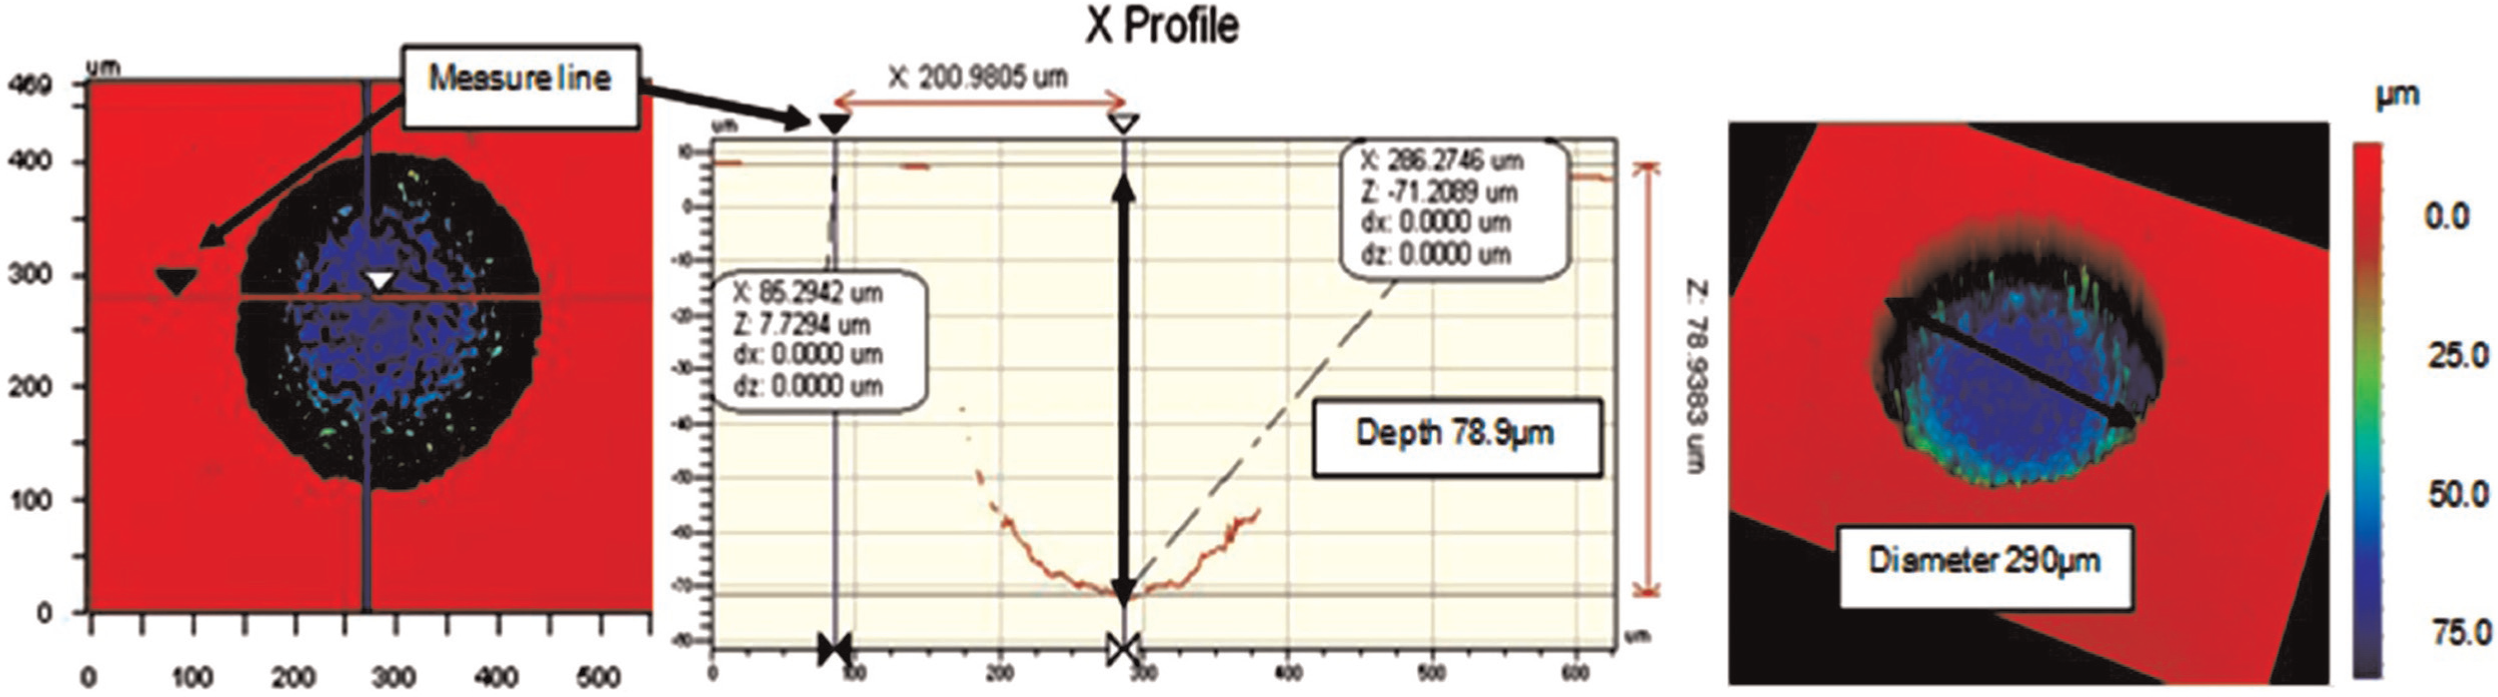
Data displayed by optical profilometer. Depth of the microhole reached 78.9 µm and Ra 0.57 µm.
Screening experiment results
The results from the screening experiments are summarized in Table 2. Data are not presented in the same order that the experiments were run. The actual sequence of experimental tests was randomized. The reason is that multiple parameters can affect the quality of the µEDM process. For example, environmental parameters such as the dielectric fluid temperature or material properties such as the dielectric conductivity or the electrode’s chemical composition all affect the process. As explained, only voltage and discharge energy were used to control the process because they are easily manipulated by the control. To reduce the potential effects of cyclical variations of the other parameters, the experimentation was conducted randomly.
Data collected from experimentation of microhole fabrication.
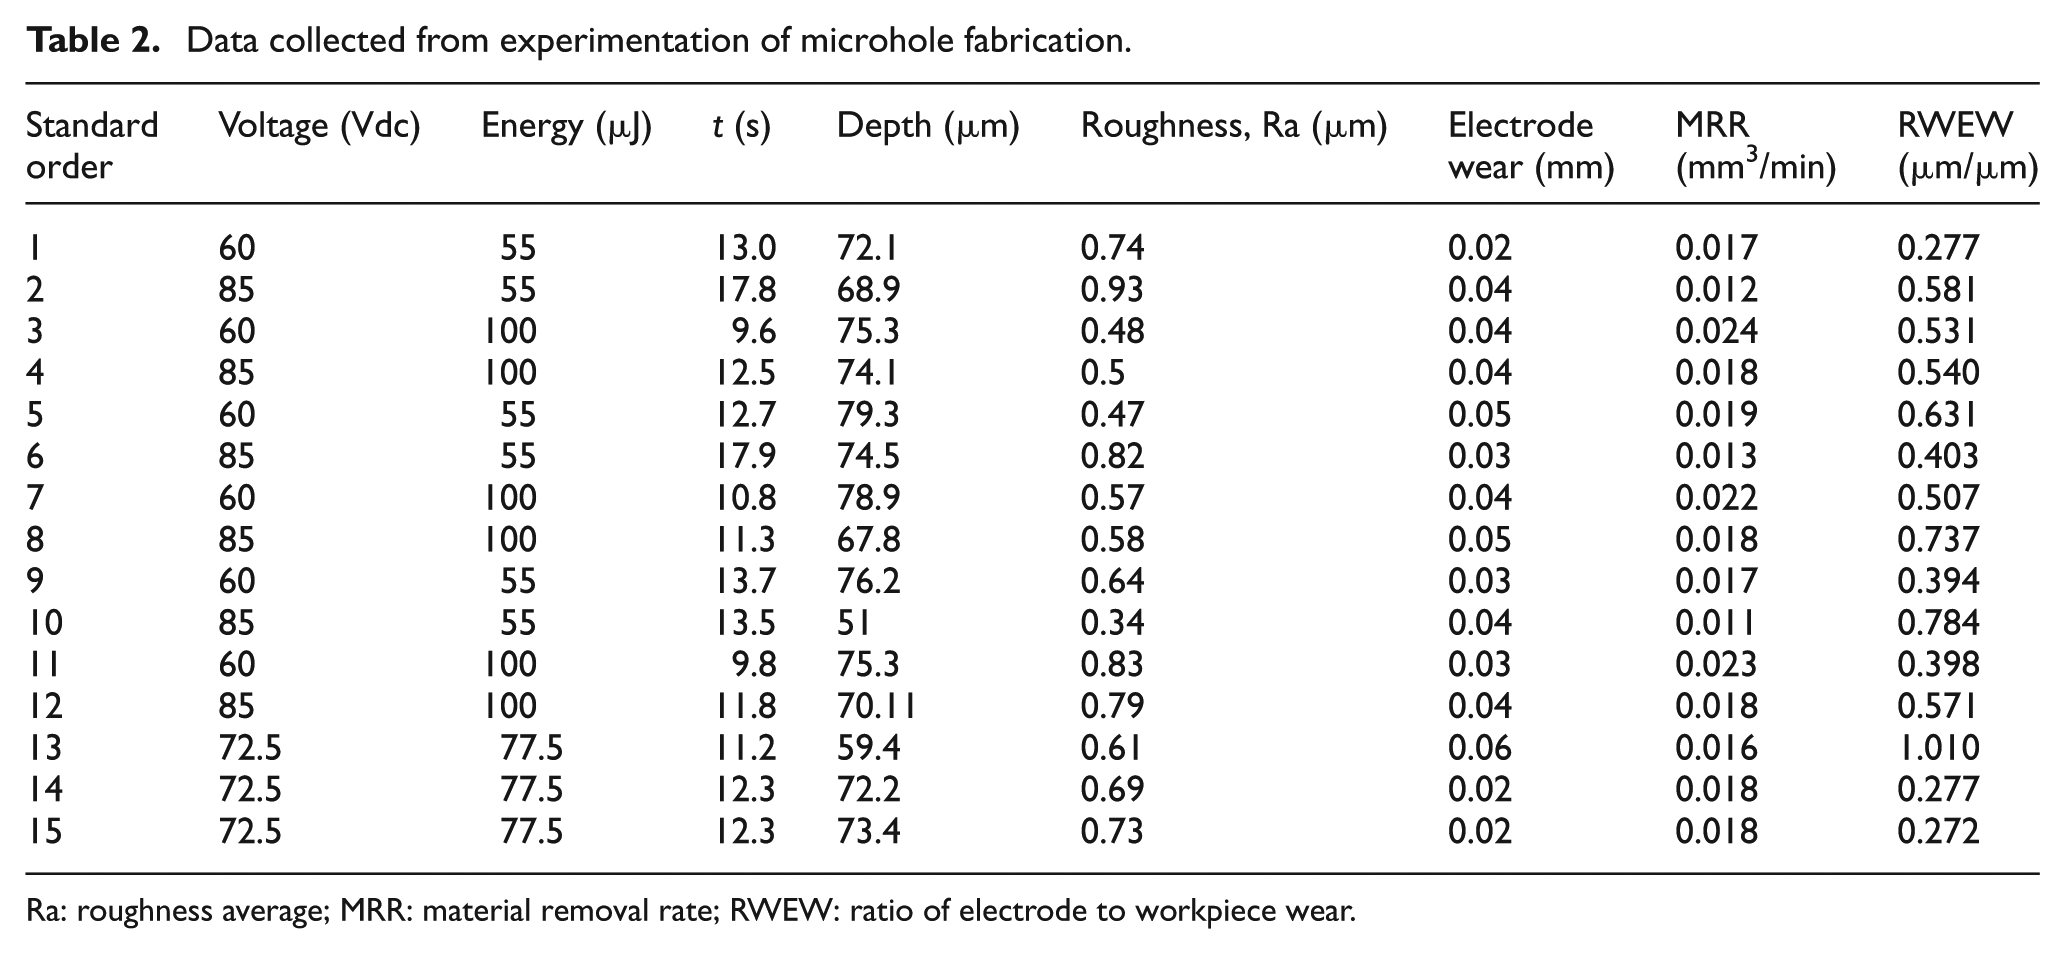
Ra: roughness average; MRR: material removal rate; RWEW: ratio of electrode to workpiece wear.
Table 2 presents values of the process control parameters (Vdc and µJ), along with the values of the performance characteristics (MRR, RWEW, Ra) that were measured or calculated for each hole. Data that were used for calculations of these metrics (time, depth, electrode wear) are also presented. Three trials were made for each control parameter combination to capture the dispersion of the process outputs.
Figure 6 shows a graphical representation of the results in the form of box plots. Low-voltage, high-energy combinations tend to increase MRR. The highest value was obtained at a combination of 60 Vdc and 100 µJ (mean 0.02314 mm3/min, SD 0.0008 mm3/min). In contrast, a low-energy and high-voltage combination of 85 Vdc and 55 µJ (mean 0.01197 mm3/min, SD 0.0006 mm3/min) results in about half of the MRR produced by the previous combination. Given that high MRR produces reduced cycle times and more economical processes, the most favorable combination from the screening experiments for MRR is 60 Vdc and 100 µJ. It is important to note that the combination 85 Vdc and 100 µJ resulted in a very consistent MRR. However, this combination resulted in a slower process, about 30% less than the chosen combination.
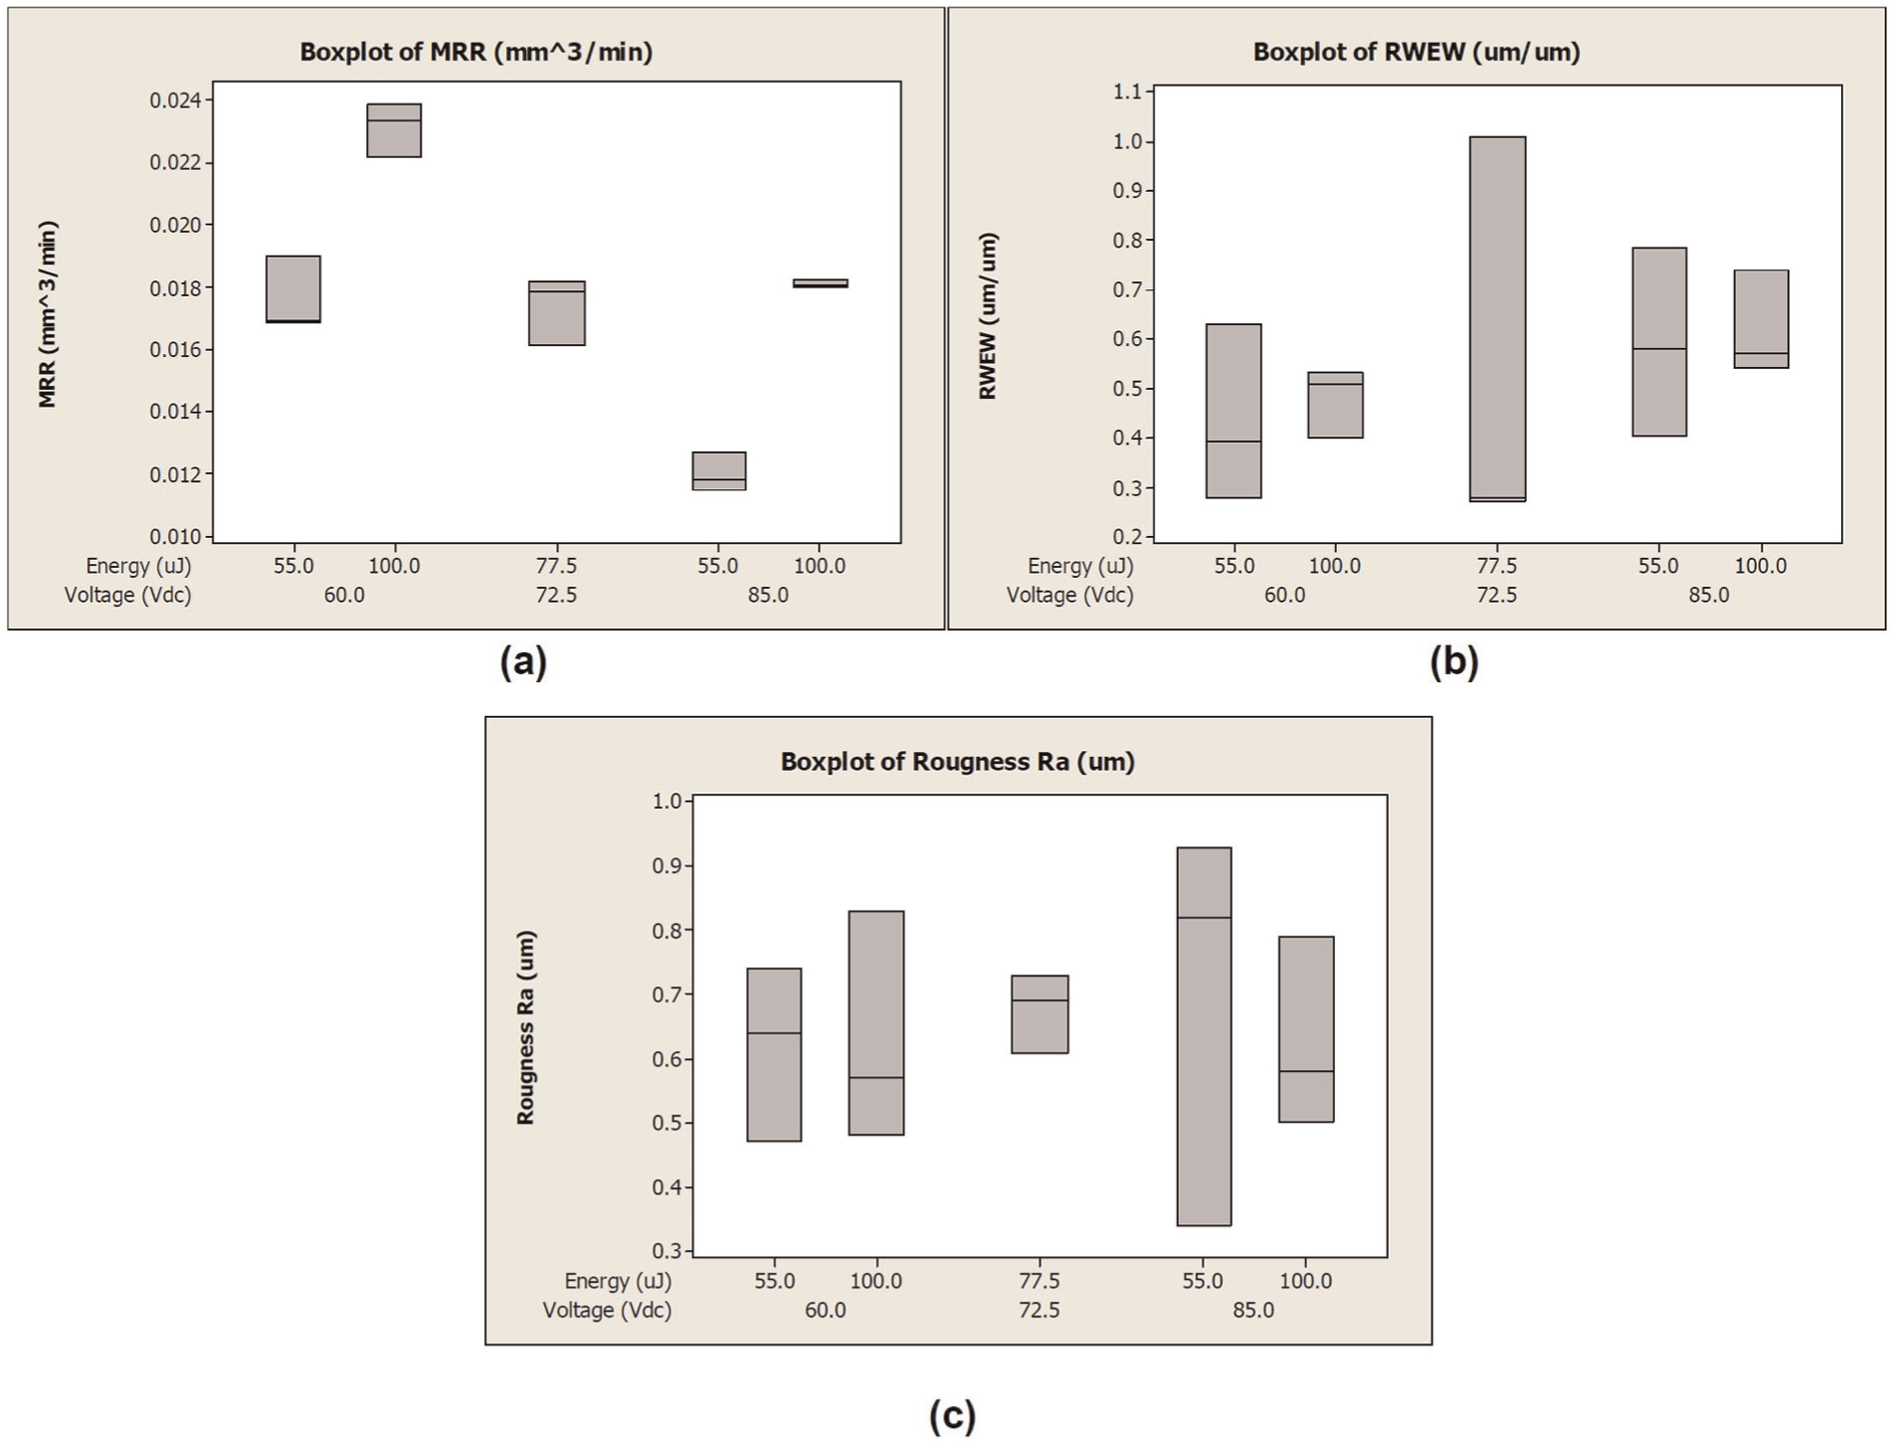
Box plots of parameter level impact over (a) MRR, (b) RWEW, and (c) Ra.
In general, a low value of RWEW is desirable for the economy of the process. A low electrode wear allows the continuity of the process without the need for electrode replacement. The combination that produced the lowest electrode wear (mean value) occurred at a voltage of 60 Vdc and energy of 55 µJ (mean 0.4339). However, this combination presents a relatively high variability (SD 0.18 µm/µm). Again, given the effect that electrode wear has on the geometry of the product, a low variability is highly desirable for process control and consistency. With this consideration, the combination that displayed the most favorable conditions from the screening tests was a voltage of 60 Vdc and energy of 100 µJ (mean 0.4789 µm/µm, SD 0.07 µm/µm) even though this combination did not result in the smallest electrode wear.
Roughness (Ra) in direct polarity was the last metric to be monitored. The parameter level combination with the lowest (i.e. best) roughness was produced at a voltage of 60 Vdc and energy of 55 µJ (mean 0.6167 µm, SD 0.1365 µm). In contrast, the parameter level combination that produced the highest roughness occurred at a voltage of 85 Vdc and energy of 55 µJ (mean 0.6967 µm, SD 0.3137 µm). The combination 72.5 Vdc and 77.5 µJ Ra proved to be more consistent for the different tests. However, the difference in means of the extremes was 0.08 µm or about 12%. The mean Ra was about the same for all cases, with variability being smaller for this last case.
In principle, the most favorable combination of process control parameters should produce this “ideal” response of the performance metrics: highest MRR, lowest RWEW, and lowest Ra (mean values) along with the lowest variability (SD) for process consistency. Evidently, none of the different combinations was capable of producing the ideal response. Therefore, a compromise was made.
To maintain acceptable levels of cost and quality, a standard practice in machining consists of combining roughing passes that approximate the final shape of the part very rapidly with slower finishing passes that produce the best surface finish and dimensions. A particular set of control parameter levels is used for a roughing pass and a different one for finishing. Given that the purpose of a finishing pass would be to improve the quality of the finished geometry (at the expense of other considerations), the finishing µEDM pass would have to target an improved Ra. This approach will be discussed later in this article. With this in mind, the combination of a voltage of 60 Vdc and energy of 100 µJ, which as mentioned before resulted in the highest MRR and more consistent (i.e. less variable) RWEW and Ra, is proposed as the most favorable combination for roughing passes. It is important to note that the low-voltage, high-energy combination results in a high current, which in turn produces a higher MRR, at the expense of the quality of the surface finish. This is consistent with the reports by Marafona. 15
Figure 7 summarizes the performance of the selected process parameters in terms of their effect on the performance parameters. As can be seen, the average MRR from these tests was 0.0231 mm3/min, with a RWEW of 0.47 µm/µm, roughness Ra 0.62 µm and depth of 76.5 µm. The actual depth reached was about 76.5% of the programmed depth (0.1 mm). This difference was caused mostly by electrode wear. With this information, new tests were conducted for a target depth of 50 µm. In these cases, the program ordered the controller to reach a depth of 0.065 mm (G01Z-0.065F0.08), that is, a deeper hole was programmed to compensate for electrode wear. Six holes were produced under these conditions. The average depth of these microholes was 50.59 µm, which represents a difference of 1.18% from the expected depth. This exercise illustrates the manner in which tool wear compensation in blind hole manufacture can be achieved. In the following section, the procedure for establishing electrode wear compensation values for microchannel fabrication is explained.
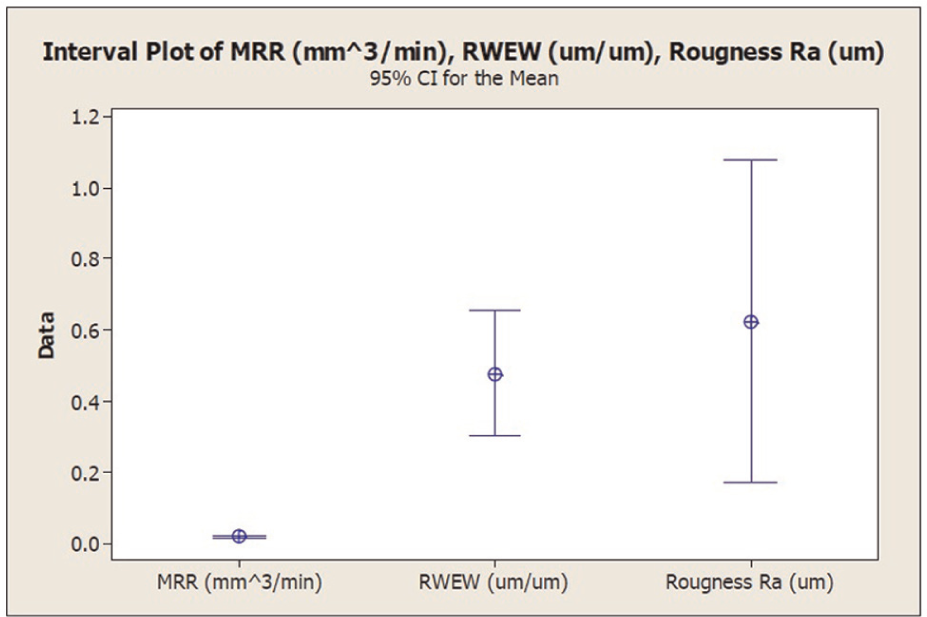
Interval plot of the effects on the µEDM process for chosen parameter level combination (60 Vdc, 100 µJ) during the screening experiments.
Microchannel fabrication
Tool wear compensation
Machining of microchannels in metals using conventional cutting tools presents several challenges. 20 The most important one is perhaps the integrity of the cutting tool, which can easily be damaged or broken when machining hard metals. Tool breakage is not a problem associated with µEDM. However, tool wear is an issue that needs to be addressed. As an example, Figure 8 shows images of electrodes before and after manufacturing tests.
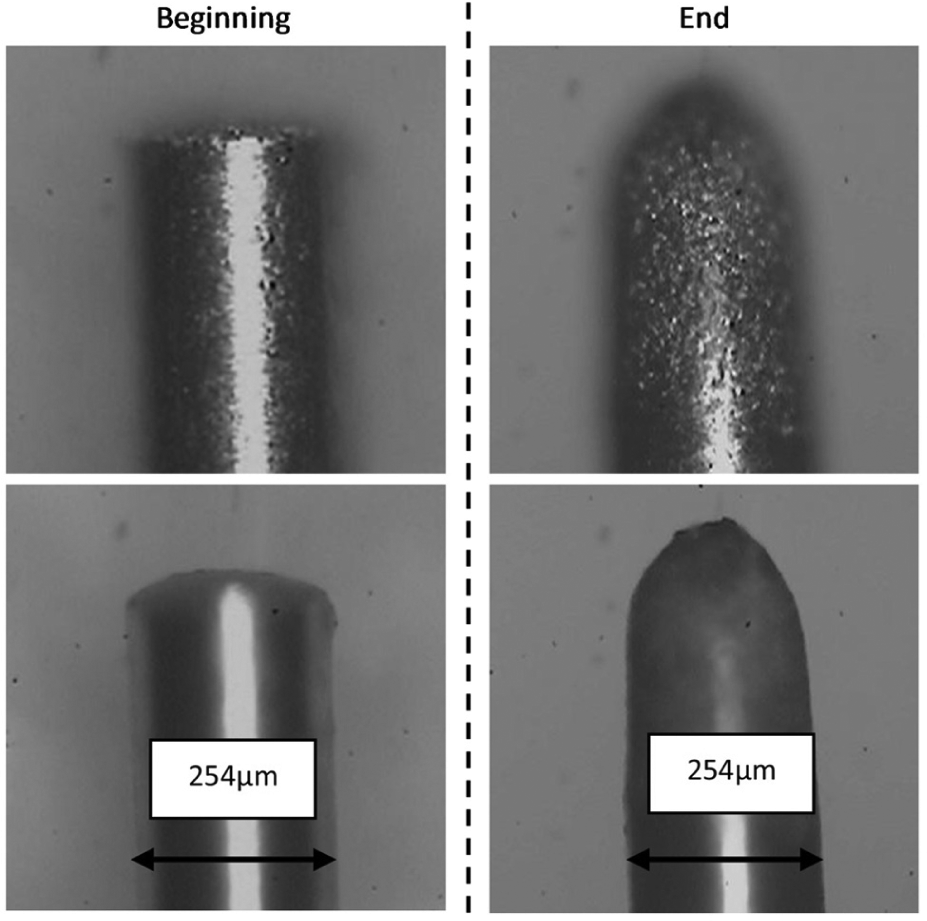
Electrode shape at the beginning and the end of microchannel machining.
From Figure 8, it can be seen that sparks are generated all over the surface of the electrode. As a consequence, the electrode tends to wear out faster at the edges, thus resulting in a spherical shape. In our experiments, channels were produced by a single roughing pass. The wear shown affects both the depth and the cross-section of the channel. This work focused only on maintaining a constant channel depth.
Figure 9 shows the results during manufacturing of a 50-µm-deep channel without compensation. The depth of the channel is reduced as the electrode wears out, thus resulting in a particular slope. To maintain a constant microchannel depth, tool wear must be compensated by feeding the electrode into the part as the cut is taking place. A sloped trajectory that will maintain the tip of the electrode at the appropriate depth needs to be programmed.
Slope measurement on one microchannel without compensation.
To determine the magnitude of the slope compensation in the Z axis, a series of microchannels were machined and analyzed. A lateral feed speed of 1 mm/min was used for all cases of microchannel fabrication. The slope of the channel that was machined without compensation was measured with the profilometer. In the test case shown in Figure 9, starting from a depth of 0.0434 mm, a lateral distance of 0.5422 mm is traveled at the moment the electrode is no longer in contact with the part. This is equivalent to an angle α of 4.58°. With data from a series of tests, a mean compensation angle of 4.123° was established.
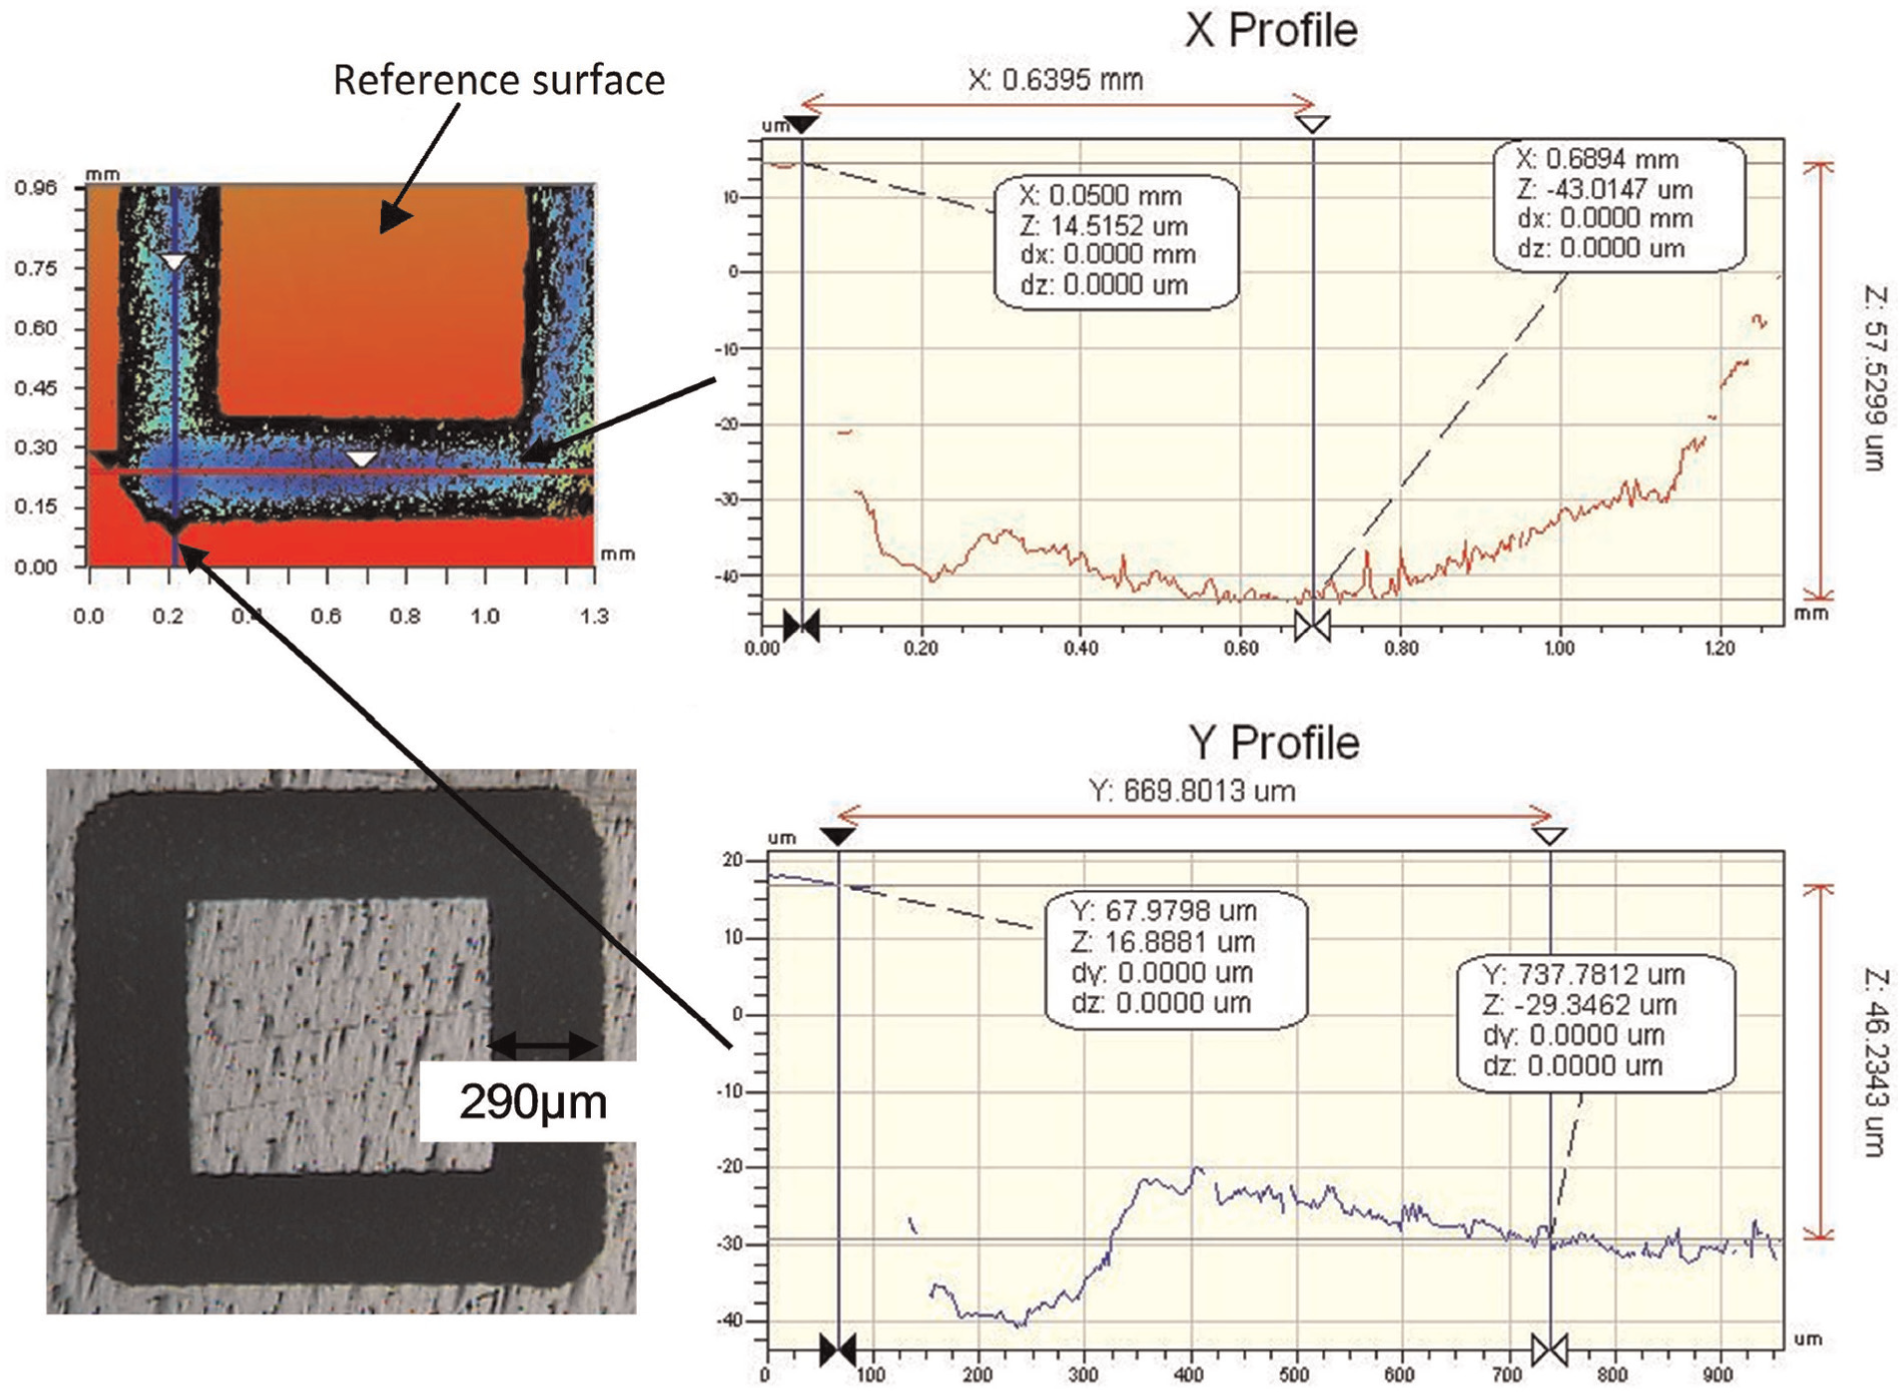
Using this angle, the Z axis compensation required to maintain a uniform microchannel depth can be approximated. The linear displacement required in the XY plane is multiplied by the tangent of angle α (4.123°). To test the electrode wear compensation technique, microchannels were manufactured on A36 steel. As in the previous example, the depth of the channels for this study was established as 50 µm. For every millimeter traveled by the electrode, the depth was compensated by feeding a distance of 0.072 mm into the workpiece in the negative Z axis direction. Figure 10 shows a resulting microchannel with a square projection on the plane XY, with a 4 mm perimeter. To manufacture this geometry, the electrode first entered the part by cutting directly in the Z direction. Then, lateral cuts were made in the X and Y directions to complete the feature.

Microchannel detail. Measurements made along straight lines. In the vertical direction, the line coincides with the deepest part of the channel. The point of entry of the electrode can be seen at the start of the channel trace.
As can be seen in the figure, the surface at the bottom of the microchannel is not perfectly flat, varying in depth around the desired value of 50 µm. The chart displays a maximum depth that ranges between 36 and 57.52 µm. Several factors affect the depth of the channel. For example, there is a pit-like feature at the location where the electrode enters the part. This is probably caused by a longer machining time at the given position (there is a dwell prior to lateral cutting). In addition, the shape of the tip of the electrode tends to become spherical during the process (Figure 8). Consequently, the cross section of the channel is arched at the bottom. This can be seen more clearly in Figure 11.
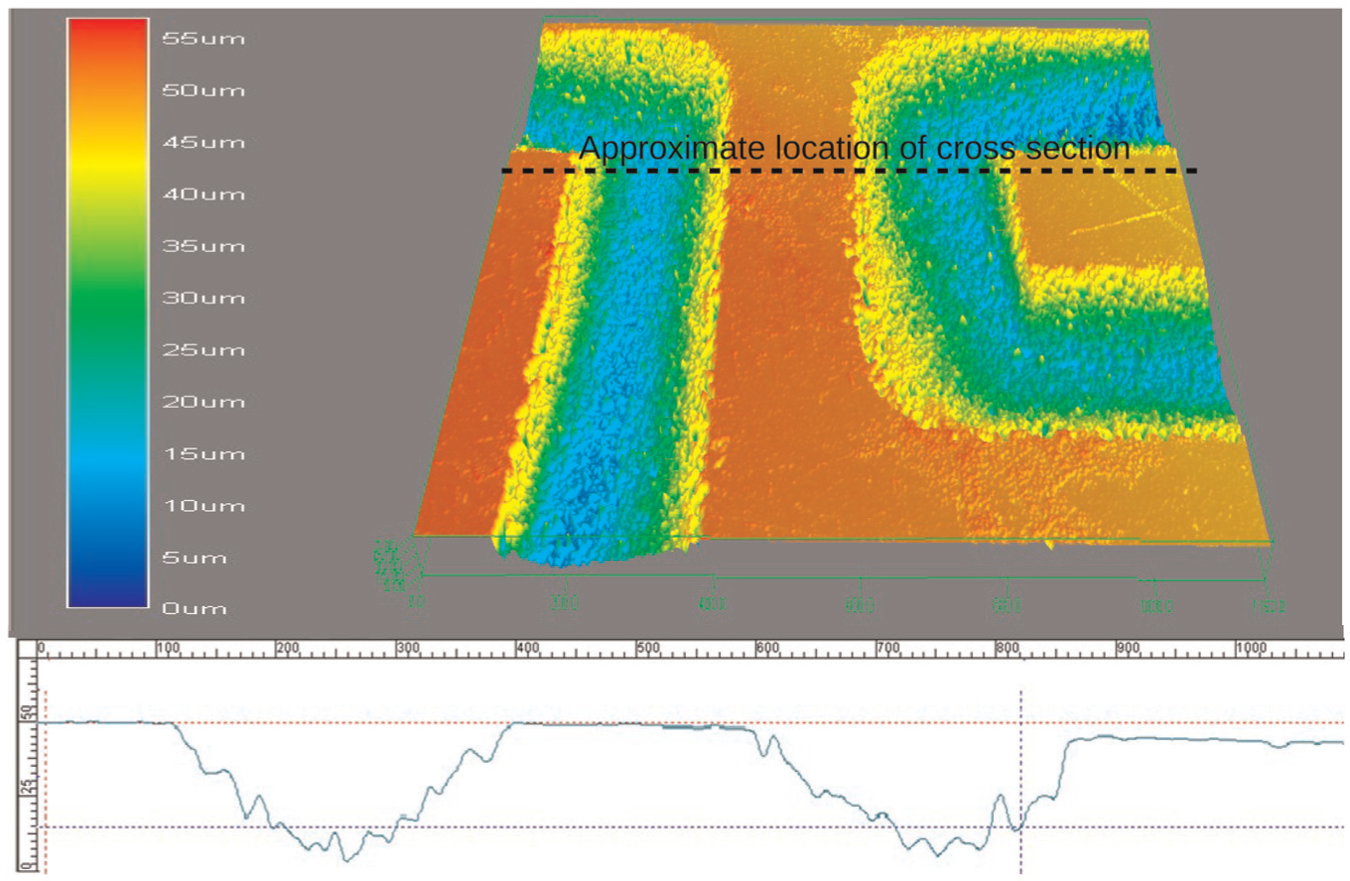
Transversal cut of microchannel. Channel depth was maintained about 50 µm over several millimeters of lateral machining.
In spite of these limitations, measurements show that at its peak value, the depth is maintained relatively stable in the linear stretches of the machining process (when only one axis of the positioning system is in motion). Figure 10 shows that a maximum depth of the channel in the Y axis direction varies between 36 and 46 µm. On the X axis, channel depth varies between 50 and 57 µm, which is also visible in Figure 11. These variations occur over a 4 mm length. Without compensation, the variation would have been twice these values over a 0.5 mm length. Fabrication of the channel would have been impossible without compensation for electrode wear.
The compensation technique was also used to fabricate microchannels with more elaborate geometries, such as spirals. These geometries are more typical of microchemical units. As shown in Figure 12, a spiral was fabricated using consecutive linear interpolated segments.
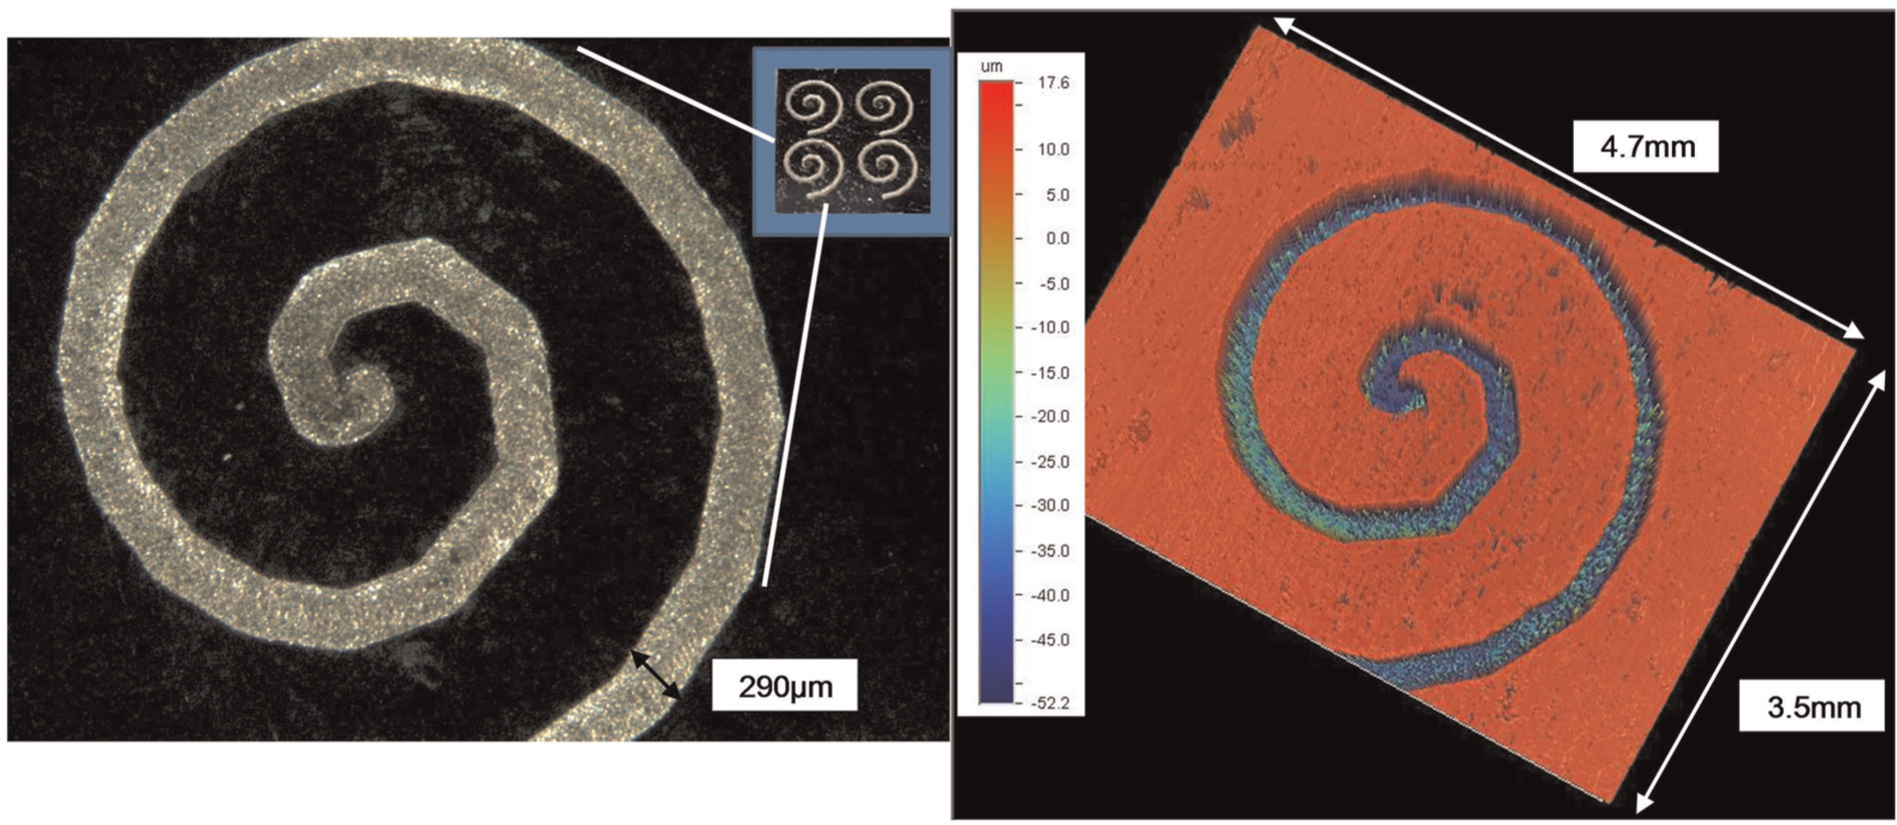
Spiral microchannel fabricated with electrode wear compensation technique (reconstructed 3D image in color, true picture in gray scale).
As in the case shown in Figures 10 and 11, the depth of the spiral is not constant throughout the length of the microchannel. However, the depth at the beginning and end of the channel is maintained at around 50 µm, showing that the tool compensation technique is relatively effective. Of particular relevance for the current discussion is that the total linear displacement programmed in the XY plane was machined in a single operation, indicating that the process parameter choice resulted in a fairly stable operation, and the tool compensation technique produced consistent results.
Surface finish improvement
The use of roughing and finishing passes to maintain low costs and improve geometry and surface finishing was discussed in previous sections. The screening experiments of sections “Screening of process control parameter levels” and “Screening experiments results” were used to select parameter control values for rough machining. The selection of parameter values for a finishing pass, which targets Ra, is a necessary step for determination of a µEDM strategy for the manufacture of channels. Careful inspection of the results of the screening experiments shows that alternate process parameter combinations produce only marginal improvements in Ra. Therefore, a different approach should be explored to produce better surface finishes.
As described in the “Introduction” section, the polarity has important effects on the process and the characteristics of the product. In the case of direct polarity (negative electrode, positive workpiece), the process results in a higher MRR and a lower quality of the surface finish of the part. In the reverse polarity setup, opposite effects have been reported, that is, the MRR is lower and the quality of the surface finish improves. In addition, it is known that electrode consumption is higher in the reverse polarity setup. 20
The use of reverse polarity for a finishing pass was explored in a series of tests. Specifically, direct polarity was used in the rough stage of µEDM to reduce machining time, and reverse polarity was used in the finish pass to improve surface finish. As a starting point, the same parameter levels were used (voltage 60 Vdc, energy 100 µJ). The only difference between the direct and the reverse polarity setup was the electrical connection between the RC oscillator and the electrode–workpiece setup: in reverse polarity, the electrode is connected to the negative terminal and the workpiece to the positive terminal. The results on machining of microholes with reverse polarity are summarized in Table 3.
Metric results for direct polarity and reverse polarity (voltage 60 Vdc, energy 100 µJ).
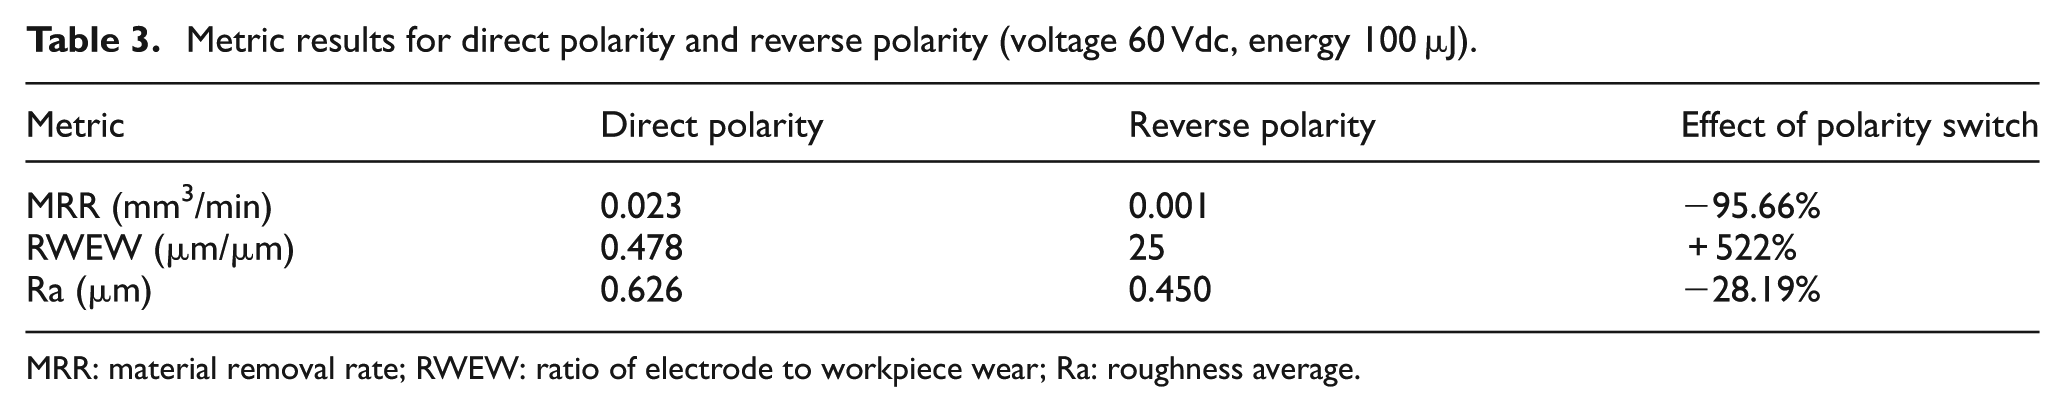
MRR: material removal rate; RWEW: ratio of electrode to workpiece wear; Ra: roughness average.
As can be seen, MRR and RWEW deteriorate considerably in reverse polarity, which is consistent with previous reports. Nevertheless, Ra improves, decreasing from a median of 0.62 to 0.45 µm.
Direct and reverse polarity cuts were combined for the manufacture of microchannels. A second machining pass with reverse polarity was done on half the length of a microchannel that had previously been machined using direct polarity, without changing the electrode. To accommodate for the faster electrode wear that accompanies reverse polarity, an extra compensation of 100 µm was programmed in the Z axis. With the calculated RWEW of 25 for reverse polarity, a layer of 2 µm was expected to be removed in this test run. Figure 13 shows the resulting improvement in roughness on the microchannel. In this particular case, Ra from the roughing pass measured 0.9 and 0.43 µm Ra after the finishing pass.
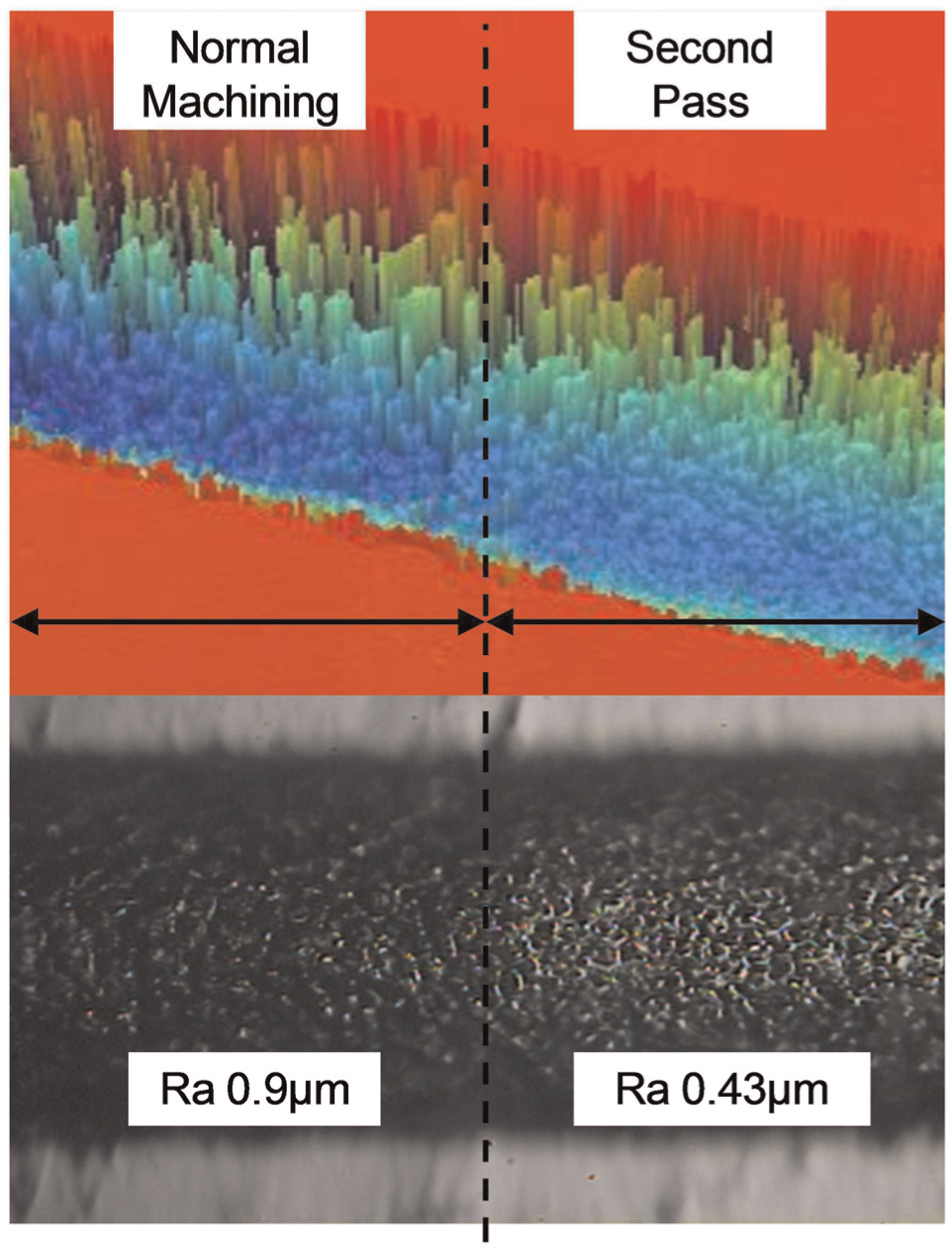
Roughness improvement by a second pass in microchannel.
Clearly, the overall machining time was increased by including the finishing cut. Therefore, reverse polarity is recommended only for the finishing pass.
Discussion
The cases treated in the previous section, although limited in scope, showed that the selected process control parameters, combined with the tool compensation technique, could be used for the fabrication of microchannels. Channels with a target depth of 50 µm were manufactured in different projected trajectories on the XY plane (box and spiral). Variations in depth ranged in the vicinity of 10 µm for straight channels and 20 µm for channels in which paths were obtained by the X–Y axis interpolation. Surface finish reached about 0.45 µm after the finishing pass. It is important to note that in the case of interpolated channels, the variations in depth are likely caused by inaccuracies in the squareness of the positioning system combined with the variations of the process that were displayed in the straight paths (which involved motion in a single axis).
Even though these variations are relatively high, they are well within standards reported by other studies. For example, the work of Vazquez et al. 21 focused on the manufacture by milling of straight microchannels in aluminum and copper. They report a variation of 40 µm in the width of straight channels of sizes similar to the cases presented here with surface finishes that averaged about 2 µm.
Other studies with µEDM report similar accuracies in roughing passes. For example, Zeng et al. 22 used µEDM as a preparation step for microcavities that were later finished with micro-electro chemical machining. The depth (0.185 mm) and sizes of the cavities (0.55 mm) they explored were of the same range as the channels reported here, with electrodes that had a diameter of 0.1 mm. They report surface finishes of 0.707 µm Ra, with dimensional variations that remained within approximately 20 µm in the preparatory µEDM passes. Interestingly, they experimented with relatively large energies (about 200 µJ) at much smaller MRRs (0.0006 mm3/min or about 40 times less) than the studies presented in this work. While variations in the lateral cavity size are similar to what was achieved in this work, their process conditions resulted in improved dimensional accuracy of the bottom of their cavities.
It is important to note that the tests reported here were conducted in A36 steel with a hardness of 96.9 HRB. Values of voltage and energy used for discharge are not necessarily the same for other materials. Further experimentation is needed for the application of the system in different materials. As explained in section “Tool wear compensation,” wear compensation targeted only channel depth control. The electrode tended to wear out in such a way that the tip became spherical. For this reason, the selected process parameters are intended for roughing passes only. Finishing pass conditions are yet to be researched. Overall, it can be stated that compared to other control strategies, process control is simpler with the approach proposed in this work. Surface roughness and dimensional accuracy achieved in microchannels with this strategy are comparable to what was reported by other studies with softer materials or with more sophisticated control strategies.
Conclusion and future work
In this work, process conditions for a stable lateral-cut µEDM process were determined from simple statistical analysis of two control parameters, voltage and energy of discharge, using an open-architecture, low-cost µEDM machine. These parameters were obtained initially from the process of hole manufacture. Further tests showed that these process parameters were suitable for the manufacture of microchannels, which were produced by moving the electrode in the plane in a manner similar to milling.
A methodology for electrode wear compensation was presented. The compensation methodology was based on measurements made on channel depths, and the compensation parameters were applied to produce microchannels several millimeters long in linear and spiral paths, with an average depth of 50 µm.
Overall, process conditions were suitable for roughing passes in direct polarity. To improve surface finish, a second µEDM pass over machined microchannels was done. The same parameter values were used, but the polarity was reversed. This approach leads to a roughness improvement from 0.62 to 0.45 µm Ra, at the expense of machining time. The quality of the microchannels produced in this work is similar to what is reported in the literature by other studies.
Further experimental work is required for the determination of compensation angle and process conditions in different materials and at different depths. In addition, process control parameters for finishing passes need to be established to improve dimensional accuracy, not just surface finish. Other product characteristics, such as the size of the heat-affected zone, may also have to be part of the analysis in future work.
Footnotes
Declaration of conflicting interests
The authors declare that there is no conflict of interest.
Funding
Funds for this project were awarded by the Autrotronics Research Chair, the Mechatronics Research Chair, the Mechanical Engineering Department at Tecnológico de Monterrey, and the Integrated Systems Engineering Department at the Ohio State University.