
Abstract
This article is about the measurement of actual micro-electro-discharge machining parameters and the statistical analysis of their influence on the process performances. In particular, the discharged power was taken into account as a comprehensive variable able to represent the effect of peak current and voltage on the final result. Thanks to the dedicated signal acquisition system, a correlation among the discharged power and the indexes representing the process parameters was shown. Finally, linear and non-linear regression approaches were implemented in order to obtain predictive equations for the most important aspects of micro-electro-discharge machining, such as the machining time and the electrode wear.
Keywords
Introduction
Micro-electro-discharge machining (micro-EDM) is a promising technology able to remove material from the workpiece by means of electrical discharges. The discharges cause the melting and the vaporizing of the workpiece material, and in order to maintain controlled electrical conditions, a dielectric fluid is always kept flushing in the machining zone. Thanks to its nature, the material removal occurs without any contact between the electrodes, ensuring the total absence of residual stresses on the workpiece, distortion or breakage due to physical forces. 1 This means that with micro-EDM, it is possible to machine any conductive or semi-conductive material regardless of the workpiece hardness or strength. 2
In micro-EDM machining, there are many factors affecting the process performances; these factors can be related either to the process parameters (such as voltage, peak current, pulse duration and spark gap) or to the system (such as type of dielectric fluid, tool shape and dimension, chemical and physical material properties). These parameters have a non-negligible effect on both erosion processes (material removal rate (MRR), tool wear ratio (TWR)) and machined workpiece properties (dimensional and geometrical accuracy such as diametral overcut (DOC), taper rate (TR) and surface finishing).3,4
Many authors investigated the effect of the process parameters in EDM. Muthuramalingam and Mohan 5 considered the electrical parameters, the pulse shape and the discharge energy as the most relevant ones from a process performance point of view. A review of the influence of the process parameters in EDM was carried out, and it was demonstrated that peak current and pulse duration are the most relevant factors. Moreover, the exchanged thermal energy is considered fundamental to enhance the electrical process parameters and to increase the process efficiency. In Puertas et al., 6 the influence of peak current, pulse duration and duty cycle on surface roughness, electrode wear and MRR was investigated. It was demonstrated that, especially for the electrode wear, the process parameters’ combined effect has the most relevant influence; on the contrary, the duty cycle is the only factor having a negligible influence on the final indicators. In Gostimirovic et al., 7 the discharge duration and the peak current were taken into account in order to evaluate their influence on the main performance indicators, such as the MRR, the TWR, the gap distance and the surface roughness. In addition to the analysis of the process parameters, the study gave a considerable contribution about the selection of the proper EDM machining conditions.
An analysis of the effect of machining parameters on MRR, surface roughness and roundness error was carried out in Janardhan and Samuel, 8 using the pulse train data acquired at the sparking gap. The sparks have been classified in different categories (open circuit, normal, short circuit and arc discharges), and it was demonstrated that the tool rotation has a considerable influence on the type of discharges occurring in the sparking gap. The electrical characteristics of the discharges, in particular, the influence of the EDM discharge pulse shape on the process performance, were investigated in Liu et al. 9 It was demonstrated that in the machining of Si3N4–TiN, different pulse shapes result in dramatic differences in material removal mechanisms and rates.
Optimization of EDM for Ni-based alloys application was carried out in Ayesta et al., 10 where it was demonstrated that the best parameters for low electrode wear and low machining time are those that combine low intensity, high pulse time and low servo voltage. The effects of process parameters, when tungsten carbide (TC) is processed, were extensively studied in Lee and Li. 11 In Kiyak et al., 12 the discharge energy density was assumed as significant criterion in determining the process performance. A direct proportional connection between energy density and MRR was found. Electrode wear decreases when the energy applied decreases and therefore when effective discharge area increases. Surface qualities improve when energy for unit area decreases. The energy distribution between workpiece and electrode was studied in Singh. 13 In particular, the experiments were performed to study the percentage of energy transferred to the workpiece applying heat transfer equations and using different EDM parameters.
Some authors made efforts in trying to model and predict the effects of process parameters and material properties on the EDM process and geometrical performance. An index to evaluate the wear resistance of the electrode in micro-EDM was proposed in Tsai and Masuzawa; 14 this index was based on the physical properties of the electrode material.
A thermal-based model for the prediction of MRR and surface roughness achieved as a function of the process parameters was proposed in Salonitis et al. 15 The model predicts that the increase in discharge current, arc voltage or the spark duration results in higher MRR and coarser workpiece surface.
A new approach for the determination of ease of machining by EDM processes was proposed in Mahardika et al. 16 In this study, the total energy of discharge pulses required to machine different materials was calculated, and five kinds of parameters that are independent of machining time were also introduced.
Based on these considerations, it is possible to affirm that important efforts were made in order to model the EDM process. Anyway, in most cases, a lack of information regarding the actual values of the electrical parameters and the difficulties in acquiring them can be observed.
Aim of this work is to study the effects of the actual values of electrical parameters on the performance on micro-EDM drilling of stainless steel. A dedicated signal acquisition system was developed for the measurement of effective micro-EDM process parameters. The system is able to record the peak current and voltage signals and to filter and analyse them in order to collect reliable information about the micro-drilling process. The effect of electrode size was also taken into account. The experimental campaign was executed using a Sarix SX200 micro-EDM machine. Tubular TC electrodes having diameters equal to 300 and 150-µm were used for the micro-drilling of 316L stainless-steel sheets. Different values of the electrical parameters were set by varying peak current, voltage and energy level. Finally, a regression approach was implemented in order to obtain predictive equations for the most important indicators of micro-EDM, such as the machining time and the electrode wear.
Experimental campaign
The experimental campaign was executed using a Sarix SX200 micro-EDM machine with TC tubular electrodes. Two different electrode sizes having external diameters equal to 300 and 150-µm and internal diameters equal to 120 and 60-µm were considered. In fact, it was demonstrated by some authors17,18 that the size of electrode affects the electric field intensity that influences the discharge process and therefore the process performance.
The micro-drilling process was carried out on 316L stainless-steel plates having thickness equal to 1 mm. The electrode material characteristics are reported in Table 1. Kerosene oil was used as dielectric fluid and it was adduced to the machining zone with a pressure of 20 bar.
Electrode material characteristics.

The selection of the final process parameters was based on a preliminary experimental campaign in which the parameters were set in order to minimize the machining time and the electrode wear.
Experimental plan
A full factorial design of experiment (DOE) approach was adopted: two process parameters, namely, peak current (I) and voltage (V), were varied on three levels, codified as ‘low’, ‘medium’ and ‘high’. Five repetitions were executed for each experimental condition. Moreover, the Sarix energy level was varied on two levels for each diameter, codified as 365 (high) and 206 (low). For the 300- and 150-µm electrode diameters, 45 holes were carried out for each energy level, so resulting in 180 through micro-holes. Tables 2 and 3 show the fixed and varied process parameters for each electrode diameter and for each energy level. As regards Table 2, energy establishes the shape of the pulse codified by the Sarix machine and it is dimensionless. Width is the time the transistor remains active. Gain is a parameter that controls the gain of the reaction block. Gap is a value proportional to the distance between the electrode and the piece during erosion. Regulation identifies a certain regulation management algorithm defined by the machine manufacturer. As regards the 150-µm electrode, since the electrode flexibility is a non-negligible aspect to control for the realization of acceptable geometrical characteristics of the holes, a ceramic guide was employed. This tool helps to control the run-out phenomenon and guarantees the achievement of a more repeatable machining procedure.
Fixed process parameters.

Varied process parameters.

During the drilling procedure, the machining time and the electrode wear were recorded. The length of electrode wear was measured by an electrode touching operation in a specific reference point. The frontal tool wear was calculated as difference between the initial and the final length of the electrode (Figure 1). At the end of each hole, the electrode was cut using the wire EDM unit in order to restore the same electrode geometrical initial conditions for all the tests.
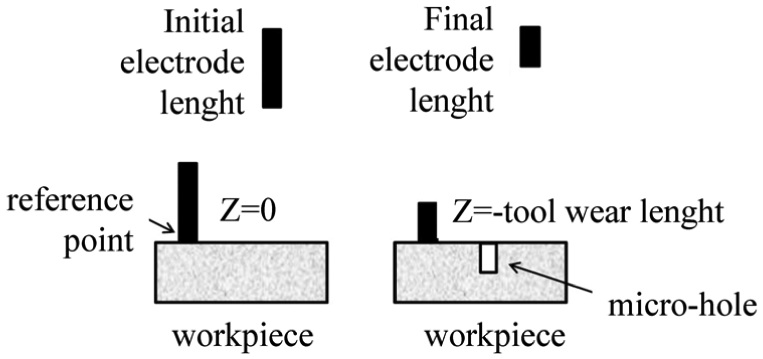
Procedure for tool wear measuring. 19
Signal acquisition system
Some of the process parameters that can be set on the Sarix SX200 machine are expressed as indexes and are only representatives of the effective physical quantities involved in the process. In this case, the lack of information refers to the energy and the peak current, which are considered particularly relevant for the micro-EDM process. In order to find a formal relationship between input and output, a signal acquisition system was developed (Figure 2).

Overview of the data acquisition process.
Two electronics modules have been developed for monitoring the electrode voltage on the high side and the discharge current on the low side, respectively. By providing a bipolar supply, the system is able to monitor the machining process even at inverted polarity. Both the modules provide large bandwidth (DC < BW < 10 MHz) in order to preserve the microsecond-based structure of the EDM process and suitable gain in order to enter the scope with signals in the order of few volts. In particular, the voltage sensing is based on a high-value resistor divider, in order to not affect the machine parameters. The obtained low voltage from the divider is successively amplified and buffered, providing the capability at the output to drive a 50 ohm load on a coaxial cable. As concerns the current monitor module, the current is sensed at machine low side in order to not use high-voltage components; the current drawn from ground passes through a high-power, 10-mohm resistor. The voltage drop across this resistor is then differentially amplified and buffered for a 50 ohm matching on a coaxial cable. The electronics modules, enclosed in metallic boxes, are mounted on the EDM machine, close to the measurement points. Bayonet Neill–Concelman (BNC) coaxial cables were finally connected to a Teledyne LeCroy WaveSurfer oscilloscope, programmed to perform simultaneous acquisitions of both voltage and current monitor at 1000 MS/s. The acquisition process was automated with the use of a MATLAB program run on a personal computer connected to the oscilloscope via a local Ethernet network. The data are fetched in regular intervals of time from the oscilloscope and they are saved as MATLAB figure files. It is important to remark that some preliminary tests have been carried out using an external electronic pulsing generator to evaluate the accuracy of the acquisition system.
A specially designed script that iterates over all the data files and computes values such as energy per spark, peak current, peak voltage and number of sparks per second contributed to the analysis of the electrical graphs. A proper data filtering and a system to remove the data noise were also implemented. In order to carry out an effective data filtering, it is necessary to consider that the sparks are very short in duration and can be confused with simple noise by a filtering algorithm. As a matter of fact, the frequency band of the noise and the sparks are sufficiently different to allow an effective filtering procedure. The data sample resolution makes it possible to use a simple moving average filter with a window size of 1000 for the current and voltage. Figure 3 shows an example of the data after filtering. Once the filtered peak current and voltage data were created, the power data (P(t)) were created through the multiplication of I and V data. In order to detect the presence of a spark, a function described below was implemented


Voltage (V), current (A) and power (W) of sparks as a function of time.
The beginning of every spark is characterized by a sudden decrease in the voltage accompanied by an increase in the current. In the same way, a spark ends when the current is back to a value close to zero. Taking into account those observations, the beginning of a spark happens when voltage is below a certain level Vthreshold and current is above a certain level Istart; a spark ends when it is currently ongoing and the current is below a certain level Iend. The choice of those parameters (Vthreshold, Istart and Iend) is essential since the sparks’ presence function needs to return the correct number of sparks. Additionally, it needs to do so while making the sparks detected be comparable between themselves and, therefore, achieve a certain level of consistency. Moreover, some information about the main process parameters needs to be collected, such as the correct number of sparks and the number of detected sparks that maximize their energy. Those values are also dependent on the experimental parameters and therefore would be different for each hole that is machined. A procedure was defined to choose those values with the use of particle swarm optimization. For each set of parameters used in the experimental campaign, a file was selected and the sparks contained in it counted. With the knowledge of the correct number of sparks and using it as a constraint in the optimization process, the algorithm was capable of finding the values of Vthreshold, Istart and Iend that maximized the energy of all sparks.
Using this solution, it was possible to compute all the most important parameters such as total number of sparks, average peak current, average peak voltage, number of sparks per second, average energy transferred per spark and average energy transferred per second.
Geometrical characterization and process performance
In order to evaluate the geometrical characteristics of the micro-holes, two indicators were taken into account: the DOC and the TR. The DOC is calculated as the difference between the hole top diameter (Dtop) and the electrode nominal diameter as reported below

The TR indicator is calculated as follows

where Dbottom is the hole bottom diameter, and h is the sheet thickness.
The process performances were evaluated with two indicators: the MRR and the TWR, calculated as follows
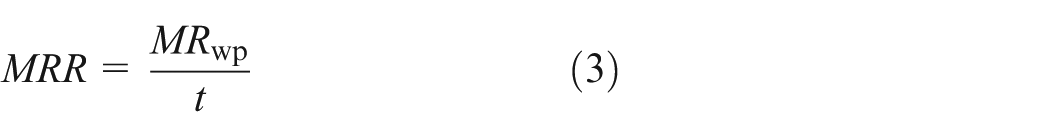
where MRwp represents the material removed from the workpiece and t represents the machining time. The material removed from the workpiece was calculated as the frustum of cone having dimensions equal to the hole top diameter (2R) and the hole bottom diameter (2r), as reported below

As regards the TWR, it is calculated as follows

where MRtool is the material removed from the tool, calculated as the volume of the tube having diameters equal to the nominal inner and outer electrode diameters (Dint and Dext, respectively) and height equal to the measured tool wear (wear), as reported in equation 6.
Analysis of the results
The first part of the analysis consisted in the individuation of a possible influence of the nominal values of the process parameters on the final indicators previously described (DOC, TR, MRR and TWR). Tables 4 and 5 show a summary of the analysis of variance for the 300- and 150-µm electrodes, respectively.
Analysis of variance, p values for d 300-µm.

DOC: diametral overcut; TR: taper rate; MRR: material removal rate; TWR: tool wear ratio; I: peak current; V: voltage; E: energy level.
Analysis of variance, p values for d 150-µm.

DOC: diametral overcut; TR: taper rate; MRR: material removal rate; TWR: tool wear ratio; I: peak current; V: voltage; E: energy level.
The p value is the probability of obtaining a test statistic, that is, at least as extreme as the actual calculated value, if the null hypothesis is true. A commonly used cut-off value for the p value is α = 0.05. Where the number is bold, the p value is lower than the cut-off limit, and therefore, the parameter statistically affects the result of the considered indicator (DOC, TR, MRR and TWR). For both electrode diameters, the most relevant factor is the energy level. For the 300-µm diameter, other factors seem to have a considerable influence, for example, the peak current and the voltage or their combination. It is possible to notice how these factors influence the process performance indicators (MRR and TWR) but they become less relevant on the geometrical ones (DOC and TR).
As an example, the main effect plots for the TWR indicator (Figure 4(a) and (b)) prove the relevance of the three process parameters taken into account. For both diameters, TWR decreases for increasing the level of peak current, voltage and energy.

TWR main effect plots for (a) 300-µm and (b) 150-µm electrode diameters.
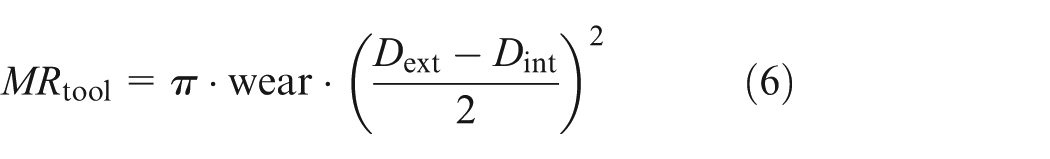
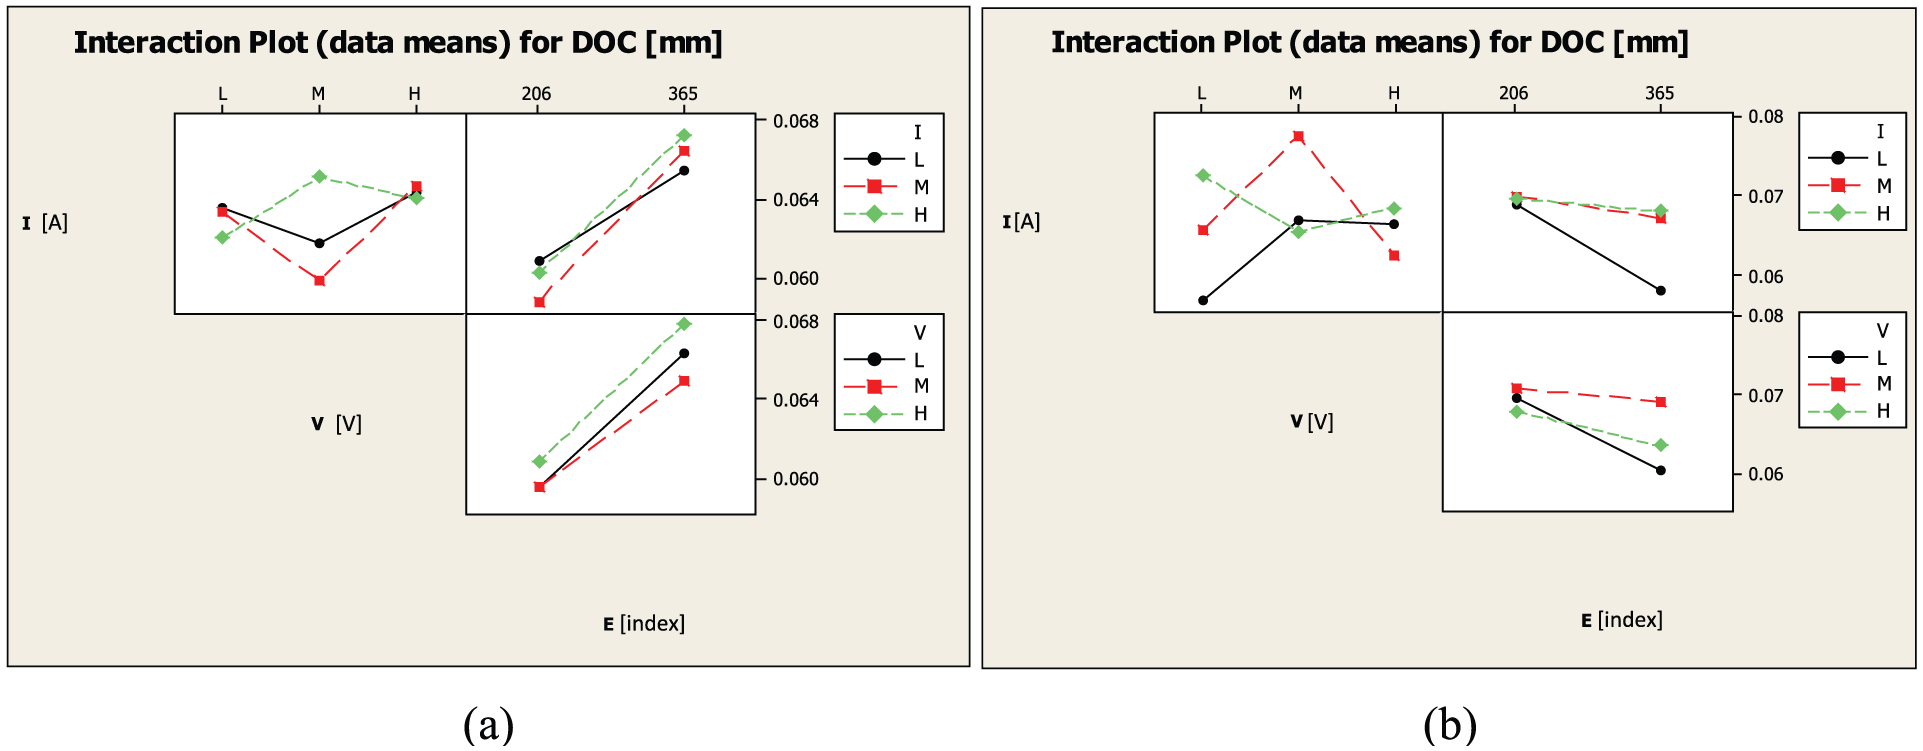
As a general remark, for all the indicators, a certain influence of the interaction among the factors of the model is recorded. As an example, Figure 5(a) and (b) shows the interaction plot for the DOC indicator for both the electrode diameters. For the geometrical indicators, the interaction was found between I and V, as confirmed by the p values; on the contrary, for MRR and TWR, the main interaction is recorded for I, V and the energy level. Regarding the process performance indicators, the result for the MRR is shown in Figure 6(a) and (b). The main result coming out from these graphs is the relevant influence of the energy level on all the indicators.
DOC interaction plots for (a) 300-µm and (b) 150-µm electrode diameters.

MRR interaction plots for (a) 300-µm and (b) 150-µm electrode diameters.
Discharged power calculation
In order to use a comprehensive variable able to summarize I, V and E, the discharged power between electrode and workpiece was selected. The electrical power formulation is the following

where p represents the discharged power expressed in watts, I the peak current in amperes and V the voltage in volts. With the acquisition system, the discharged power can be calculated knowing the number of sparks per second and the energy per spark, obtained from the analysis of the acquired signal previously described. The discharged power resulted to be directly proportional to the value of the process parameters previously set, as shown in Figures 7 and 8. The values of I and V were classified as ‘high (H)’, ‘medium (M)’ and ‘low (L)’ and their combination, reported in the x-axis, is made of two letters, the first referring to the peak current level and the second to the voltage. The dark grey bars refer to the high level of the energy and the light grey bars to the low level of the energy.

Discharged power as a function of the process parameters’ combination, d 300-µm, E365 and E206.

Discharged power as a function of the process parameters’ combination, d 150-µm, E365 and E206.
The bars are divided into three groups for the three levels of the peak current, and within each peak current bars’ group, the effect of the peak voltage is always the same, resulting in increasing values of the discharged power. This phenomenon is recorded for both the electrode diameters. The following analysis consisted in the evaluation of the indicators as a function of the discharged power.
Evaluation of the process as a function of the specific discharged power
In order to compare the process performances obtained using two different electrode diameters, the specific discharged power was taken into account and calculated as the ratio between the discharged power and the electrode surface. Figure 9 shows MRR as a function of the specific discharged power for the two different levels of energy. Each marker represents the average of five repetitions. The energy level has a strong effect on MRR: using the low value (that is a little aggressive wave shape) the specific discharged power has a modest effect on MRR for both electrode diameters. Using the high energy level, the situation is completely different and it is possible to observe two diverse families of points: for the first group (these points belong to 300-µm electrode), the specific discharged power strongly affects the MRR, while for the second group (belonging to 150-µm electrode), the effect of the specific discharged power is lower despite the trend is always growing. As a general remark, it is possible to state that E365 permits to obtain better performances. Differences of MRR values as a function of the specific discharged power can be appreciated when the energy level 365 is used, while a certain smoothing of the performance results from the use of the E206 energy level.

MRR as a function of the specific discharged power, E365 and E206.
The machining time graph (Figure 10) shows, in this case too, different behaviours as a function of the energy level. Each marker represents the average of five repetitions. In general, using E365 energy, machining time decreases when the specific discharged power increases. Increasing the electrode diameter, the drilling operation is faster. Regarding the E206, for both diameters, no specific trends can be found.
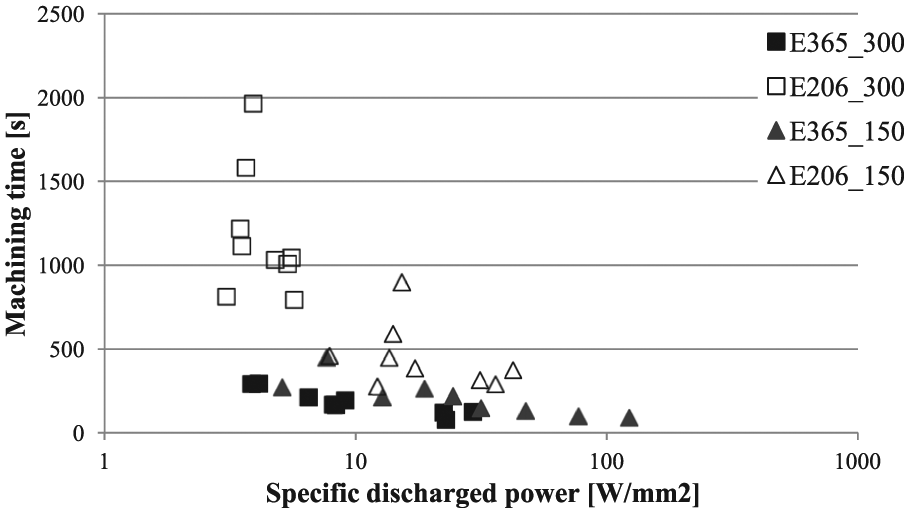
Machining time as a function of the specific discharged power, E365 and E206.
As regards TWR and tool wear (Figures 11 and 12), for both energies, these indexes are worse using a smaller electrode diameter. Each marker represents the average of five repetitions. Using E365 energy level, for 300-µm electrode, TWR and tool wear decrease increasing the specific discharged power. The behaviour is opposite for the 150-µm electrode. When E206 energy is used with the bigger electrode, the difference between maximum and minimum value of TWR is minor, while for the smaller electrode the performances are getting worse and the ranges are a slightly wider than the previous case.
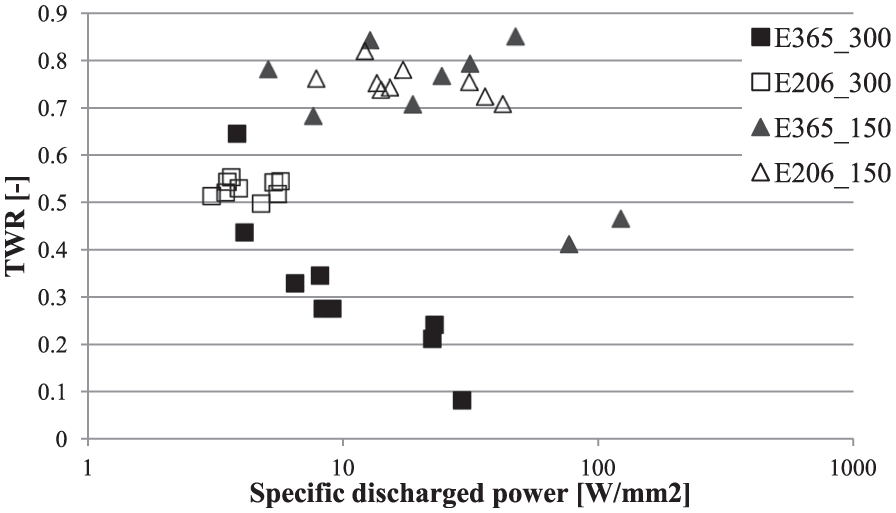
TWR as a function of the specific discharged power, E365 and E206.

Electrode wear as a function of the specific discharged power, E365 and E206.
In general, using E365, the electrode size influences the discharge process: the reduction in the diameter causes a reduction in the electric field intensity and therefore a worsening of the process performance. This effect cannot be observed when the lower energy level is used: E206 gives rise to a certain smoothing of the wear and TWR effects.
Figure 13 shows DOC as a function of the specific discharged power where a particular result occurs. The points are distributed on two zones: the upper one belongs to micro-holes realized using 150-µm electrode, while the lower one is related to 300-µm electrode. E206 energy level permits to obtain a lower DOC scatter with respect to the E365 energy. No significant trends were found as a function of the specific discharged power.

DOC as a function of the specific discharged power, E365 and E206.
Finally, TR as a function of the specific discharged power is reported in Figure 14. No particular effects can be pointed out except for the micro-holes realized using 150-µm electrode at E365 energy level; in this case, TR assumes significant higher values.

TR as a function of the specific discharged power, E365 and E206.
Predictive models
From an industrial point of view, the capability to forecast the process performance of the micro-EDM drilling process can be particularly useful. The forecasts can be used, for example, for the estimation of the machining costs and machine engagement or in order to evaluate the feasibility of a certain machining process. Nowadays, such a mathematical formal relationship is not available, for this reason, a linear and non-linear approaches were implemented. The regression analysis was implemented with Weka, open-source data mining software. 20 In particular, two different approaches were implemented here: the simple linear approach and the ‘model tree’ approach. A linear model (LM) tree is a decision tree with a linear functional model in each leaf, whereas in classical regression tree it is the sample mean of the response variable for statistical units in each leaf (hence, a constant) that is being considered. LM trees can be seen as a form of locally weighted regression, while regression trees are piecewise-constant regression. 21 The partition in leaves is executed based on the minimization of the error rate.
For both models, a 10-fold cross-validation approach was used: with this approach, the data set is divided into 10 parts, then the 90% is taken for the training and the last 10% is used for testing. Then with the same division (90%–10%) another 90% is selected for training and the other held out 10% (different from the previous) is used for testing. This procedure is repeated 10 times with different 90% selections. This approach helps for the estimation of the error with the first 10 runs and for the implementation of the classifier with the 11th run. In fact, once the cross-validation has been implemented, the software runs the algorithm with the whole data set for the 11th time. This leads to the production of the classifier usable for the prediction of the analysed variable.
The initial data set variables considered here for the regression are composed of electrode nominal diameter (D), energy level (E), peak current (I), peak voltage (V), energy per spark (E/spark), energy per second (E/s), total number of sparks (S), number of sparks per second (S/s), as input parameters and tool wear, machining time, hole top diameter and hole bottom diameter as dependent variables.
Regression model for the electrode wear
The linear regression equation for electrode wear is the following
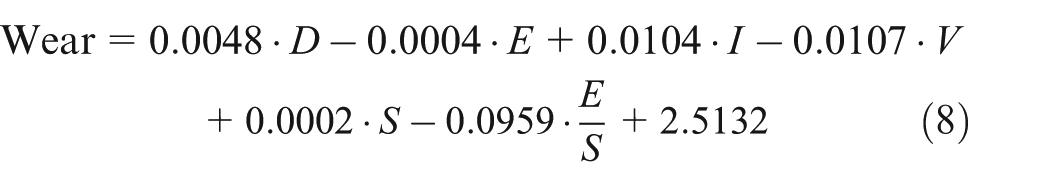
The correlation coefficient is very good, as reported in Table 6.
Summary of the electrode wear linear regression.

The structure of the obtained non-LM is reported in Figure 15. In this case, based on the values of the diameter, the energy per second and the energy level, different LMs can be applied. The correlation coefficient is higher, and at the same time, the error is considerably lower if compared with the linear error (Table 7).
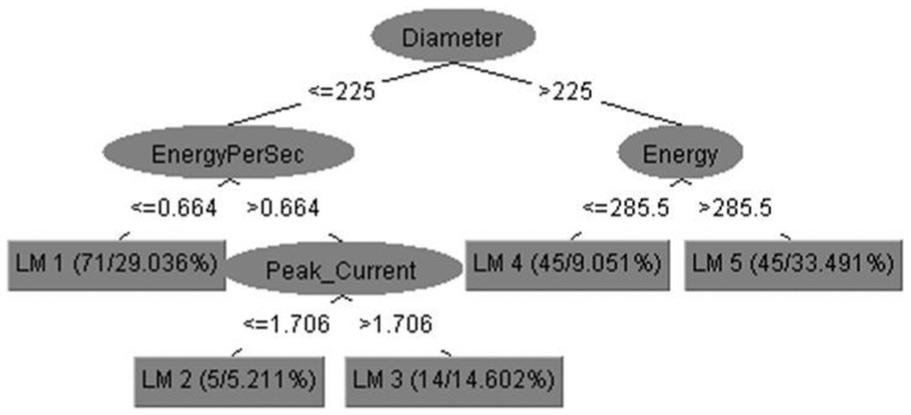
Non-linear models of the regression tree for the electrode wear.
Summary of the electrode wear non-linear regression.

The non-LMs for each of the four branches are reported as follows


As a general remark, the non-linear approach ensures a lower error level and better regression capabilities than the simple linear regression. A trade-off between the usability of the model and the prediction capabilities still exists: it is necessary to evaluate for each case if the real improvement in the regression capabilities are balanced by the considerable increment of the model complexity.
Regression model for the machining time
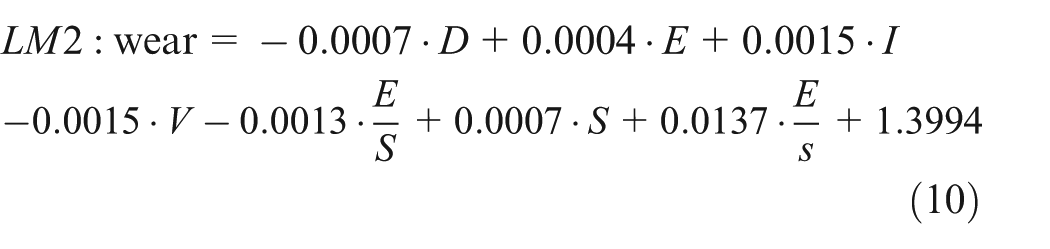
The linear regression equation for the machining time is reported below

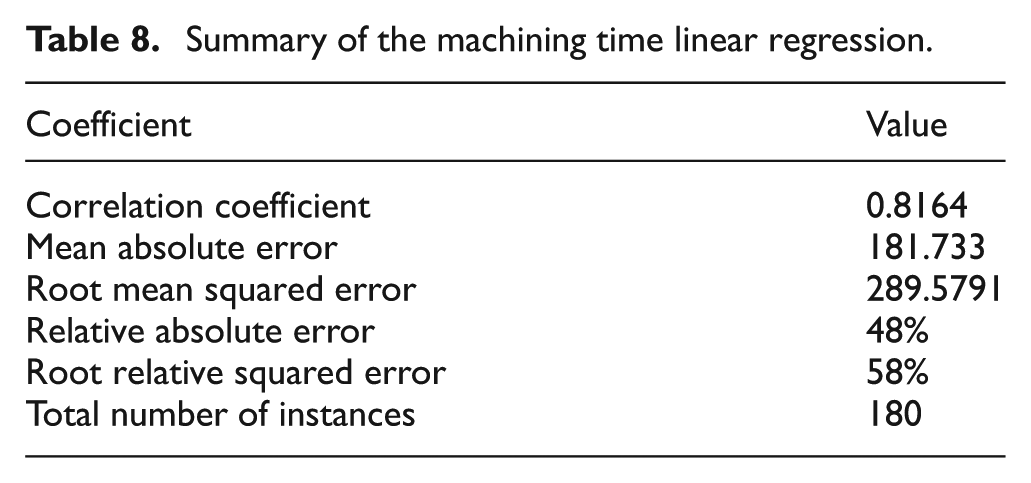
The correlation coefficient is reported in Table 8. Considering that the model tree approach does not improve significantly the prediction capabilities of the model (Table 9), it is not reported here.
Summary of the machining time linear regression.
Summary of the machining time non-linear regression.

As it is possible to notice, in this case, the non-linear approach level of accuracy is very similar to the linear one. Based on this result, the use of a simple linear approach is desirable.
Conclusive remarks
In this article, a study about the effects of the actual values of electrical parameters on the performance on micro-EDM drilling of stainless steel was carried out. A dedicated acquisition system for the measurement of effective electrical parameters during the drilling process was implemented. A DOE approach was applied and three parameters were included in the analysis, namely, peak current, voltage and energy level. From the analysis of variance emerged that the energy level is the most relevant factor for both the electrode diameters investigated here. Based on the measured data, it was possible to calculate the discharged power that demonstrated to be representative of the energy level and of the process parameters. In order to investigate the influence of I, V and energy level on the performance and geometrical indicators, the specific discharged power was chosen as a comprehensive variable.
MRR is strongly affected by the specific discharged power when high level of energy is used. Especially, for the 300-µm electrode, the performance improves, increasing the specific discharged power. When low value of energy is used, the specific discharged power has a very modest effect on MRR for both electrode diameters.
The relation between TWR and specific discharged power is function of both energy level and electrode diameter. Using E365 and 300-µm electrode, TWR decreases increasing the specific discharged power. The behaviour is opposite for the 150-µm electrode. When E206 energy is used, for both electrode diameters, the index seems to be only slightly influenced by the specific discharged power.
Regarding the geometrical characteristics of the micro-holes, no significant trends of DOC as a function of the specific discharged power were found. Anyway, electrode diameter and energy level affect the overcut. Using 150-µm electrode, micro-holes have a larger overcut than using 300-µm electrode. The lower value of energy level permits to obtain lower range of DOC.
No particular trend of TR as a function of the specific discharged power was found. TR assumes higher values for micro-holes using 150-µm electrode at E365 energy level.
Finally, two different regression approaches (linear and non-linear) were implemented for the electrode wear and machining time forecast. It was demonstrated how the increasing complexity of the non-linear approach is not always balanced by an effective increment of the correlation coefficient. For the machining time, the simple linear can be considered the best. On the contrary, for the electrode wear, a significant improvement of the forecast capabilities was achieved with a model tree regression approach. In conclusion, even though any attempt to forecast micro-EDM machining performance is limited by intrinsic and unexpected phenomena, (like side discharges, short circuits and arcs) the direct measurement of the process parameters and the machine learning approach helped in developing more reliable predictive models.
Footnotes
Academic Editor: Xiaotun Qiu
Declaration of conflicting interests
The author(s) declared no potential conflicts of interest with respect to the research, authorship and/or publication of this article.
Funding
The author(s) received no financial support for the research, authorship and/or publication of this article.