
Abstract
In micro-electro-discharge machining drilling, the problem of tool wear is a well-known fact. In order to minimize the effect of tool wear on the accuracy of fabricated product, an online tool wear monitoring and compensation system needs to be integrated with the micro-electro-discharge machining machine. The existing monitoring and compensation system very much relies on the pulse discrimination. The available systems assume that pulses are isoenergetic and are applicable to a single parametric setting only. In order to make the system more robust, a new pulse discrimination and tool wear compensation strategy which is suitable for a wide range of parametric settings is proposed. In this context, an empirical relationship between “average energy” (AE) and “volume removal per discharge” (VRD) is established and verified with experimental results.
Keywords
Introduction
Micro-electro-discharge machining drilling (µEDM-drilling) process is a prominent technique for drilling holes even down to Ф100 µm in hard metallic pieces. Two other available and extensively used technologies for micro-hole manufacturing are laser and mechanical drilling. The first one has a constraint of high setup cost for generating famtosecond laser which is used for high aspect ratio (>10) holes on metallic piece. 1 The tool (solid conducting rod) used in µEDM-drilling is much cheaper than the tool (laser beam) used in laser micro-drilling. On the other hand, mechanical drilling produces chatter and tool breakages when drilling low diameter band (100 µm). Also, the cost of the tool for drilling hard metal in this diameter band is too high.1,2 Since µEDM-drilling is of non-contact type, the problems associated with mechanical drilling are completely eliminated. However, a greater usage of µEDM technology in industrial applications is hindered due to the problem of tool wear which is a well-known fact in the arena of micro-electro-discharge machining (µEDM).3–5 In conventional electro-discharge machining (EDM), although the dimensional inaccuracy in the fabricated component caused by tool wear could be neglected due to its comparatively large feature size and tolerances, in µEDM, this could not be as it is reported that the diameter of drilled hole can even be less than 5 µm 6 and up to an aspect ratio of 15. 7 In such cases, even a small inaccuracy in depth, caused by tool wear will result in rejection of the component. It has been suggested previously that research should be carried out to find optimal combinations of process parameters to curb the aforementioned shortcomings. 8 However, by optimizing the process parameters, this error could be minimized to some extent but cannot be eliminated completely.9,10 In this context, pulse discrimination (PD)-based real-time tool wear monitoring and compensation method may lead to complete elimination of such problem. PD employs the use of voltage and current signatures to capture the pulses in the discharge gap. PD is used because each discharge pulse contains different information regarding the amount of material eroded from workpiece and tool.11,12
Most of the existing monitoring systems had their main interest on the study of process mechanics and gap phenomenon of transistor-based conventional EDM. These monitoring systems which utilize voltage and current signatures of discharge are mostly based on the discrimination of pulses. In the past, several strategies were proposed to discriminate the pulses. Snoeys and Cornellissen 13 extracted a feature called “ignition delay” from the voltage signal and used this feature to discriminate the pulses into “normal spark” and “harmful arc.” Dauw et al. 14 developed an improved PD system based on the evaluation of time-related pulse parameters such as “voltage rise time,”“ignition delay time,” and “discharge duration.” They employed these parameters to discriminate EDM pulses in seven main classes. In addition to these features, another feature, namely, “fall time,” used to discriminate pulses, was introduced by Weck. 15 A new feature, “voltage threshold value,” which when used in combination with “ignition delay” lead to the development of a new adaptive control system for conventional EDM, was pioneered by Snoeys et al. 16 Later on, Blatnik et al. 17 utilized voltage signal along with current signal for better discrimination of harmful pulses from the useful ones. Tarng et al. 18 used voltage and current pulses to develop a fuzzy set of rules for classification of various discharge pulses in conventional EDM. Zhou et al. 19 improved the existing PD systems by introducing a new set of fuzzy rules. Literature review reveals that PD strategies were initially developed for transistor-based conventional EDM. These strategies cannot be used directly for µEDM since its waveform characteristic is different from conventional EDM. In recent past, Liao et al. 20 and Yeo et al. 21 developed PD strategies for µEDM. Liao et al. 20 discriminated the pulses based on three predetermined levels of discharge voltage. However, these predetermined levels of voltage may make this PD system applicable for only single input machining condition. Yeo et al. 21 also proposed a strategy using both current and voltage signals to discriminate the pulses, wherein an acquisition length of 1000 samples was used to capture one complete pulse, followed by discrimination of pulses using a threshold of current signature. As the strategy is dependent on fixed acquisition length, once a different input process parameter is selected, the acquisition length needs to be changed accordingly. It is readily understood that for this system to be applicable for general parametric settings, prior information on the acquisition length at various input process parameters must be made available. The aforementioned limitations justify the need to modify the existing PD strategies in a way such that it can be applied to general process parameters settings. As micro-fabrication industries seek a robust tool wear monitoring and compensation method that can work for a wide range of input parameters, any successful attempt to develop a robust PD system which suits µEDM-drilling process will prove to be helpful.
Although the problems of tool wear in µEDM-drilling is a well-known fact, very limited research has been carried out to address this issue. Aligiri et al. 3 first attempted to solve this problem, and they adapted a tool wear compensation philosophy proposed by Jung et al.22,23 which has been applied to µEDM-drilling and micro-electro-discharge machining milling (µEDM-milling). Aligiri et al. developed a real-time “material removal volume estimator” by multiplying the “number of normal discharges” to the “single crater volume.” However, the single discharges are not representative of the actual process, and the measurement of single crater volume is affected by high inaccuracy. 24 Second, in order to make the system applicable for general parameters settings, prior information on the acquisition length at various inputs process parameters must be made available, and finally, the method assumes that the pulses are isoenergetic. However, Bissacco et al.24,25 addressed that the pulses in µEDM are non-isoenergetic. Therefore, even for a constant parametric setting, the energy of an individual pulse is not identical. Hence, the methodology proposed by Aligiri et al. 3 would over estimate or under estimate the actual volume. Therefore, it would be justified to develop a more reliable and robust real-time wear compensation strategy for µEDM-drilling, considering all the shortcomings presented in the above literature.
In order to propose a robust tool wear compensation strategy, the authors have first developed a new PD strategy to discriminate the pulses. Finally, they proposed a wear compensation strategy followed by its validation.
Development of PD system
This section will provide a detailed methodology associated with the development of PD system. In the first phase, discharge conditions are identified from the signals captured from voltage probe. After that, a new PD strategy is proposed to discriminate the pulses in real-time.
Identification of discharge conditions
In order to identify the discharge conditions, µEDM-drilling experiment is performed on µEDM machine (model: DT 110; make: MIKROTOOLS) which has resistor–capacitor (RC)-type pulse generator. NI-digitizer card (model: 5122) which has the capability to capture analog data up to 100 MS sampling rate is used to capture signals from current (model: i30; make: Fluke) and voltage (model: 701938; make: Yokogawa) probes. Signals from voltage and current probes are imported via digitizer card to LabVIEW software. Figure 1 shows the schematic of the experimental setup.
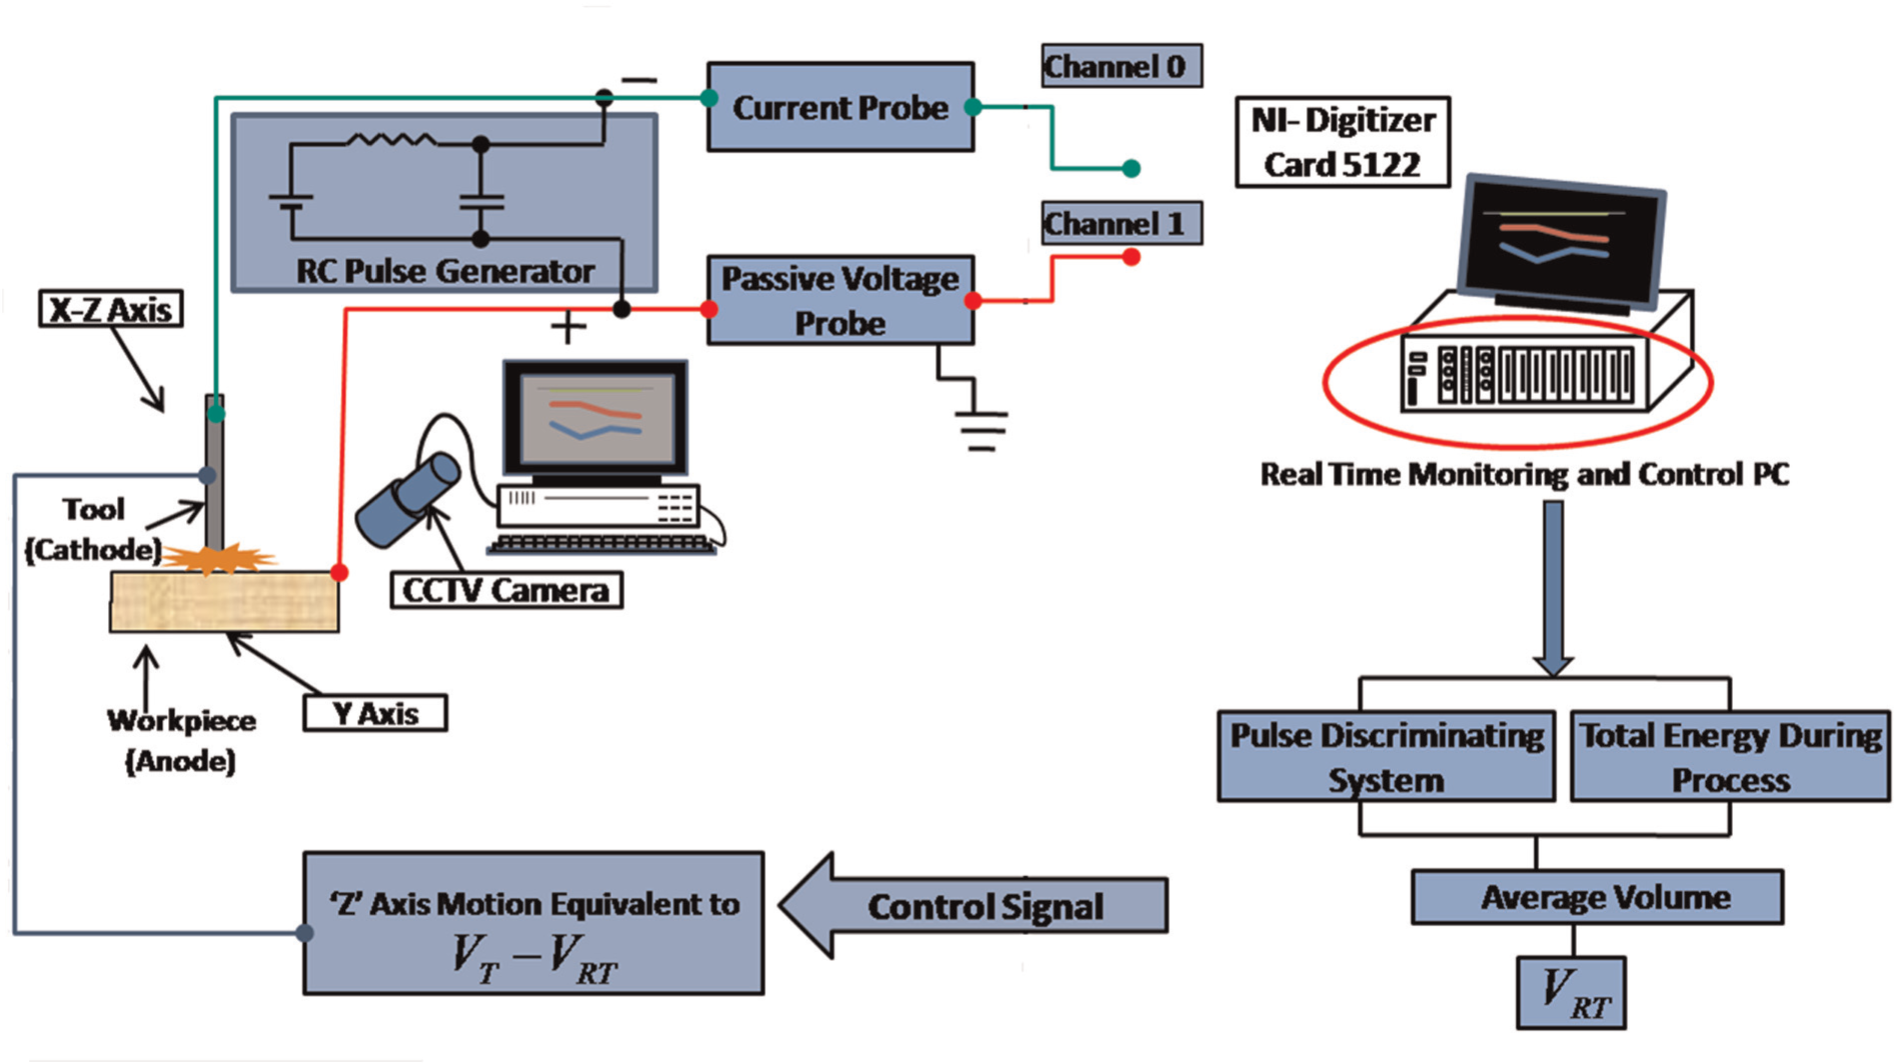
Schematic of experimental setup.
PD strategy
Figure 2(a) shows typical voltage waveforms captured during trial experimentation in µEDM-drilling. It could be seen from this figure that each pulse has its own charging and discharging voltage. The charging voltage of a pulse is denoted by “VC” while “VD” represents discharging voltage. In the same figure, it could also be seen that there are some noises which appear over the actual signals. These noises in signals are not desirable because these will cause difficulties in identifying actual discharges. In order to eliminate noises, signals are made to smoothen by using “moving average filter technique” with a factor 3. Once noises are filtered, it would be easier to identify a pulse by observing a sudden fall or rise in data points. If there is a sudden fall in a data point by more than 5% of open circuit voltage (OCV), a discharge is observed. It is obvious that during discharge, the difference in the level of any data point with respect to previous one is positive. If there is a sudden rise in data points or the difference between these is negative, it is identified as charging. By repeated observations, it is found that a 5% rise or fall in data points is fairly suitable for identifying charging or discharging. Figure 3 shows a typical µEDM waveform in which small dots indicate the data points. It has been observed that when data points of a pulse fall from OCV to 0 V, it takes more time to discharge as compared to the pulse discharging from a value (“VC”) lower than OCV. This causes variation in discharge duration from pulse to pulse which is shown in Figure 4.
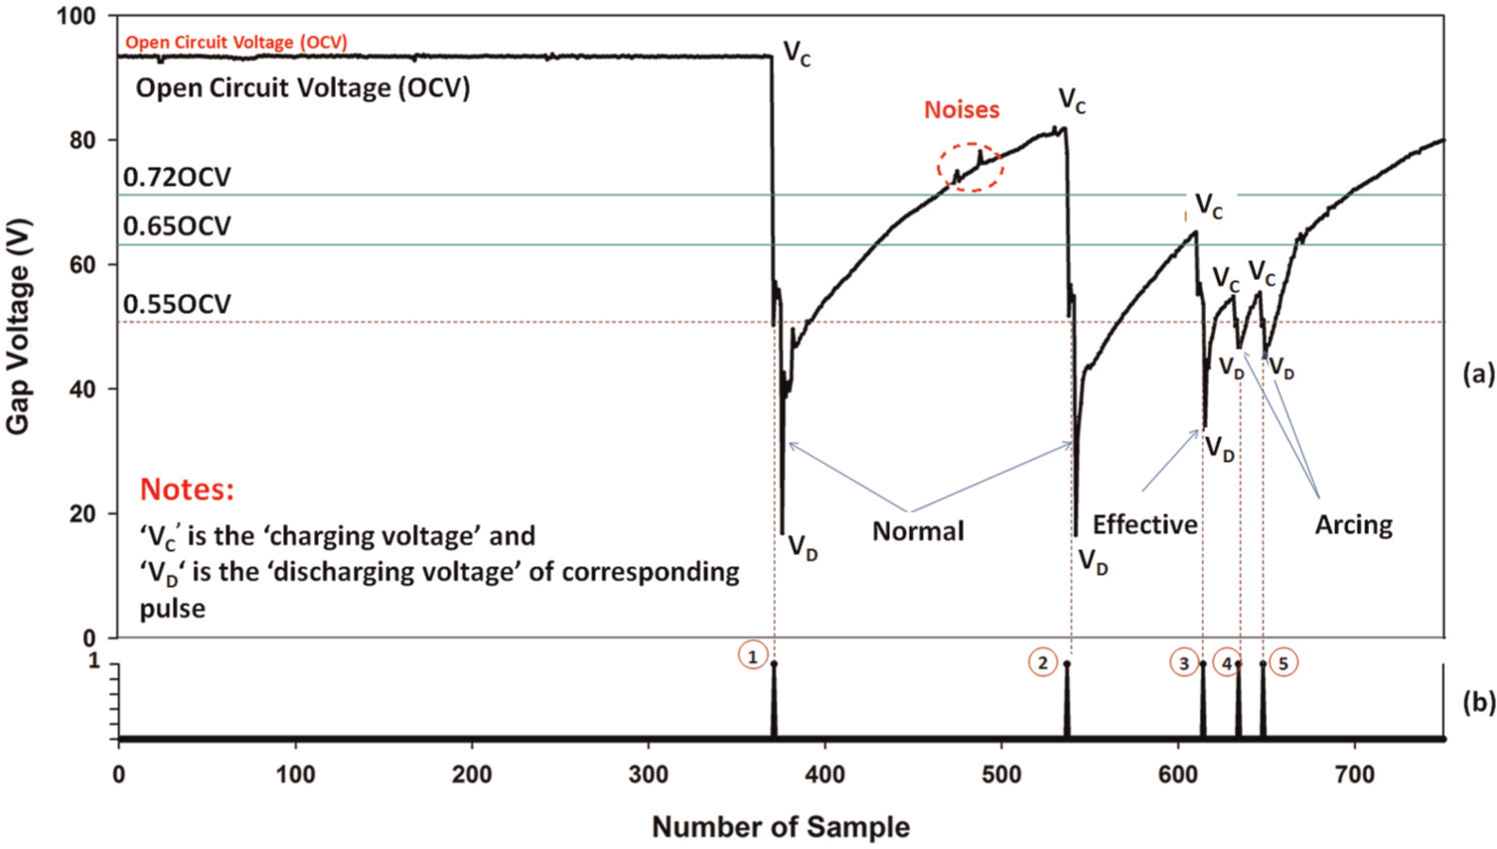
(a) µEDM-drilling gap waveform captured from the developed PD system and its classification (b) flag for counting discharges.
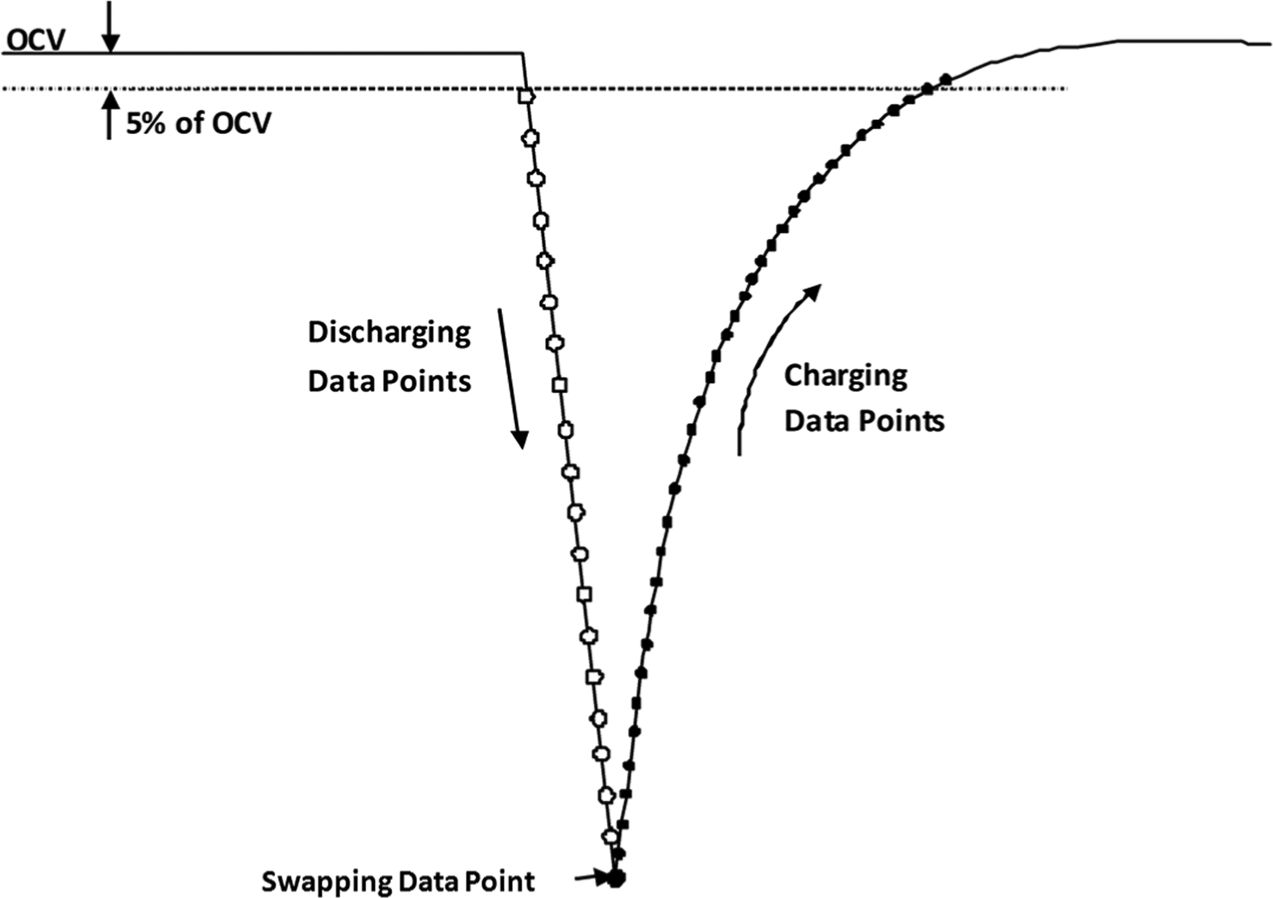
A typical µEDM waveform showing discharge strategy.
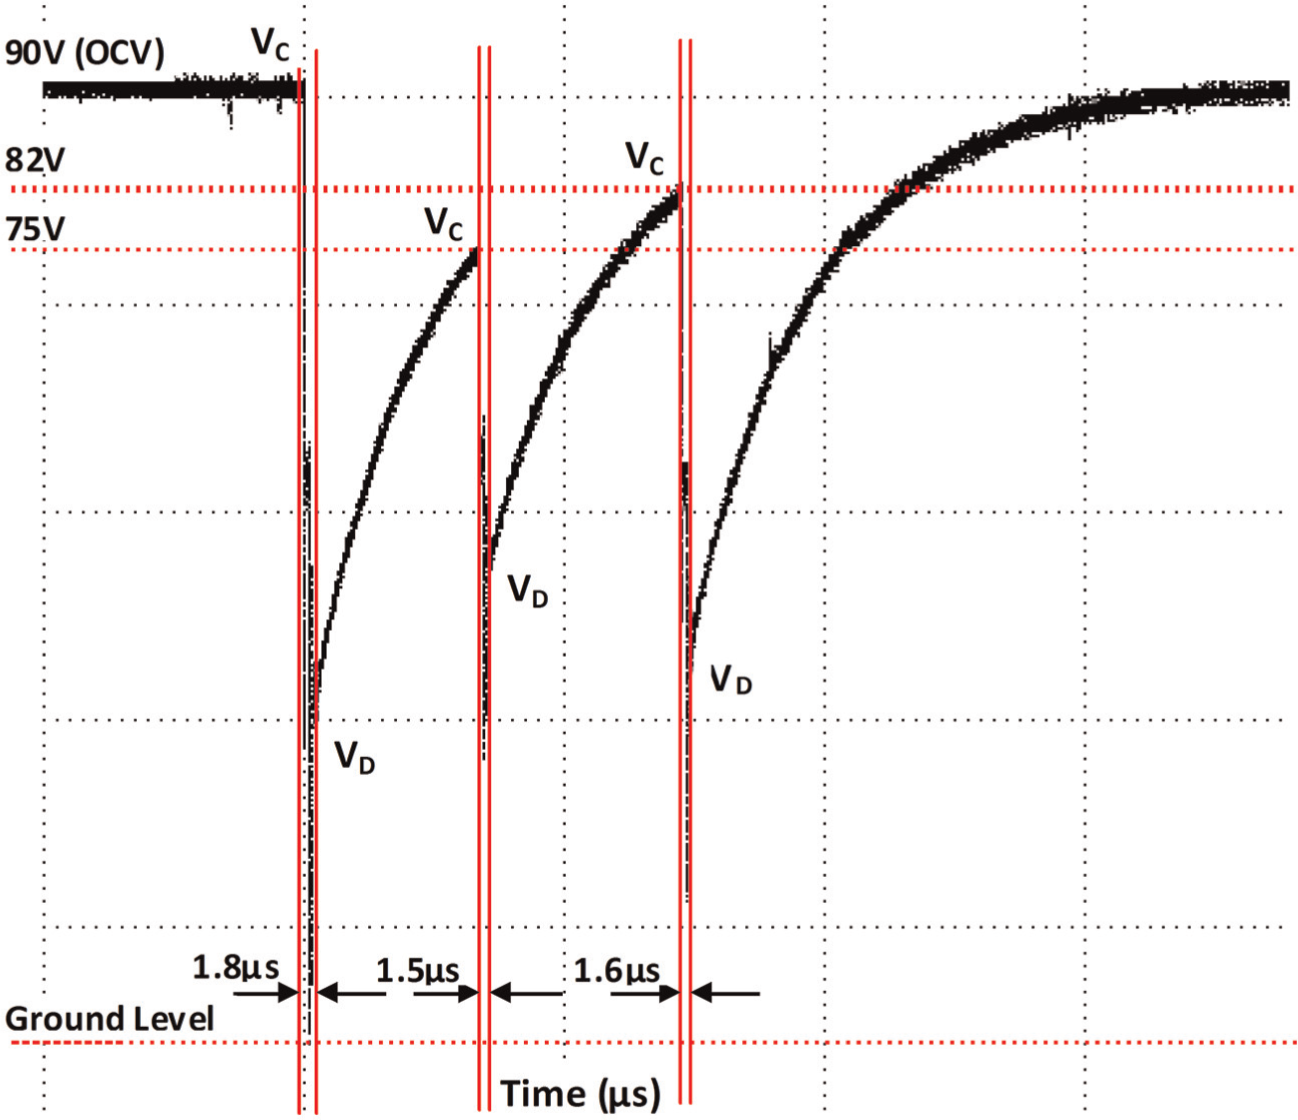
µEDM-drilling waveform showing discharge duration.
In this work, the pulses are classified into four groups such as normal, effective, arcing, and short circuit based on the following voltage thresholds. The authors have used some basis to set those thresholds. It is a well-known fact that normal pulses contribute mostly in material removal. On the other hand, material removal depends upon energy content per pulse. It is reported that in a RC circuit–based EDM machine, the maximum power in a discharge can be obtained at 72% of OCV. 26 Therefore, the threshold for normal pulse is set to 72% of OCV. It is also observed that when the pulses come in a group (arcing), their “VC” is always less than 0.65 OCV. Therefore, the threshold for identifying arcing is set to 0.65 OCV. Arcing indicates that the dielectric has not fully deionized and results in the occurrence of repetitive discharges. Arcing has a very low discharge time as compared to normal discharge. Arcing may be considered as a harmful discharge as it occurs at the same physical location of the workpiece and tool repetitively, and causes damage to both the tool and workpiece material. In RC-type µEDM, discharge is supposed to happen once the capacitor is fully charged to OCV. But it could be seen from Figure 2(a) that few discharges may happen even before the capacitor is fully charged to OCV. In this work, effective discharge is defined as a pulse in which charging voltage (VC) lies between 72% and 65% of OCV. This kind of pulses look similar to the normal pulses with the difference only in magnitude of “VC” and “VD.” The limit of “VC” for all types of discharges are determined through a number of observations and found to be fairly suitable. Short circuit does not contribute in material removal. It could be identified as a pulse which has “VC” below 55% of OCV or a straight line at the ground level. In short circuit, there is a metal-to-metal contact that results in high current amplitude. Figure 5 shows the flowchart of the proposed discrimination strategy.
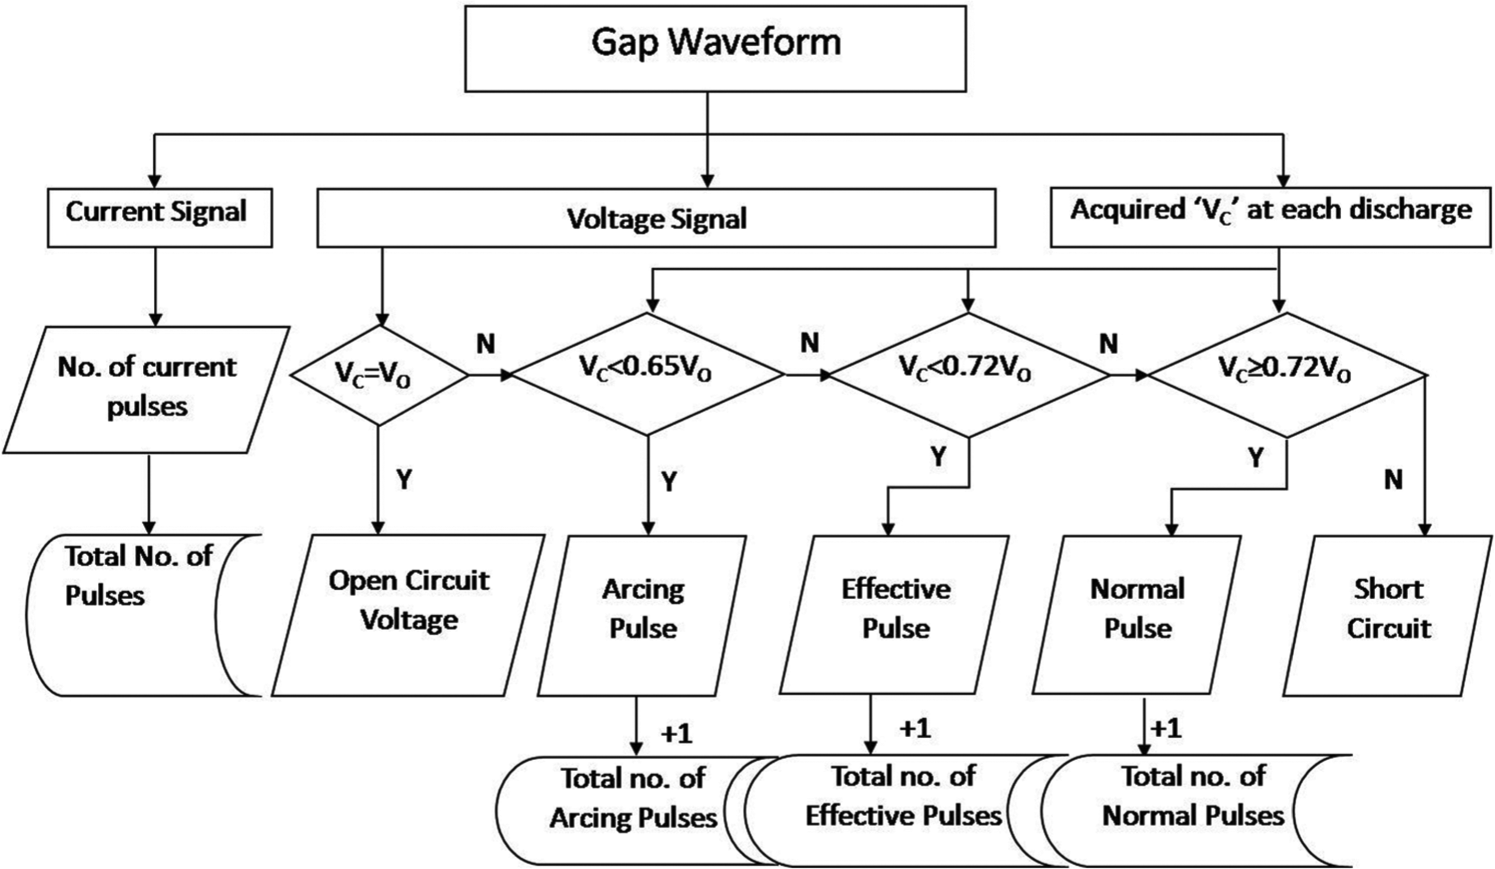
Pulse discrimination strategy (“Vo” is OCV).
Validation of the developed PD strategy
In order to validate the applicability of the developed PD strategy to general process parameters settings, the authors have taken the help of experimental results. Experiments have been conducted at six different parametric settings. Figure 2(a) shows typical pulses captured by the developed PD system. The figure depicts that the pulses which discharge from “VC” equal to or more than 0.72 OCV are successfully classified as normal pulses. The pulse which occurs when “VC” is more than 0.65 OCV but less than 0.72 OCV is successfully differentiated from normal pulse and classified as effective pulse. Similarly, the developed PD system is also successfully identifying arcing from the whole pulse trains when any of them has “VC” lies in between 0.65 and 0.55 OCV. Therefore, it is confirmed that the PD system is capable of discriminating the pulses in various classes successfully. The applicability of this developed strategy to general process parameters settings could be confirmed with respect to the following aspects. First, Figure 2(a) shows that the strategy is capable of discriminating continuous pulse trains of all kinds which do not require any fixed acquisition length. This has been made possible, as the strategy works on continuous detection of “VC” of each pulse. Second, the thresholds for various categories of pulses have been set in terms of percentage of OCV and thus making the system independent of peak detection of voltage or current waveform. As OCV varies with change in process parameters, the absolute value of thresholds also gets changed automatically. Thus, the aforementioned key implementations in PD strategy make the PD system applicable to general input process parameters settings. With the help of the developed strategy, the responses such as “number of pulses,”“energy evolved per pulse,” and “the percentage” of all kind of pulses are recorded in real time at all parametric settings. To count the pulses of various types, flags as shown in Figure 2(b) are used. The responses obtained through PD system at different parameter settings are shown in Table 2. While capturing these responses, no additional changes are incorporated into the strategy. The responses are shown in Figure 6 through the front panel of the developed PD system.
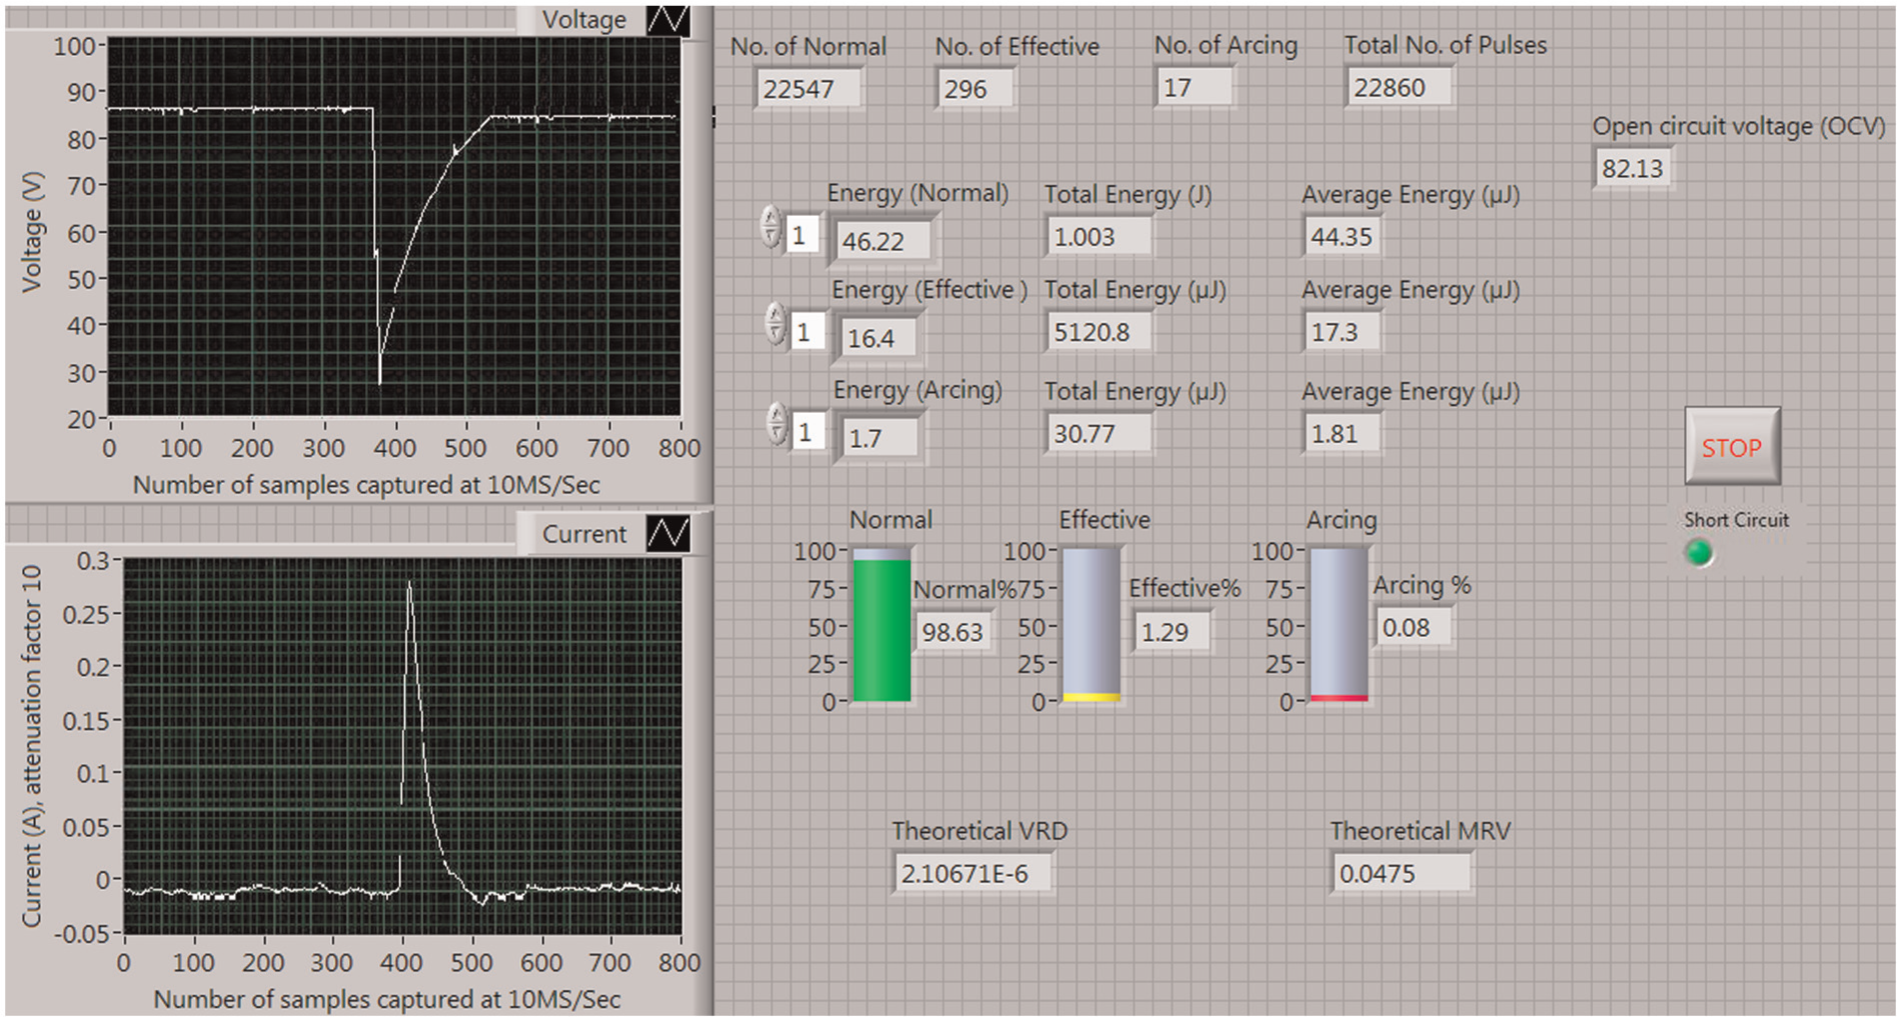
Front panel of the developed PD system.
Characteristics of discharge pulses in µEDM-drilling
The proposed PD system has been used to estimate total energy evolved for the entire machining time. In order to achieve this, the energy evolved for each pulse is first calculated by multiplying its instantaneous voltage with the corresponding current and finally summed together. It has been observed that the normal pulses in µEDM-drilling exhibit discharge duration of 1–2 µs and peak current of up to 10 A. The corresponding discharge energy per pulse varies from 6 to 500 µJ. The percentage of normal pulses for the entire machining time varies from 100% at the beginning to 87% at the end of the machining, whereas for the effective and arcing pulses, it varies from 0% to 13% and 0% to 3%, respectively. The discharge energy per pulse for the effective and arcing pulses is in the range of 1–70 µJ and a few nJ to 1 µJ, respectively. Due to seldom occurrence and very small amount of discharge energy contained in it, the effective and arcing pulses lead to negligible contribution in the material removal and are therefore neglected in the analysis.
As has already been discussed in “Introduction” section, even for a constant parametric setting, the energy content of each normal pulse has noticeable variation. In order to realize this fact, first a random number of normal pulses (say 50) are captured from an ongoing µEDM-drilling operation at a capacitance of 1 nF and a gap voltage of 85 V. Finally, the energy content of each pulse is calculated and plotted as shown in Figure 7. The standard deviation of discharge energy of these 50 pulses is obtained as 29.4. Hence, it is conformed that RC-based µEDM pulses are non-isoenergetic in nature. Figure 8 shows the percentage variation of normal, effective, and arcing pulses with machining time. It can be seen that the percentage of normal pulses decrease with machining time while that of effective and arcing pulses undergo exactly opposite. This percentage variation of the pulses with respect to the machining time could be attributed to the fact that with increase in machining time (or machining depth), debris removal from the machining zone becomes more difficult. This results in keeping the dielectric ionized, even during off time and initiates the occurrence of secondary discharge before the capacitor is fully charged or more severely before the dielectric is fully deionized. 19 This condition favors the occurrence of effective and arcing pulses.
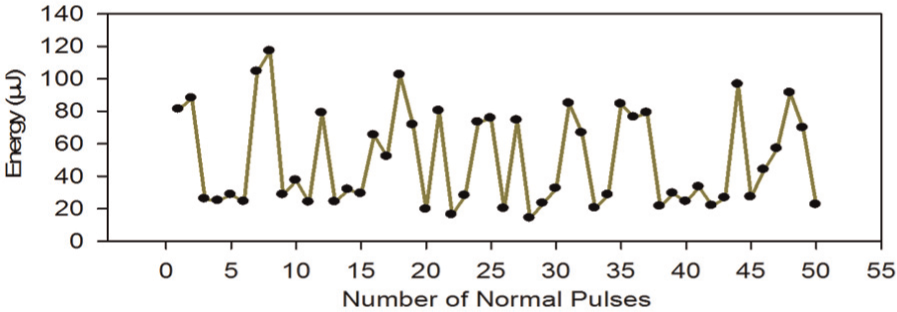
Discharge energy of individual normal pulses showing non-isoenergetic nature.
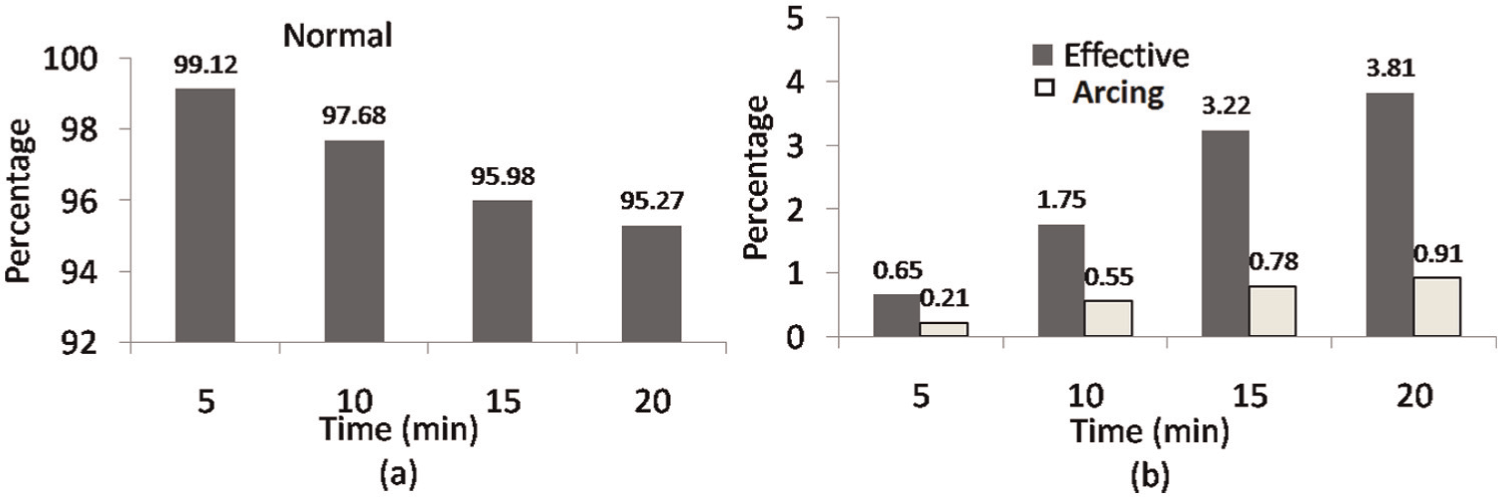
Pulse distribution in µEDM-drilling under various machining time for (a) normal and (b) effective and arcing pulses.
Tool wear compensation strategy
Although the tool wear compensation strategy proposed in this work has been adapted from the approaches proposed by Aligiri et al. 3 and Bissacco et al., 24 still the authors feel further improvement before making these approaches applicable to the present problem. The strategy proposed by Bissacco et al. 24 was based on statistical characterization of the discharge population and applied to µEDM-milling. The tool wear compensation was done by estimating tool wear per discharge (TWD). According to them, the compensation was obtained by discharge counting and multiplying the number of discharges with TWD. Although the tool wear compensation strategy proposed in this work is based on a similar approach, the strategy has been applied to µEDM-drilling rather than µEDM-milling. Moreover, instead of monitoring or predicting tool wear directly, the authors have used an indirect approach by estimating material removal from workpiece. In order to execute the same, the present strategy uses a feature, namely, “volume removal per discharge” (VRD) using workpiece instead of tool. Furthermore, there is a distinct difference in the processes that estimate TWD and VRD. This is because µEDM-drilling differs from µEDM-milling in terms of the stability of the processes. In µEDM-drilling, the material removal volume does not remain proportional when drilling a hole of an aspect ratio greater than three. 3 This instability of the process for deeper holes may cause rapid generation of unstable pulses such as arcs and shorts. These unstable pulses do not contribute in material removal. Consideration of these pulses may lead to under estimation in VRD, and hence, abnormal pulses must be separated from the contributing ones. In order to separate non-contributing pulses from the contributing one, full discrimination of discharges is required. And hence, in this work, PD system has been integrated to tool wear compensation strategy in order to yield an accurate VRD. However, full discrimination–based tool wear compensation in µEDM-drilling was first implemented by Aligiri et al. 3 This approach was based on discharge discrimination and material removal characterization through measurement of crater volume of single discharge. However, the single discharge is not representative of the actual process, and the measurement of single crater volume is affected by high inaccuracy. 24 Therefore, in this work, volume removal from workpiece is estimated by multiplying VRD with number of contributing pulses only. The following section will provide a detailed discussion on the development of the new strategy for tool wear compensation in µEDM-drilling. In order to accomplish this goal, the authors have taken help of the experimental results.
Experimentation for the proposed strategy
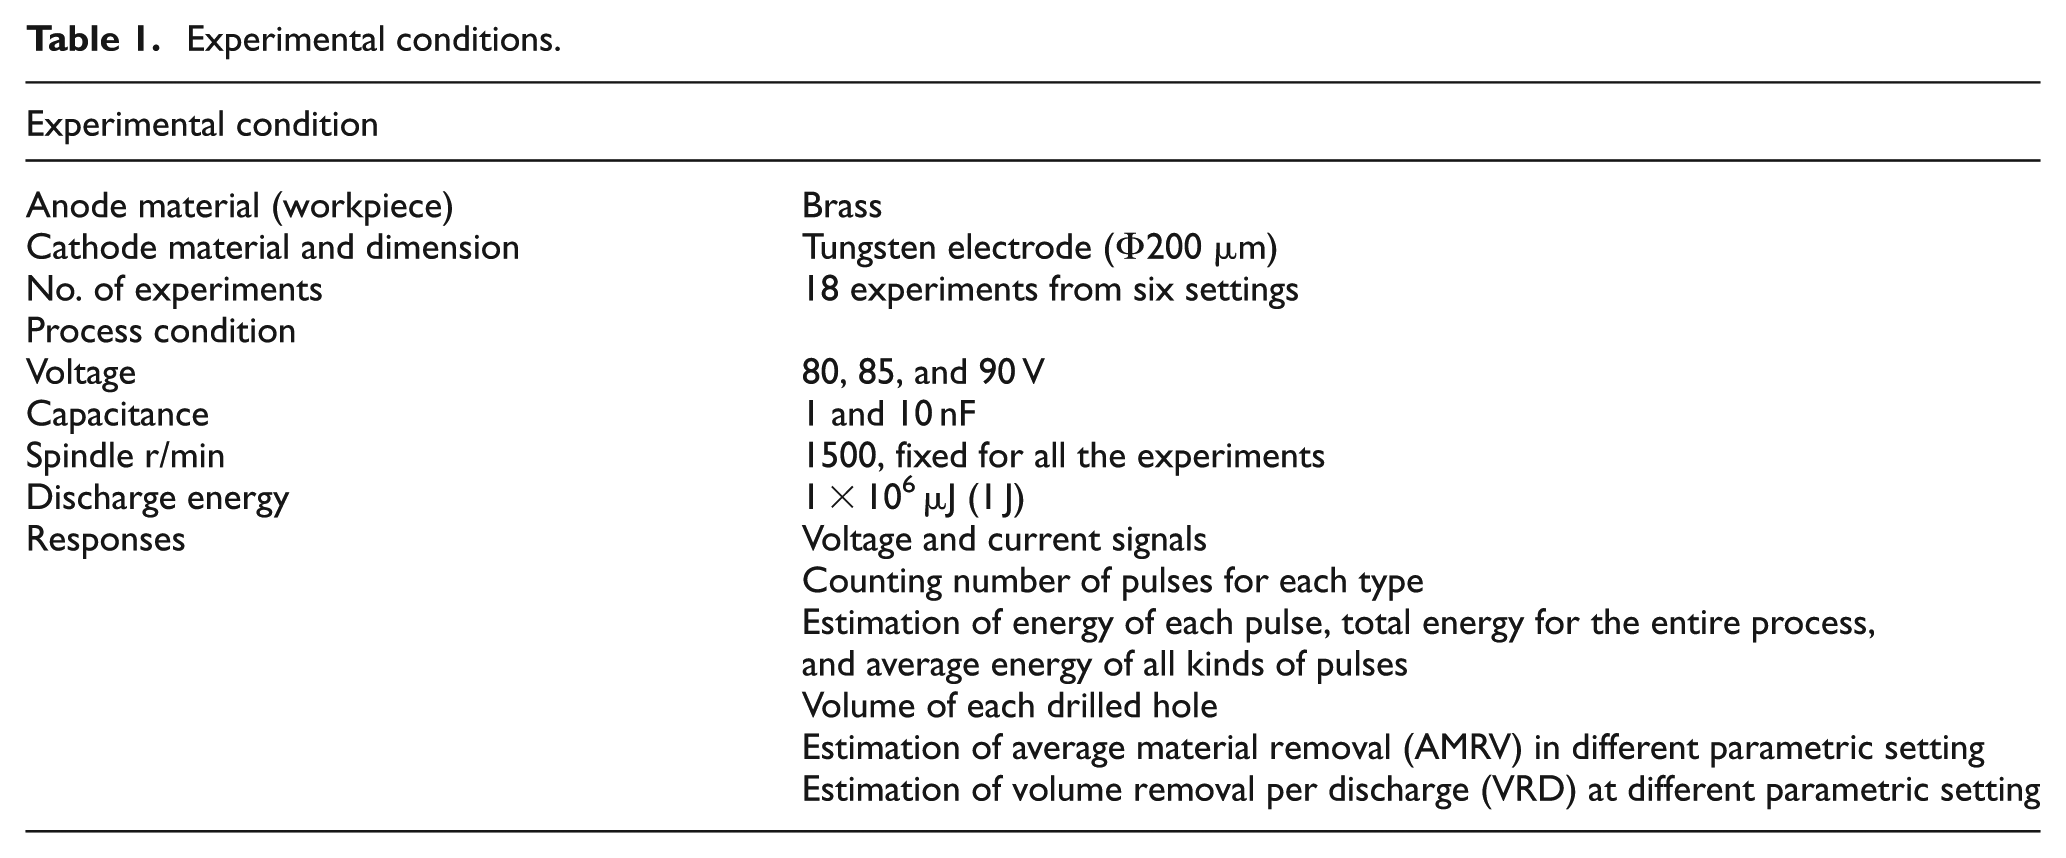
In order to develop this strategy, six different parametric settings (Table 1) are chosen, and all the experiments are carried out till the total discharge energy reaches to 1 J. Each experiment is repeated three times. The responses such as, number of contributing pulses (normal and effective) and material removal volume (MRV) are obtained.
Experimental conditions.
Workpiece preparation
Brass plates in the form of split workpiece are used as work material. The two wire-EDM machined surfaces of the workpiece are clamped together, and machining is carried out at their interface (refer to Figure 9). After machining, the splits are separated to examine the longitudinal cross-section of the machined hole. Using “data from graph technique,” the volume of material removal has been determined from the cross-section of the machined hole. The experiment has been conducted on the micro-machining center (refer to Figure 10) which has a resolution of 0.1 µm.
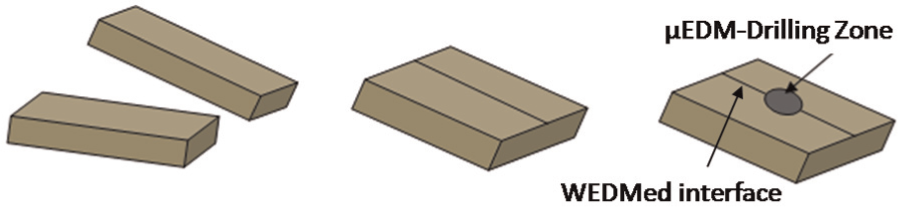
Workpiece preparation for µEDM-drilling.
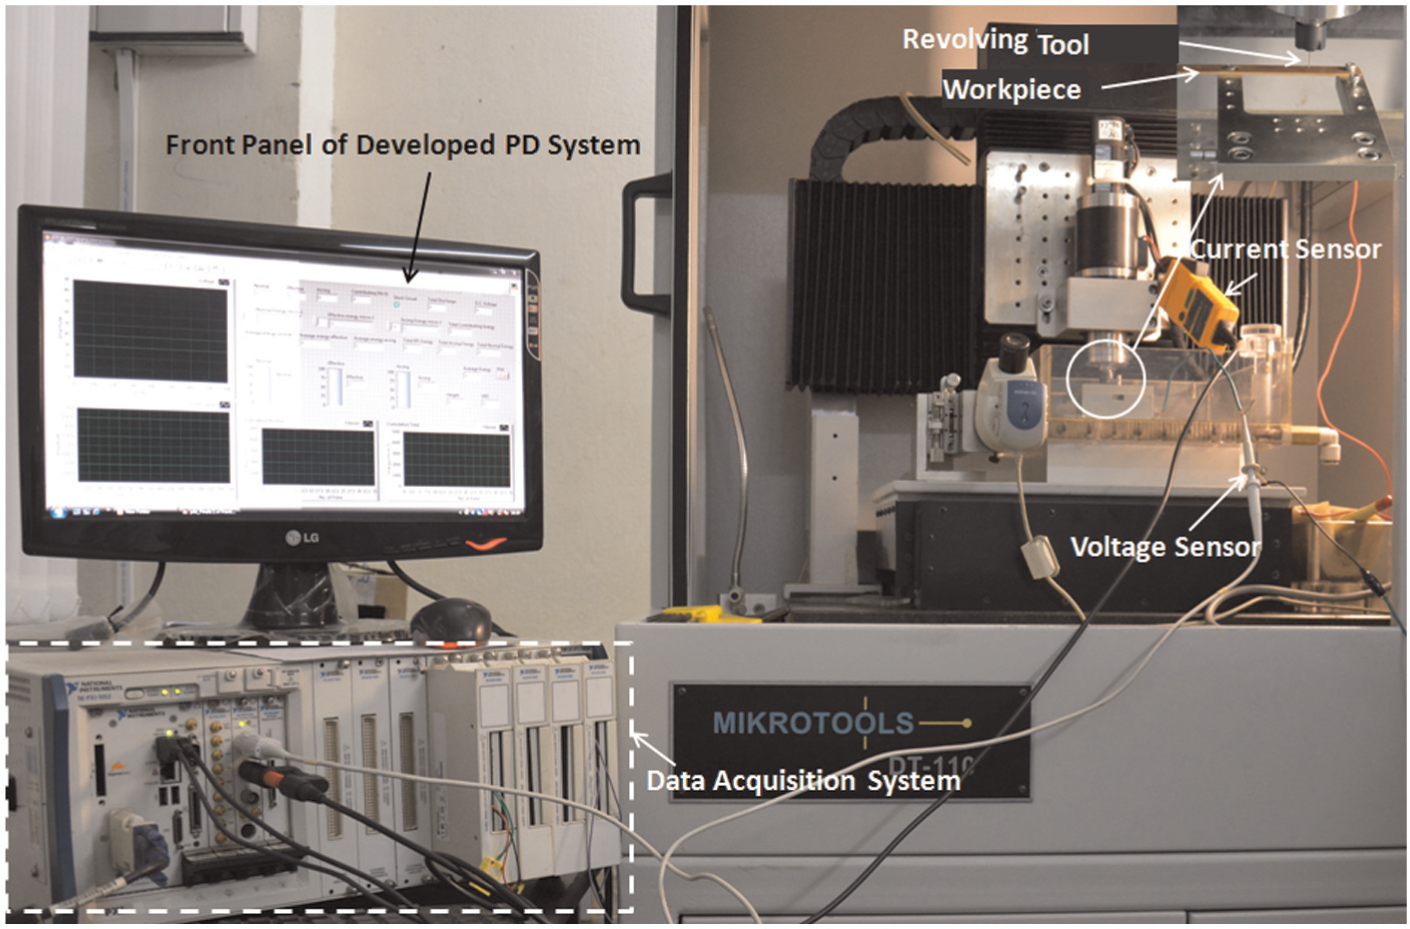
Pictorial view of the µEDM-drilling setup with sensors connection.
Volume measurement
Volume measurement of a µEDM-drilled hole has been carried out by the following procedure. An approach named “data from image” is used to measure the volume. After drilling an array of holes at the interface of two brass plates, Olympus-made, three-dimensional (3D) scanning tunneling microscope (STM) is used to capture the image of the cross-section. Later, these images are used to extract the points from their edges. Figure 11(a) shows the drilled hole on brass plate, whereas Figure 11(b) represents the right-hand-side section of the drilled hole. Furthermore, the right-hand-side section is revolved about the drill axis, and volume is estimated using 3D computer-aided design (CAD) modeling software. The 3D model representing the volume of the drilled hole is shown in Figure 11(c). The left- and the right-hand-side cross-sections are checked for symmetry, wherein a negligible percentage error of 0.02 is found.
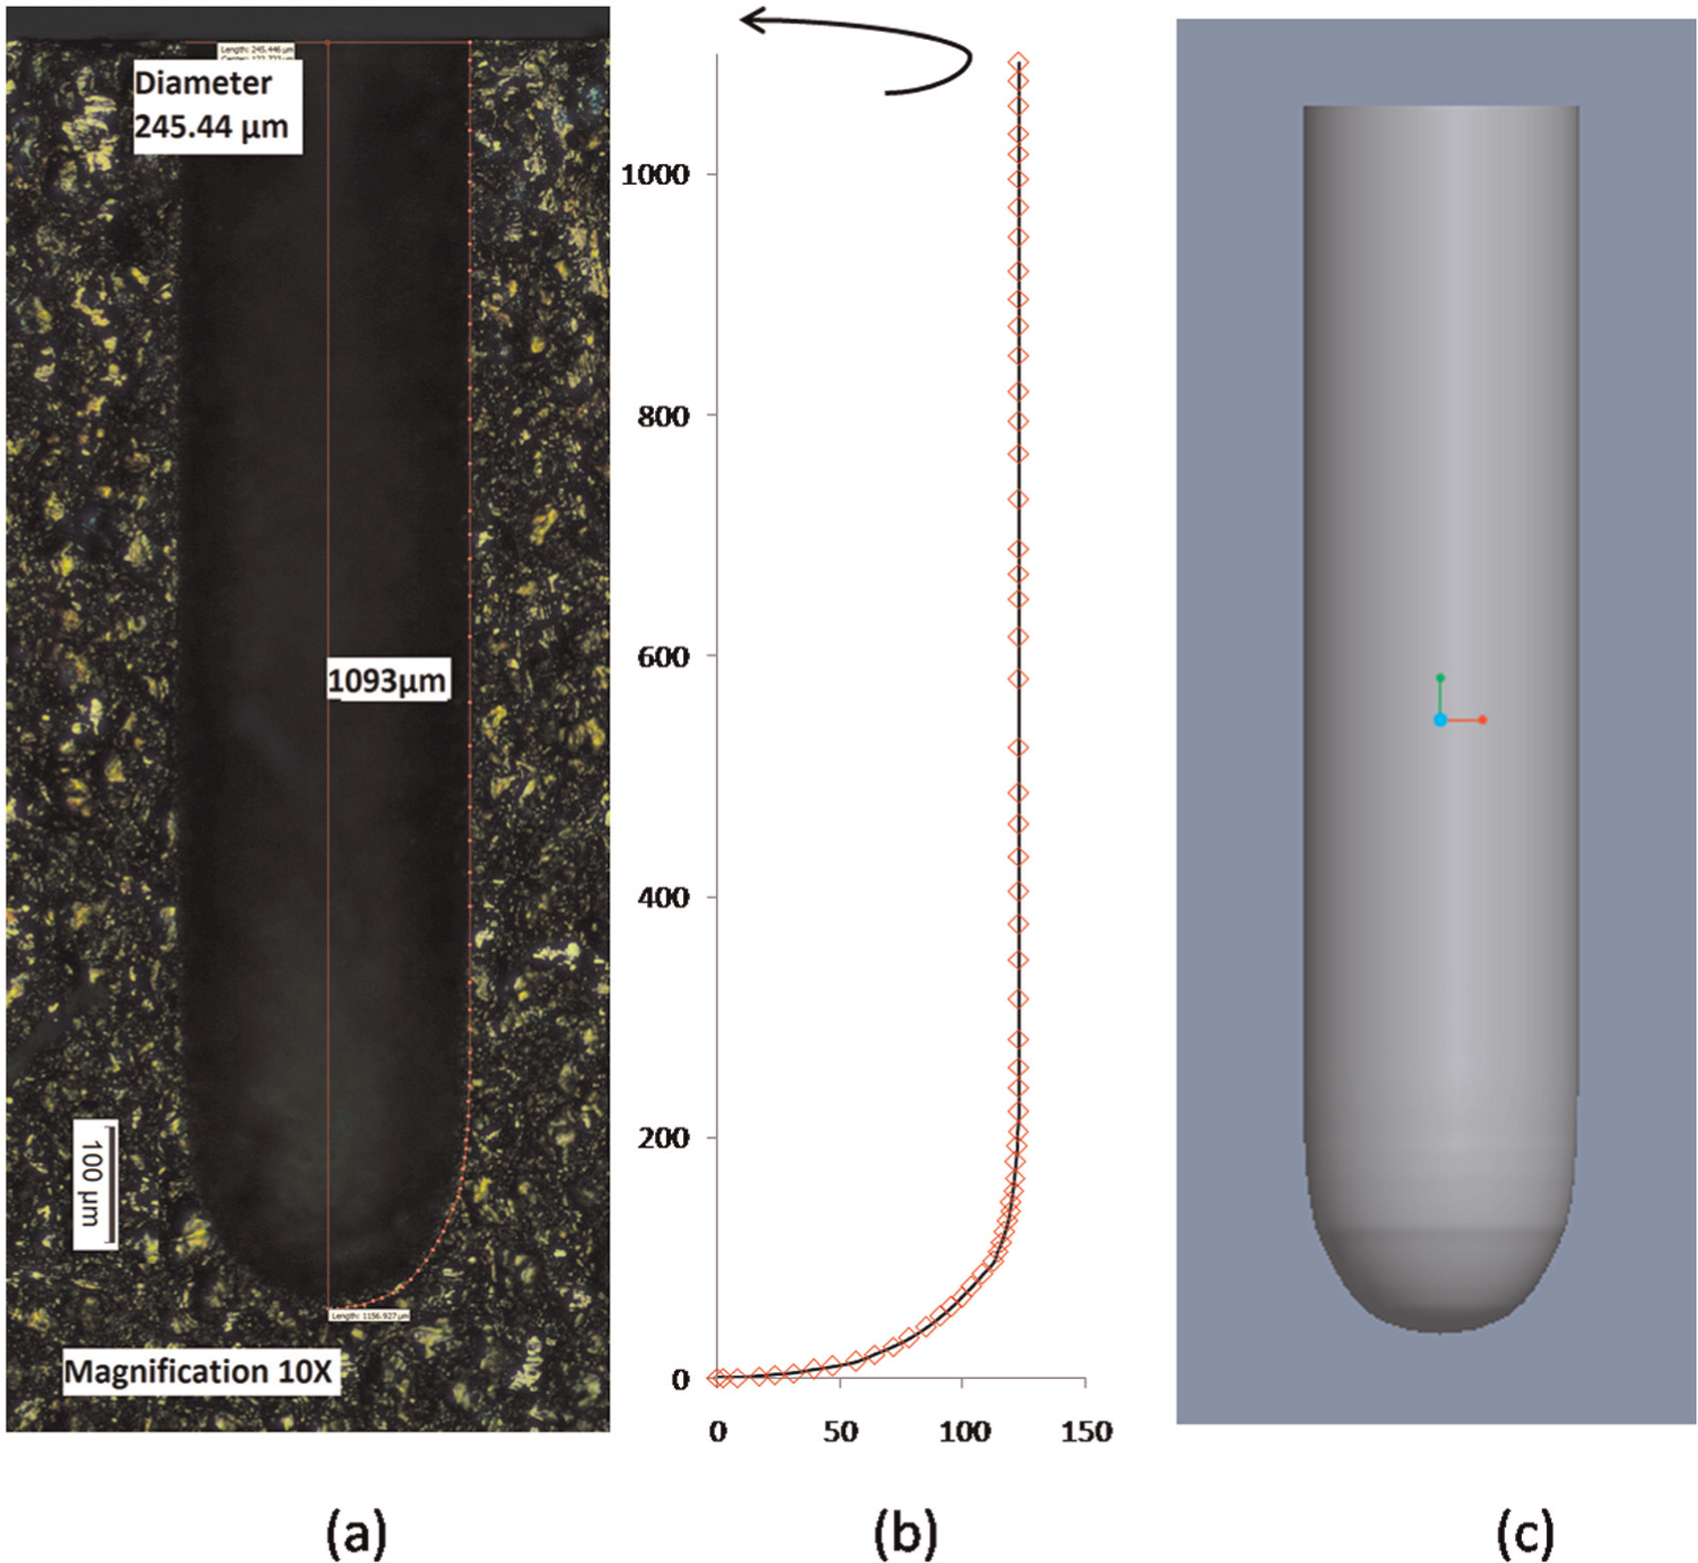
(a) µEDM-drilled hole in brass plate, (b) data from image, and (c) 3D model of drilled hole.
Experimental results and discussions
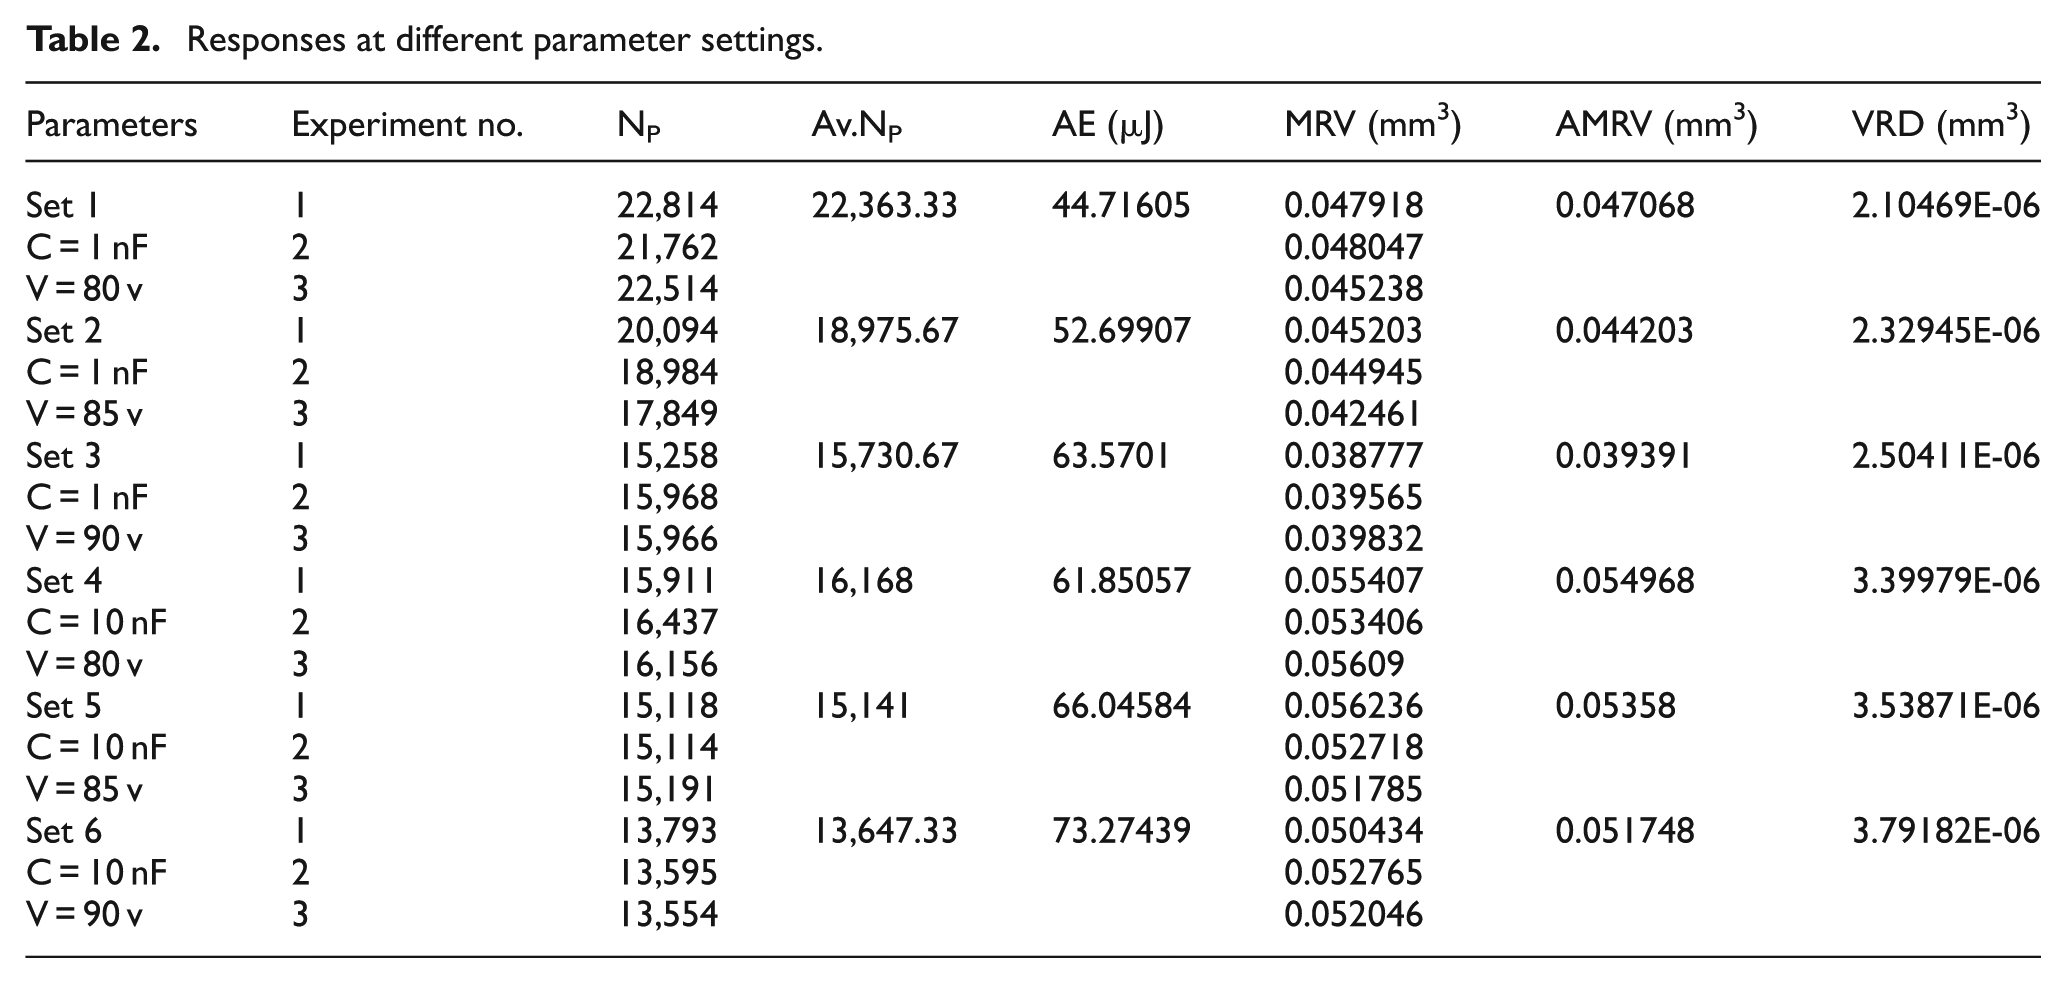
Experimental results have been tabulated in Table 2. It can be seen from this table that at different parametric settings and for the same value of total discharge energy (1 J), the “average number of contributing pulses” (Av.NP) is varying noticeably, whereas this variation is negligible for constant parametric setting. The table also reveals that for the same value of total discharge energy, the “average material removal volume” (AMRV) from workpiece at different parametric settings are different. Contrary to the expectations, AMRV value changes for the same value of total discharge energy. The variation in AMRV at different parametric settings could also be seen in Figure 12. This figure represents the variation of AMRV with respect to discharge voltage at two different capacitances. It reveals that AMRV decreases with the increment in discharge voltage at both capacitance values. The reason can be explained by the fact that, as discharge voltage increases, it also increases the energy of individual pulse resulting in increase in crater size. These large craters at high discharge voltage may have more overlapping (refer to Figure 13) which causes a decrease in total volume. It is obvious that the total volume of two discrete craters is larger than the total volume of two overlapping craters. 6 From Figure 12, it is also observed that the slope of the curve at capacitance of 10 nF is less than the slope of the curve at capacitance of 1 nF. This can be attributed to the fact that at larger value of capacitance, the over-cut becomes greater. The over-cuts of the drilled hole at the lower and higher capacitance are measured as 44 and 70 µm, respectively. The increase in the magnitude of volume due to increase in over-cut reduces the effect of crater overlapping. The over-cut is greater when the capacitance is 10 nF; therefore, the slope for the corresponding curve is less than the slope of curve for 1 nF.
Responses at different parameter settings.
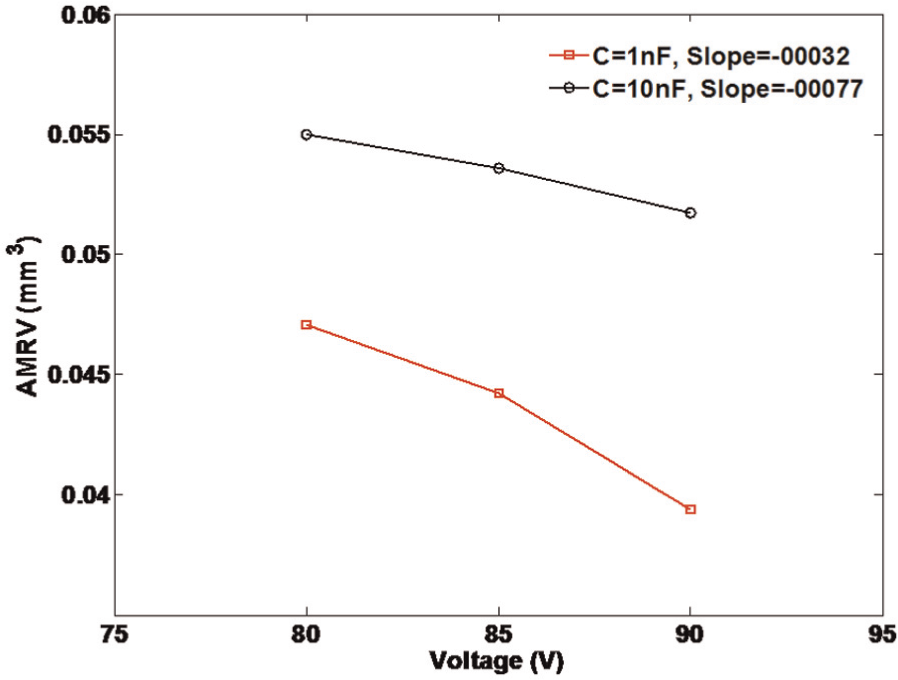
AMRV at different levels of voltage for capacitance 1 nF and 10 nF.
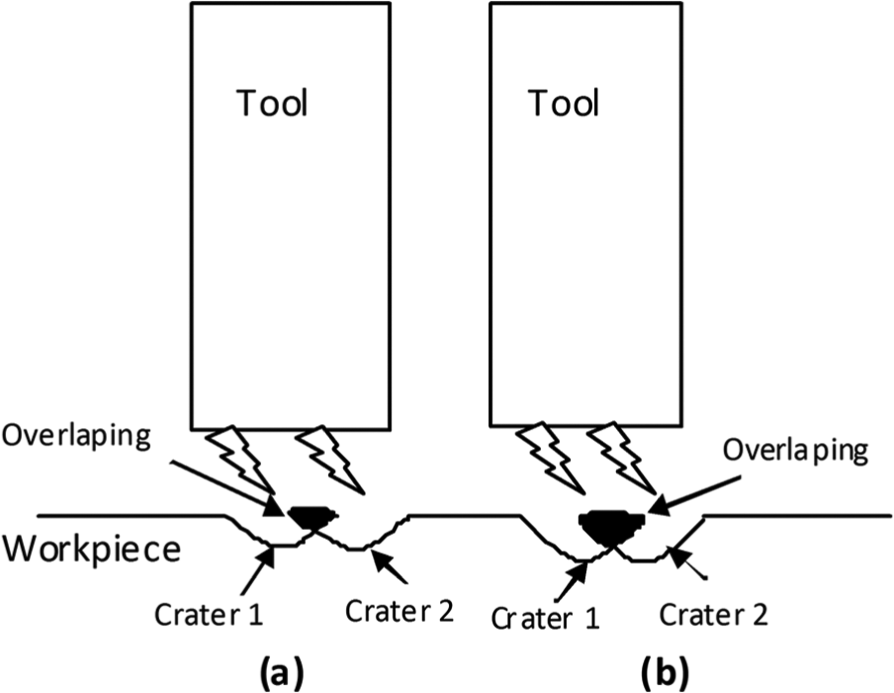
A typical crater overlapping at (a) lower and (b) higher discharge voltage.
It was mentioned in the previous section that the authors in this work have used an indirect approach of tool wear compensation strategy in µEDM-drilling. This indirect approach is based on the estimation of “volume removal” from workpiece instead of tool. In order to estimate volume removal from workpiece in real time, the authors have used a feature called “VRD.” VRD is obtained by dividing AMRV with Av.NP. The experimental results as tabulated in Table 2 reveal that AMRV varies noticeably once a new process parameter is chosen. This variation in AMRV with parametric settings will also cause variation in VRD. Hence, in order to make the tool wear compensation strategy applicable to general parameters settings, the VRD at different parametric settings must be made available. Consequentially, every time a new parameter is chosen, the corresponding VRD has to be determined, that is, quite time-consuming. In this regard, a relationship between VRD and parameter settings may lead to complete elimination of such a problem. Therefore, it is desired that the parameter settings are represented in a quantitative form, which can be used to relate VRD and parameter settings. In this regard, a feature called “average energy” (AE) has been used to represent a parametric setting. AE is computed in real time after full discrimination of pulses with help from the developed PD system. It is defined as the ratio of the instantaneous energy of contributing pulses to the instantaneous number of contributing pulses. The AE has been monitored in real time and is found almost constant with a standard deviation of 0.37. Therefore, it is confirmed that AE is a good representation of parameters settings. Variation in VRDs at different average energies (AEs) could be seen in Figures 14 and 15. Relation has been obtained between AE and VRD. This relation is used to estimate VRD for unknown values of AE within the range under consideration. This real-time, estimated VRD corresponds to a particular process parameter that can further be used to estimate “real-time volume removal” VRT. In order to estimate (VRT) from workpiece, VRD at any particular AE is multiplied to the number of contributing pulses (Av.NP) for an ongoing machining. This VRT can be compared with “target volume” VT, and the difference may be fed to the machine “Z-axis” servomotor for tool wear compensation.
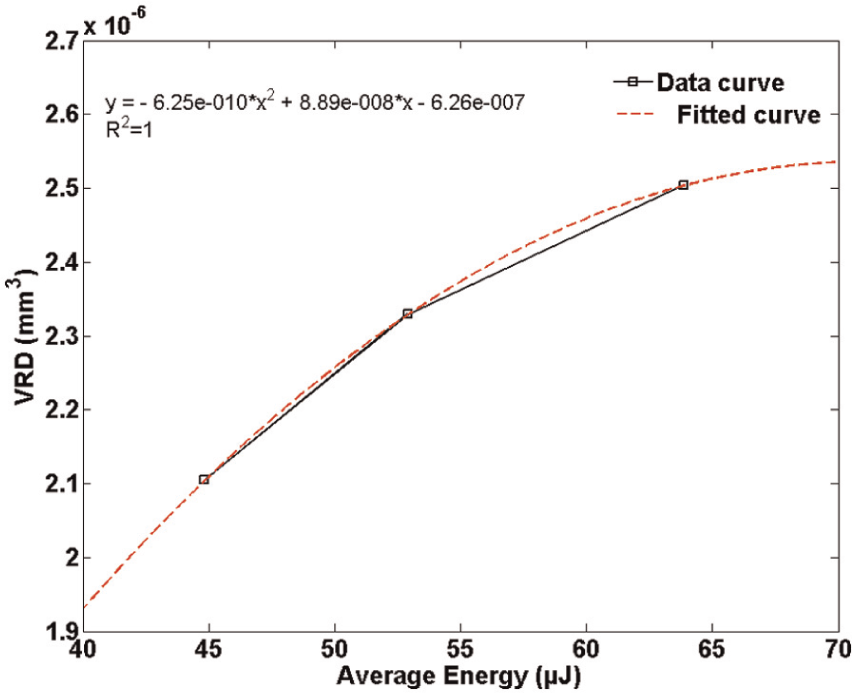
VRD as a function of average energy at capacitance 1 nF.
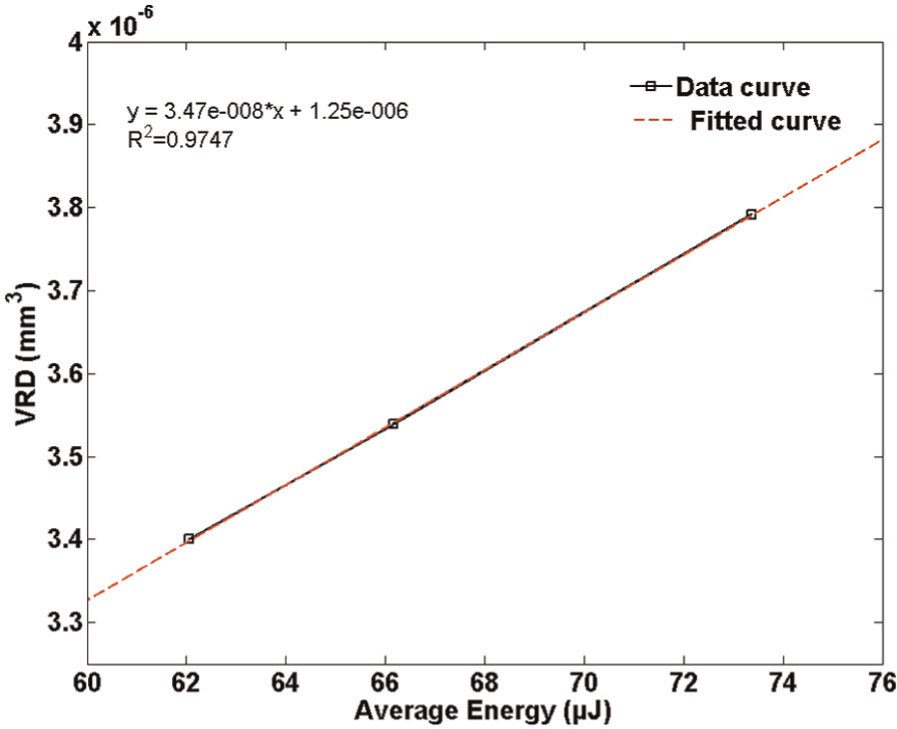
VRD as a function of average energy at capacitance 10 nF.
Validation of the proposed strategy
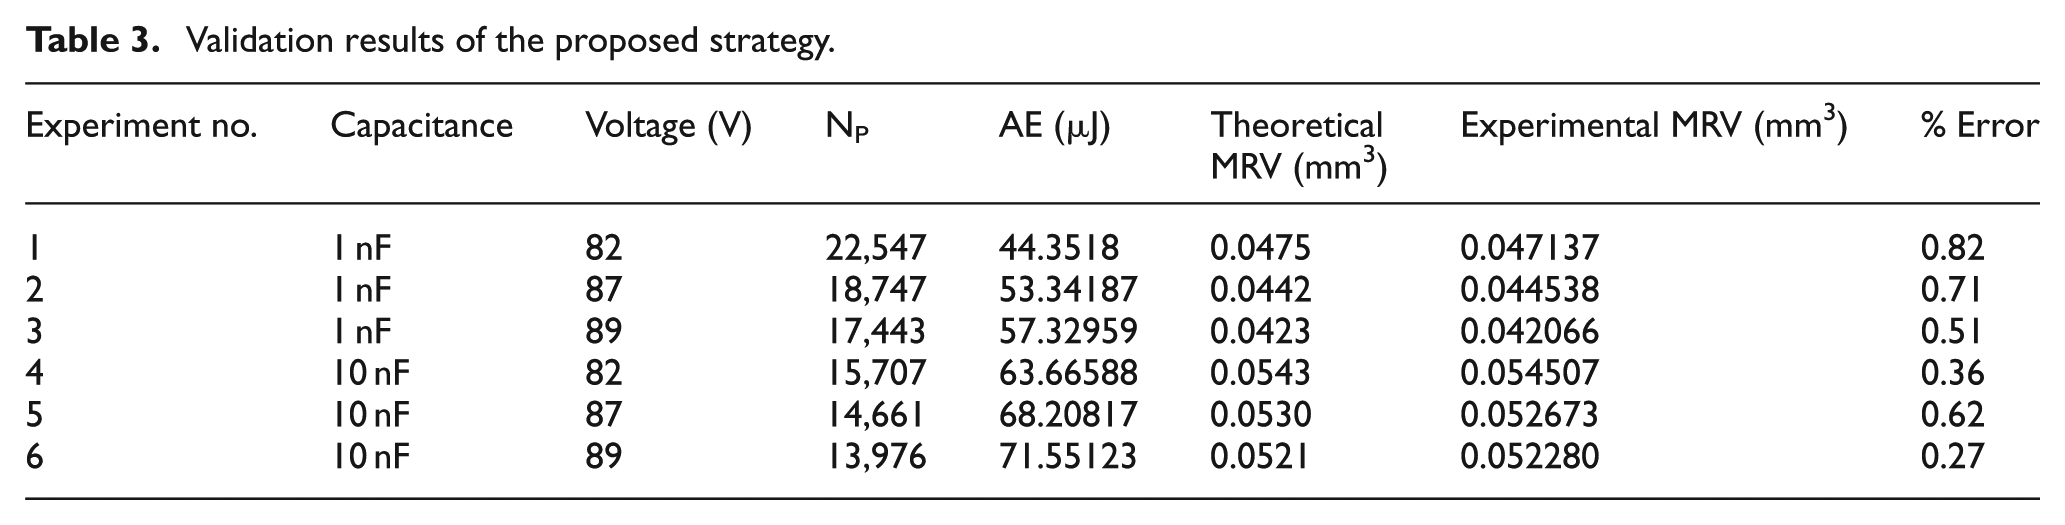
In order to validate (a) the relation between VRD and AE and (b) the accuracy of material removal volume (MRV) from workpiece estimated by the VRD obtained from the relation, a series of six more experiments are conducted at various parameters settings within the range under investigation. At the end of each experiment, MRV is calculated by multiplying VRD, obtained from the developed equations, with the number of contributing pulses. The predicted and experimentally determined MRV are tabulated in Table 3. The table shows that predicted results are in good agreement with the experimental results with a percentage error of less than 1. The validation results show that the proposed strategy could be used efficiently in tool wear compensation of µEDM-drilling for a wide range of process parameters settings. This work is limited to check only for the feasibility of the proposed tool wear compensation strategy for µEDM-drilling. Implementation of this strategy in real time with the help of the developed PD system is underway.
Validation results of the proposed strategy.
Conclusion
A robust PD strategy for µEDM-drilling has been proposed and validated through experiments. Validation results show that the proposed strategy is capable of doing full discrimination of pulses for general process parameters settings. A new tool wear compensation strategy in µEDM-drilling using material removal from workpiece has also been proposed. In order to make this strategy applicable to general process parameters settings, a relation between “average energy” (AE) and VRD has been established. This relation has been used to obtain material removal volume (MRV) from workpiece over a wide range of parameters settings. The predicted results are in good agreement with the experimental results. It hence confirms that the proposed strategy could effectively be used in real-time tool wear compensation in µEDM-drilling for general process parameters settings. The implementation of this strategy is underway.
Footnotes
Appendix 1
Acknowledgements
The authors gratefully acknowledge the financial support from Department of Science and Technology (DST), India, for carrying out this research.
Declaration of conflicting interests
The authors declare that there is no conflict of interest.
Funding
This research received no specific grant from any funding agency in the public, commercial, or not-for-profit sectors.