
Abstract
In the process of tunnel excavation, the vibration characteristic during cutter breaking rock process is the key factor affecting the TBM tunneling efficiency and cutter life. Therefore, it is necessary to investigate the vibration characteristics of the cutter while breaking different rock types. A series of full-scale cutter-breaking-rock experiments are conducted cutting red sandstone, granite, and limestone, where the vibration signals are monitored. And time-domain frequency-domain and time–frequency analyses were proposed to reveal the differences in signal characteristics generated by different kinds of rock, where Fast Fourier Transform (FFT) and VMD are used to distinguish the vibration signal. The frequency spectral structure of red sandstone, granite, and limestone are mainly distributed in the range of 0–500, 0–700, and 0–700 Hz, respectively. The central frequency of vibration energy distribution of red sandstone, granite, and limestone is 283.88, 478.14, and 567.36 Hz, respectively. The central frequency of vibration energy distribution for cutters can be regarded as an important distinguishable features of rock types, which may be promising for lithological recognition during TBM construction. It can provide accurate geology information for TBM worker to adjust the tunneling parameters promptly, making contribution for TBM efficient tunneling and reliable service.
Introduction
As a kind of large tunnel boring equipment integrating optical, mechanical, electrical, hydraulic, sensing, and information technology, Tunnel Boring Machine (TBM) is widely used in underground engineering.1,2 During the TBM tunneling process, the cutters, which are essential cutting tools, bear strong force while cutting rocks continuously.3–5 The drastic change of force that comes from the direct interaction between the cutter and the rock makes the cutter vibrate. Therefore, different geological conditions and cutting parameters inevitably have an effect on the vibration signal by influencing the force variation. Considering the clear characteristics and fast response speed of the vibration signal, it is of great significance to study the vibration characteristics of the cutter under different rock types and cutting parameters, which can help to grasp the current cutting conditions and adjust the tunneling parameters in time to improve the tunneling efficiency and service life of cutters.
At present, the cutter of TBM research mainly focuses on the force and wear characteristics. Ning et al. 6 studied the effect of different blade widths of the cutter on the force and the rock-breaking quantity, and proposed the matching law between different blade widths and different rocks environments. Zhang et al. 7 used high-pressure water jets to assist rock-breaking and achieved a significant reduction in the vertical force of the cutter. Barzegari et al. 8 proposed a new cutter wear prediction model by comparing actual wear conditions with field data gathered during TBM boring. Agrawal et al. 9 proposed the minimum wear structure of the cutter during cutting rocks by numerical calculation method. However, there are few studies on the vibration characteristics of the cutter in the rock-breaking process.
The vibration study of the TBM is mainly focused on dynamic modeling and vibration signal monitoring. Huo et al.10,11 and Lin et al. 12 established multi-degree-of-freedom coupled dynamics models for the cutter system and the mainframe system, respectively, to analyze vibration transmission paths and provide a theoretical basis for the optimal design of the systems. Ling et al.13,14 established a dynamic model of the cutterhead, derived an expression for the intrinsic frequency sensitivity of the cutterhead, and analyzed the effect of different cutterhead parameters on the vibration, which provides a reference for designing the cutterhead. Yang et al. 15 proposed the influence law of mixed strata composed of different rocks on the vibration of the cutterhead, which provided help for the advancing manufacture of cutterhead and cutter. Liu et al. 16 compared the vibration characteristics of cutterhead under different ground conditions and concluded that the vibration signal is highly dependent on the current ground conditions. Wu et al. 17 designed a cutterhead vibration monitoring system for TBM and investigated the effect of operation parameters and geological conditions on the vibration of the cutterhead. The above scholars have studied the vibration response of the cutter system, the cutterhead, and the mainframe from the theoretical perspective and have analyzed the vibration signals of the cutterhead in the process of engineering construction. However, the vibration signal of the cutter generated by the direct interaction of the cutter with the rock has not yet been monitored and analyzed in depth at present.
Currently, in-depth studies on the vibration signal characteristics during the excavation process are carried out in the fields of oil drilling and mining drilling. Lazarova et al.18,19 concluded that the vibration signals exhibit specific vibration patterns in the time, frequency, and time-frequency domain under constant rock-breaking condition. And the correlation between the vibration signal and the application state of the drilling rig was determined. Qin et al. 20 proposed that the vibration and acoustic signals from different rock types both showed significant differences in the frequency and time-frequency domain, which provided a good prospect for rock identification. Kumar et al. 21 developed an empirical relationship between sound level produced during drilling 14 types of rock and different rock properties (uniaxial compressive strength and Young’s modulus) considering the effects of drill bit diameter, drill bit speed, and penetration rate. It indicates that it is feasible to identify the rock through characteristic signals during rock-breaking process, which can provide reference for this study that distinguish rock types through vibration signals during cutter breaking rock process.
In this paper, the vibration signals of the cutter are analyzed in the time, frequency, and time-frequency domain, where the vibration signals are collected from rock-cutting experiments. The vibration signal characteristics of cutting different rock types are extracted from the energy distribution and frequency spectral structure perspective. The results of the study help engineers better understand the causes of vibration in the cutter cutting process and the characteristics of vibration signals when cutting different rock types, which provide a reference for rock identification using vibration signals. And TBM workers can promptly adjust the tunneling parameters to match the geology according to the accurate rock identification information. It can provide basis for improve the TBM construction efficiency and service performance.
Methodology
Experimental design
Experiment devices
The rock-cutting experiments were carried out using the full-scale linear cutting machine in the shield laboratory of Central South University (CSU), as shown in Figure 1. The cutting machine includes mechanical systems, driving systems, and control systems. The cutter is fixed to the cutter housing by the wedge. The cutter housing is connected to the movable beam through a transition device on the test bench. The movable beam can be moved up and down by a vertical hydraulic cylinder. The sample box is used to hold the rock, which is fastened in the traversing platform. Horizontal hydraulic cylinders control the longitudinal and lateral movement of the traversing platform. The loading capacity of the hydraulic cylinder is 600 kN in the vertical direction, 450 kN in the longitudinal direction, and 70 kN in the lateral direction.

Full-scale linear cutting machine.
The cutter shaft is connected to the cutter housing through the bolt. During the rock breaking process, the cutter ring rolls and contact with the rock continuously, which is difficult to detect the vibration signal of the cutter ring. Therefore, the cutter shaft is the nearest position where vibration signals can be detected accurately. In addition, as the internal structure of the cutter is mostly rigid contact connection, the vibration signal of the cutter shaft can be approximately equal to the vibration of the cutter. In order to obtain the vibration signals during the rock breaking, the vibration sensors are used to measure the vertical, lateral, and longitudinal vibration of the cutter housing and the vertical and lateral vibration of the cutter shaft, where the vertical direction is the same with the cutter penetrating into the rock direction, lateral direction is consistent with the cutter shaft axis, and longitudinal direction is the direction of cutter forward.
The sensors are general-purpose piezoelectric acceleration sensors with a range of 0–50 g. The sampling frequency is set to 5000 Hz during the experiment, guaranteeing the effectiveness of the collected signals (Figure 2).

Vibration sensor arrangement.
Rock samples
The 17 inches cutter which is common in TBM is used in the experiments, as shown in Figure 3. The diameter of the cutter is 432 mm, and the edge width of the cutter is 11.97 mm.

Used cutter in the test.
The red sandstone, granite, and limestone are used as rock samples in the experiments. Due to the size of the sample box, the horizontal trip limit of the traversing platform and the vertical trip limit of the movable frame, the rectangular rock specimen with dimension of 900 × 380 × 280 mm has been adopted. The rock specimen was fixed in the sample box by bolts. And the mechanical properties of the three rock types are shown in Table 1.
Mechanical properties of different rocks.

Experiment scheme
The cutter is installed on the cutterhead. Under the rotation and advancing action of the cutterhead, all cutters squeeze and break the rock simultaneously, forming multiple concentric grooves in the tunnel face. With the penetration of the cutter continuously increase, the cracks of adjacent cutter expand until connected, and forming large rock fragments to complete the tunnel face excavation. The cutter spacing is the installation radius difference between adjacent cutters. As for the rock-breaking experiment, one cutter cut the rock sample in a straight line firstly, and then the cutter cut another path with a certain distance from previous cutting path, to simulate the cutting process of the adjacent cutter on the cutterhead. And the distance between two path is the cutter spacing. As rock type, penetration and cutter spacing are important factors affecting the rock fragmentation and the vibration of the cutter system, the paper focus on distinguishing the rock types through the spectral structure and energy of cutter’s vibration signals during rock-breaking process. And, the more combined parameters of rock type, penetration and cutter spacing are used in the rock-breaking tests, the higher reliability of the research can be. In addition, the permitted range of the penetration and cutter spacing when breaking different rock depends on the breaking characteristics and difficulty of cutter breaking the rock. As for red sandstone with lower strength, the penetrations are set as 6, 8, and 10 mm, which is usually large in the actual excavation process. While the penetrations of granite are set as 2, 3, and 4 mm, where the strength of granite is high. The limestone strength is between granite and red sandstone, so the penetrations are set at 2, 3, 4, and 5 mm. The cutter spacing set in the experiment is expanded on the basis of the cutter spacing used in actual engineering. In order to explore the effect of different combinations of cutter spacing and penetration on the vibration signal, the experiment scheme is determined as shown in Table 2. And the cutting speed are kept constant and set to 30 mm/s in the experiment.
Experiment scheme of rock breaking by cutter.
Vibration signal processing method
To extract the vibration signal characteristics during the rock-breaking process, the variable modal decomposition method is introduced. Variational modal decomposition (VMD) is a novel signal variational decomposition method proposed by Dragomiretskiy and Zosso, 22 which is widely used in signal processing, fault diagnosis, and other fields.23–25 The input signal is decomposed into k sub-signals with different center frequencies and finite bandwidth. The VMD decomposed sub-signals are called the intrinsic mode function (IMF), and the sub-signals are sparse and quasi-orthogonal.
The VMD can be viewed as a constrained variational problem with the mathematical model expression:

Where
The constrained variational problem is transformed into an unconstrained variational problem by introducing a quadratic penalty term α and a Lagrangian operator

The alternating direction multiplier method (ADMM) is used to solve for the saddle point of equation (2). The optimal solution of the variational model is obtained by continuously updating the modal component


In each iteration, the central frequency is fixed first to optimize the modal component of the IMF. And then, the model component of the IMF is fixed to optimize the central frequency. The iterate process continuously in this way until convergence. The optimal IMF are finally obtained, where the final modal component and central frequency of IMF represents the major component in the original signal:

In summary, the vibration signal analysis workflow during cutting different rocks is shown in Figure 4. It includes two parts. Firstly, a series of rock-cutting experiments have been conducted where cutting parameters and rock types are taken into consideration. Then, the vibration signals collected in the experiments have been analyzed in the time, frequency, and time-frequency domain. In the time domain, the relationship between force and vibration in the rock-breaking process is clarified. By comparing the vibration signals under different cutting parameters, the time-domain characteristics of the vibration signal are proposed. In the frequency domain, the frequency characteristics of the vibration signal at different penetration, cutter spacing, and rock types are analyzed by Fourier transform. In the time-frequency domain, the energy distribution characteristics of the vibration signal after VMD are extracted.

Vibration signal analysis workflow during cutting different rocks.
Experimental results analysis
Time domain
During the rock-breaking process, the cutter is subjected to fluctuating and violent force in the vertical direction. The cutter shaft is connected to the cutter body, and the vibration is transmitted first from the cutter ring to the cutter shaft. So, the vibration signal of the cutter shaft is more directly responsive to the signal changes in the process of rock breaking compared to the vibration signal of the cutter housing. During the rock breaking process, the cutter ring rolls and contact with the rock continuously, which is difficult to detect the vibration signal of the cutter ring. Therefore, the cutter shaft is the nearest position where vibration signals can be detected accurately. In addition, the vertical vibration generated during the step rock-breaking process is most obvious. Therefore, the vertical signal of the cutter shaft is the greatest and the best parameter reflecting the rock breaking performance and the influence law. The vibration signal in the vertical direction of the cutter shaft is selected for subsequent analysis.
Comparative analysis of rock-breaking force and vibration
The relationship between the force and vibration signal in the process of cutting different rocks is similar. The force and vibration signal in the process of cutting limestone is analyzed as an example, which is shown in Figure 5, where the vibration data is monitored from the cutter shaft in the vertical direction. And the force in the vertical direction is detected through the three-directional force sensor installed at the full-scale linear cutting machine. When there is a step change in the force, the vibration signal at the cutter shaft shows a significant amplitude, and the obvious rock chips can be observed on the rock surface at the same time. The vibration and force in the period of 0–10 s are further analyzed. Divide the period into two parts: period 1 (2.1–6.3 s) and period 2 (6.8–10 s). In period 1, the force shows the small step change, the obvious vibration signal still can be generated and there are large rock chips on the side of the cutting trajectory. In period 2, the force change is relatively smooth, and the vibration signal tends to stabilize, which is as ∼0 m/s2, and small rock chips are observed on both sides of the cutting trajectory. During cutter breaking rock process, the interaction between cutter and rock is dynamically change, and complex changes occur inside the rock in a short period of time. Firstly, the cutter rolling the rock, causing elastic deformation and formed dense core. Then, cracks emerge inside the rock and continuously expand until fragment formed. While the vertical load of cutter presents a trend of gradually increasing first and then decreasing with obvious step characteristics.

Force and vibration signal during the process of rock-breaking.
From this phenomenon, it can be concluded that the vibration signal is sensitive to the force fluctuation in the rock-breaking process. Even little force variation can lead to a significant distinction of cutter vibration in different periods. Moreover, compared to the force of breaking rock, the changes in vibration signal are more obvious and faster when the rock undergoes breaking. It can be seen that the amplitude and variation characteristics of the vibration acceleration is not only related to the variation law of the cutter’s load, but also closely related to the rock fragmentation situation during rock-breaking process.
Vibration law under different cutting parameters
The root-mean-square (RMS) of vibration acceleration is used as an index to measure the vibration intensity of cutter shaft in the vertical direction for different cutting parameters. The formula for the RMS is shown in equation (7):

where n denotes the number of sampling points and x i denotes the acceleration value of the ith sampling point.
The change law of RMS under different cutting parameters is shown in Figure 6. From a general point of view, the RMS shows an increasing trend with increasing penetration at the same cutter spacing. As the penetration increases, the rock is subjected to more intense compression, which causes the rock to release powerful internally accumulated energy as it breaks up, leading to an increase in vibration of cutter. However, at individual penetrations, it doesn’t show the law that the larger penetration, the larger RMS. For example, when cutting granite with a cutter spacing of 40 mm, the RMS is 3.6 m/s2 for the penetration of 3 mm and 2.2 m/s2 for the penetration of 4 mm. When the cutter cuts the rock with the penetration of 3 mm, the vibration intensity is higher than that of the penetration of 4 mm.

Variation law of RMS of cutting different rocks under different cutting parameters: (a) red sandstone, (b) granite, and (c) limestone.
From the analysis of the influence law of the cutter spacing on RMS in Figure 6, when cutter cutting the red sandstone, where the penetration is fixed at 6, 8, and 10 mm, respectively, the variation laws of RMS with cutter spacing increase are totally different. When the cutter cuts granite, the RMS almost unchanged with the increase of the cutter spacing with 2 mm penetration. The RMS shows differences without obvious change rule under different cutter spacing when the penetration is 3 and 4 mm. Similarly, when the cutter cuts limestone, as the cutter spacing increases, there is no obvious variation rules of RMS. Therefore, the regularity of the RMS variation with cutter spacing is not apparent when cutting different rock types. The reason for this phenomenon is that the vibration signal in the vertical direction of the cutter shaft is adopted in the paper. While the cutter spacing mainly affects the changes of rock-breaking process between adjacent cutters in the lateral direction. Therefore, the cutter spacing has less effect on the vertical vibration signal.
This phenomenon occurs because the vibration signal during rock breaking is not only affected by the penetration and cutter spacing, but also by the rock integrity and rock anisotropy. Due to repetitive cutting in the rock-cutting experiment, significant damage to the rock cutting surface occurs and the integrity of the rock gradually decreases, which weakens the cutter vibration to a certain extent. 26 Moreover, it can be found from the broken rock surface in Figure 5 that the rock breaking is discontinuous throughout the cutting process. This phenomenon suggests that there are some differences in the properties of the rock at different locations. The rock anisotropy significantly affects the fluctuation of the force, which effect on the calculation results of the RMS of vibration acceleration during the whole cutting process. As a result, the RMS of vibration acceleration doesn’t show an obvious change rule with the change of cutting parameters. At the same time, it also proved that the vibration signal is closely related to the properties of the rock itself.
Frequency domain
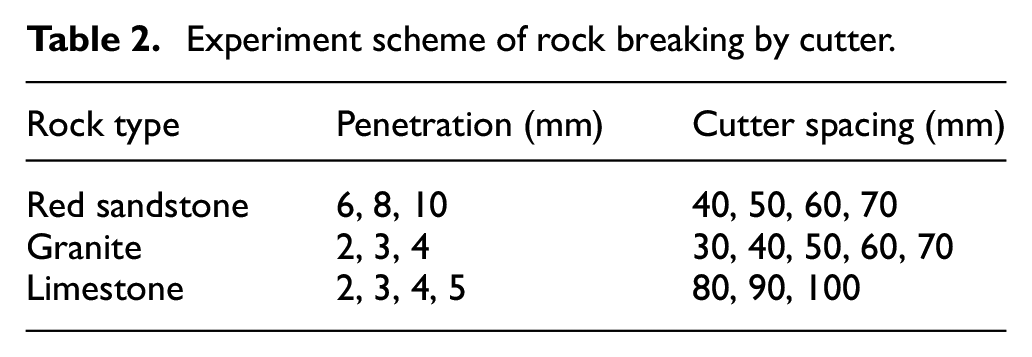
In order to study the frequency domain characteristics of the vibration signal of cutting different rocks, the waterfall plot of the vibration signal frequency spectrum is shown in Figures 7 to 9, where “p” represents the penetration of the cutter, and “s” represents the cutter spacing.

Frequency spectrum when cutting red sandstone under different conditions: (a) penetration and (b) cutter spacing.
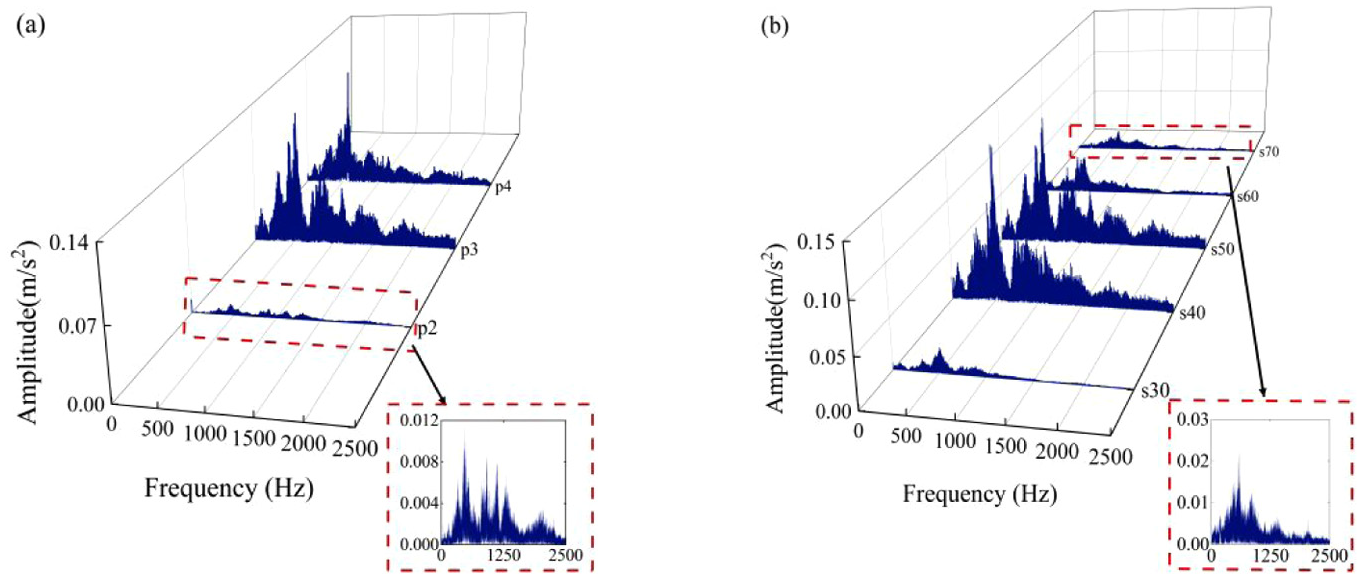
Frequency spectrum when cutting granite under different conditions: (a) penetration and (b) cutter spacing.
Frequency spectrum when cutting limestone under different conditions: (a) penetration and (b) cutter spacing.
The frequency spectrum of vibration signals when cutting red sandstone under different penetration and cutter spacing is shown in Figure 7. In the range of 0–500 Hz, there are double peaks with large amplitude, which are considered the main peaks in the frequency spectrum. In the range of 500–1000 Hz, the frequency spectrum shows a single peak, and the peak amplitude is significantly smaller than the amplitude of main peaks. In the range of 1000–2500 Hz, there is a wide band in the frequency spectrum, and the amplitude tends to be 0. The frequency spectrum of vibration signal when cutting granite is shown in Figure 8. In the range of 0–700 Hz, the frequency spectrum shows a single main peak. Compared with red sandstone and limestone frequency spectrum, the main peaks of granite span more widely. The frequency composition is relatively rich in the range of 700–2500 Hz, and the overall amplitude of the spectrum gradually decreases in this section. The frequency spectrum of the vibration signal when cutting limestone is shown in Figure 9. It can obtain that the limestone frequency spectrum is mainly distributed within 0–700 Hz, which shows three main peaks in this frequency band. There is a wide band with a slowly decreasing amplitude in the range of 700–1500 Hz, while the frequency amplitude decreases rapidly when the frequency exceeds 1500 Hz.
Based on frequency spectrum analysis results, the frequency distribution and number of main peaks remain basically the same under different penetration and cutter spacing. It indicates that the cutter spacing and penetration are not the main factors affecting the frequency spectral structure of the vibration signal. Moreover, the frequency spectral structure of vibration signal during cutting various rocks shows obvious differences. It can be inferred that the frequency spectral structure is highly correlated with the rock types. Comprehensive analysis of the above, the frequency spectral structure of the vibration signal can be used as a distinguishable feature of different rock types.
Time-frequency domain
The frequency domain analysis of the vibration signals reveals that the frequency spectral structure is highly influenced by the rock types, which provides a new direction for analyzing the characteristics of different rock types using the vibration signal. However, there is an obvious span of the main peaks and the complex frequency composition in the frequency spectrum, so it is obviously not accurate enough to determine the locations of the main peaks using the maximum value of the peaks. And there is no uniform, clear demarcation line between neighboring main peaks, making it difficult to delineate the range artificially to separate the different main peaks from the spectrum. Therefore, the vibration signals are decomposed by the VMD method to obtain the IMF in different frequency bands, which helps to deeply analyze the vibration signal characteristics of cutting different rock types.
Optimization method of VMD parameters based on correlation coefficient and WOA
When using VMD for signal processing, the modal number k and the penalty factor α need to be determined in advance, which influences the effectiveness of the signal decomposition. Therefore, finding the optimal modal number k and penalty factor α that match the signal to be analyzed is the key to VMD.
From the perspective of signal correlation, the objective function adapted to the optimization of VMD parameters for the rock-breaking vibration signals is proposed. Considering the similarity between the sum of the IMF and the original signal, the overall correlation coefficient

where,
Due to the unreasonable selection of the VMD parameter, there is often generating a serious modal mixing phenomenon between adjacent decomposed signals. Countering the phenomenon, the local correlation coefficient

Where,
Considering the

For this optimization problem, this paper uses the whale optimization algorithm (WOA) based on the whale bubble net attack strategy to achieve the best parameter matching for the VMD, which can effectively avoid falling into the local minimal value trap and has excellent global search capability. 27 The process of rock-breaking vibration signal is shown in Figure 10.

VMD process of rock-breaking vibration signal.
VMD decomposition results
In the process of decomposing the vibration signal, the modal number k is set in the range of (2, 10), and the penalty factor α is set in the range of (1000, 5000). In the signal processing, the optimization results of the modal number k and penalty factor α are not exactly the same for each signal generated by cutting the same type of rock. In order to unify the VMD results, the VMD parameters are optimized by using the whole signal composed of multiple signals of cutting the same rock. The processing method is adopted because the frequency spectrum of the vibration signal in the process of cutting the same rock has similarity, and the purpose of VMD is the decomposition of the original signal into multiple sub-signals with different frequency band. The optimization process of signal parameters for red sandstone, granite, and limestone based on correlation coefficient and WOA is shown in Figure 11.

Vibration signal parameter optimization process.
The results of VMD parameter optimization for different rock types are shown in Table 3, where the moisture and temperature keep the same during rock-breaking process. And environmental variability was excluded as a factor in this study.
Parameters of VMD for different type of rock.

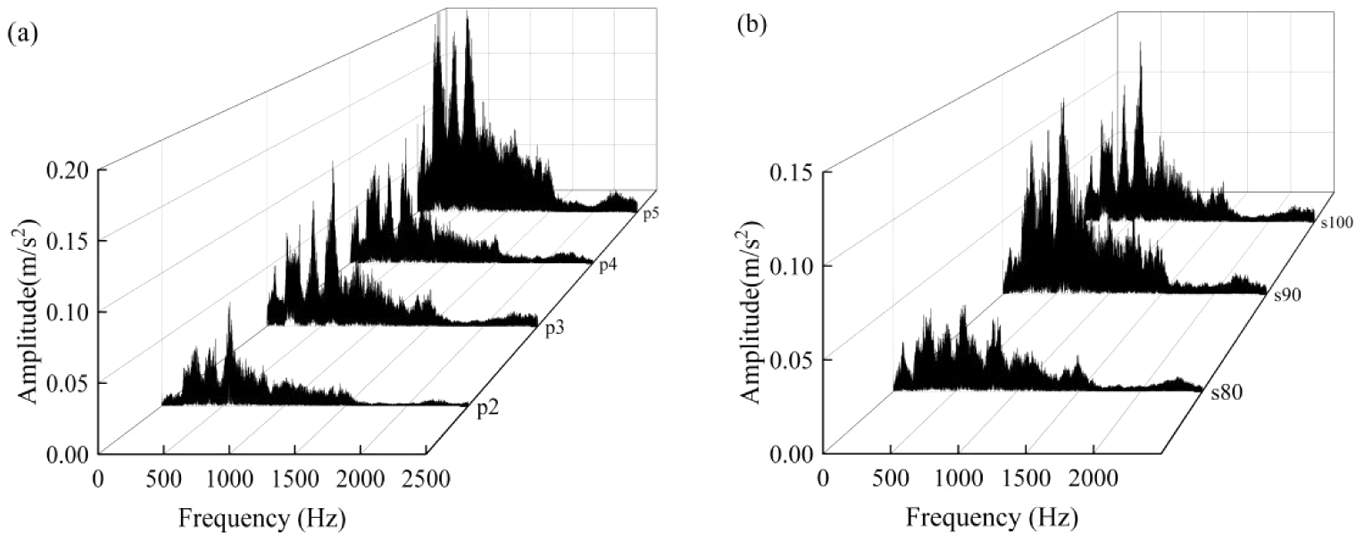
According to the VMD parameters in Table 3, the decomposition of the vibration signal is carried out. The decomposition results are shown in Figures 12 to 14. The results show that the method using a combination of WOA and VMD is able to adaptively determine the decomposition parameters of the input signal. The method breaks down the original vibration signal into IMF ranging in frequency from high to low. In this way, each IMF has a different center frequency, which achieves a good separation of the main peaks in frequency spectrum.
Results of vibration signals decomposition of red sandstone: (a) IMF and (b) frequency spectrum of IMF.
Results of vibration signals decomposition of granite: (a) IMF and (b) frequency spectrum of IMF.

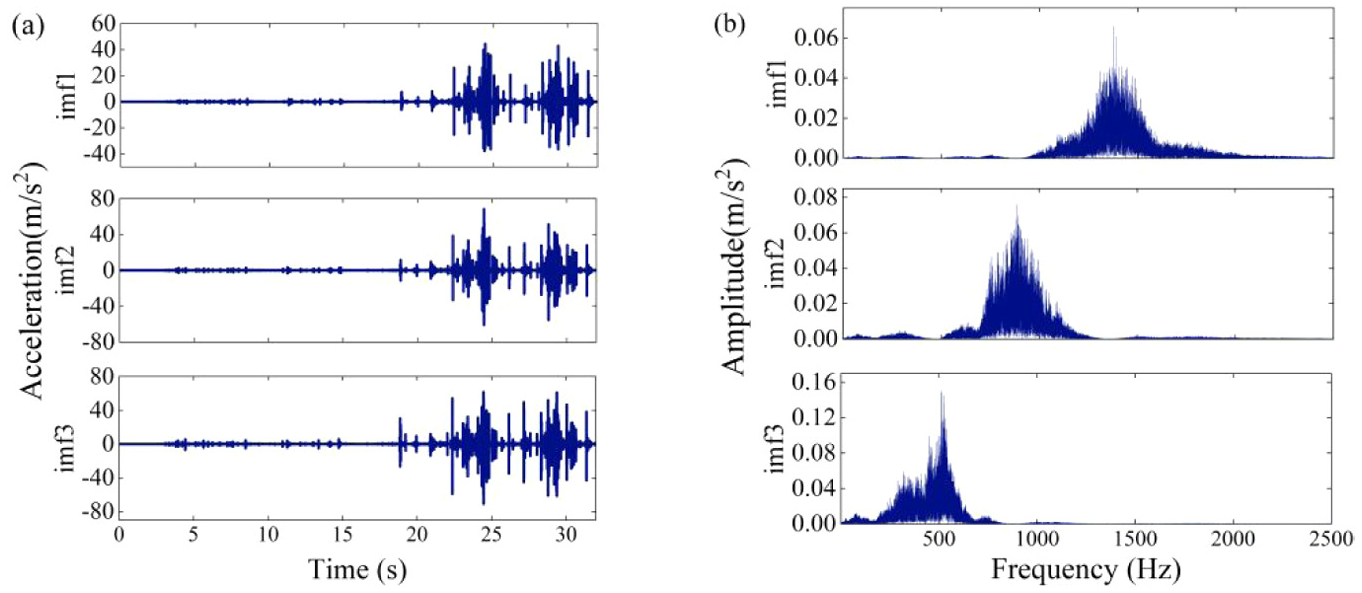
Results of vibration signals decomposition of limestone: (a) IMF and (b) frequency spectrum of IMF.
Rock feature extraction based on energy ratio
Based on the above signal processing method, the center frequency of the IMF frequency spectrum and IMF energy ratio are proposed to express the vibration characteristics of cutting different rock types. The energy expression of each IMF is given:

Where
The expression of the energy ratio of the IMF is shown:

Where
The variation curve of energy ratio with the center frequency of the IMF is shown in Figure 15.

Variation of energy ratio of cutting: (a) red sandstone, (b) granite, and (c) limestone.
From the analysis of Figure 15, the IMF numbers of the vibration signal generated by cutting granite are the least, and the energy distribution is most concentrated because there is only a single main peak in the frequency spectrum. The vibration signals of cutting red sandstone and limestone have more complex frequency spectral structures and present multiple main peaks, which make more IMF numbers and more dispersed energy distribution. The mean value of the maximum energy ratio of red sandstone and limestone is 0.3313 and 0.2783, respectively. Compared to the energy ratio of cutting red sandstone and limestone, the variation range of center frequency of red sandstone is smaller than limestone.
Further analysis of the energy distribution shows that the energy of the vibration signal generated by cutting rocks is concentrated on the specific IMF. The vibration signal energy of cutting red sandstone, granite, and limestone is concentrated on the different IMF whose center frequency is 283.88, 478.14, and 567.36 Hz, respectively. Characterizing the energy concentration locations of vibration signal by the center frequency of the specific IMF, it can be found that the energy concentration locations of the vibration signal generated by cutting various rock types are quite different and they correspond to the main peak location of the frequency spectrum in Figures 7 to 9. In addition, the energy concentration locations are almost independent of the penetration and cutter spacing, which is similar to the results of the frequency domain analysis. Comprehensive analysis of the above, the energy concentration location of the vibration signal can be used as a distinguishable feature of different rock types.
Discussion
Based on the results of the time-domain analysis, the vibration intensity is affected by the cutting parameters, rock types, rock integrity, and anisotropy. It is difficult to identify the influence factors when the vibration signals in the time domain have a significant change during the cutting process. Therefore, it cannot distinguish between different rock types by the vibration signals in the time domain. The analysis of vibration signal during cutter-breaking-rock process only focused on the vibration signal transmission law in the cutter system through establishing the dynamic model of cutter system. There is no clear theory to explain the frequency domain and time-frequency domain characteristics of the vibration signals during cutter breaking different rocks.10,11,14,28 The research in the field of drilling suggests that the grain size, porosity percentage, compressive strength, and tensile strength of the rock all affect the frequency domain and time-frequency domain characteristics of the vibration signal. 29 However, at present, it is difficult to conduct a comprehensive test of rock material parameters due to the limitations of test equipment as well as the limitations of test materials. Therefore, this also serves as the focus of the subsequent research to obtain the complete rock parameters through testing methods, and to analyze the relationship between the rock parameters and the spectral structure as well as the central frequency of the energy concentration, in order to further explain the fundamental reasons of the frequency domain and time-frequency domain characteristics of the vibration signals generated in the rock-breaking process.
At present, many scholars often use excavation data such as cutterhead torque, cutterhead rotational speed, the pressure of control pump, and other indicators to predict real-time rock mass information, which is important for the efficient tunneling of TBM, construction safety, and extending the service life of the cutter.30–32 Based on the results of this paper, the frequency spectral structure and the energy concentration location of the vibration signal are used as new indicators to further supplement the rock identification system, which provides a new perspective on the assessment of TBM working conditions and contributes to making a more accurate prediction of rock mass information. Moreover, although the cutter spacing designed in different cutterhead may not be the same and the penetration is also not constant in different working conditions of TBM, the frequency spectral structure and energy distribution of the vibration signal are little affected by the cutter spacing and penetration. Therefore, when the frequency spectral structure and the energy concentration location are used as indicators for rock identification, they are less disturbed by different types of cutterhead and changes of penetration in TBM working, which makes these indicators have adaptability in the actual project. Combining the vibration signal characteristics, the results show the feasibility of using vibration signals in the frequency and time-frequency domain for rock identification. Then, TBM construction workers can promptly adjust the tunneling parameters to match the current tunneling geology through accurate rock type identification information. It can provide basis for improve the TBM construction efficiency and service performance.
Conclusion
In this paper, rock-cutting experiments under different rock types and cutting parameters are conducted using the full-scale linear cutting machine in the shield laboratory of CSU. During the cutter-cutting rock process, the vibration signals in the time, frequency, and time-frequency domain are analyzed. The specific conclusions of this paper are as follows.
The vibration signal in the time domain is influenced by cutter parameter as well as rock property and sensitive to force fluctuation, which makes it difficult to predict the change of vibration signal in different penetration and cutter spacing. Under the same cutter spacing, the RMS shows increase trend with the increase of penetration. While the vibration law of the RMS with the cutter spacing is not obvious. However, the variation range of RMS is relatively large when cutting different types rock. The RMS variation range during cutting red sandstone, granite, and limestone is 0.23–1.48, 0.17–3.60, and 1.71–5.09. Rock type is a more sensitive factor affecting the vibration in time-domain compared with cutter spacing and penetration.
Frequency spectral structures have obvious differences in different rock types. The frequency spectrum of red sandstone is mainly distributed in the range of 0–500 Hz with double main peaks. The frequency spectrum of granite is mainly distributed in the range of 0–700 Hz with a single main peak. The frequency spectrum of limestone is mainly distributed in the range of 0–700 Hz with three main peaks.
The vibration signals are specifically analyzed from the perspective of energy distribution. The results show that the energy distribution of vibration signal during cutting different rocks also showed significant differences. The vibration signal energies are concentrated on the specific IMF centered around the frequency of 283.88, 478.14, and 567.36 Hz, respectively when cutting red sandstone, granite, and limestone.
The frequency spectral structure and the energy distribution of vibration signals are sensitive to the change of rock types and not interfered by cutting parameters, which can be used as distinguishable features of different rock types. This makes it possible to utilize vibration signals for rock identification during the TBM working process.
In the future study, cutter breaking rock experiment should be conducted for one type of rock with different comprehensive strength and tensile strength. And the correlation between the vibration characteristic during rock breaking process and comprehensive strength and tensile strength of the rock should be systematic investigated. In addition, the vibration signals in other directions will be compared and analyzed in the subsequent research.
Footnotes
Handling Editor: Danial Jahed Armaghani
Funding
The author(s) disclosed receipt of the following financial support for the research, authorship, and/or publication of this article: The author(s) disclosed receipt of the following financial support for the research, authorship, and/no publication of this article: This work was supported by the Natural Science Foundation of Hunan Province (2023JJ40757), the China Postdoctoral Science Foundation (2022TQ0378), Fundamental Research Funds for the Central Universities of Central South University (2022ZZTS0214), and Postgraduate Scientific Research Innovation Project of Hunan Province (CX20220299).
Declaration of conflicting interests
The author(s) declared no potential conflicts of interest with respect to the research, authorship, and/or publication of this article.